Abstract
The dynamic behaviour of membranes has been widely studied by well-known authors for a long time. A clear distinction can be made between the behaviour of membranes without tension (plate case) and membranes subjected to large tension or pre-strain in their plane (membrane case). In classical theories, less attention has been paid to membranes subjected to a low level of tension, which solution is between both extreme cases. Recently, certain fields of research are demanding solutions for this intermediate behaviour. It is the case of membranes present in MEMS and sensor or the response of the tympanic membrane in mammals hearing system. In this paper, the behaviour of plates and circular membranes with boundary conditions clamped in the edges has been studied. The natural frequencies for both cases (plate and membrane) have been calculated using the solutions of the traditional theories and these have been compared with the numerical frequencies calculated by finite element analysis. The dynamic response of membrane with low tension, corresponding to a transition between these extreme behaviours, has also been calculated. A theoretical solution has been used complemented with a wide set of numerical finite elements calculations. The analytical and numerical solutions are very close, being the error made using both methods very low; nevertheless, there are no analytical solutions for the entire transition zone between the plate and membrane behaviour. Therefore, this range has been completed using finite element analysis. Broad ranges of geometric configurations have been studied. The transition behaviour of the membrane has been clearly identified. The main practical consequences of these results have been discussed, in particular focused on the response of the tympanic membrane.
1. Introduction
The dynamic response of a membrane has been studied since a long time ago. There exist two classic solutions for two extreme situations, one for the case where the membrane is not subjected to internal loads (considered in this case as plate) and the other one when it is under tension (considered as membrane) [1,2]. Both solutions have proven useful to study a plate and to study a membrane subjected to loads.
Many authors have studied and published on this topic. These studies have included different cases of plates and membranes. Rayleigh [1] and Timoshenko [2] have studied vibration of plates and membranes with different shapes; Timoshenko [2] included in their study the energy method for solving the different cases. Leissa [3] compiled the studies and publications on vibration of plate in 1969. The first studies on vibrations of circular plates are attributed to Poisson [4] and Kirchhoff [5]. Subsequently, other authors have contributed to investigate and publish on this topic. Airey [6], Itao and Crandall [7] and Amabili et al. [8] published studies about free-edge plates; Airey [6] also studied the case of clamped membranes and Amabili et al. [8] studied the circular plates vibrating in vacuum and in contact with liquid. Other authors have studied the natural frequencies of circular plates simply supported [9], with elastic edge supports [10] or with non-uniform edge constrains [11]. In the latter case are included the publications of Narita and Leissa [12,13], Amabili et al. [14] or Eastep and Hemming [15]. Others papers research the vibration of circular plates in contact with water [16] or with fluid [17]. It can be concluded that both extreme situations of plate and membrane behaviour are widely covered in the literature.
Lesser attention has been paid to the case where the membrane is subjected to a slight level of tension. In these cases, intermediate behaviour is expected between membrane and plate. One of the reasons of the absence of studies in this line is that most of the real situations presented in engineering regarding membrane behaviour responded to one of those extremes. Nevertheless, there are situations under study today that may respond to this intermediate situation.
Vibration analysis is important in the study of musical instruments [18,19,20,21] and specifically the case of membrane subjected to tension is important in the study of percussion musical instruments since the component which produce the desired sound it is a material of small thickness subjected to stress [22]. Recently, the use of membrane in microelectronics has made this issue a key point. Small membranes are used in different applications (e.g. as sensor or part of MEMS) which during manufacturing acquire certain level of tension that deviates their expected behaviour form [23,24,25,26,27].
Another field of study where this effect is manifest is the study of the mechanics of hearing. Based on different experimental studies [28] and simulation of the human hearing system [29] it has been observed that small levels of pre-strain in the system, particularly in the tympanic membrane, causes significant changes in the response. This issue is of great interest for our research group.
As the hypothesis origin of this study, we consider that the deviations between expected and tested behaviours may be related the assumption of ideal membrane or plate behaviours in these problems. We have not found a consistent literature that helps us evaluate the influence of the tension level of a membrane with its actual behaviour. There are analytical solutions [30] that developed this question for some regular membrane shapes and some specific situations. The main aim of this work is to approach the study of the influence of pre-strain membranes based on parameters such as its geometric dimensions, type of material and internal stress level.
In the present paper, we have conducted a numerical study to evaluate the influence of the level of pre-strain in the circular membrane dynamic response. The election of a circular shape allows us to compare numerical solutions with analytic ones of existing literature. Once we develop our own methodology to stablish the pre-strain limits to accept a membrane, plate or intermediate behaviour, we will be able to translate this work to complex geometries and biomedical or industrial specific applications.
The results obtained has been based in finite element (FE) simulations of modal analyses. Initially a reference problem has been studied (a 1 m diameter steel membrane with different thicknesses) where the limits of both theories are identified for different geometric ratios (thickness-diameter ratio). Finally, the study has been repeated with a more realistic case, closer to our research field, with a smaller and thin membrane with the properties similar to the human tympanic membrane.
The paper is structured according to the following sections. In the next one, the main theories will be briefly outlined. The FE numerical methodology is described in the following section. Result obtained with the reference membrane are then presented and the influence of thickness evaluated. Finally, this study is complemented with the analysis of a membrane similar to the tympanic membrane. In the last section, the main conclusions are outlined.
2. Reference Theory
There are two classic theories that describe the behaviour of thin thickness parts, behaviour as a plate or as a membrane. The natural frequencies in a dynamic study can be obtained with the analytic equations worked out by the different authors that studied these theories [1,2,31].
Among other considerations, the solution depends on the shape and the boundary conditions of the plate or membrane. In this paper, the theoretical study is focused on circular shapes and boundary conditions clamped in the edges (Figure 1).
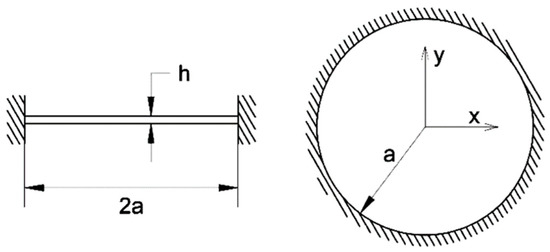
Figure 1.
Clamped circular plate or membrane.
Plate solutions are based on the stiffness provided by bending behaviour. For the circular clamped plate case, the natural frequencies can be determined by the Equation (1) [2]:
in which f is the natural frequency to be calculated, a is de radio of the boundary, γh/g=ρh is the mass per unit area, D = Eh3/12(1-υ2) is the flexural rigidity of the plate and α is a constant that depends on the number of nodal diameters n and the number of nodal circles s. The values of α constant are given in [3].
The α constants are the squares of the eigenvalues of the equation that must be satisfied for the particular problem of a clamped circular plate. This solution depends on Bessel functions and modified Bessel functions of the first kind. Figure 2 presents the first nine vibration modes of this problem of plate and their correspondence with the values of n and s.
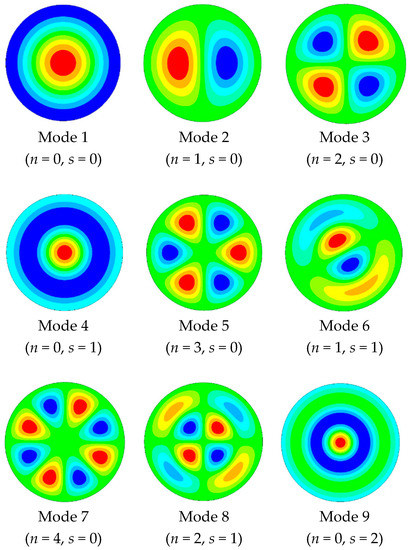
Figure 2.
Modal shapes of the first nine vibration modes.
On the other hand, when the membrane is too thin to provide bending stiffness, the stiffness is obtained applying an internal tension. That is the base for the membrane solution. In particular, the solution for the circular clamped membrane case, the equation to obtain the vibration modes is the Equation (2) [2]:
in which g is the acceleration of gravity, S is the uniform tension per unit length of the boundary and w = ρgh is the weight of the membrane per unit area. α constants are the eigenvalues of the equation that must be satisfied for the particular problem of a membrane and which depends on Bessel functions of the first kind. The values of α constant for this case are given in [1].
As most practical problem laid on one of the previous formulations, and due to the complexity of the analytical solution, lesser attention has been paid to the problem where the membrane stiffness is provided by a combination of an internal tension and bending stiffness.
The problem of circular plates with a large initial tension or compression and simply supported or clamped edges case was studied by Wah [30]. This author, based on the basic equation used in Poisson-Kirchhoff theory, developed an expression to get the natural frequency for this case:
In this expression, T is the uniform tension per unit length of the boundary, denoted by S in Equation (2), and α is a constant that depends on n and s as in previous cases, and on the non-dimensional parameter ϕ. The values of this parameter are given in [30].
In this case, the α constants are the eigenvalues of the equation that must be satisfied for the particular problem of the circular clamped plates with a large initial tension or compression. That equation also depends on Bessel functions and modified Bessel functions of the first kind. The parameter ϕ is calculated using the expression T/T* = ϕ, where T* = 14.68D/a2 for the clamped case.
3. Numerical Methodology: Finite Element Analysis.
The main issues regarding the Finite Element modelling methodology will be briefly described in this section. The present work is based on numerical calculations made by means of the finite element method (FEM). For the numerical analysis, ANSYS software v19 research license has been used. The methodology is applied to the previous described problem of circular membranes. The availability of some analytical formulations for the problem under study provide us the necessary validation of our model.
Once the model is validated, the parametric formulation of our programming allows to analyse features between ideal plate and membrane behaviours, filling the gap between them. In addition, it must be taken into account that the goal of this work is to extend the conclusions to other generic geometries more complex. As described in introduction section, one of the research lines that support this work is the hearing mechanics simulation. In particular, the tympanic membrane does not respond to a perfect circular membrane. It has a slight conic shape and a lack of symmetry due to the presence of other elements of the hearing system. It can also present an unknown internal tension.
In this work, circular shapes have been modelled into the program to simulate the circular membranes with boundary conditions clamped in the edges. Several radiis and thickness dimensions and two material properties have been simulated. The materials simulated are steel and eardrum equivalent material. For the case of the steel, it has been used 1 m diameter with different thicknesses: 10, 1, 0.1, 0.01 and 0.001 mm. The properties used for the steel are: density 7850 kg/m3, Poisson´s ratio 0.30 and Young´s modulus 2.1 GPa. In the case of the eardrum equivalent material, the diameter is 1 cm, thickness 0.05 mm, density 1200 kg/m3, Poisson´s ratio 0.30 and Young´s modulus 32 MPa. All simulations are under small deformations hypothesis and no plastic behaviour is necessary to be introduced in the model.
The simulations of the models in ANSYS were made in two different situations: without load, and with radial load in the plane of the membrane (i.e. with pre-strain) [28]. The pre-strain of the membrane was introduced by means of an imposed radial displacement, which produces a radial deformation and the desired axial stress in the membrane.
Figure 3 shows a scheme of the finite element simulation. It presents the circle area geometry (Figure 3b) which is meshed (Figure 3d) with a shell element (Figure 3c). The element selected is a four nodes one with six degrees of freedom at each node (translations in the x, y, and z directions, and rotations about the x, y, and z-axes) suitable for analysing thin to moderately thick shell structures (reference SHELL181 in ANSYS software). Figure 3c shows the geometry, node locations, and the element coordinate system for this element.
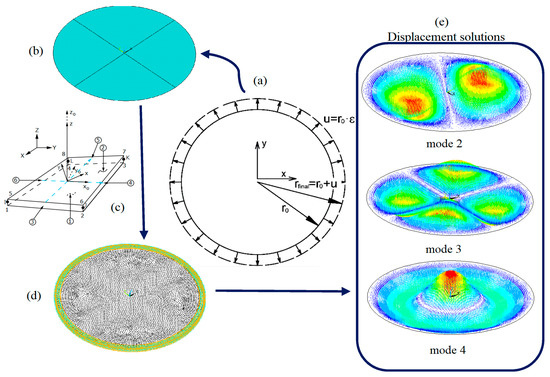
Figure 3.
Finite element modal simulation of circular membrane. (a) Scheme of pre-strain; (b) Geometry; (c) Element type; (d) Meshing; (e) Some displacement solutions: modes 2, 3 and 4.
The mesh density is stablished to minimize numerical error. The minimum element size parameter (Pmes) used is referred to the radius of the membrane. In this way, we can ensure a constant mesh density for all simulations, regardless of the size of the plate. A Pmes of 160 radius divisions was selected.
Once the model is defined, natural frequencies and mode shapes are obtained through a modal analysis routine. Figure 3e presents some displacement results obtained in modes 2, 3 and 4. The coloured areas represented the total translation displacement of each node of the model.
In cases with pre-strain, a previous static analysis was performed. To simulate pre-strain levels, 56 different values of radial strain were imposed on the perimeter of the circular membrane. These strain values are in the range of ε = 10−8 to 2 × 10⁻².
4. Reference Case Study
In this section, attention will be paid to the results corresponding to the steel membrane 1 m diameter and 1 mm thickness. The natural frequencies for the cases of plate and membrane subjected to the deformations will be calculated using the classic theory besides the results of the simulation in the ANSYS program. Relations between these different parameters will be calculated and plotted to establish the influence of the pre-strain on the behaviour of this reference case.
The analytical natural frequencies of the membrane behaviour (fANM) have been calculated with the Equation (2) besides the plate behaviour (fANP) which was calculated using the Equation (1). On the other hand, the finite elements model (FEM) frequencies have also been obtained (fFEM).
The first nine analytical natural frequencies for membrane behaviour (fANM), the simulation frequencies (fFEM) and the ratio between the analytical and simulation frequencies (fANM/fFEM) are shown in Table 1 for the selected strains: 10−7, 10−5, and 10−3. These values can be considered as low, medium and high pre-strain. It can be observed how the analytical and numerical results are closer when strain increases.

Table 1.
Ratio fANM/fFEM for first nine modes and strain selected.
The ratio fANM/fFEM for the first nine modes of the reference case (h/d = 10−3) for different levels of pre-strain have been plotted in Figure 4.
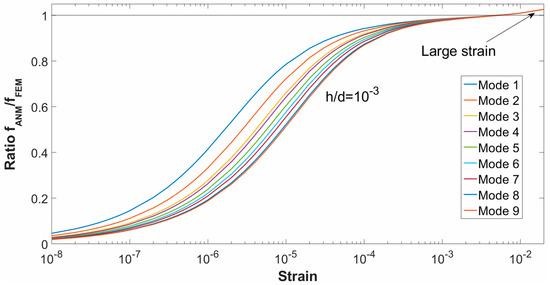
Figure 4.
Ratio fANM/fFEM as a function of strain calculated for the first nine modes.
In Figure 4 it is observed that for small values of strain, the calculated and simulated frequencies are far away, being the ratio far from 1, so the behaviour as membrane and therefore Equation (2) are not met in that range.
The ratio increases with the imposed strain until reaching the value of 1 for strains close to 10−2. For these strains, the Equation (2) and membrane behaviour are met. This result is fulfilled for the first nine vibration modes represented in Figure 4.
Table 2 shows the first nine analytical frequencies calculated with Equation (1) for the behaviour as plate (fANP), the numerical frequencies obtained with FEM (fFEM) and the ratio between both (fANP/fFEM). In this case, we have included the results obtained without strain and for the three values of strain selected: 10−7, 10−5 and 10−3.
Table 2.
Ratio fANM/fFEM for first nine modes and strain selected.
The ratio fANP/fFEM as a function of the strain for the first nine modes of the reference case has been plotted in Figure 5.
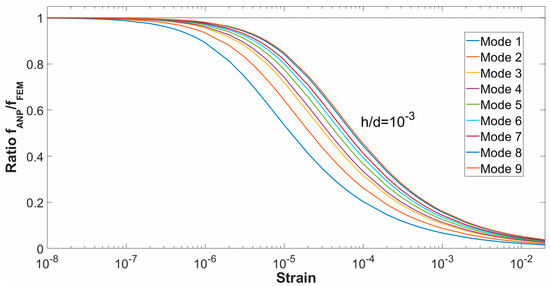
Figure 5.
Ratio fANP/fFEM as a function of the strain for the first nine modes.
Observing the graphs presented in Figure 5, in the range of low levels of strain the ratio is virtually unity, which means that for that strain range the behaviour is plate-like. Its value decreases when the strain increases, being very low with large strains. The behaviour changes to increase the imposed strain, moving away from the plate behaviour.
Figure 4 and Figure 5 are useful to identify the strain values where the solution separates from the classic solutions. It can be observed in Figure 5 how for values of strain below 10-6 the plate behaviour from Equation (1) is valid. In this zone, we can say that pure bending behaviour is dominant, and the strain is not significant. On the other side, from Figure 4 it is observed that for values of strain above 10−3, the results obtained are close to those predicted with the membrane theory Equation (2). We can say that is the zone with pure membrane behaviour where the stiffness of the plate is negligible. Among these extremes, a transition zone is observed where neither of those solutions are valid.
Another interesting parameter that can be evaluated is the ratio between the natural frequency of the modes and the frequency of the first mode (fn/f1). This has been a useful parameter to evaluate the presence of pre-strain with experimental data [28]. If the natural modes of vibration are calculated analytically by Equation (1) or Equation (2), and these are referred to the first mode dividing by its value, the results are constants that can be calculated with the relations of the α constants for plate and membrane cases respectively (Table 3).
Table 3.
Ratio fn/f1 for the first nine natural frequencies for plate and membrane case.
In order to evaluate separately the response of the first nine FEM vibration modes, the ratio fn/f1 has been plotted in Figure 6 for the calculated strain values. The same tendency is observed in all the graphs of Figure 6. For low strains, the numerical ratio tends to the ratio obtained with the plate behaviour, and for higher strains to the membrane behaviour. This is repeated in all the graphed modes, which present horizontal asymptotes in the region of lower and higher strains, whose value coincides with the relationships between the analytical frequencies of the plate and membrane cases. The transition zone is observed clearly.
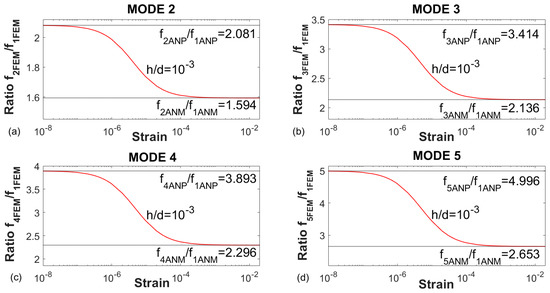
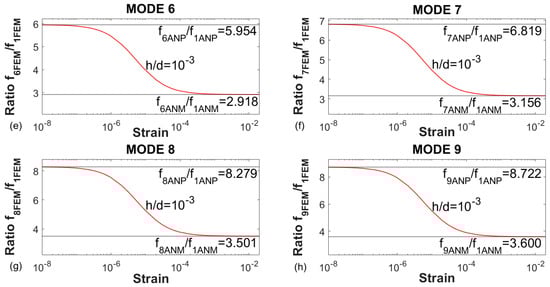
Figure 6.
Ratio fn/f1 for the natural frequencies of some modes obtained with FEM. (a) Mode 2. (b) Mode 3. (c) Mode 4. (d) Mode 5. (e) Mode 6. (f) Mode 7. (g) Mode 8. (h) Mode 9.
The response in this transition zone was studied by Wah [30]. If Equation (3) given by Wah is used to calculate the natural frequencies (fWAH), the values of Table 4 are obtained for the different strain values provided by this author. The strain values are related to the dimensionless parameter ϕ, also given in Table 4. The numerical frequencies obtained with FEM (fFEM) and the ratio between both (fWAH/fFEM) are also included in Table 4.
Table 4.
Ratio fWAH/fFEM for first nine modes and strain selected.
The dimensionless parameter ϕ is given for values of nodal diameters (n) and nodal circles (s) between 0 and 2. For modes with n and/or s greater than 2, the frequencies cannot be obtained with the values provided by Wah. Due to this, among the first nine modes the 5th and 7th cannot be calculated with the Wah equation, so their values do not appear in Table 4. Nevertheless, regardless these limitations, the comparison with these results is useful to validate our numerical results.
If the ratios fANM/fWAH and fANP/fWAH are calculated for all the strains of the Wah case, the results obtained are very similar to the ratios fANM/fFEM and fANP/fFEM. If the Wah points are plotted in Figure 4 and Figure 5, these points are superimposed with the FEM results on the corresponding graphs.
The main limitation of Wah solution is that the vibration modes can only be calculated for a short range of strain. This range does not cover the whole transition zone between the plate-to-membrane behaviour, as it is shown in Figure 7. These limitations are solved using finite element method, with which all modes of vibration and at any range of pre-strain can be calculated.
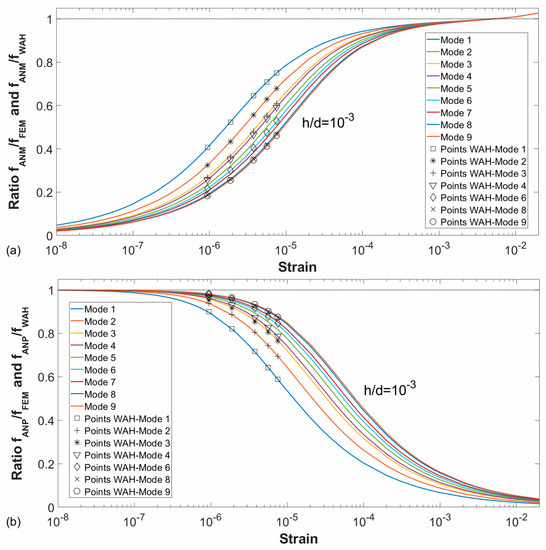
Figure 7.
Wah points superimposed on graphics of fANM/fFEM (a) and fANP/fFEM (b) ratios.
In order to complete this study, calculations have been repeated for different thicknesses: 10 mm, 1 mm (reference case), 0.1 mm, 0.01 mm, 0.001 mm, for the same level of strains, diameter and material properties that the reference case study (steel 1 m diameter). The ratios fANM/fFEM and fANP/fFEM have been plotted in Figure 8 for the first five modes.
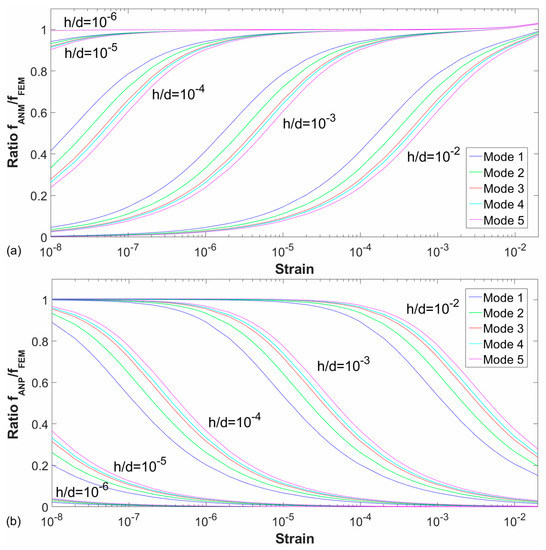
Figure 8.
Ratios fANM/fFEM (a) and fANP/fFEM (b) as a function of strain tested for the first five modes and values of thickness/diameter (h/d): 10−2, 10−3, 10−4, 10−5, and 10−6.
In the graphs of Figure 8, the same tendency is observed for all the studied cases: for small strains, the plate behaviour is fulfilled and for large strains the membrane behaviour. There is a transition zone between these behaviours, and it moves to smaller strain values for smaller thickness/diameter ratios. It can be observed that the curves obtained follow the same shape displaced an order of magnitude 102 in strain, what is in concordance with the fact that the ratio between the plate and membrane solution is dependent on a ratio (h/d)/ε1/2, considering only the geometric parameter and removing the effect of the material properties.
It is remarkable that, in certain ratios of thickness/diameter simulations, the membrane behaviour is observed with very low tension applied; those are cases hypersensitive to the applied tension.
The fn/f1 ratio has been plotted in Figure 9 for the FEM results of the first five modes for the different values of thickness/diameter (h/d) calculated: 10−2, 10−3, 10−4, 10−5, and 10−6. As for the case previously studied, the transition zone is moved to lower strains or stresses applied with smaller values of thickness/diameter ratio.
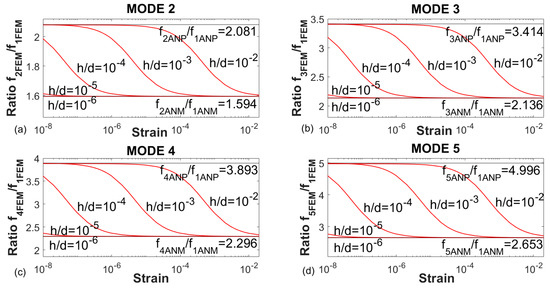
Figure 9.
Ratio fn/f1 for the first five natural frequencies obtained with FEM and values of thickness/diameter (h/d): 10−2, 10−3, 10−4, 10−5, and 10−6. (a) Mode 2. (b) Mode 3. (c) Mode 4. (d) Mode 5.
In addition to this theoretical analysis of the problem, it is of great relevance to evaluate the consequences of this behaviour in practical situations. Based on the data shown in Figure 8, we can calculate, for every case, the values of strain where the exact solutions (plate and membrane) present a certain error. In Figure 10 the strain for a 2% and a 5% error is represented for the different geometrical cases and strains studied using logarithmic scale in both axes. The error has been calculated as ((fANP−fFEM)/fANP)·100 and ((fANM−fFEM)/fANM)·100 for plate and membrane cases respectively. The discrete solutions obtained by Wah have also been plotted as reference. As it has been commented, these solutions do not cover the entire transition zone between plate and membrane behaviour.
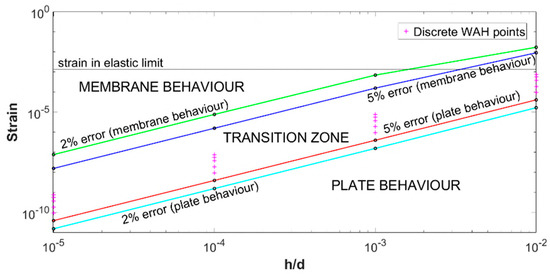
Figure 10.
Strain for solution with a 2% and 5% error for different values of h/d: 10−2, 10−3, 10−4, and 10−5.
In this figure, we can identify a zone with a clear plate behaviour for strains below a certain value, another zone with pure membrane behaviour and an intermediate zone where the transition between both solutions must be considered.
In a real situation, we must consider that the material is not infinitely elastic. For the steel, if we consider an approximate elastic limit of 400 MPa we can accept that its strain elastic limit is approximately at 1.5 × 10⁻³, which has been used as actual maximum limit for Figure 10. An additional horizontal line has been added to mark this limit. This reference together with the error lines plotted can be used as a reference to evaluate which situation can be expected in a real case.
If we analyse three different situations, we can clarify this point. Focussing on the case where the thickness of the membrane is 1 cm (h/d = 10−2), it can be considered a thick membrane or what we commonly call a plate. Here we can see how the plate solution is valid for almost all the potential values of pre-strain. Only for very high values of strain, close to the plasticity, the transition behaviour would be relevant. If we consider now a thin membrane, the reference case with a thickness of 1 mm (h/d = 10−3), we can see now how the transition zone fall in a wide range of behaviour with strain in the order of a 0.1% of the elastic limit. In this problem, neither of both theories are valid and a complete study including the pre-strain effect should be done. Finally, we can comment the case with a thickness of 0.1 mm (h/d = 10−4) that can be considered a very thin membrane. In this case, it can be observed how the plate solution is not valid for very slight values of pre-strain. It is a behaviour of hypersensitivity where very small strain values make the membrane behaves in the transition zone. Once exceeded that value it behaves as a pure membrane.
This is a case that is not an expected real situation with this material. Nevertheless, other material properties (combination of density and mechanical properties) may be present in practical situations where this transition zone is very relevant and plate theory cannot be used.
That is the case of the reported cases in MEMS design and in the behaviour of the tympanic membrane of mammals.
5. Eardrum Equivalent Membrane
On the present section, the study will focus on a membrane with geometry and material properties similar to the human eardrum.
The diameter of the circular membrane will be 1 cm and tries to represent the human tympanic membrane (TM). The actual TM has an oval shape with a higher diameter ranging from 0.9 to 1 cm and the lower from 0.8 to 0.9 cm. There are other significant differences such as its conical shape and that it is attached to a rigid element (the malleus) at its centre (the umbo). Nevertheless, the present model can be considered valid to evaluate the effect of pre-strain in this material.
The average eardrum thickness is 50 microns, and this will be the thickness of this case study (h/d = 5 × 10⁻³). The mechanical properties of the material are: density 1200 kg/m3, Poisson’s ratio 0.3 and Young’s modulus (E) 32 MPa. These properties are commonly accepted as a good estimation for the human TM [29].
In Figure 11, the ratios fANM/fFEM and fANP/fFEM have been plotted according to the applied strain for the first nine modes. In addition, the ratios fANM/fWAH and fANP/fWAH have been superimposed on the graphs for the Wah points. It is observed that again the latter ratios coincide with the first one. This is because the frequencies obtained with the Wah equation are similar to those calculated with FEM.
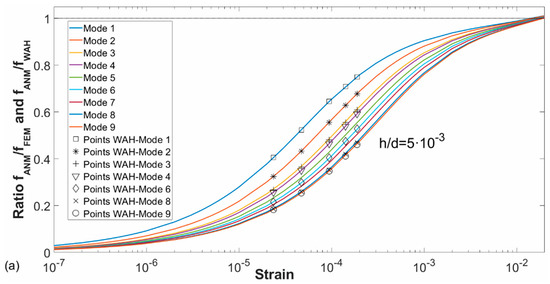
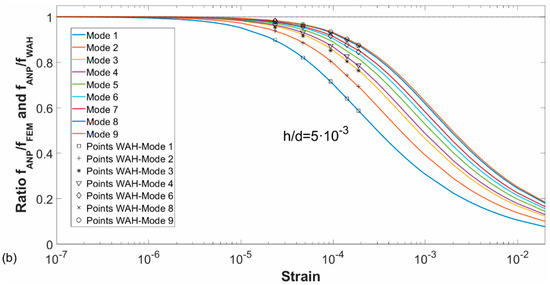
Figure 11.
Ratios fANM/fFEM (a) and fANP/fFEM (b) as a function of the strain for the first nine modes. Analytical solutions by Wah (points) are superimposed in the graph.
For the eardrum equivalent membrane and strain tested, the first five FEM vibration modes referred to the first one have been plotted in Figure 12.
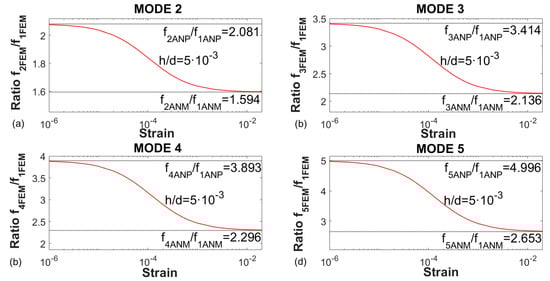
Figure 12.
Ratio fn/f1 for the first five natural frequencies obtained with FEM. (a) Mode 2. (b) Mode 3. (c) Mode 4. (d) Mode 5.
The same behaviour that for the steel case is observed in the graphs of Figure 11 and Figure 12, at low pre-strains the behaviour is similar to the plate and as the applied strain increases, it approaches to the membrane behaviour more and more.
In the study of this case, the eardrum is a material with less tensile stiffness than the case studied in the previous section (steel), so the tension values related to the strain for which the behaviour transition from membrane to plate are smaller, and therefore, the material of the eardrum is more sensitive to tension.
There exists some controversy regarding the correct estimation of the mechanical properties of the TM. Most of the results are based on tension tests on small samples [32,33] ranging from 20 to 40 MPa. Nanoindentation techniques have also been used reporting even smaller values on the range of 3 MPa [34]. In a different type of study, by means of composite laminate theory and comparing with the dynamic response of the TM [35], Fay et al. suggested that the elastic modulus should be in the range 0.1 to 0.3 GPa. These higher values could be overestimated by the presence of tension in the tympanic membrane that is released when the static tests are performed. In a previous research we have shown how experimental data can fit numerical models with a huge combination of pre-strain and elastic modulus values [29], being very sensitive to small values of the pre-strain in accordance with the results shown in Figure 11. The presence of pre-strain in the tympanic membrane has been hypothesised since long time ago [36,37] and is a question under discussion in current hearing research.
6. Conclusions
The influence of the membrane tension has been evaluated by means of a FEM study and the main finding can be summarize as follows:
- The range where the classic theories are applicable has been obtained. A significant transition zone where neither plate theory nor membrane theory can be applied has been identified. It has been quantified for a reference case.
- It has been proven the validity of the theory of Wah [30] to describe the behaviour of part of that transition zone. It has been completed with FEM results for a wider range of values, connecting with the extreme results (plate and membrane theory).
- There has been identified some geometric ratios with significant hypersensitivity to very low tension. Some of these configurations are present in practical problems. One of them is in the different mammals hearing systems (including the human).
The main consequence from these findings is the need to consider this effect when modelling membrane problems with low tension. It implies a double difficulty. On the one hand a proper estimation of the value of the pre-strain effect must be done. This is not easy to do, and, in most cases, there is no information to properly establish the value. On the other hand, once it has been obtained, it must be incorporated in the model and as it has been stated, small deviation provides significant response changes.
One of the fields where this effect is relevant is the mechanics of hearing. Among researcher in this field, it is commonly accepted that the tympanic membrane presents a low level of tension, so this effect has been considered negligible in numerical model. According to these results, this effect should be evaluated and taken into account.
Another situation is the manufacturing of micro devices with membrane elements. In this case, the presence of pre-strain is due to effects present during the different manufacturing steps. It can be caused for different reasons: temperature change, material shrinkage, etc. that are difficult to clarify and quantify.
Finally, it must be pointed out a potential application of these results. The complete correlation obtained among pre-strain and natural frequencies opens an experimental option to determinate the level of pre-strain of a membrane system. By fitting experimental and numerical modal frequencies, using model update techniques, an estimation of the level of tension can be made. In this case, the model uncertainties (in term of mechanical properties and geometry) must be limited in order to establish a proper correlation among experimental and numerical results.
Author Contributions
Conceptualization, A.G.-H. and J.G.-M.; format analysis, A.L.-R.; investigation, A.L.-R., A.G.-H. and J.G.-M.; methodology, A.G.-H. and J.G.-M.; software, A.L.-R. and J.G.-M.; validation, A.L.-R. and A.G.-H.; writing—original draft preparation, A.L.-R. and A.G.-H.; writing—review and editing, A.G.-H. and J.G.-M.
Funding
The authors acknowledge the financial support provided to this work by Junta de Andalucía from Operational Program FEDER 2014-2020 as a part of the research project UMA18-FEDERJA-214.
Conflicts of Interest
The authors declare no conflict of interest.
Nomenclature Check Use of Italic Font to Match Main Text
| f ≡ natural frequency (Hz) |
| a ≡ radius of the plate or membrane |
| d ≡ diameter of the plate or membrane |
| h ≡ thickness of the plate or membrane |
| E ≡ Young’s modulus of the material |
| υ ≡ Poisson´s ratio of the material |
| γ ≡ weight per unit volume |
| ρ ≡ mass per unit volume (material density) |
| w ≡ weight per unit area |
| g ≡ acceleration due to gravity |
| S or T ≡ uniform tension per unit length of the boundary |
| D ≡ flexural rigidity |
| α ≡ constant different for each mode |
| n ≡ number of nodal diameters |
| s ≡ number of nodal circles |
| ϕ ≡ non-dimensional parameter |
References
- Rayleigh, L. Theory of Sounds; Macmillan & Co.: London, UK, 1877. [Google Scholar]
- Timoshenko, S. Vibration Problems in Engineering; D. Van Nostrand Company Inc.: New York, NY, USA, 1928. [Google Scholar]
- Leissa, A.W. Vibration of Plates; National Aeronautics and Space Administration: Washington, DC, USA, 1969. [Google Scholar]
- Poisson, S.D. L’équilibre et le mouvement des corps élastiques. Mém. Acad. Sci. Inst. Fr. 1828, 8, 357–570. [Google Scholar]
- Kirchhoff, G. Über das Gleichgewicht und die Bewegung einer elastischen Scheibe. J. Reine Angew. Math. 1850, 40, 51–88. [Google Scholar]
- Airey, J.R. The vibrations of circular plates and their relation to bessel functions. Proc. Phys. Soc. Lond. 1911, 23, 225. [Google Scholar] [CrossRef]
- Itao, K.; Crandall, S.H. Natural modes and natural frequencies of uniform, circular, free-edge plates. J. Appl. Mech. Trans. ASME 1979, 46, 448–453. [Google Scholar] [CrossRef]
- Amabili, M.; Pasqualini, A.; Dalpiaz, G. Natural frequencies and modes of free-edge circular plates vibrating in vacuum or in contact with liquid. J. Sound Vib. 1995, 188, 685–699. [Google Scholar] [CrossRef]
- Leissa, A.W.; Narita, Y. Natural frequencies of simply supported circular plates. J. Sound Vib. 1980, 70, 221–229. [Google Scholar] [CrossRef]
- Azimi, S. Free vibration of circular plates with elastic edge supports using the receptance method. J. Sound Vib. 1988, 120, 19–35. [Google Scholar] [CrossRef]
- Leissa, A.W.; Laura, P.A.; Gutierrez, R.H. Transverse vibrations of circular plates having nonuniform edge constraints. J. Acoust. Soc. Am. 1979, 66, 180–184. [Google Scholar] [CrossRef]
- Narita, Y.; Leissa, A.W. Transverse vibration of simply supported circular plates having partial elastic constraints. J. Sound Vib. 1980, 70, 103–116. [Google Scholar] [CrossRef]
- Narita, Y.; Leissa, A.W. Flexural vibrations of free circular plates elastically constrained along parts of the edge. Int. J. Solids Struct. 1981, 17, 83–92. [Google Scholar] [CrossRef]
- Amabili, M.; Pierandrei, R.; Frosali, G. Analysis of vibrating circular plates having non-uniform constraints using the modal properties of free-edge plates: Application to bolted plates. J. Sound Vib. 1997, 206, 23–38. [Google Scholar] [CrossRef]
- Eastep, F.E.; Hemmig, F.G. Natural frequencies of circular plates with partially free, partially clamped edges. J. Sound Vib. 1982, 84, 359–370. [Google Scholar] [CrossRef]
- Kwak, M.K. Vibration of circular plates in contact with water. J. Appl. Mech. 1991, 58, 480–483. [Google Scholar] [CrossRef]
- Hernández, E. Approximation of the vibration modes of a plate and shells coupled with a fluid. J. Appl. Mech. 2006, 73, 1005–1010. [Google Scholar] [CrossRef]
- McIntyre, M.E.; Schumacher, R.T.; Woodhouse, J. On the oscillations of musical instruments. J. Acoust. Soc. Am. 1983, 74, 1325–1345. [Google Scholar] [CrossRef]
- Alm, J.F.; Walker, J.S. Time-frequency analysis of musical instruments. SIAM Rev. 2002, 44, 457–476. [Google Scholar] [CrossRef]
- Fletcher, N.; Rossing, T. The Physics of Musical Instruments; Springer: New York, NY, USA, 1998; ISBN 10:0-387-98374-0. [Google Scholar]
- Von Helmholtz, H.; Ellis, A.J. On the Sensations of Tone as a Physiological Basis of the Theory of Music; Longmans, Green and Company: London, UK, 1895. [Google Scholar]
- Suzuki, H.; Yamaguchi, N.; Izumi, H. Theoretical and experimental studies on the resonance frequencies of a stretched circular plate: Application to Japanese drum diaphragms. Acoust. Sci. Technol. 2009, 30, 348–354. [Google Scholar] [CrossRef]
- Lee, J.; Wang, Z.; He, K.; Shan, J.; Feng, P.X.L. High frequency MoS2 nanomechanical resonators. ACS Nano 2013, 7, 6086–6091. [Google Scholar] [CrossRef]
- Sammoura, F.; Smyth, K.; Bathurst, S.; Kim, S.G. An analytical analysis of the sensitivity of circular piezoelectric micromachined ultrasonic transducers to residual stress. In Proceedings of the 2012 IEEE International Ultrasonics Symposium, Dresden, Germany, 7–10 October 2012; pp. 580–583. [Google Scholar]
- Chen, K.-S.; Ou, K.-S. Modification of curvature-based thin-film residual stress measurement for MEMS applications. J. Micromech. Microeng. 2002, 12, 917–924. [Google Scholar] [CrossRef]
- Tang, Y.J.; Chen, J.; Huang, Y.B.; Li, D.C.; Wang, S.S.; Li, Z.H.; Zhang, W.D. Ultra-sensitive, highly reproducible film stress characterization using flexible suspended thin silicon plates and local curvature measurements. J. Micromech. Microeng. 2007, 17, 1923–1930. [Google Scholar] [CrossRef]
- Griffin, B.A.; Williams, M.D.; Wang, G.; Sankar, B.V.; Cattafesta, L.N.; Sheplak, M. The electromechanical behavior of piezoelectric thin film composite diaphragms possessing in-plane stresses. J. Micromech. Microeng. 2017, 27, 045017. [Google Scholar] [CrossRef]
- Gonzalez-Herrera, A.; Olson, E.S. A study of sound transmission in an abstract middle ear using physical and finite element models. J. Acoust. Soc. Am. 2015, 138, 2972–2985. [Google Scholar] [CrossRef] [PubMed]
- Caminos, L.; Garcia-Manrique, J.; Lima-Rodriguez, A.; Gonzalez-Herrera, A. Analysis of the mechanical properties of the human tympanic membrane and its influence on the dynamic behaviour of the human hearing system. Appl. Bionics Biomech. 2018, 2018, 1736957. [Google Scholar] [CrossRef] [PubMed]
- Thein, W. Vibration of circular plates. J. Acoust. Soc. Am. 1962, 34, 275–281. [Google Scholar]
- Timoshenko, S.; Woinowsky-Krieger, S. Theory of Plates and Shells; McGraw-Hill: New York, NY, USA, 1941; Volume 148, ISBN 0070647798. [Google Scholar]
- Decraemer, W.F.; Maes, M.A.; Vanhuyse, V.J. An elastic stress-strain relation for soft biological tissues based on a structural model. J. Biomech. 1980, 13, 463–468. [Google Scholar] [CrossRef]
- Cheng, T.; Dai, C.; Gan, R.Z. Viscoelastic properties of human tympanic membrane. Ann. Biomed. Eng. 2007, 35, 305–314. [Google Scholar] [CrossRef]
- Aernouts, J.; Aerts, J.R.M.; Dirckx, J.J.J. Mechanical properties of human tympanic membrane in the quasi-static regime from in situ point indentation measurements. Hear. Res. 2012, 290, 45–54. [Google Scholar] [CrossRef]
- Fay, J.; Puria, S.; Decraemer, W.F.; Steele, C. Three approaches for estimating the elastic modulus of the tympanic membrane. J. Biomech. 2005, 38, 1807–1815. [Google Scholar] [CrossRef]
- Von Békésy, G. Experiments in Hearing; McGraw-Hill: New York, NY, USA, 1960. [Google Scholar]
- Kirikae, I. The Structure and Function of Middle Ear; Tokio University Press: Tokyo, Japan, 1960. [Google Scholar]


© 2019 by the authors. Licensee MDPI, Basel, Switzerland. This article is an open access article distributed under the terms and conditions of the Creative Commons Attribution (CC BY) license (http://creativecommons.org/licenses/by/4.0/).