1. Introduction
In general, it would be improved the structural performance of the concrete, when rebars in the reinforced concrete are uncorroded and intact [
1,
2,
3,
4,
5]. This is because concrete has strong alkaline properties, which indicate a pH of 12.5 [
2,
3,
4,
5]. Thus, rebars would be protected from corrosion by the passive film that is formed around them. However, if concrete cracks occur in the surface of the concrete, chlorine ions, moisture, and oxygen could infiltrate the concrete and distribute inside, eventually reaching the rebars within the concrete [
5,
6,
7,
8,
9]. In such cases, the passive film that protects the rebars would be destroyed and the rebars start to corrode. When this happens, corrosion products are chemically created during the rebar corrosion process. Because the volume of the corrosion products can expand several times faster than the volume of the rebars, tensile stress acts on the concrete cover, and the structure’s durability is significantly reduced by cracks, delamination, and failures in the concrete as well as the reductions in the rebar’s cross-sectional area [
3,
4,
6,
10,
11,
12]. Therefore, there is a necessity to develop methods for quantitatively measuring the corrosion of rebars that occurs in reinforced concrete structures as well as methods for accurately evaluating the extent to which the strength of the corroded reinforced structure is reduced.
Rebar corrosion monitoring techniques have been used in studies involving embedded sensors that can detect changes in the corrosion currents and the polarization resistance of rebars in large structures. The data from these sensors are used to predict rebar corrosion and evaluate the integrity of the structures. Studies are being continuously conducted to improve the reliability of monitoring techniques and create efficient maintenance systems [
3,
7,
12,
13].
In addition, several studies have been conducted to develop techniques for measuring the rebar corrosion within concrete [
14,
15,
16,
17]. These techniques include spontaneous potential, polarization resistance, electrical resistance, ac impedance, electrochemical noise, dynamic polarization, and dynamic potential difference bipolar polarization methods. The results that have been obtained from these studies have identified the electrochemical mechanism of rebar corrosion, established theories related to various types of rebar corrosion, and measured the speed of rebar corrosion.
Defect detection methods that employ infrared cameras are useful non-destructive testing methods to detect defects in concrete structures [
18,
19,
20,
21,
22,
23,
24]. These methods are non-contact, stable, prompt, remote detection, and continuous testing methods [
25,
26,
27]. However, the measurement results from these methods would vary depending upon several factors that affect thermography. Because of these reasons, they have not been able to provide sufficient reliability. To obtain clear measurement results during infrared thermography, it has been found that efforts must be made to minimize the target location’s temperature and humidity to reduce the impact on the measurement results as well as the target structure’s surface temperature.
The ultimate goal of this study is to develop a technique that uses infrared cameras to quantitatively measure rebar corrosion rates. Rather than a qualitative examination that determines whether or not rebar corrosion is occurring, the aim is to construct a system that provides accurate and efficient information on rebar corrosion in reinforced concrete structures.
2. Research Methodology
2.1. Theoretical Considerations
2.1.1. Rebar Corrosion Mechanism
When chlorides infiltrate a reinforced concrete structure, a potential difference occurs because the chlorides do not enter all the parts of the rebar in a uniform manner [
7,
20,
28]. The potential difference causes the electrons to flow in the rebar and, simultaneously, electrochemical reactions on the rebar surface [
29]. Electron creation and consumption occur at the positive and negative poles, respectively. When the corrosion reaction occurs, the negative charges created at the positive pole maintain electrical neutrality by moving through the electrolyte and the positive charges move toward the negative pole. Thus, an electrical circuit is formed. This electrochemical reaction occurs continuously and destroys the rebar’s passive film, which promotes corrosion. The corrosion pressure that occurs at this point reaches 4700 psi, and hence, the concrete structure gets damaged [
30].
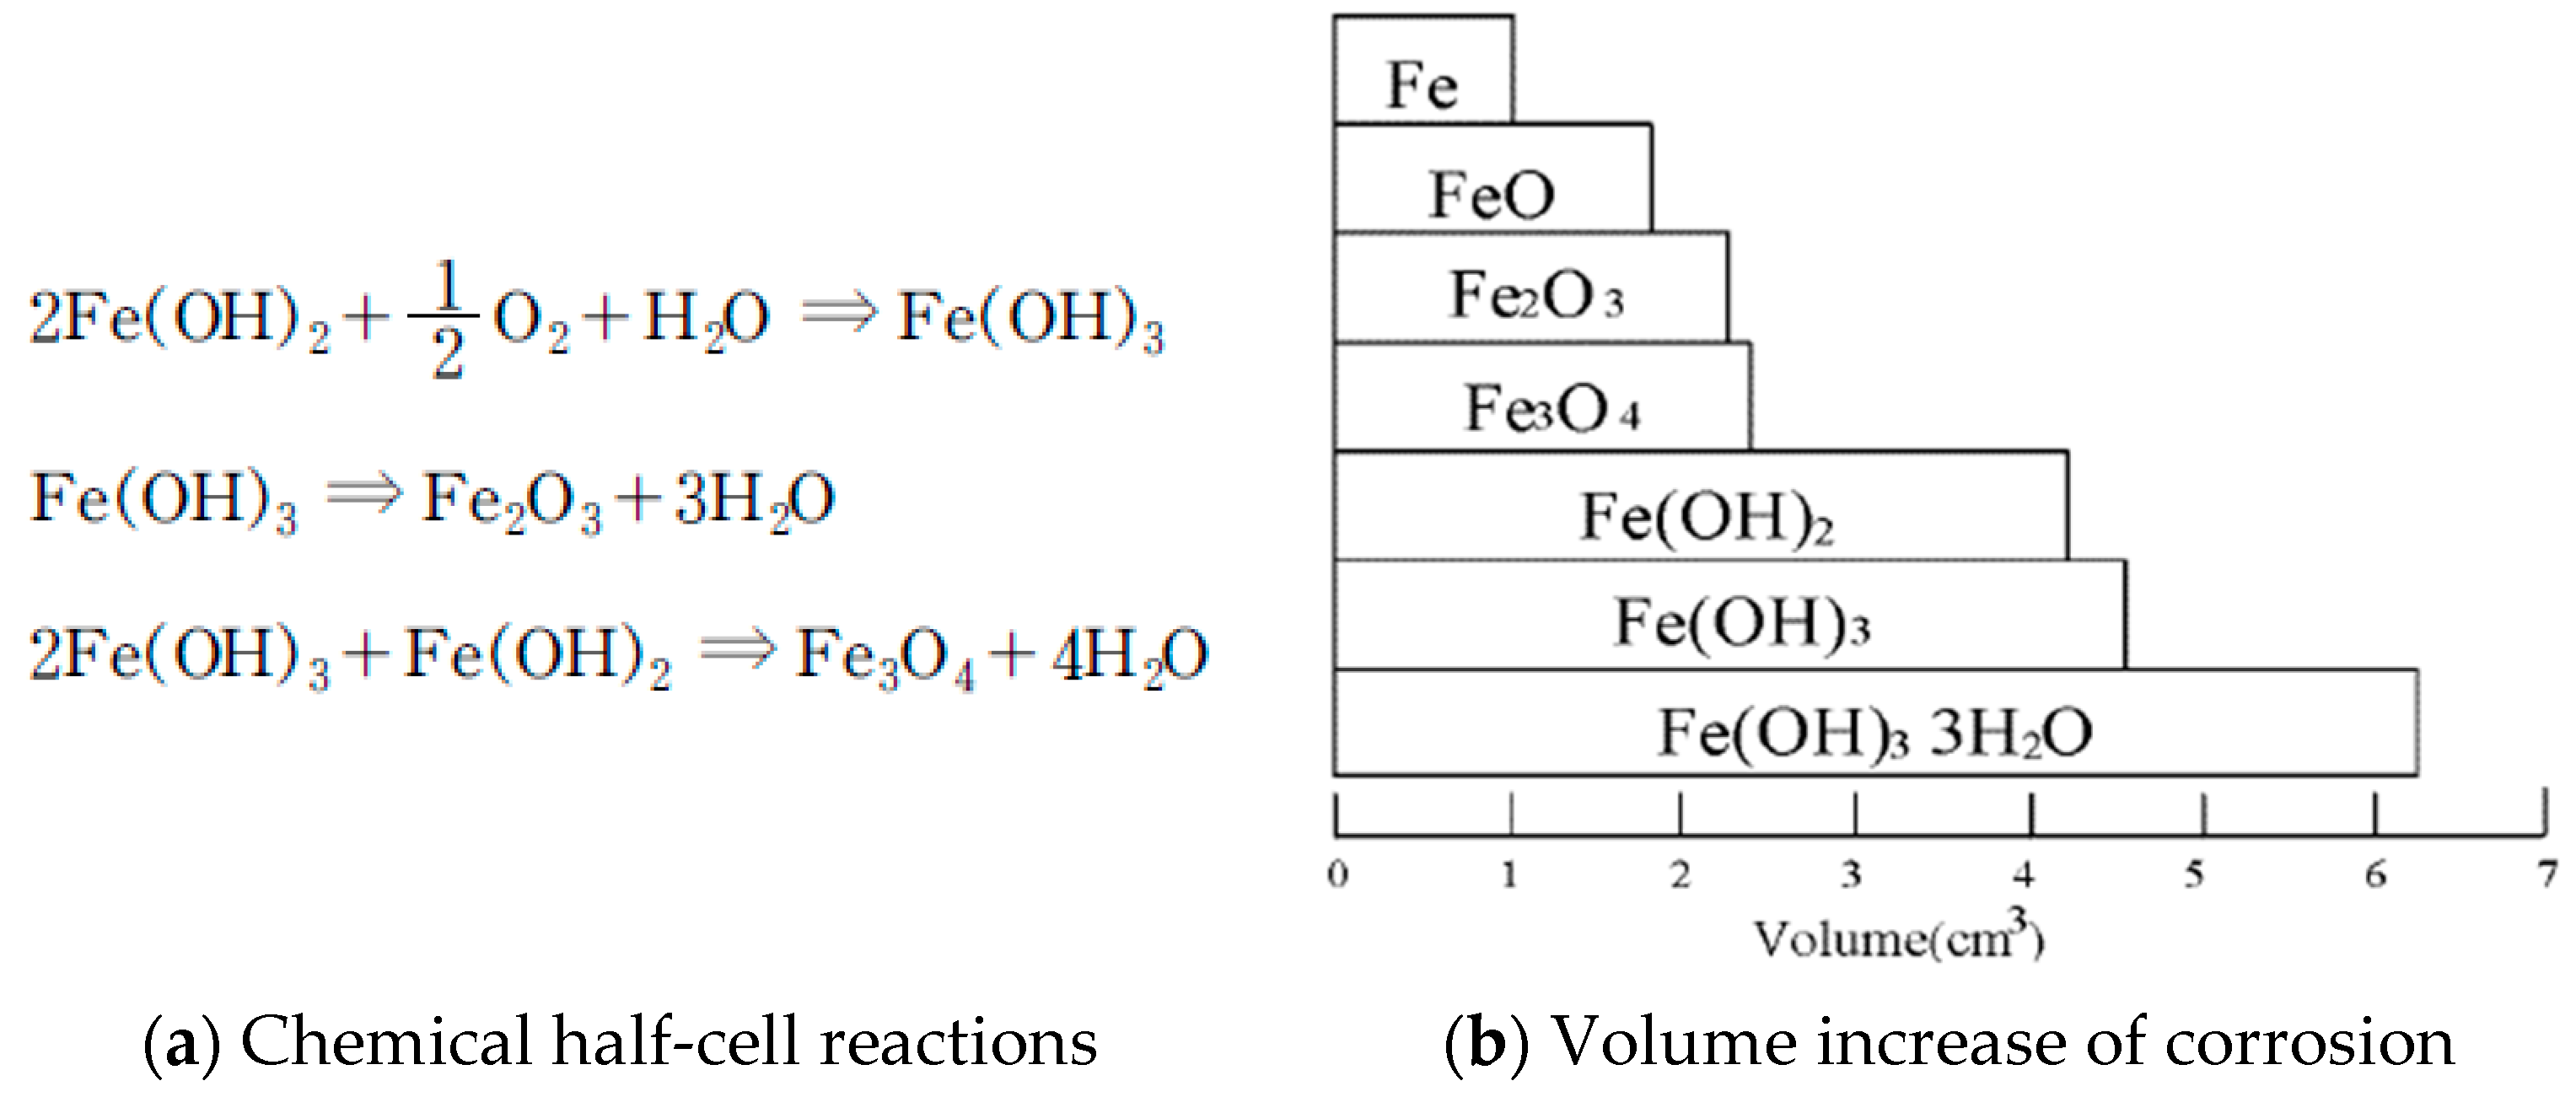
When moisture and oxygen infiltrate into a reinforced concrete structure, the ferric hydroxide goes through the process represented by
Figure 1 and changes into black rust. The resultant changes in volume are shown in
Figure 1. The corrosion products that create rust are oxides or hydroxides, and their volume is significantly larger as compared to the volume of the original steel. Calculations have been performed to determine the multiplication factor of the volumetric expansion that occurs when steel changes to oxides or hydroxides. This is done because the specific gravity of steel (7.86) changes to the specific gravity of the oxides or hydroxides. Calculations show that there is a volume expansion factor of 2 when steel changes into oxides and 3 when steel changes into hydroxides.
The pressure that increases as the corrosion progresses can cause cracks and delamination in the concrete. These cracks readily supply more oxygen and further promote the corrosion process, leading to a continuous cycle of corrosion.
2.1.2. Electrical Resistance of Rebar
Calculation of Electrical Resistance Using Specific Resistance of Steel
According to Ohm’s Law, the resistance of a conductor is proportional to its length and inversely proportional to its area. The resistance
R can be expressed as in Equation (1). Here,
is the metal’s specific resistance at a length of 1 m and a cross-sectional area of 1 m
2. Steel has a specific resistance of 40 × 10
−8 Ωm (at 20 °C). The length (25 cm) and cross-sectional area (0.7133 cm
2 nominal cross-sectional area, D10 rebar) of the rebar used in the experiments were substituted in this equation to calculate the electrical resistance. Considering the amount of cross-sectional reduction caused by the corrosion ratio, the electrical resistances for each corrosion ratio were compared, and the results showed an electrical resistance of 1.402 mΩ in the reference specimen rebar, 1.416 mΩ in the 1% corroded rebar, 1.445 mΩ in the 3% corroded rebar, and 0.1476 mΩ in the 5% corroded rebar.
Here, is the specific resistance of a conductor with a length of 1 m and a cross-sectional area of 1 m2.
Calculation of Heat Generation Based on Rebar Corrosion
According to Joule’s law, heat generation is proportional to the product of the resistance of the conductor, the square of the current, and the time for which it flows. This was used to calculate the heat generated by the rebar (Equation (2)). For this study, the current value was considered to be 200 A, which was used in the experiments. For
R, the electrical resistances that were calculated for each corrosion ratio, as described above, were used. The heat generated was calculated as 1.077 cal/s in the 0% corroded rebar, 1.088 cal/s in the 1% corroded rebar, 1.110 cal/s in the 3% rebar, and 1.133 cal/s in the 5% corroded rebar.
where
is the heat generated by the current,
is the current, and
is the conductor’s electrical resistance.
Calculation of Temperature Change of Rebar
A calorie is the amount of heat required to raise the temperature of 1 g of water from 14.5 to 15.5 °C. To create a formula that applies this to steel, specific heat was used. The specific heat of water is 410 and the specific heat of steel is 45. As such, steel gets heated approximately 9.11 times faster than water. Therefore, the actual rebar’s heat generation per second was calculated by dividing the rebar’s weight of 140 g, which is calculated from the D10 rebar’s unit weight of 0.56 kg/m and length of 25 cm, used in the experiments, by the calculated amount of heat. When the calculations were performed assuming that heating occurred for 210 s, it was found that the temperature increased by 14.71 °C in the 0% corroded rebar, 14.86 °C in the 1% corroded rebar, 15.17 °C in the 3% corroded rebar, and 15.48 °C in the 5% corroded rebar. These values were calculated under the assumption that all resistances occurred only in the rebar and there was no heat loss from the rebar during heating.
Electrical Resistance Experiments on Corroded Rebar
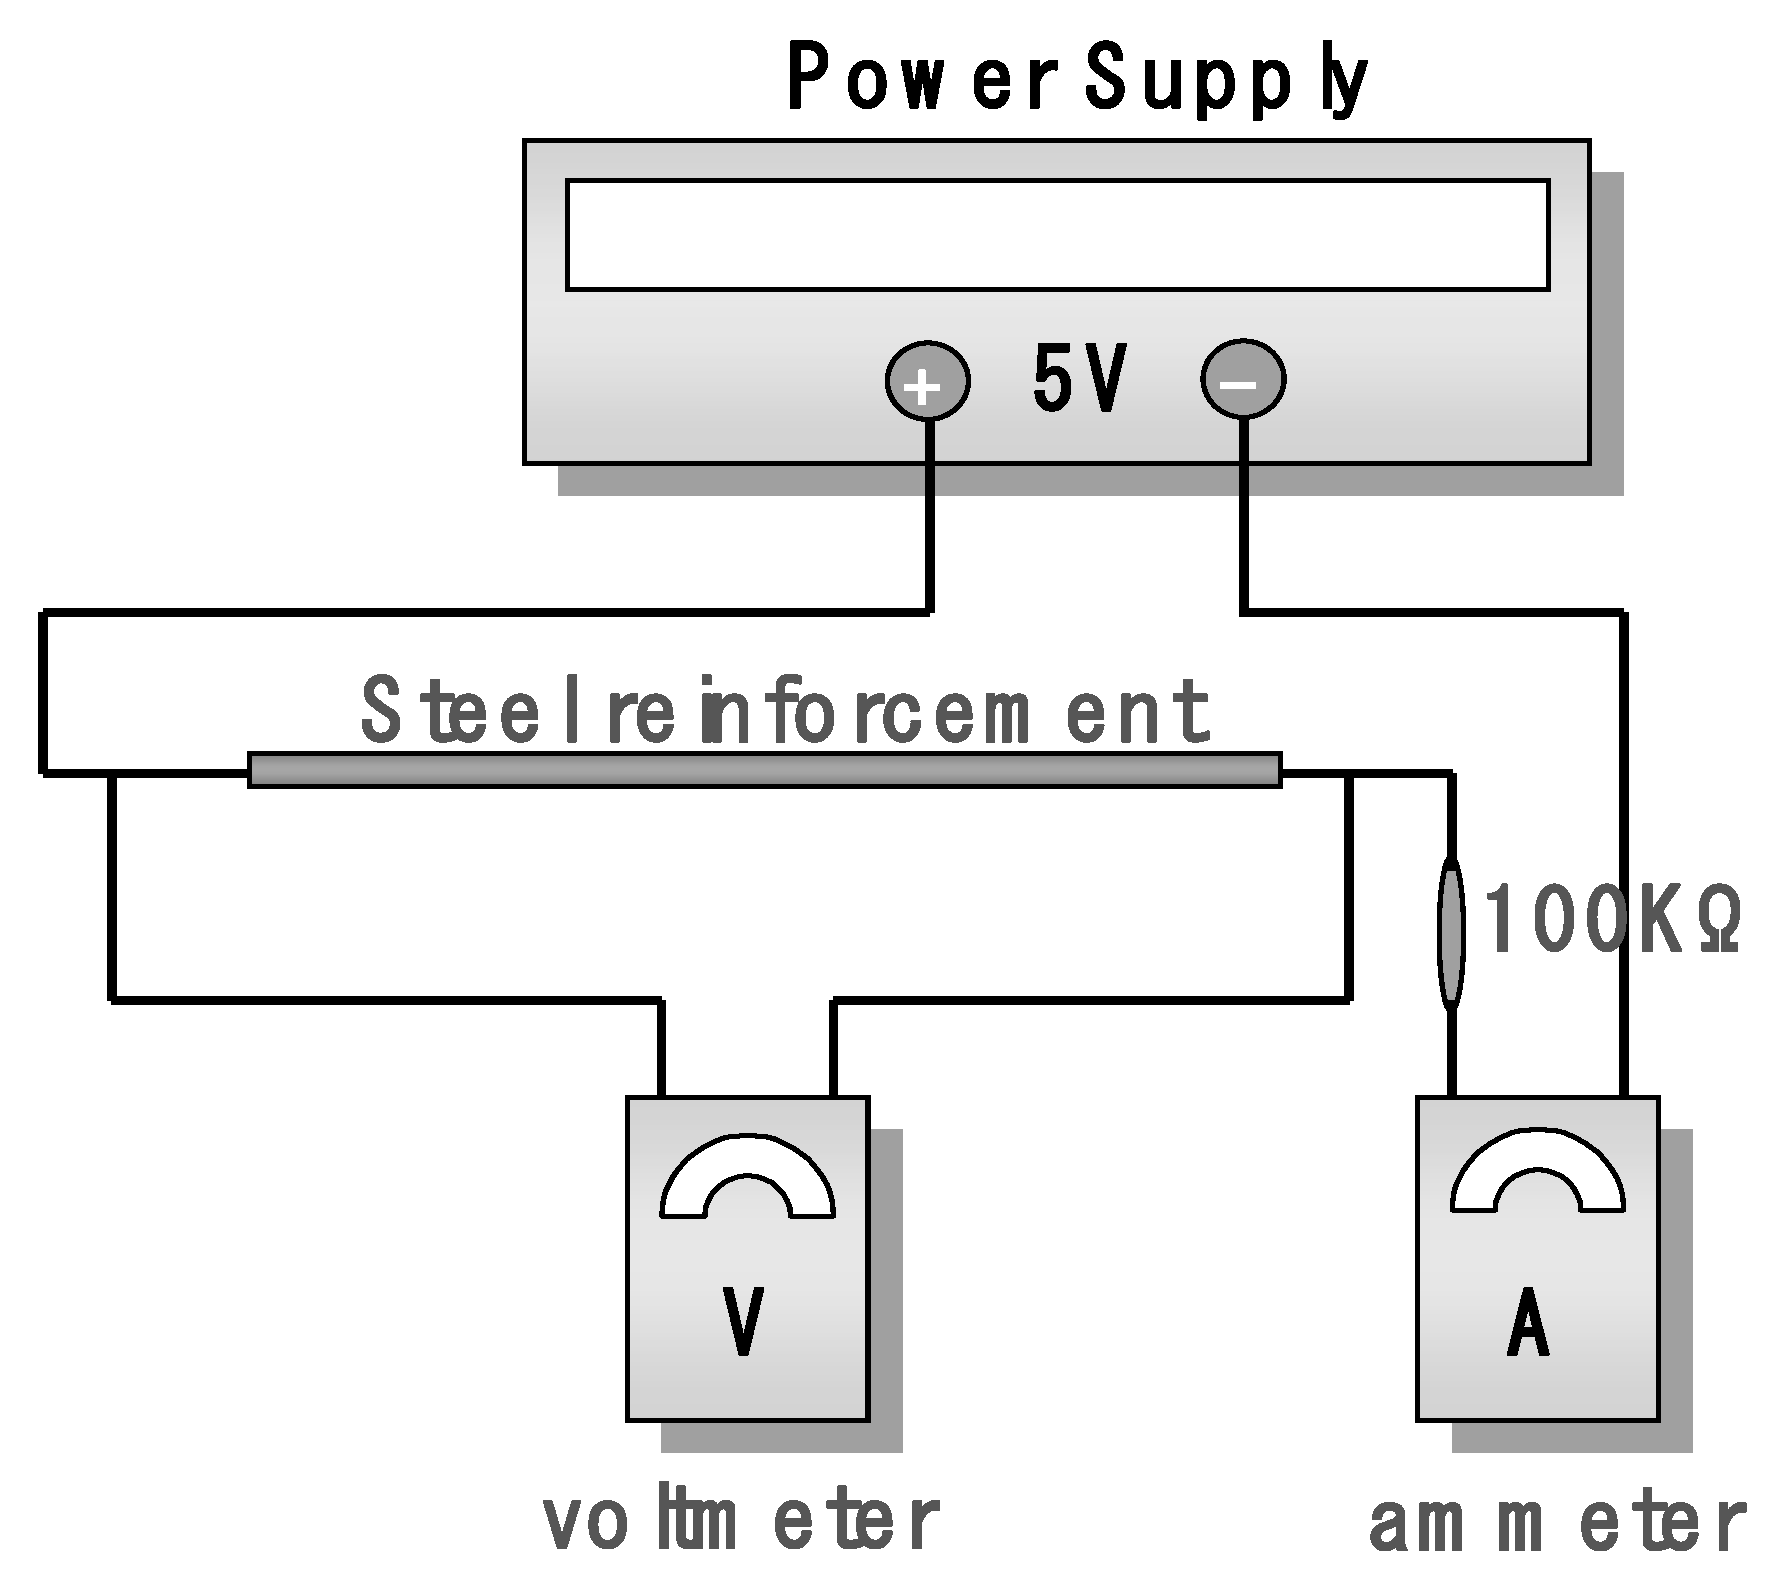
The corrosion progression due to potential difference and Faraday’s law were used to check the calculated electrical resistance values. The corrosion ratios of 0%, 1%, 3%, 5%, 10%, 20%, and 30% were set as the variables. In this study, a D10 rebar of 25 cm was prepared, which is similar to the rebar used in the preliminary tests. Corrosion was induced in the rebar and its electrical resistance was measured. To measure minor differences in the resistance, a power supply was used to apply a voltage of 5 V to the rebar, as shown in
Figure 2. The resulting voltage and current were measured, and Ohm’s law were used to calculate the resistance.
The electrical resistances were measured three times, and the average value was calculated to obtain the values of electrical resistances shown in
Table 1. These values were different from the values of electrical resistance calculated before the electrical resistance tests. However, the value of electrical resistance that was to be measured was very small, which was considered to be the result of an overall error, including the error between the nominal cross-sectional area and the actual cross-sectional area of the rebar that was used, the error in the length of the rebar, and the error that occurred in the measurement method. Despite this, the tests were able to confirm that the electrical resistance of the rebar increased with the increase in its corrosion ratio.
2.1.3. Infrared Thermography
Objects with an absolute temperature above 0 K emit infrared light from their surfaces. The amount of emission is known to have a high correlation with the object’s temperature. The temperatures of these objects can be determined from the amount of infrared light emitted from them.
Infrared light has a wavelength in the range 0.8–1000 µm. It is an electromagnetic wave that occurs between microwaves and visible light. Infrared light cameras, with elements that can detect electromagnetic waves in the infrared region, can be used in the same manner as normal optical video cameras to obtain the temperature distributions of their targets. This method is known as infrared thermography (IRT). Compared to ultraviolet or visible light, infrared light has long wavelengths and experiences minor reflection or absorption owing to the particles. Therefore, it penetrates the atmosphere to a large extent and can obtain observations at long distances to a certain extent. Because of this, it is used for satellite ground observations, and a variety of research on the applications of IRT is now being actively pursued.
2.2. Focus of the Study
As noted in
Section 2.1.2, the cross-sectional area of the rebar decreases as the rebar corrosion progresses, and the resistance of the conductor is proportional to its length and inversely proportional to its area. Therefore, the following hypothesis was established: When a fixed amount of current is applied to the rebar, the distribution of thermography that appears on the concrete’s surface varies owing to the differences in heat generation caused by the electrical resistance.
As shown in
Section 2.1.1, as the corrosion progresses, corrosion by-products are created. These products surround the concrete in the form of a film of oxidized steel, based on the difference in the corrosion ratio, and infiltrate in the concrete through pores. The following hypothesis was established: The heat transfer coefficients of the rebar and concrete vary according to the degree of corrosion; when current is applied to the rebar and it is heated, the speed at which heat is transferred to the concrete surface varies.
This study was performed based on the two aforementioned hypotheses, which follow physical phenomena. The cross-sectional area of the rebar decreases as the corrosion progresses in the rebar, and there is a difference in the heat generated in the rebar owing to the difference in electrical resistance when electricity is applied to the rebar and it is heated. When the rebar within the concrete corrodes, corrosion by-products, such as oxidized steel, are created. The by-products with high thermal conductivity fill the pores in the concrete. As a result, the process of heat transfer to the concrete surface varies for each corrosion ratio. Therefore, an infrared camera was used to capture the differences in temperature distribution on the surface of the concrete, and the data were stored in a database.
3. Establishing IRT Database
3.1. Creation of Specimens
To increase the accuracy of the measurement results, a total of 54 specimens were created, including 3 specimens that were created for each of the 3 cover thicknesses. The six corrosion ratios, determined by the results of several preliminary tests performed beforehand to create the IRT database, and the three cover thicknesses are given below.
- (1)
Corrosion ratios: 0%, 1%, 3%, 5%, 7%, and 10%.
- (2)
Cover thicknesses: 10 mm, 20 mm, and 30 mm.
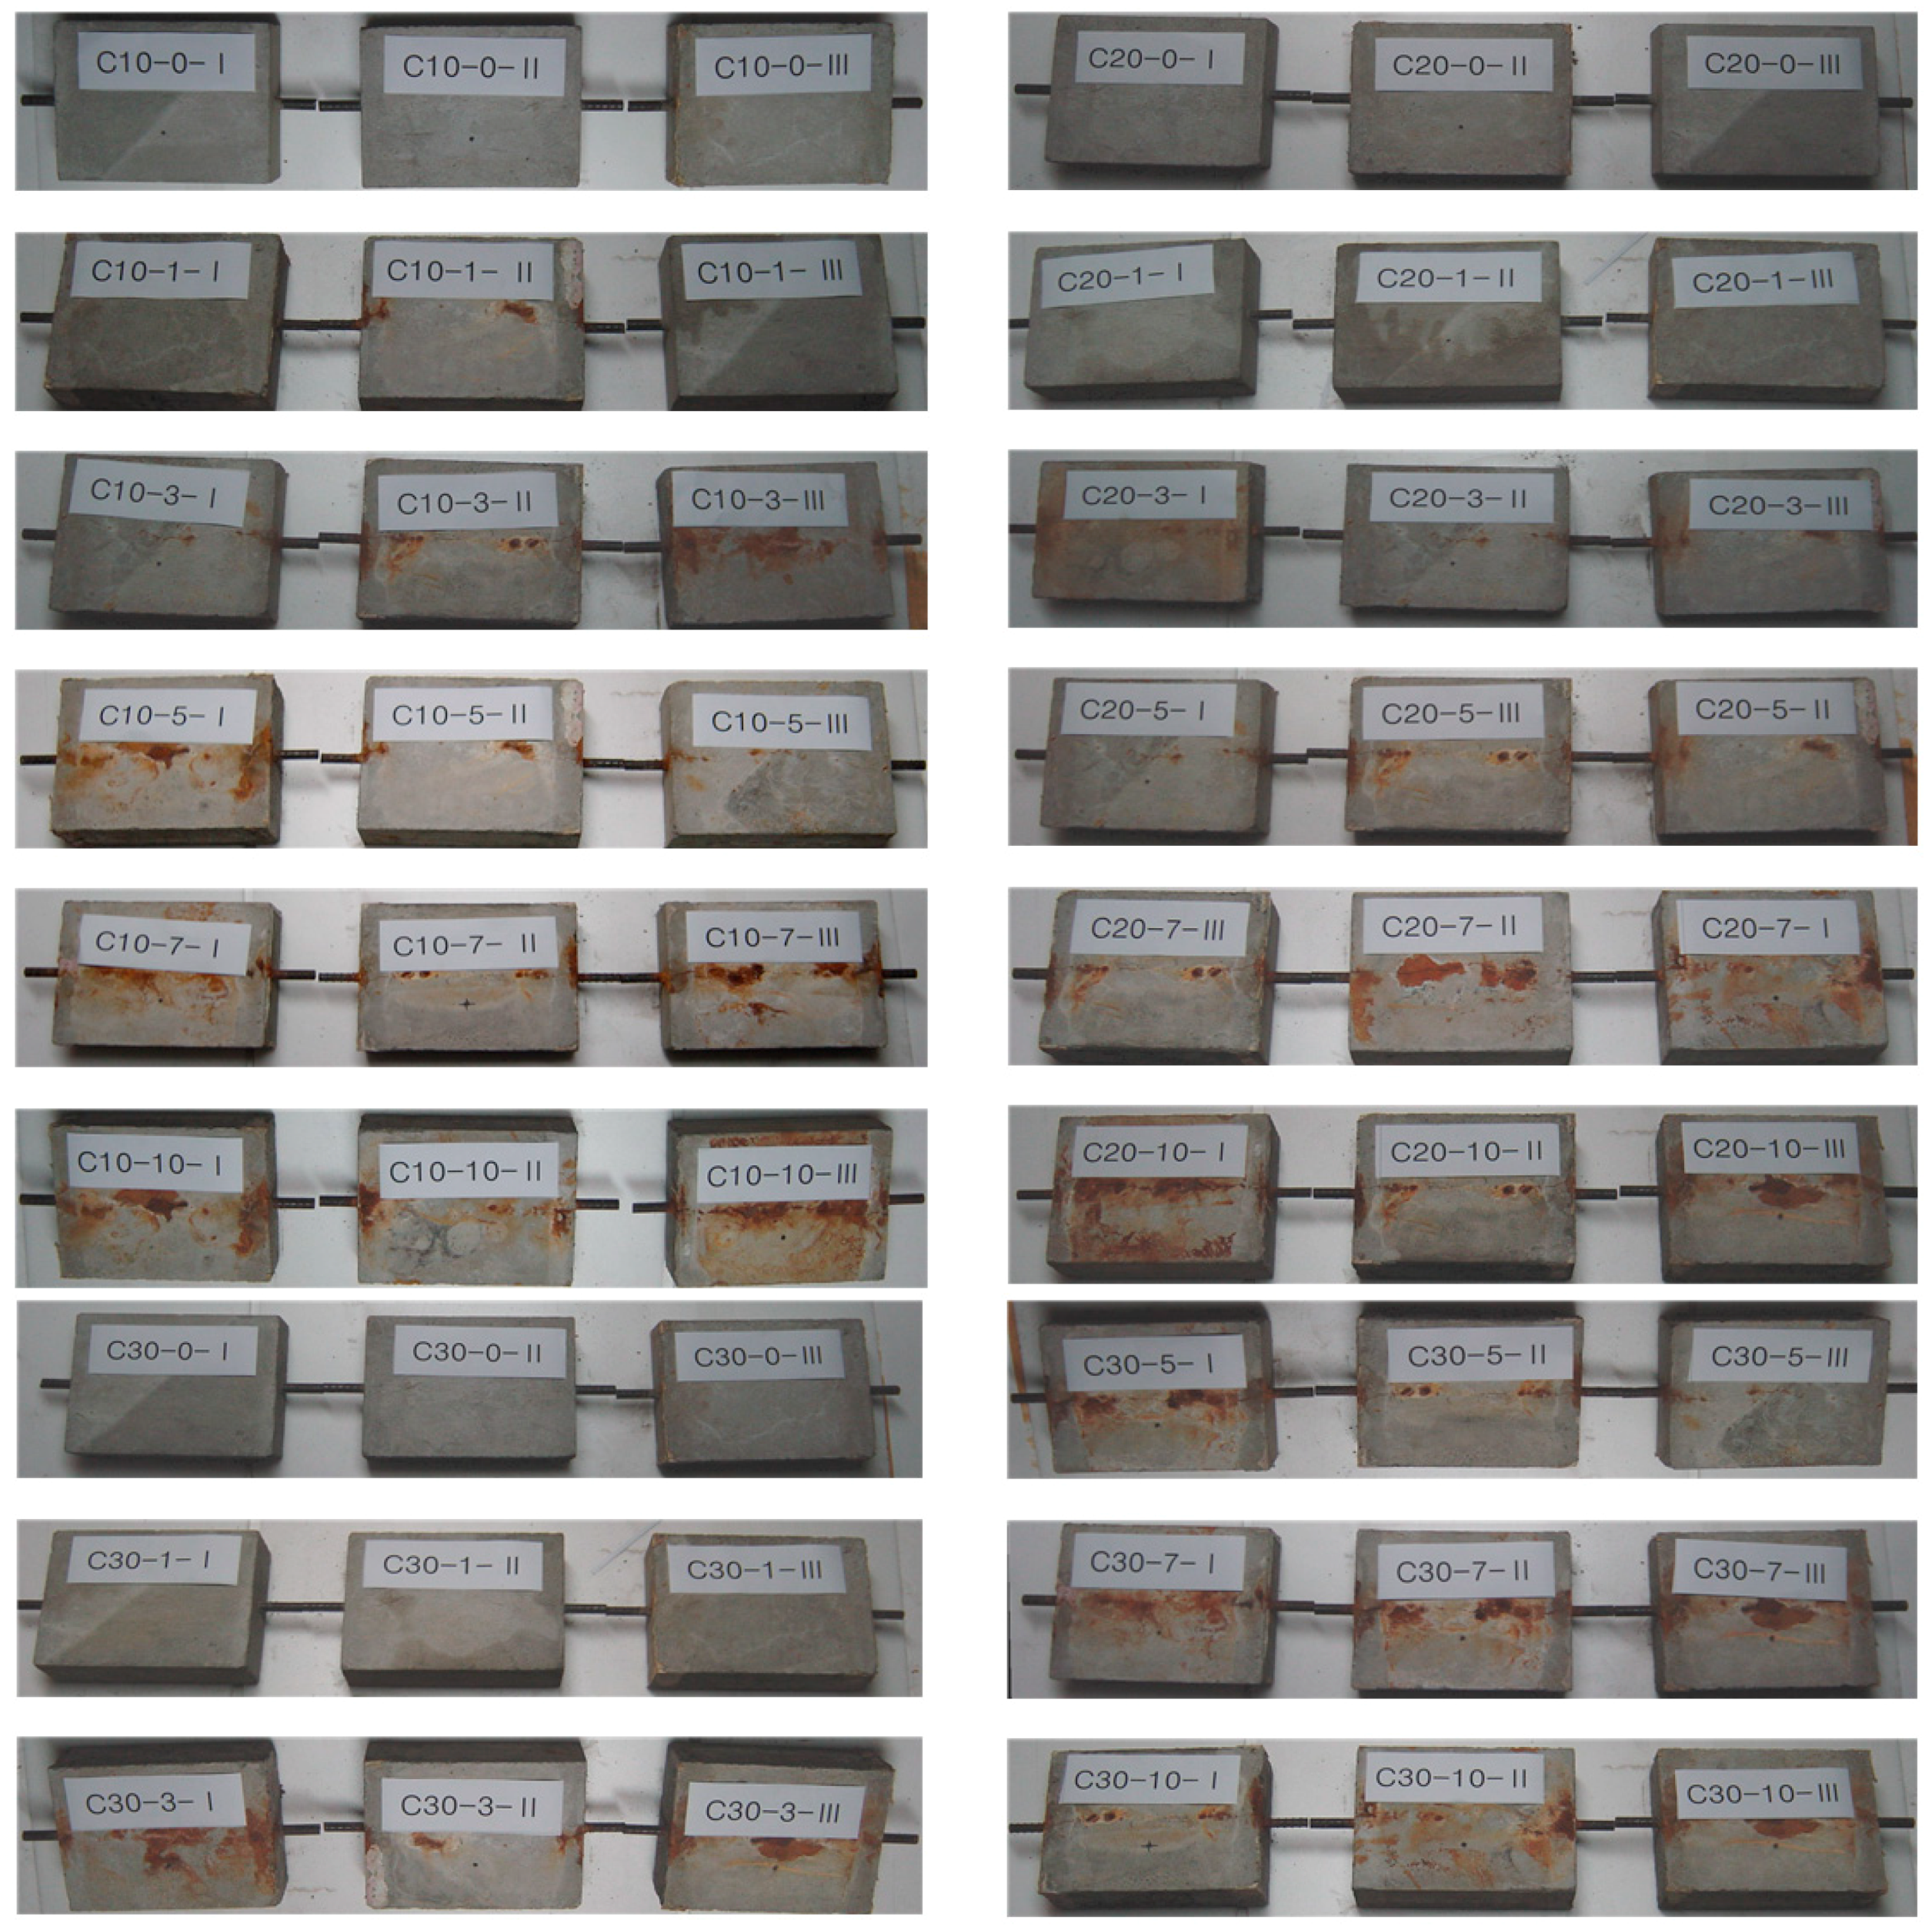
The specimens are shown in
Figure 3. To examine the impact of the cover thickness, the experiment variables were set at cover thicknesses of 10, 20, and 30 mm and rebar corrosion ratios of 0%, 1%, 3%, 5%, 7%, and 10%. The corrosion ratio determined in this study was calculated the corrosion rate, which would be able to occur when the concrete is generally exposed to the outside. Moreover, the corrosion ratio 0% was added to the experiment under the assumption that corrosion would not occur. Along with this assumption, the maximum corrosion rate was established to 10% based on reviewing the previous studies in corrosion of concrete. In addition, the cover thickness of this study (10, 20, and 30 mm) is most commonly applied in the reinforced concrete structures. Each variable was tested and a total of 60 specimens were created (54 specimens and 6 preliminary specimens). Temperature sensors were installed at the center of the rebar within the concrete such that the rebar’s internal temperature changes could be determined. The numbers of and variables related to the specimens are listed in
Table 2.
The concrete that was used to create the specimens was poured under ready-mix conditions with a slump of 15 cm and a design standard strength of 21 MPa, as shown in
Table 3. For the rebar sample, commonly used D13 rebar was embedded.
Table 4 shows the strength of the concrete and rebar that were used.
3.2. Specimen Corrosion
3.2.1. Induced Rebar Corrosion Theory
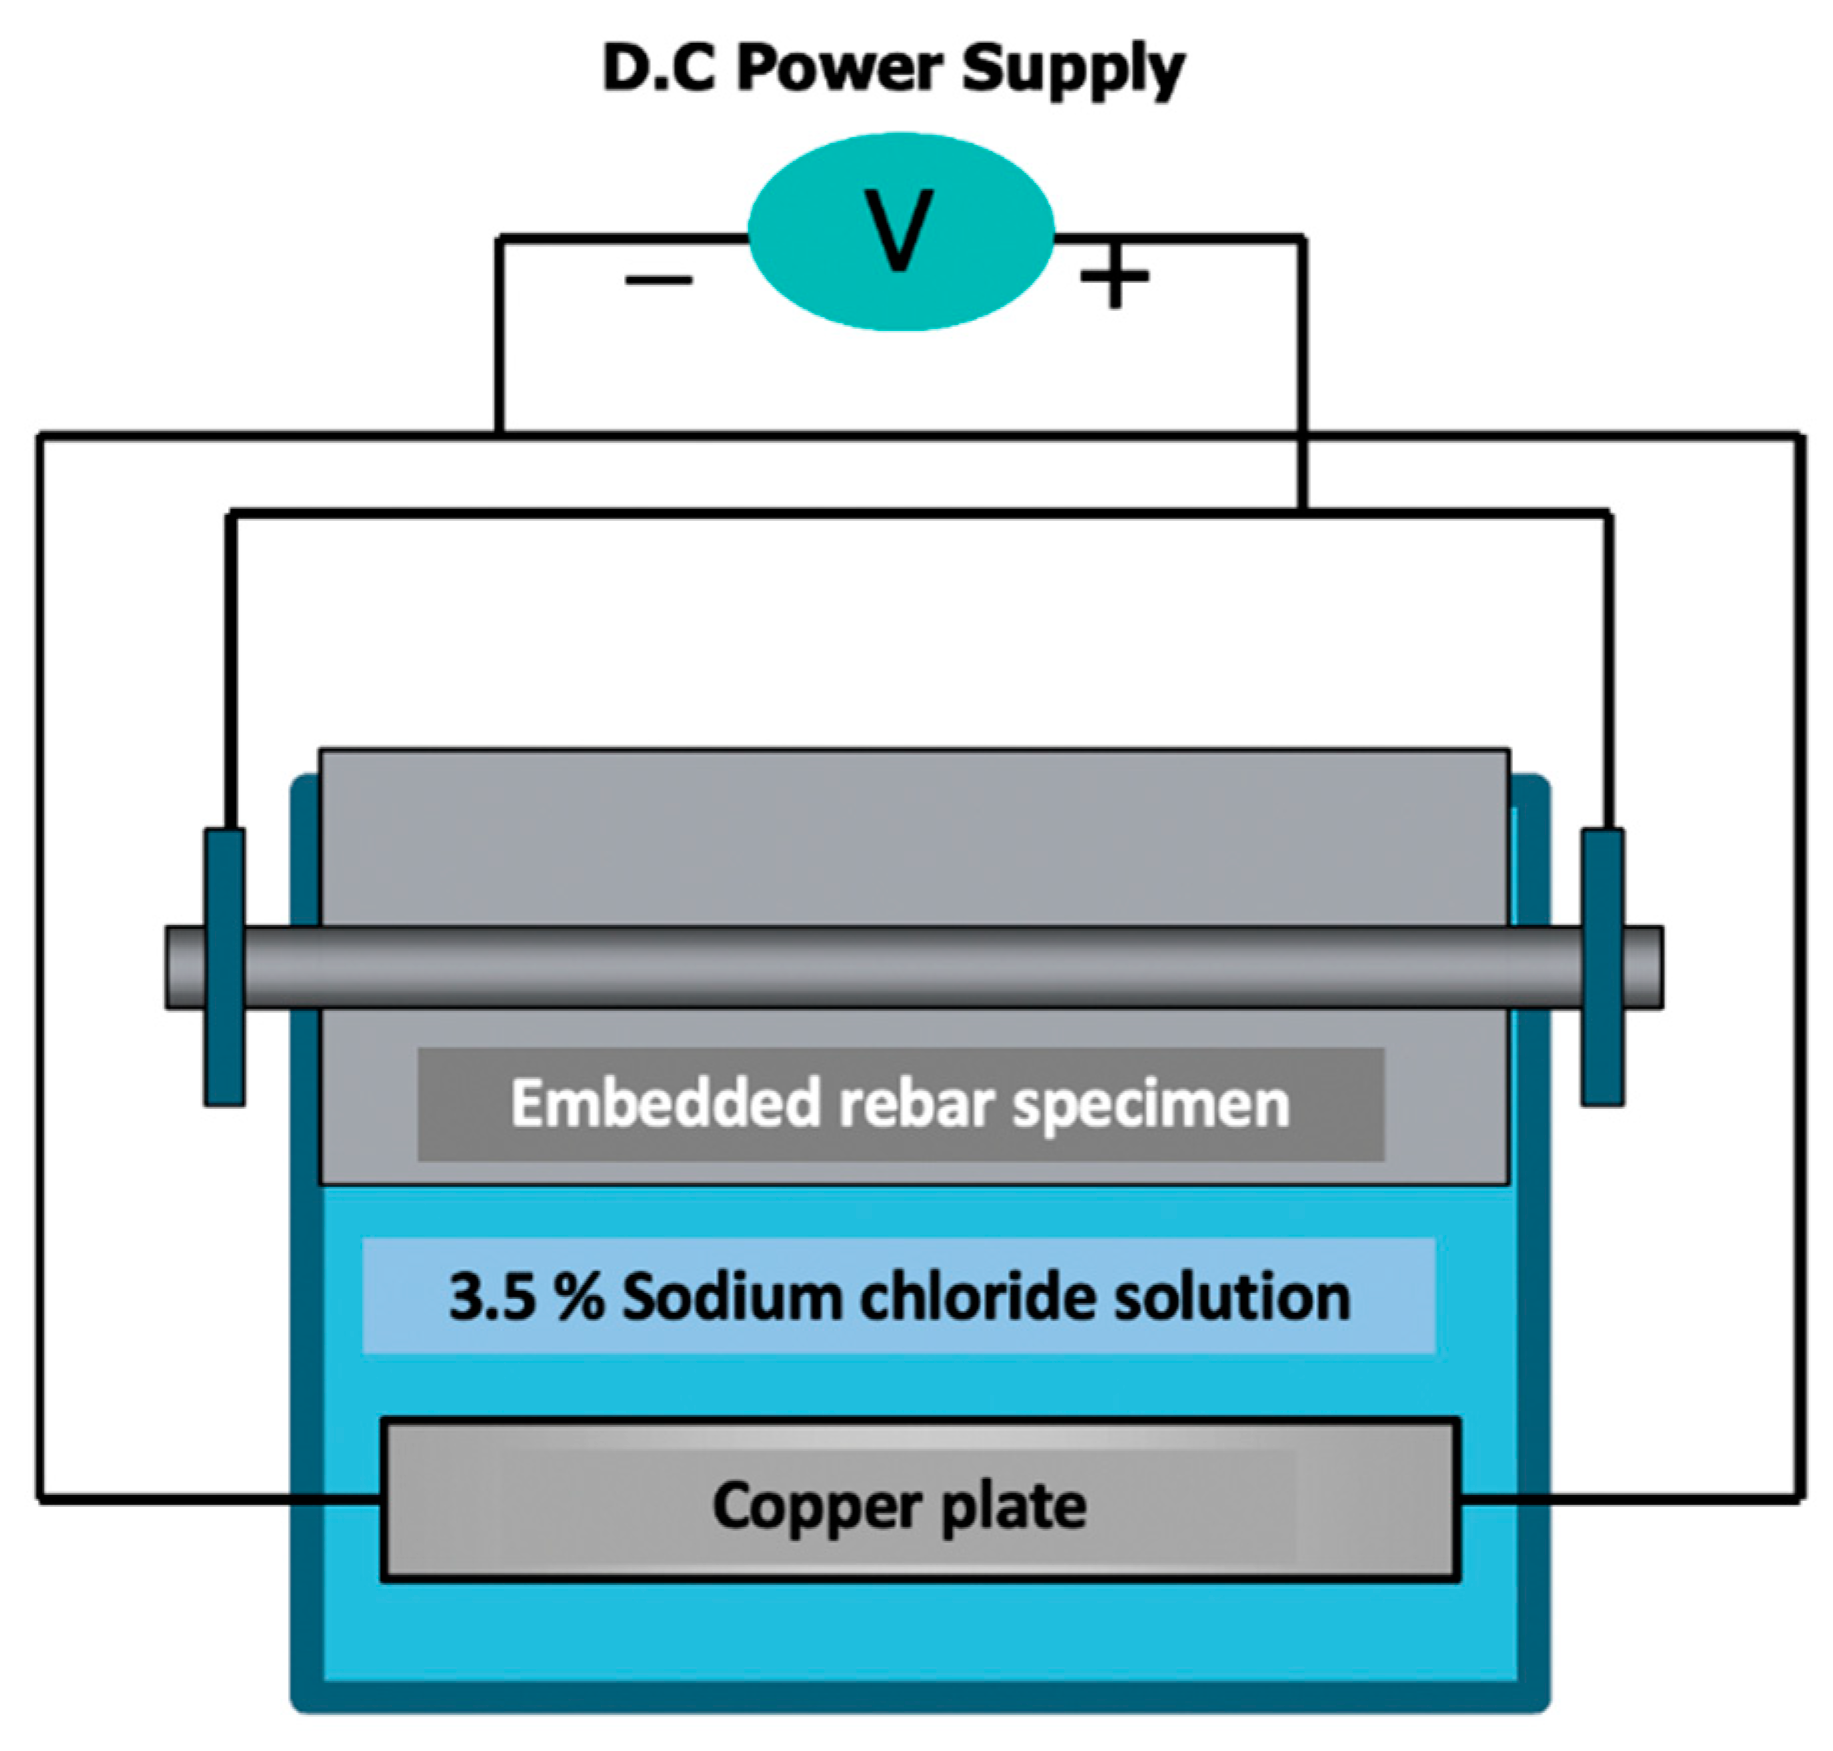
In this study, corrosion was applied using an electrochemical corrosion method that employs Faraday’s law, i.e., the law of conservation of electric charge. Corrosion was induced into the specimens using a potential difference for corrosion progression, in which the rebar within the concrete specimen is dipped into a 3.5% NaCl solution (
Figure 4 and
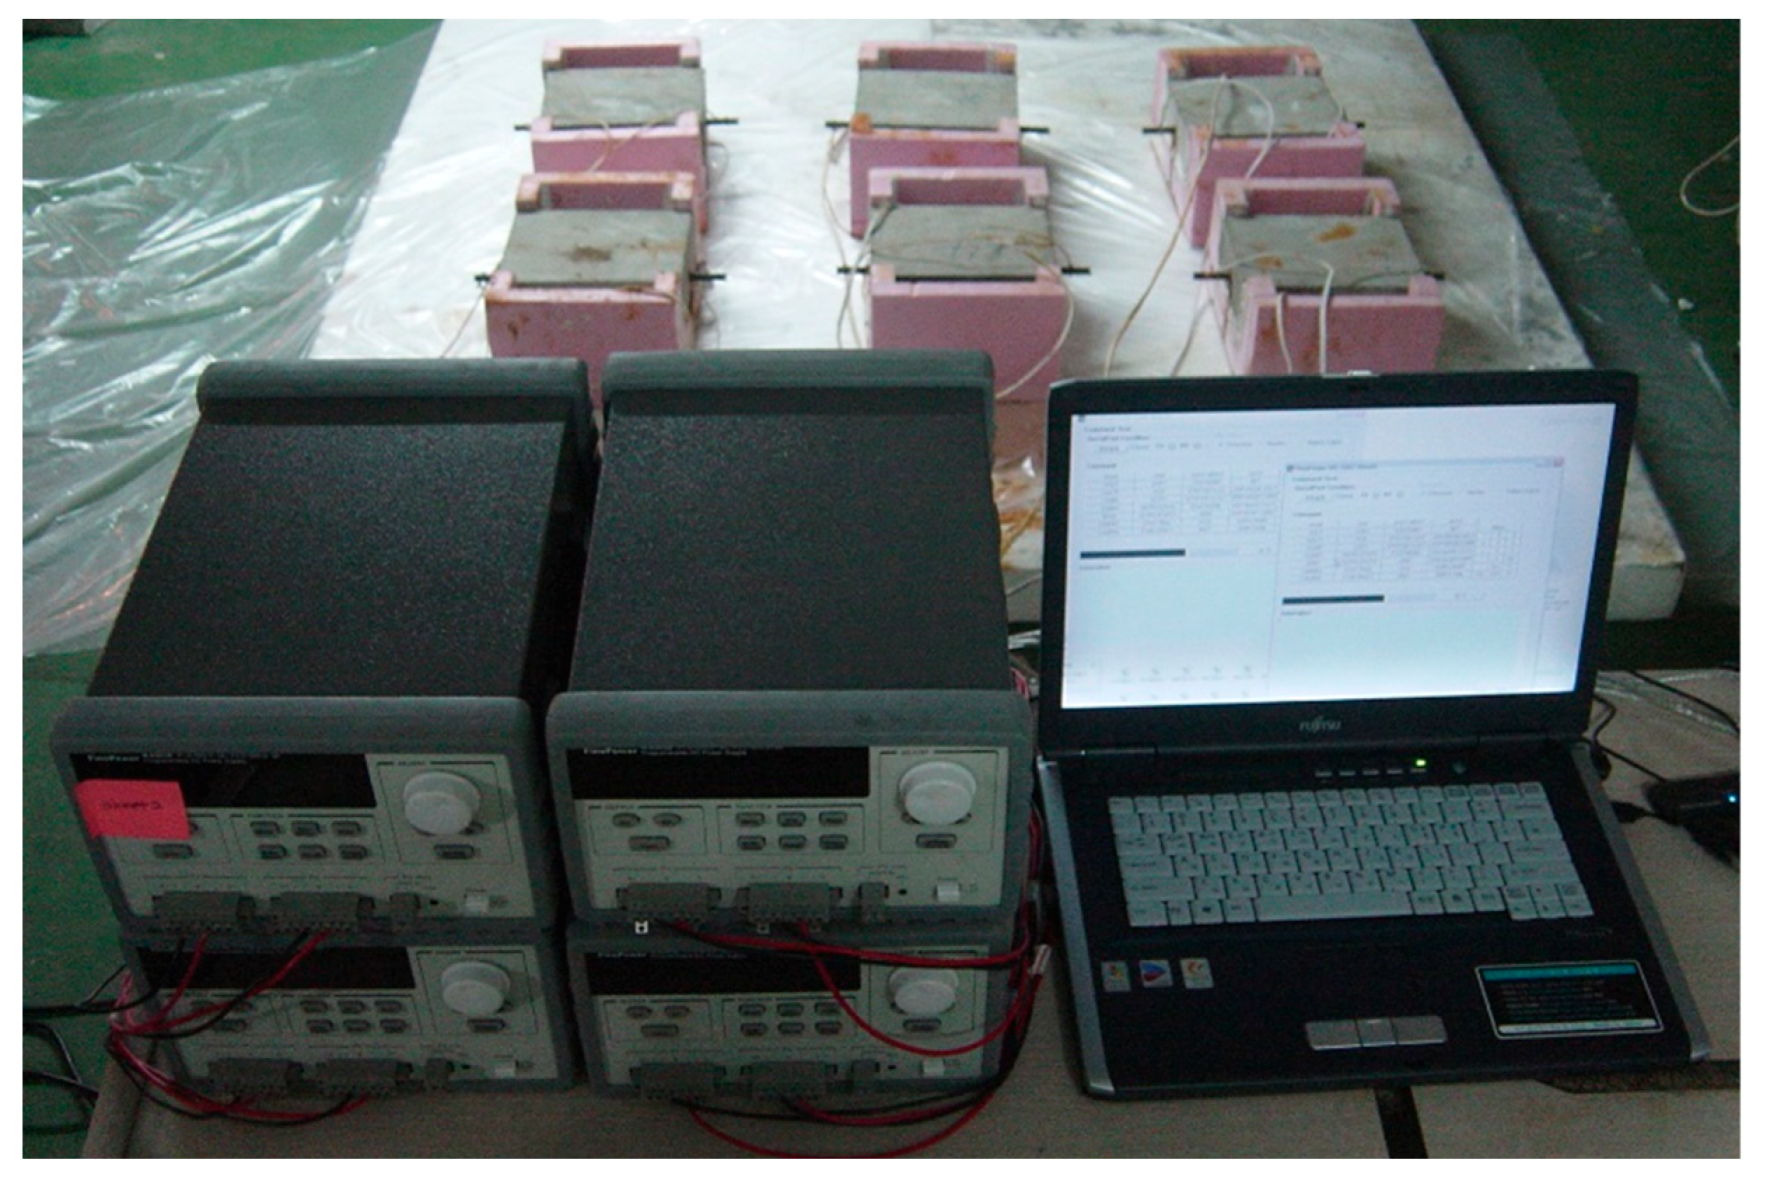
Figure 5). The positive electrode of the DC power supply was connected to the rebar and the negative electrode was connected to a copper plate. The voltage was maintained at a constant value. The current flowing through the rebar was measured at regular intervals, and Faraday’s law was used to calculate the expected corrosion ratio through mensuration by parts.
3.2.2. Building a Rebar Corrosion Automation System
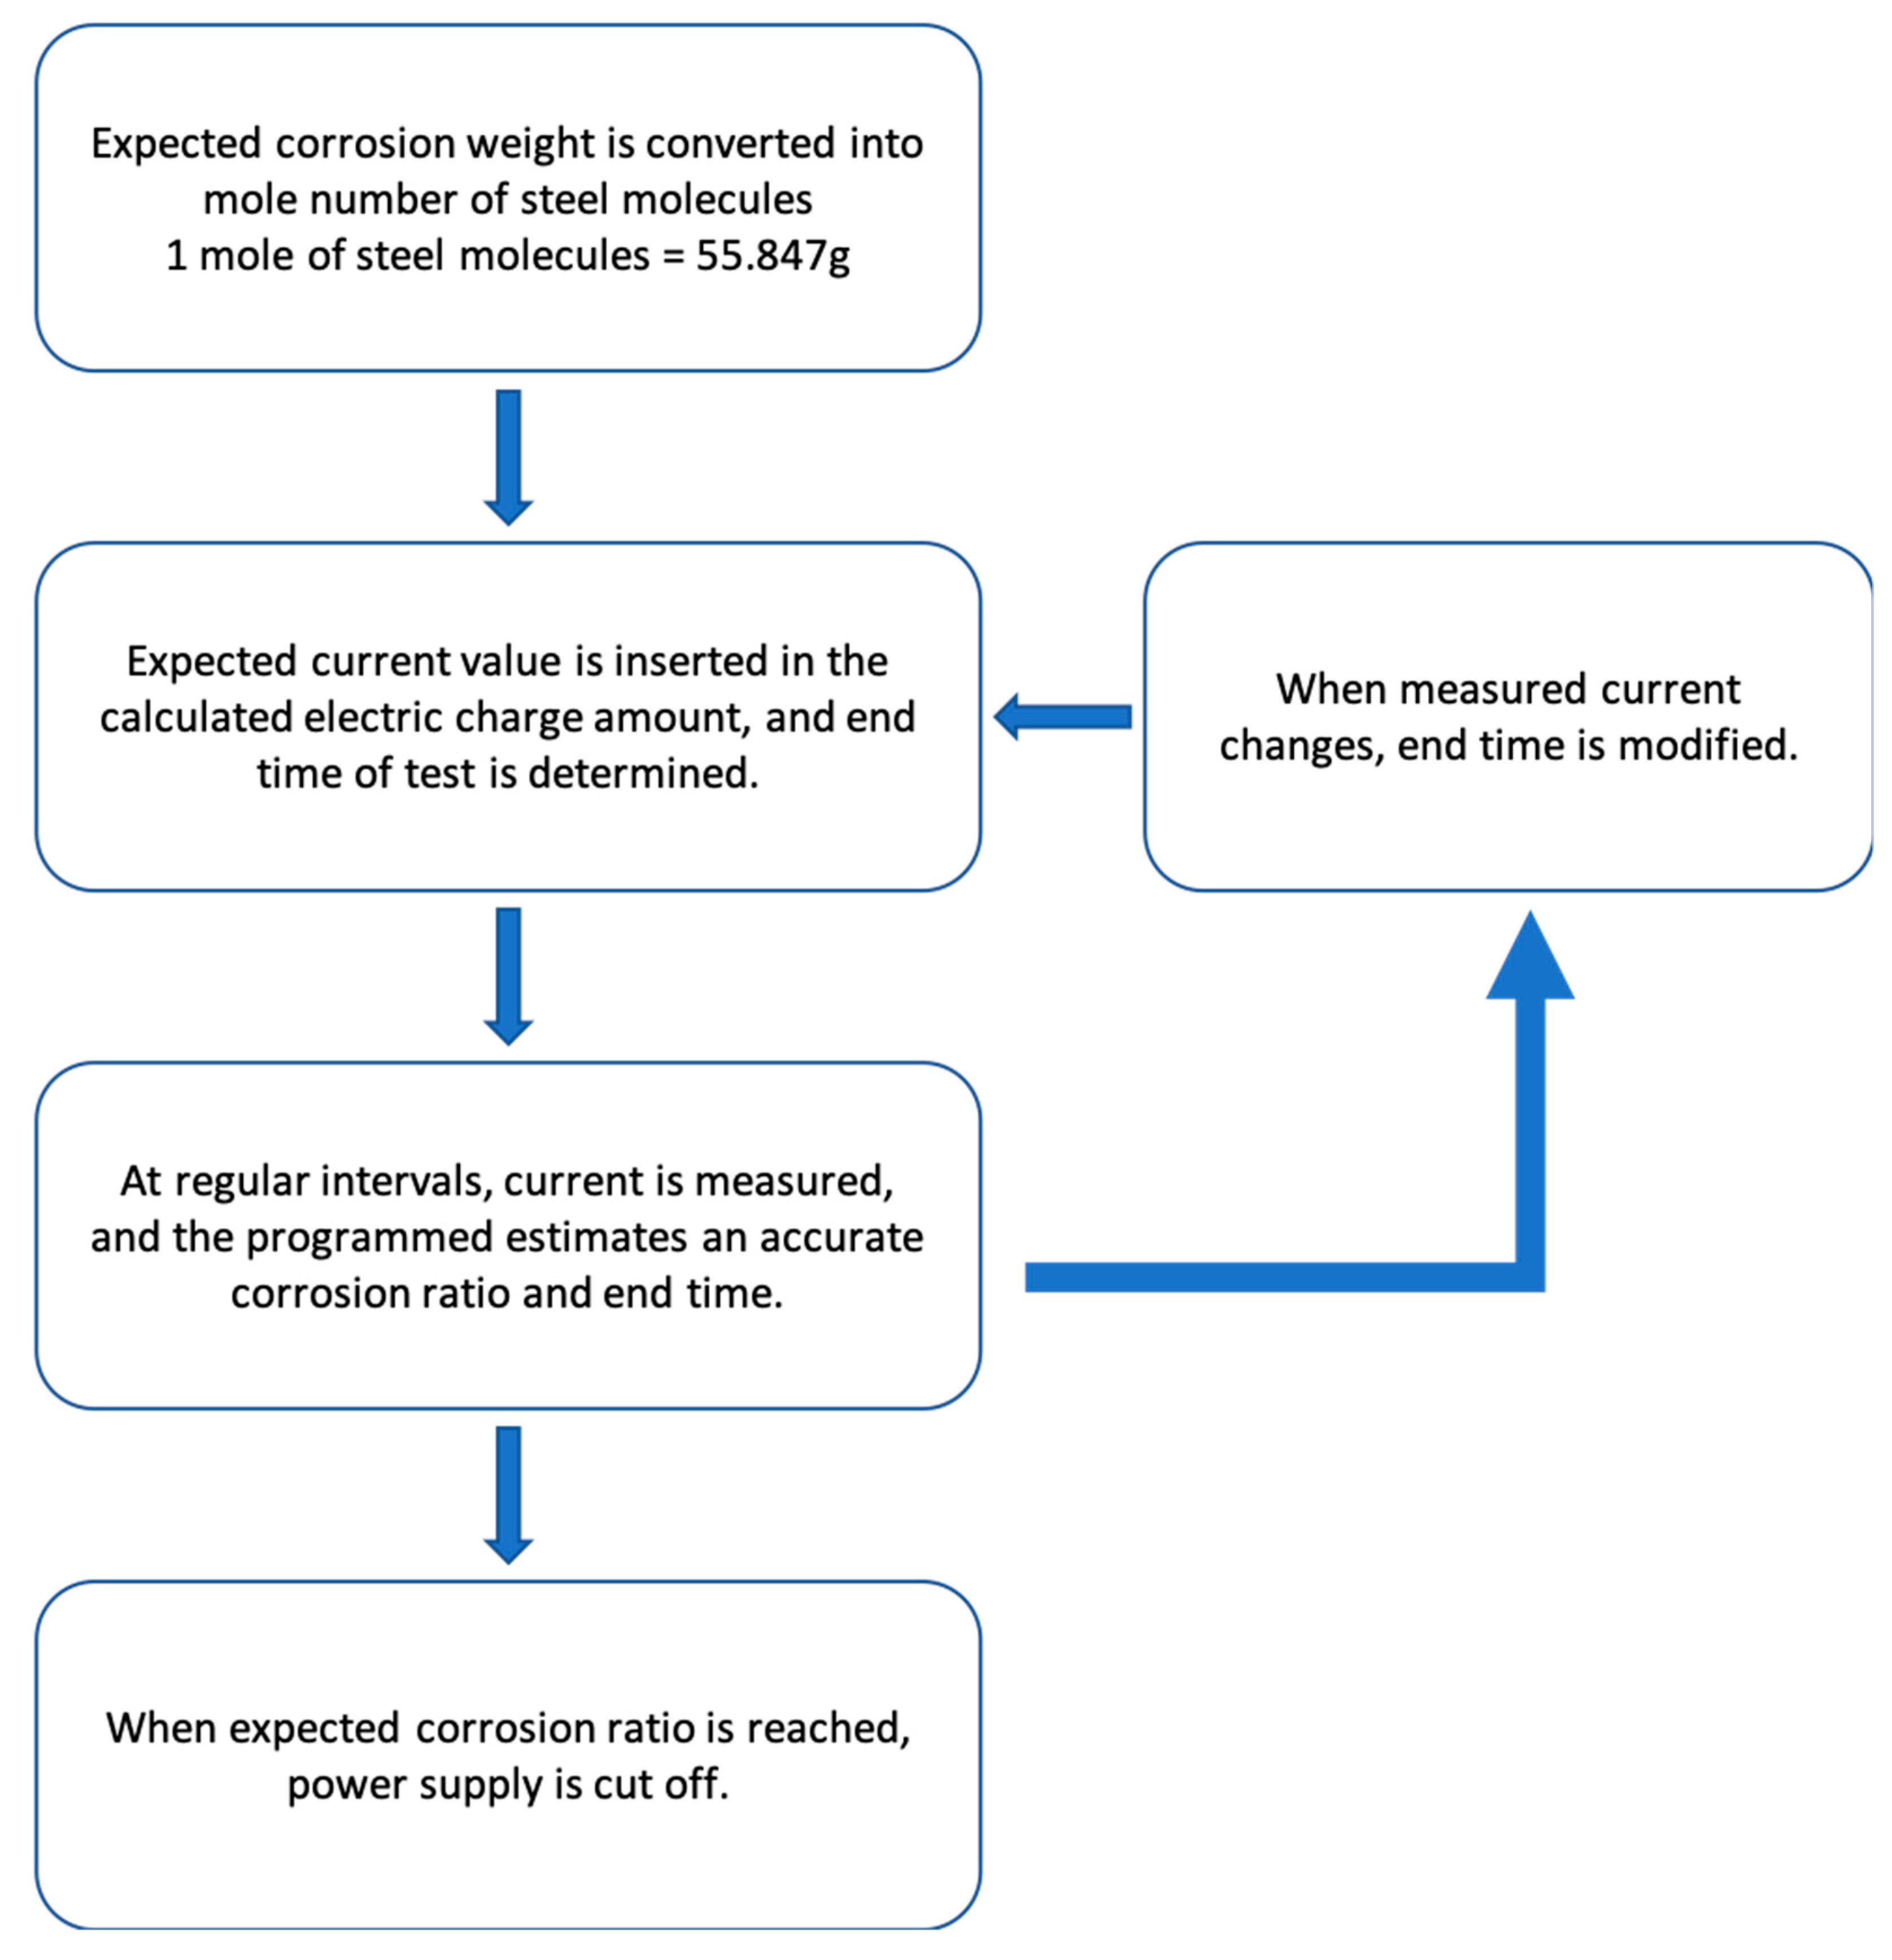
In this study, all steps were programmed according to the sequential process detailed in
Figure 4, and corrosion was induced. A rebar corrosion automation system was built using a power supply with program control. This study facilitated bidirectional control between the power supply and the computer, as well as the individual output of the two power output ports. A feature was added to turn the output off via program control when the desired cumulative voltage and current values were attained. The program system was built such that the real-time voltage and current data were automatically entered into an Excel sheet. The data acquisition intervals can be adjusted to allow the long-term progression of corrosion, without any hindrance. The program that controls the power supply was created in Microsoft Visual Basic 6.0.
In past experiments, the amount of voltage was continuously checked and directly entered into the Excel sheet as the corrosion progressed. The Excel sheet was used to frequently predict the time at which the current would be cut off, using the mensuration by parts method (Equation (3)), as the corrosion progressed. When the desired extent of corrosion was attained, the power supply was manually switched off. In this experiment, a new system was introduced in which the desired corrosion time was pre-set and current was supplied. The corrosion progressed until the pre-set extent and then the current supply was automatically cut off by the program.
where the molecular weight per mole of steel molecules = 55.847 g, Faraday’s constant (
F) = 96,500 C/mol,
q is the amount of current (A), and
t is the time (s).
The corrosion automation system that was built during this study automatically stops the corrosion process after it reaches the desired extent (see
Figure 6). Therefore, it can be used to induce corrosion more accurately and easily than the existing corrosion inducing methods.
Several rounds of preliminary experiments were performed. The results of the induced corrosion in the specimens are shown in
Table 5. In the case of the 10 mm specimen, the difference between the expected corrosion ratio and the actual corrosion ratio was minor. However, as the cover thickness increased, the actual corrosion ratio became lower than the expected corrosion ratio. It is believed that this is because the current intensity was lost as it passed through the concrete, which is a material with high specific resistance. For the specimens used in the experiment, current loss was considered, and the corrosion ratio was increased based on the corrosion results of the preliminary test specimens in order to obtain the desired corrosion rate and eliminate the difference between the expected and actual corrosion ratios.
3.3. Establishment of Optimal Infrared Camera Imaging Conditions
3.3.1. Infrared Camera Imaging Distance
The dimensions of the specimens used for infrared imaging was 250 mm × 200 mm. As a practical consideration, the effective imaging area was set as 190 mm × 140 mm, excluding 30 mm from each of the four sides directly affected by open air. For precise testing, the infrared imaging distance was set such that 70% or more of the effective imaging area can be captured, and the number of pixels in 1 mm
2 is 1 or more. In addition, the specification of infrared camera utilized in this research is indicated in
Table 6. Ultimately, the imaging distance of the experiments was set at 40 cm, at which 75% of the effective imaging area was captured and the number of pixels was 1.25/mm
2.
3.3.2. Method of Heating Rebar in Concrete Specimens
The internal rebar heating must occur simultaneously with the beginning of the heating, and a fixed heating rate must be maintained. To satisfy the experiment requirements, such as safety, while heating the entire rebar to a high temperature (100 °C or more), several heating methods were attempted experimentally, as listed in
Table 7. The methods were compared, and the most suitable one for the experimental conditions was used. This method employs an inverter welder to apply a fixed current to the rebar within the specimen and heat it.
In the connection between the specimen’s rebar and the inverter welder, it is essential that sufficient current is applied, the configuration is safe at high-voltage current, and uniform contact is achieved. Methods that can provide these benefits were examined, and preliminary experiments were performed using a method that employs a welding holder, a method that employs a crimpled terminal, and a method that employs an earth clamp. The results showed that the welding holder could not withstand a high-voltage current load. It was destroyed and could not be used. The drawback of the crimpled terminal method is that a deformed rebar is used, and therefore the deformed part of the contact point rebar must be removed. Further, there were difficulties in performing the experiments because the contact between the crimpled terminal and the rebar was not fixed, and a fixed contact point temperature could not be maintained. The earth clamp method maintained a relatively fixed rebar temperature compared to the other methods. In addition, it was possible to connect the rebar and the inverter welder safely, and it was the easiest method to use during the experiments. Therefore, the earth clamp method was used to perform the experiments.
3.3.3. Determination of Amount of Current
To determine the amount of current in the inverter welder, i.e., the heating temperature, for each concrete cover thickness, the heating time was fixed at 5 min, and the amount of current was changed as shown in
Table 8 to observe the changes in temperature with respect to the amount of current.
Table 9 compares the temperature increase at the surface of the concrete and in the rebar within the concrete. The currents listed in the table were used to heat specimens with a concrete cover thickness of 10 mm and corrosion ratios of 0% and 10%, for 300 s. When a current of less than 100 A was applied, the internal rebar could not be heated sufficiently. When the current was increased, the internal rebar temperature increased by a greater amount. However, when the internal rebar temperature was greater than a fixed temperature, the difference in the maximum surface temperature at each corrosion ratio was reduced. Therefore, the rebar temperature was set higher than the fixed temperature, and the amount of heating current applied to the specimen, with a cover thickness of 10 mm, was set at 150 A. At this condition there was a significant difference in the maximum surface temperature. The shaded part in
Table 9 shows the amount of current used in the experiments. For the specimens with cover thicknesses of 20 mm and 30 mm, the amounts of current were determined similarly. As can be seen in
Table 10 and
Table 11, the rebar temperature was increased to more than a set amount, and the amount of heating current was set at 200 A for the specimen with a cover thickness of 20 mm and 250 A for the specimen with a cover thickness of 30 mm, at which there was a large difference in the maximum surface temperature. The shaded parts in
Table 10 and
Table 11 show the amounts of current used in the experiments.
3.3.4. Determination of Heating Time
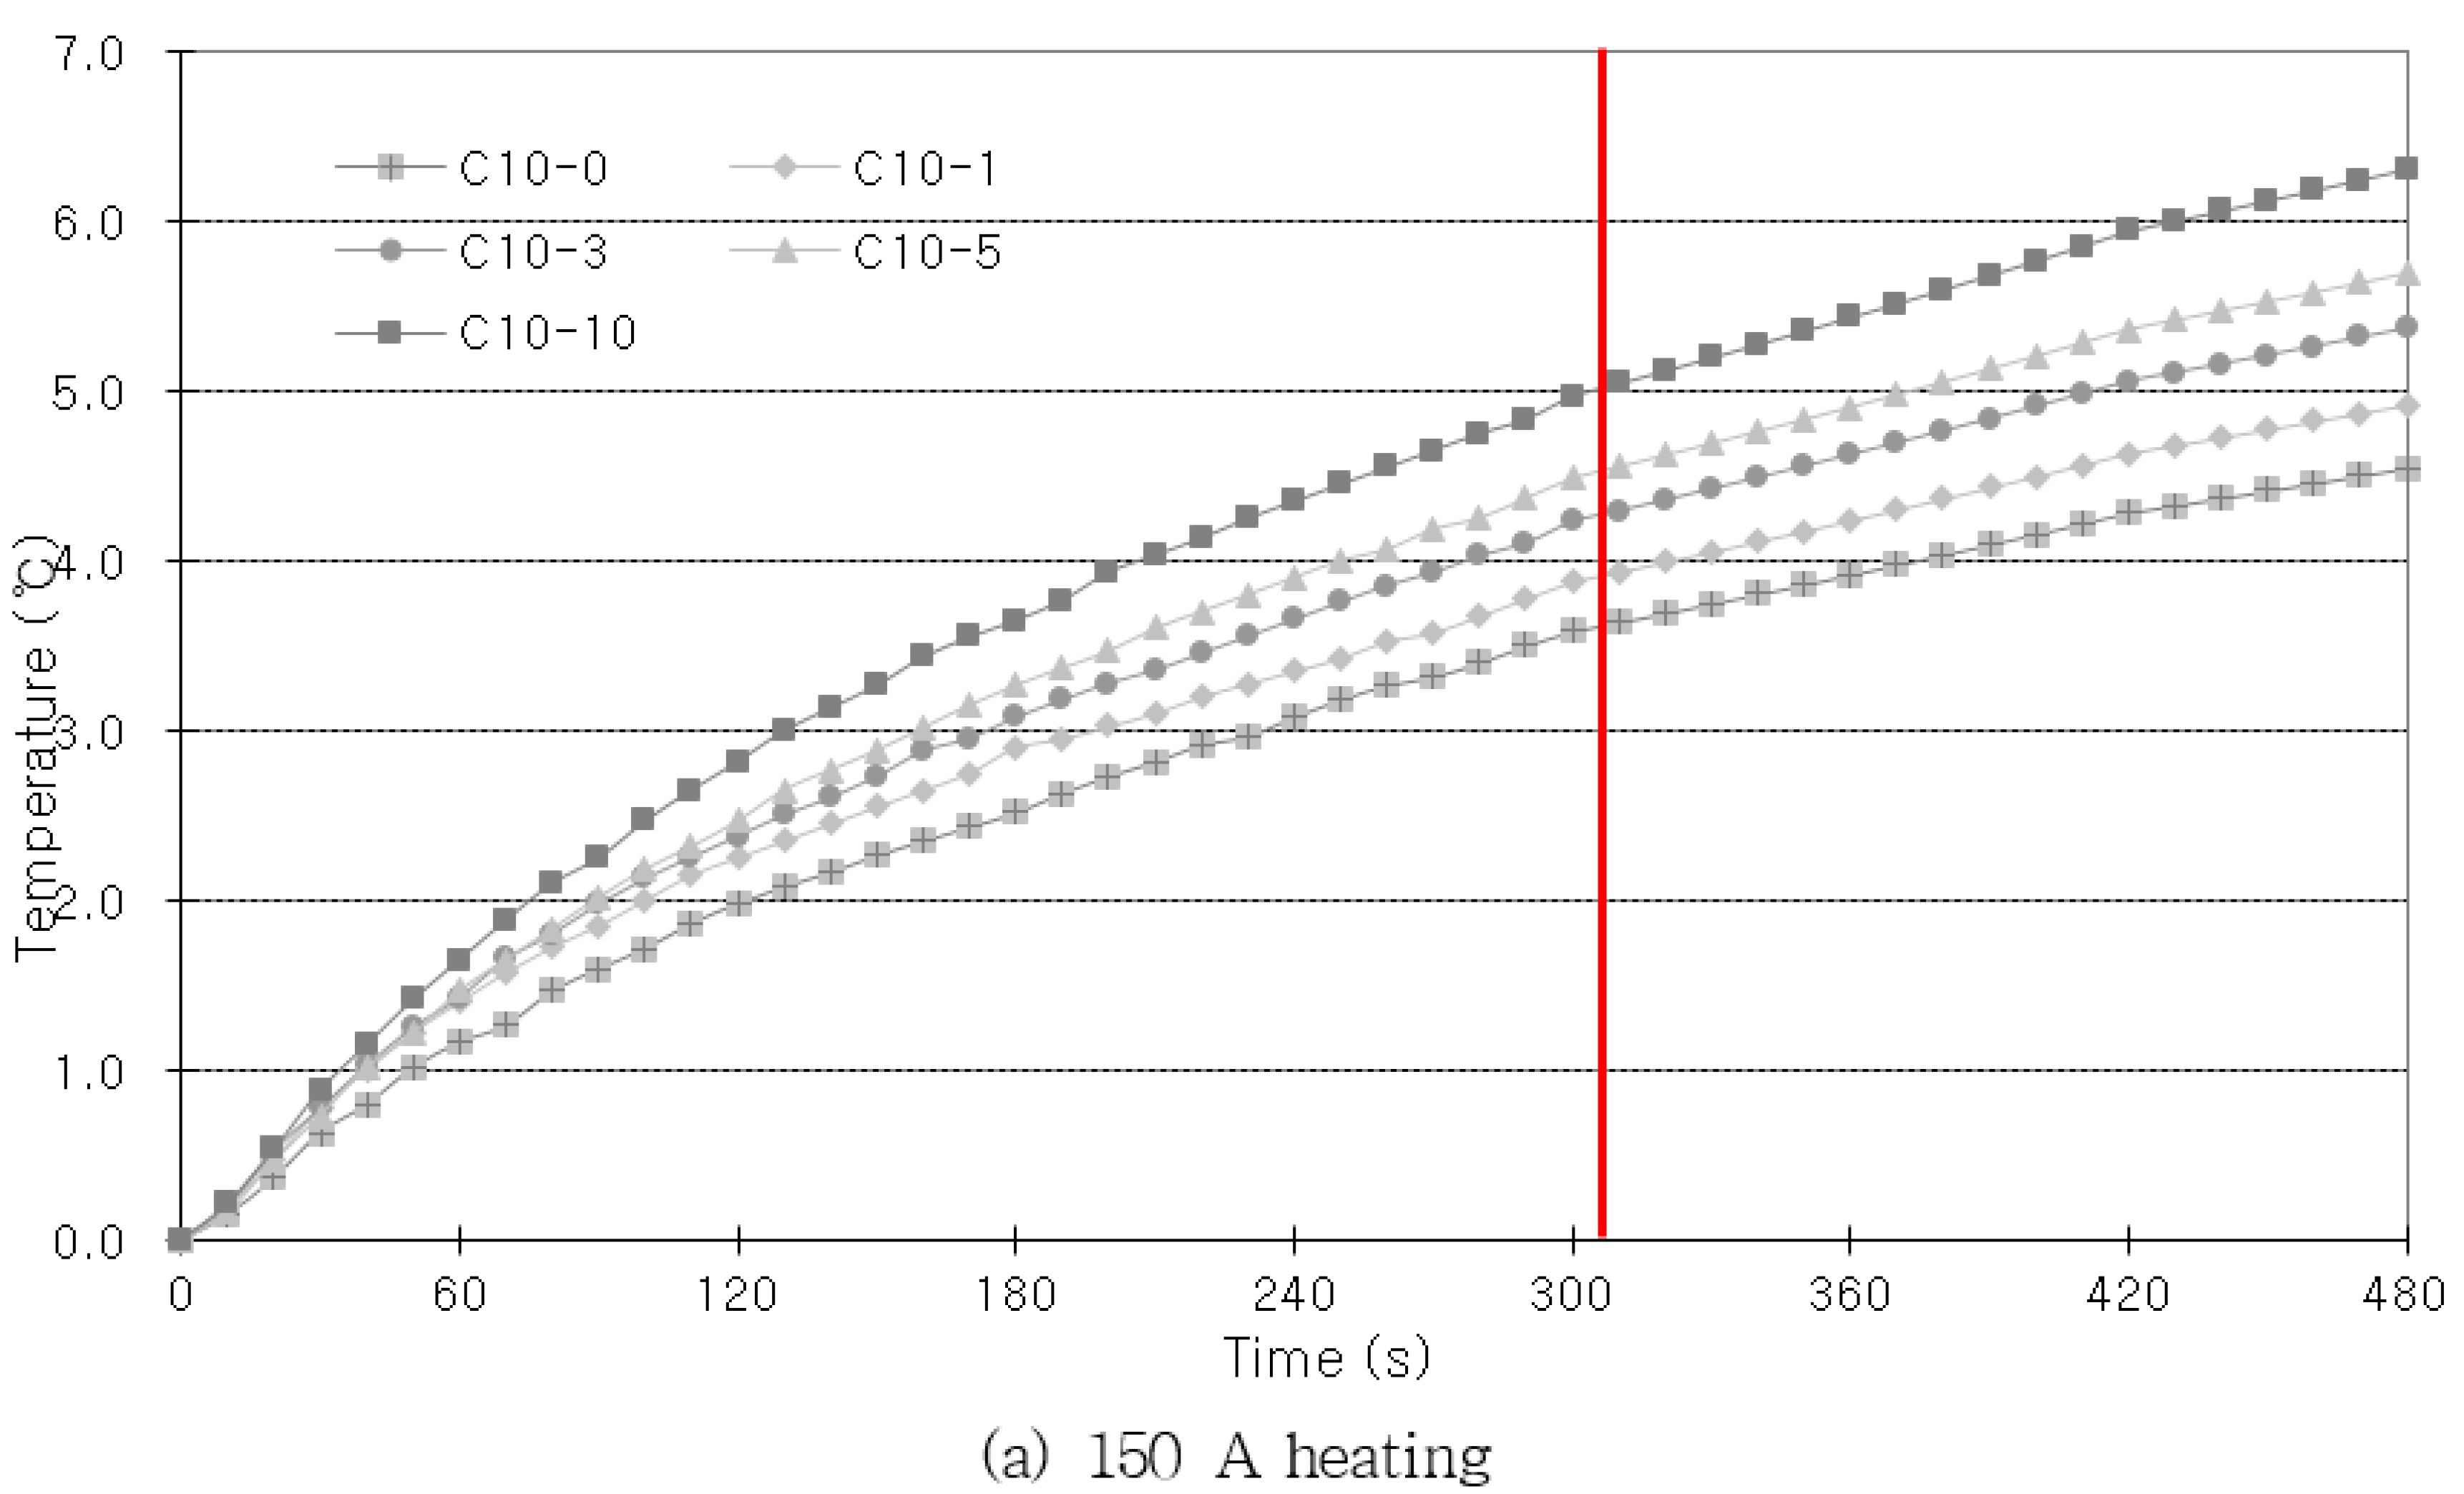
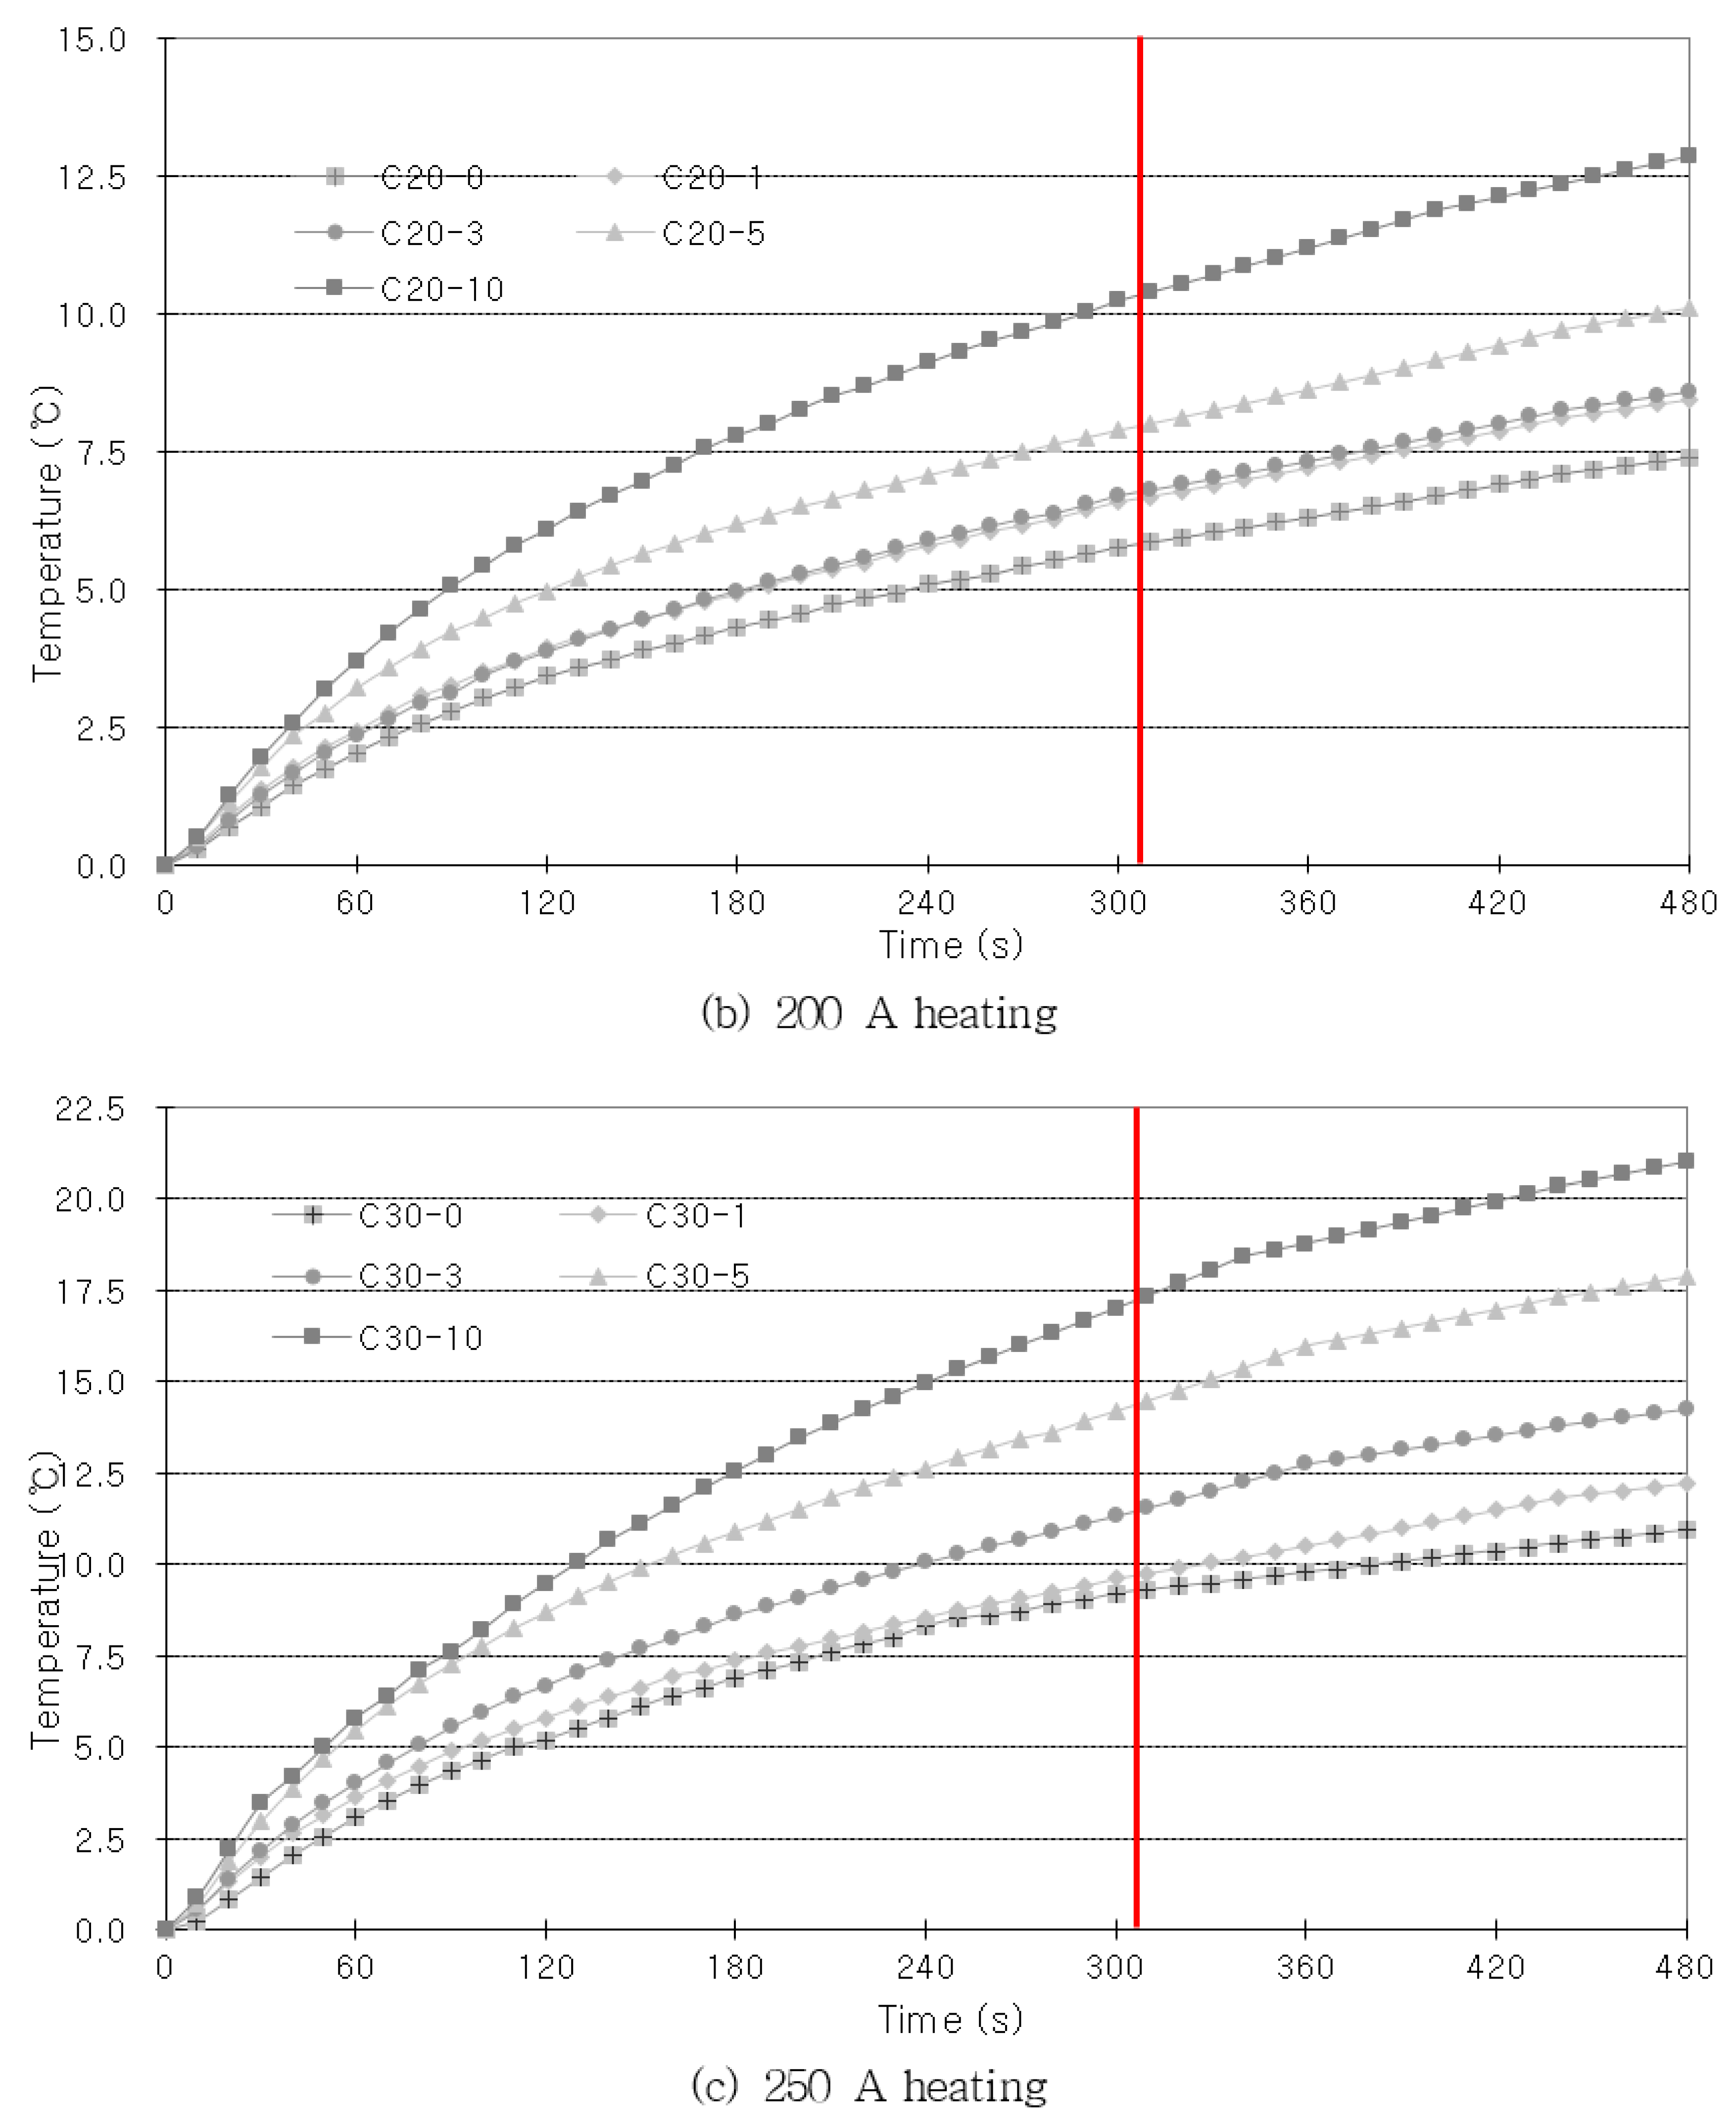
As shown in
Figure 7, the amount by which the rebar temperature rises increases as the heating time increases. However, when the specimen is heated for a longer period of time, there is a possibility that the influence of external factors will be that much greater. Hence, the imaging process must be quick for practical applications in the field. Therefore, the heating time was set as the time at which the increase in the concrete’s internal rebar temperature went beyond a fixed value. When high current was applied to provide heating, the temperature rose rapidly at first, but after a fixed period of time, the increase in temperature gradually reduced. Considering that the amount of temperature increase reduced after 300 s, when the highest current that was used in the experiments (250 A) was applied, the heating time was set at 300 s. Once the heating was ceased, the specimen was left to cool at room temperature for 180 s, so that the concrete’s internal rebar heat could spread to the concrete surface. The temperature changes were captured with an infrared camera. The infrared imaging was performed once every 30 s, and 16 thermography data values were captured for each specimen.
3.4. Building the IRT Database
3.4.1. IRT Imaging
In this study, we planned to capture 16 data values for each of the 270 variables. The database was composed of 4320 captured data values. The detailed infrared imaging plan was designed as follows:
- (1)
Number of specimens: 6 (degrees of corrosion) × 3 (cover thickness) × 3 (specimens) = 54;
- (2)
Number of infrared imaging rounds: 54 (specimens) × 5 (air temperature) = 270 rounds;
- (3)
Number of data values: 270 (rounds of infrared imaging) × 16 (30 s intervals, 480 s of imaging) = 4320.
As shown in
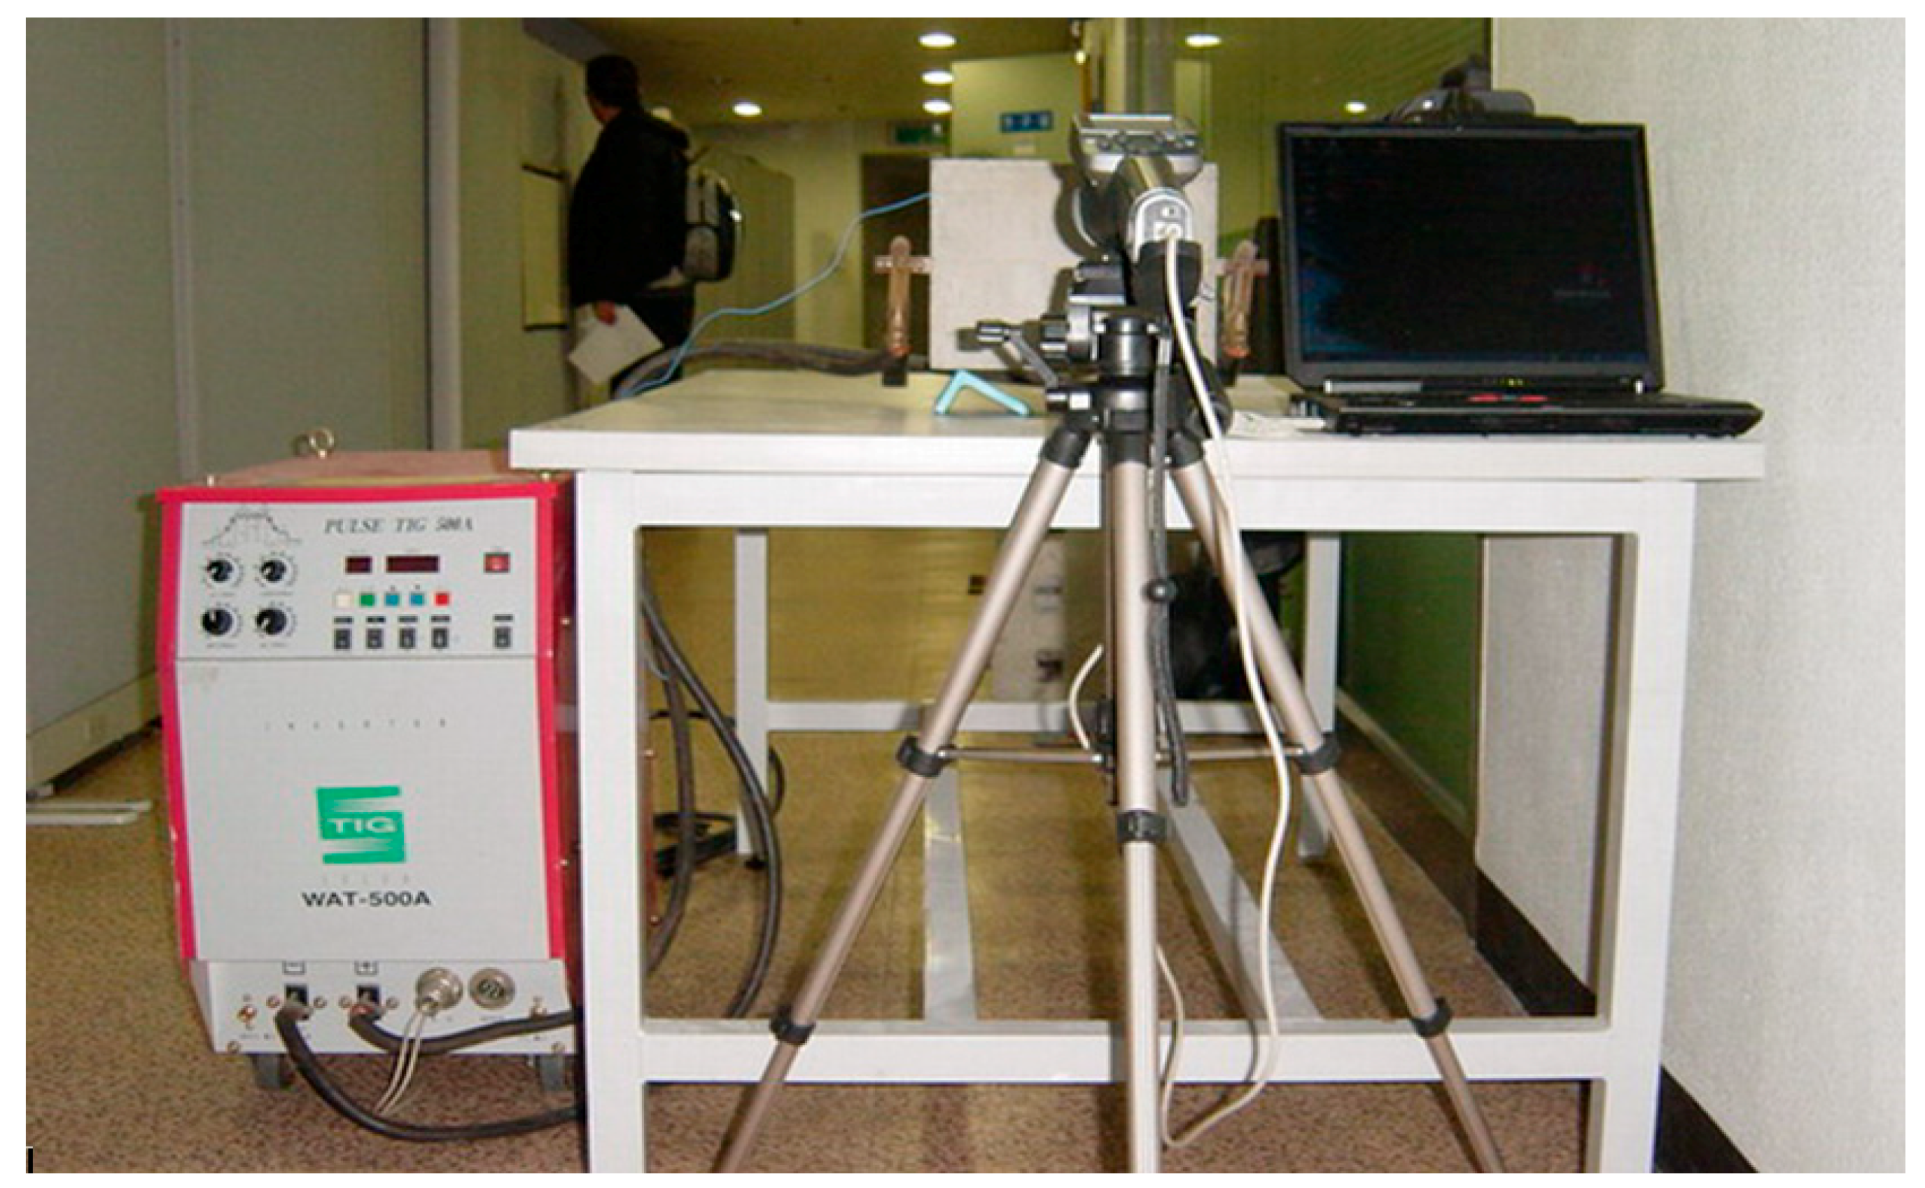
Figure 8, an inverter welder was used at both ends of the target structure’s rebar, and current was applied. While maintaining a 40 cm distance from the concrete surface, a chamber was used to shoot infrared images. Thus, the infrared imaging system was built. Next, the electric heater was used to apply 150 A of current to the 10 mm cover specimen, 200 A to the 20 mm cover specimen, and 250 A to the 30 mm cover specimen. The rebar of each specimen was heated for 300 s while the thermography data were collected. Even after the current was cut off 300 s after the heating began, the specimens were left at a high temperature for 180 s, and the system continued to collect thermography data. At this time, the infrared camera was used at 30 s intervals to capture the thermographic data. The system was able to obtain 16 thermographic data values for each specimen.
Because thermography data are significantly affected by the surrounding environment, including the atmosphere, temperature, and humidity, the experiments were performed indoors, without the effect of direct solar radiation and wind, to reduce the number of factors that impacted the experiments. To minimize the impact of changes in the atmospheric conditions, the thermography data were captured while maintaining atmospheric temperatures of 16, 21, 25, and 28 °C and a humidity of 60% (±10%).
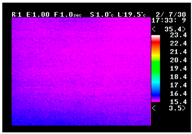
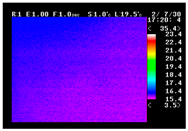
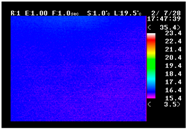
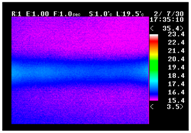
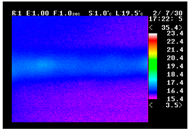
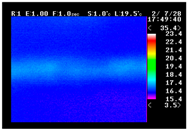
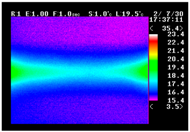
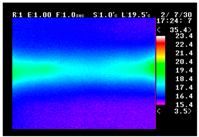
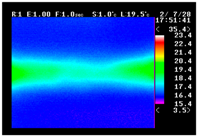
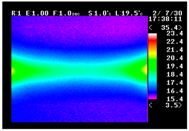
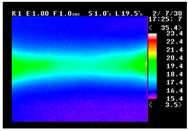
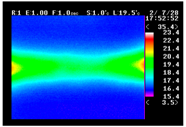
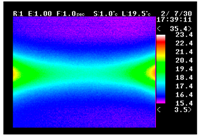
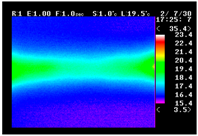
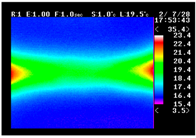
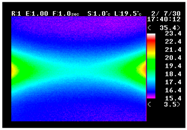
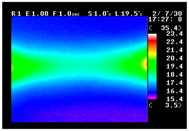
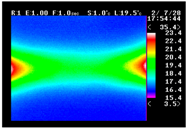
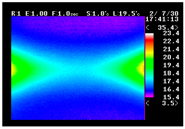
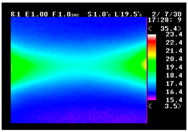
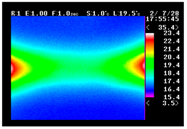
Table 11 shows the IRT of specimens with cover thickness of 10 mm and corrosion ratios of 0%, 5%, and 10% when the air temperature was 16 °C. It can be seen that the surface temperature of concrete gradually rose, starting at the part near the heating unit as 120, 240, and 300 s passed. Even when rebar heating was stopped after 300 s, the concrete surface temperature continued to increase. The thermography of specimens with corrosion ratios of 0%, 5%, and 10% were compared, and it was found that as the rebar corrosion ratio increased, the amount of heat that was transferred to the specimen concrete surface also increased.
There was a difference in the increase in heat with respect to the cover thickness, but like the specimens with cover thickness of 10 mm, there was an increase in the heat transferred to the specimen concrete surface with the increase in the corrosion ratio. As shown in the section in white in
Table 12, 3.12–3.13 is the temperature range that is above the level range that is shown in color when the infrared camera is set before imaging. It shows the high temperature of the temperature distribution of the thermography.
3.4.2. IRT Analysis
Height of Temperature Distribution Curve
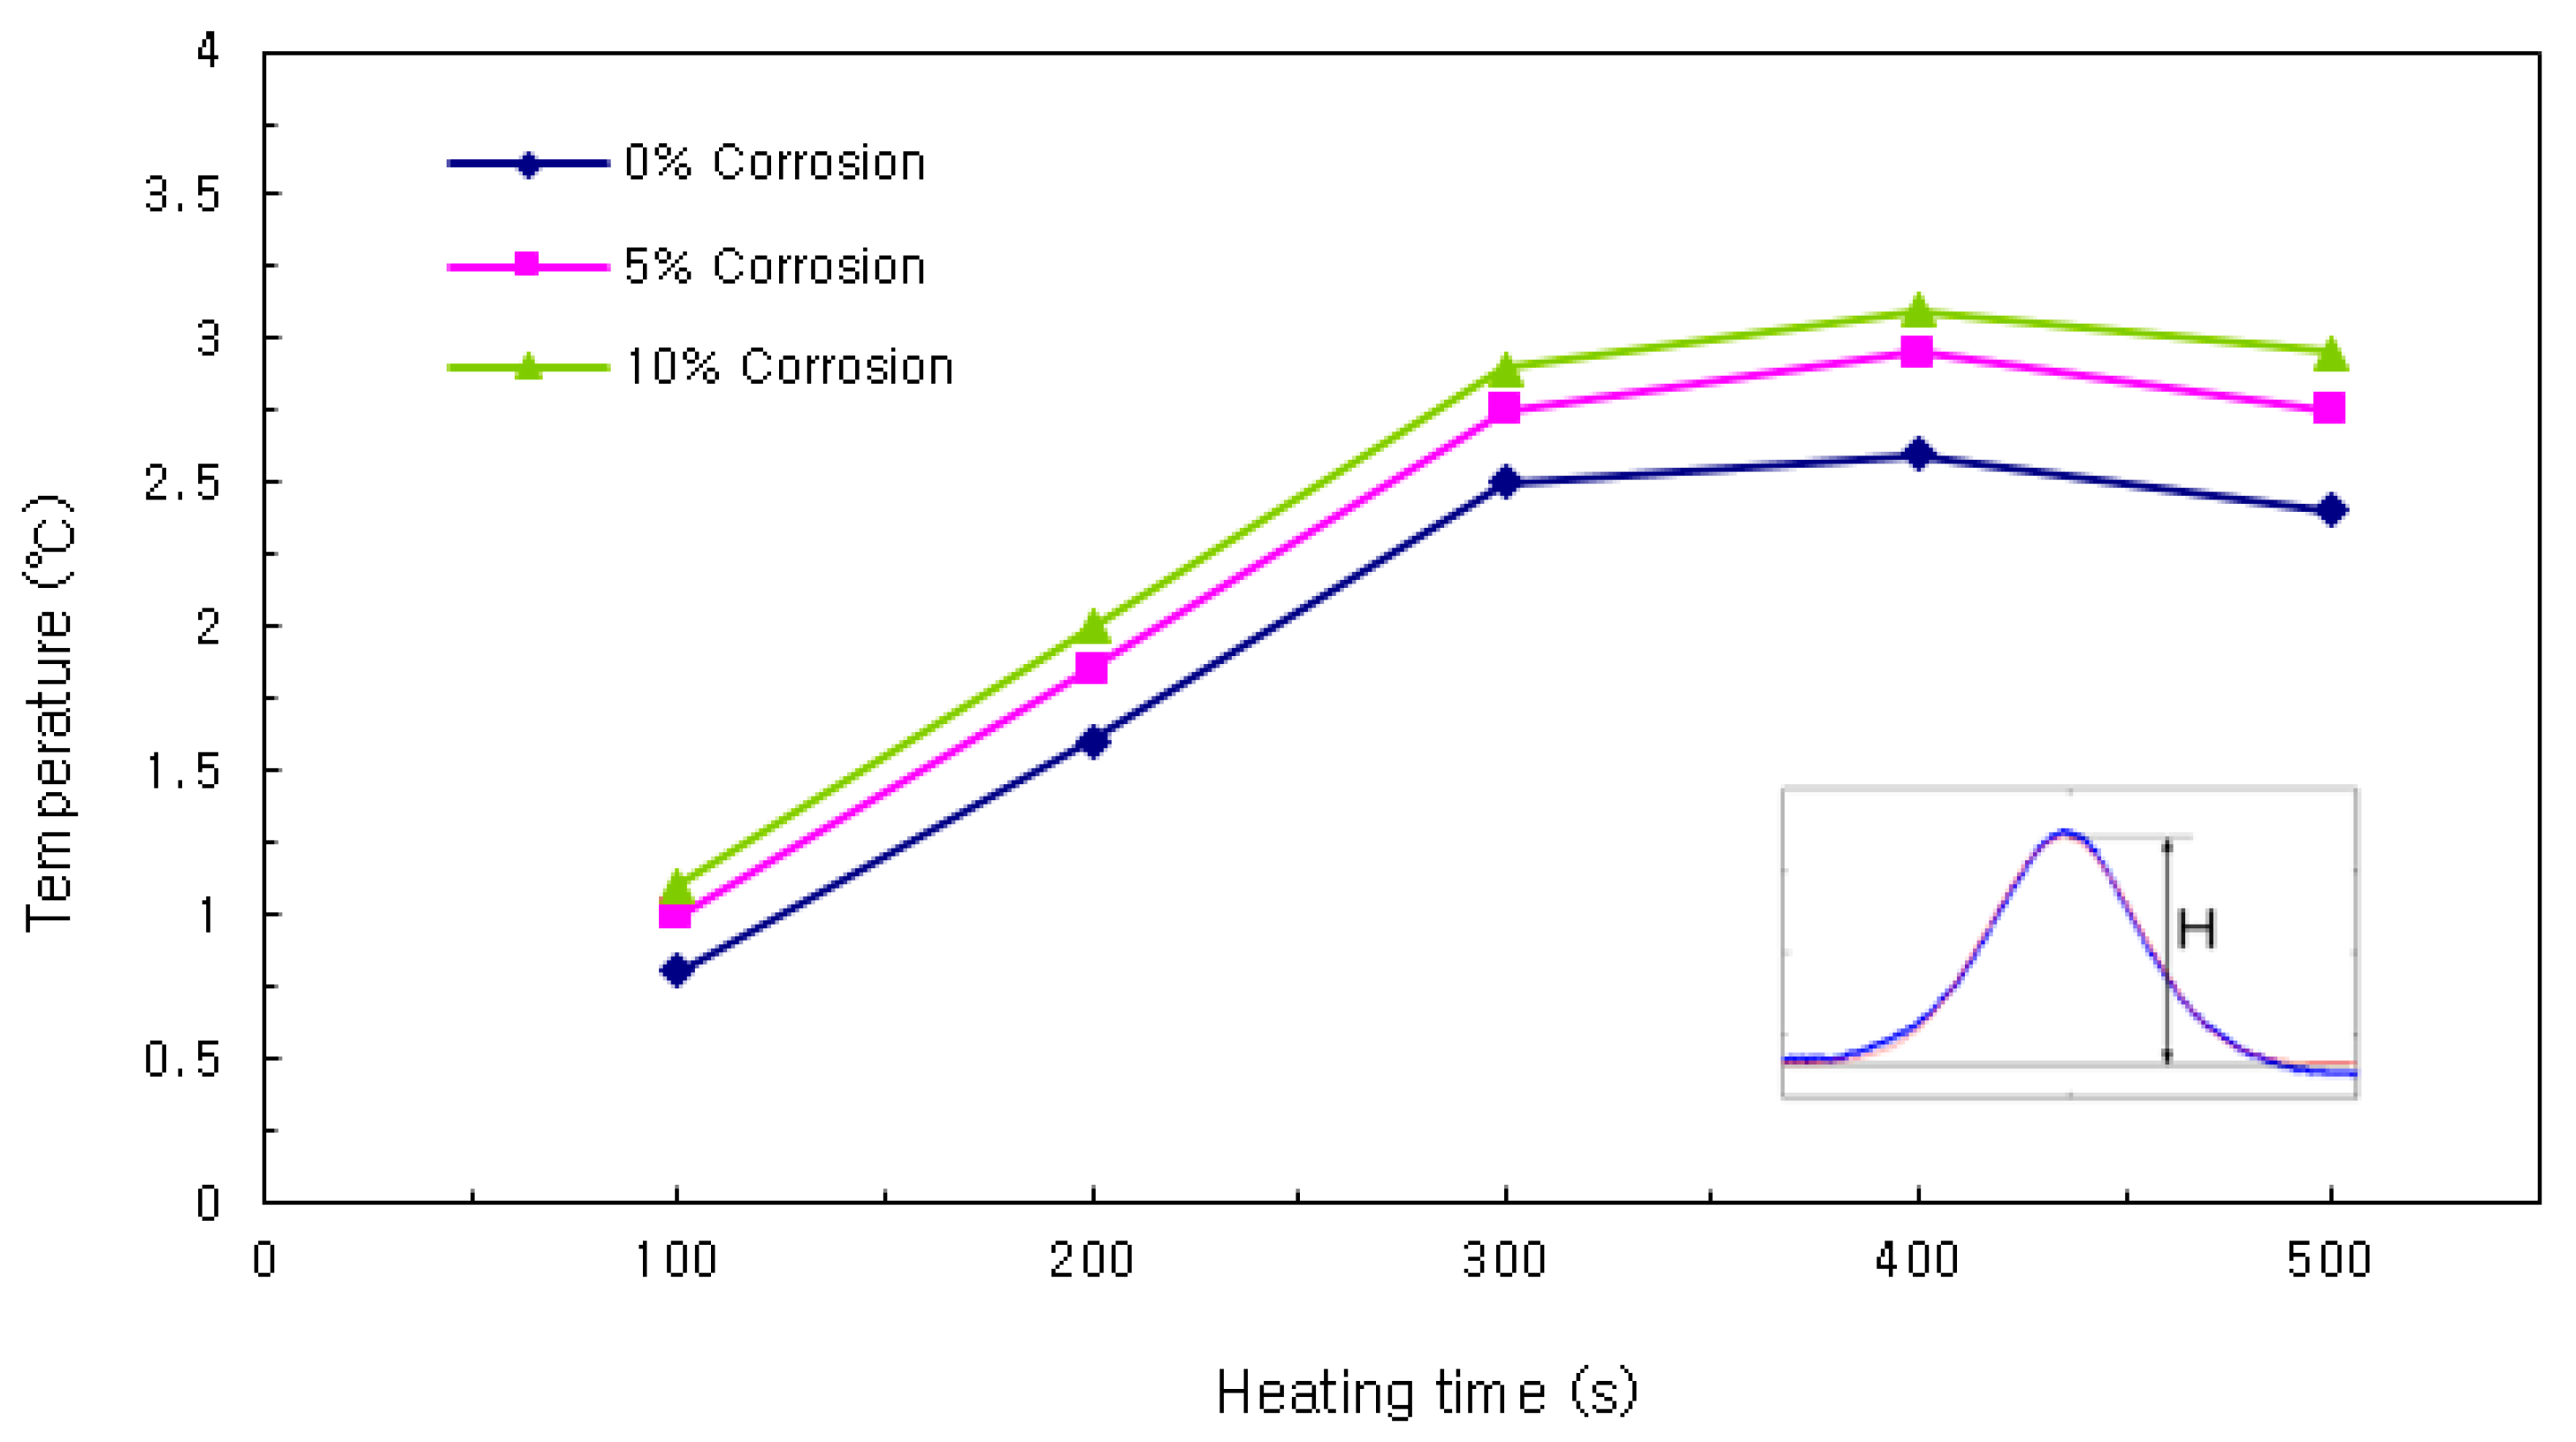
Firstly, the heights of the temperature distribution curves were compared. As shown in
Figure 9, the height increased with the heating time. After the heating was ceased, the slope became more gradual as the cover thickness decreased. In the results of this comparison, the trend of temperature change with the corrosion ratio is most clear.
Width of Temperature Distribution Curve
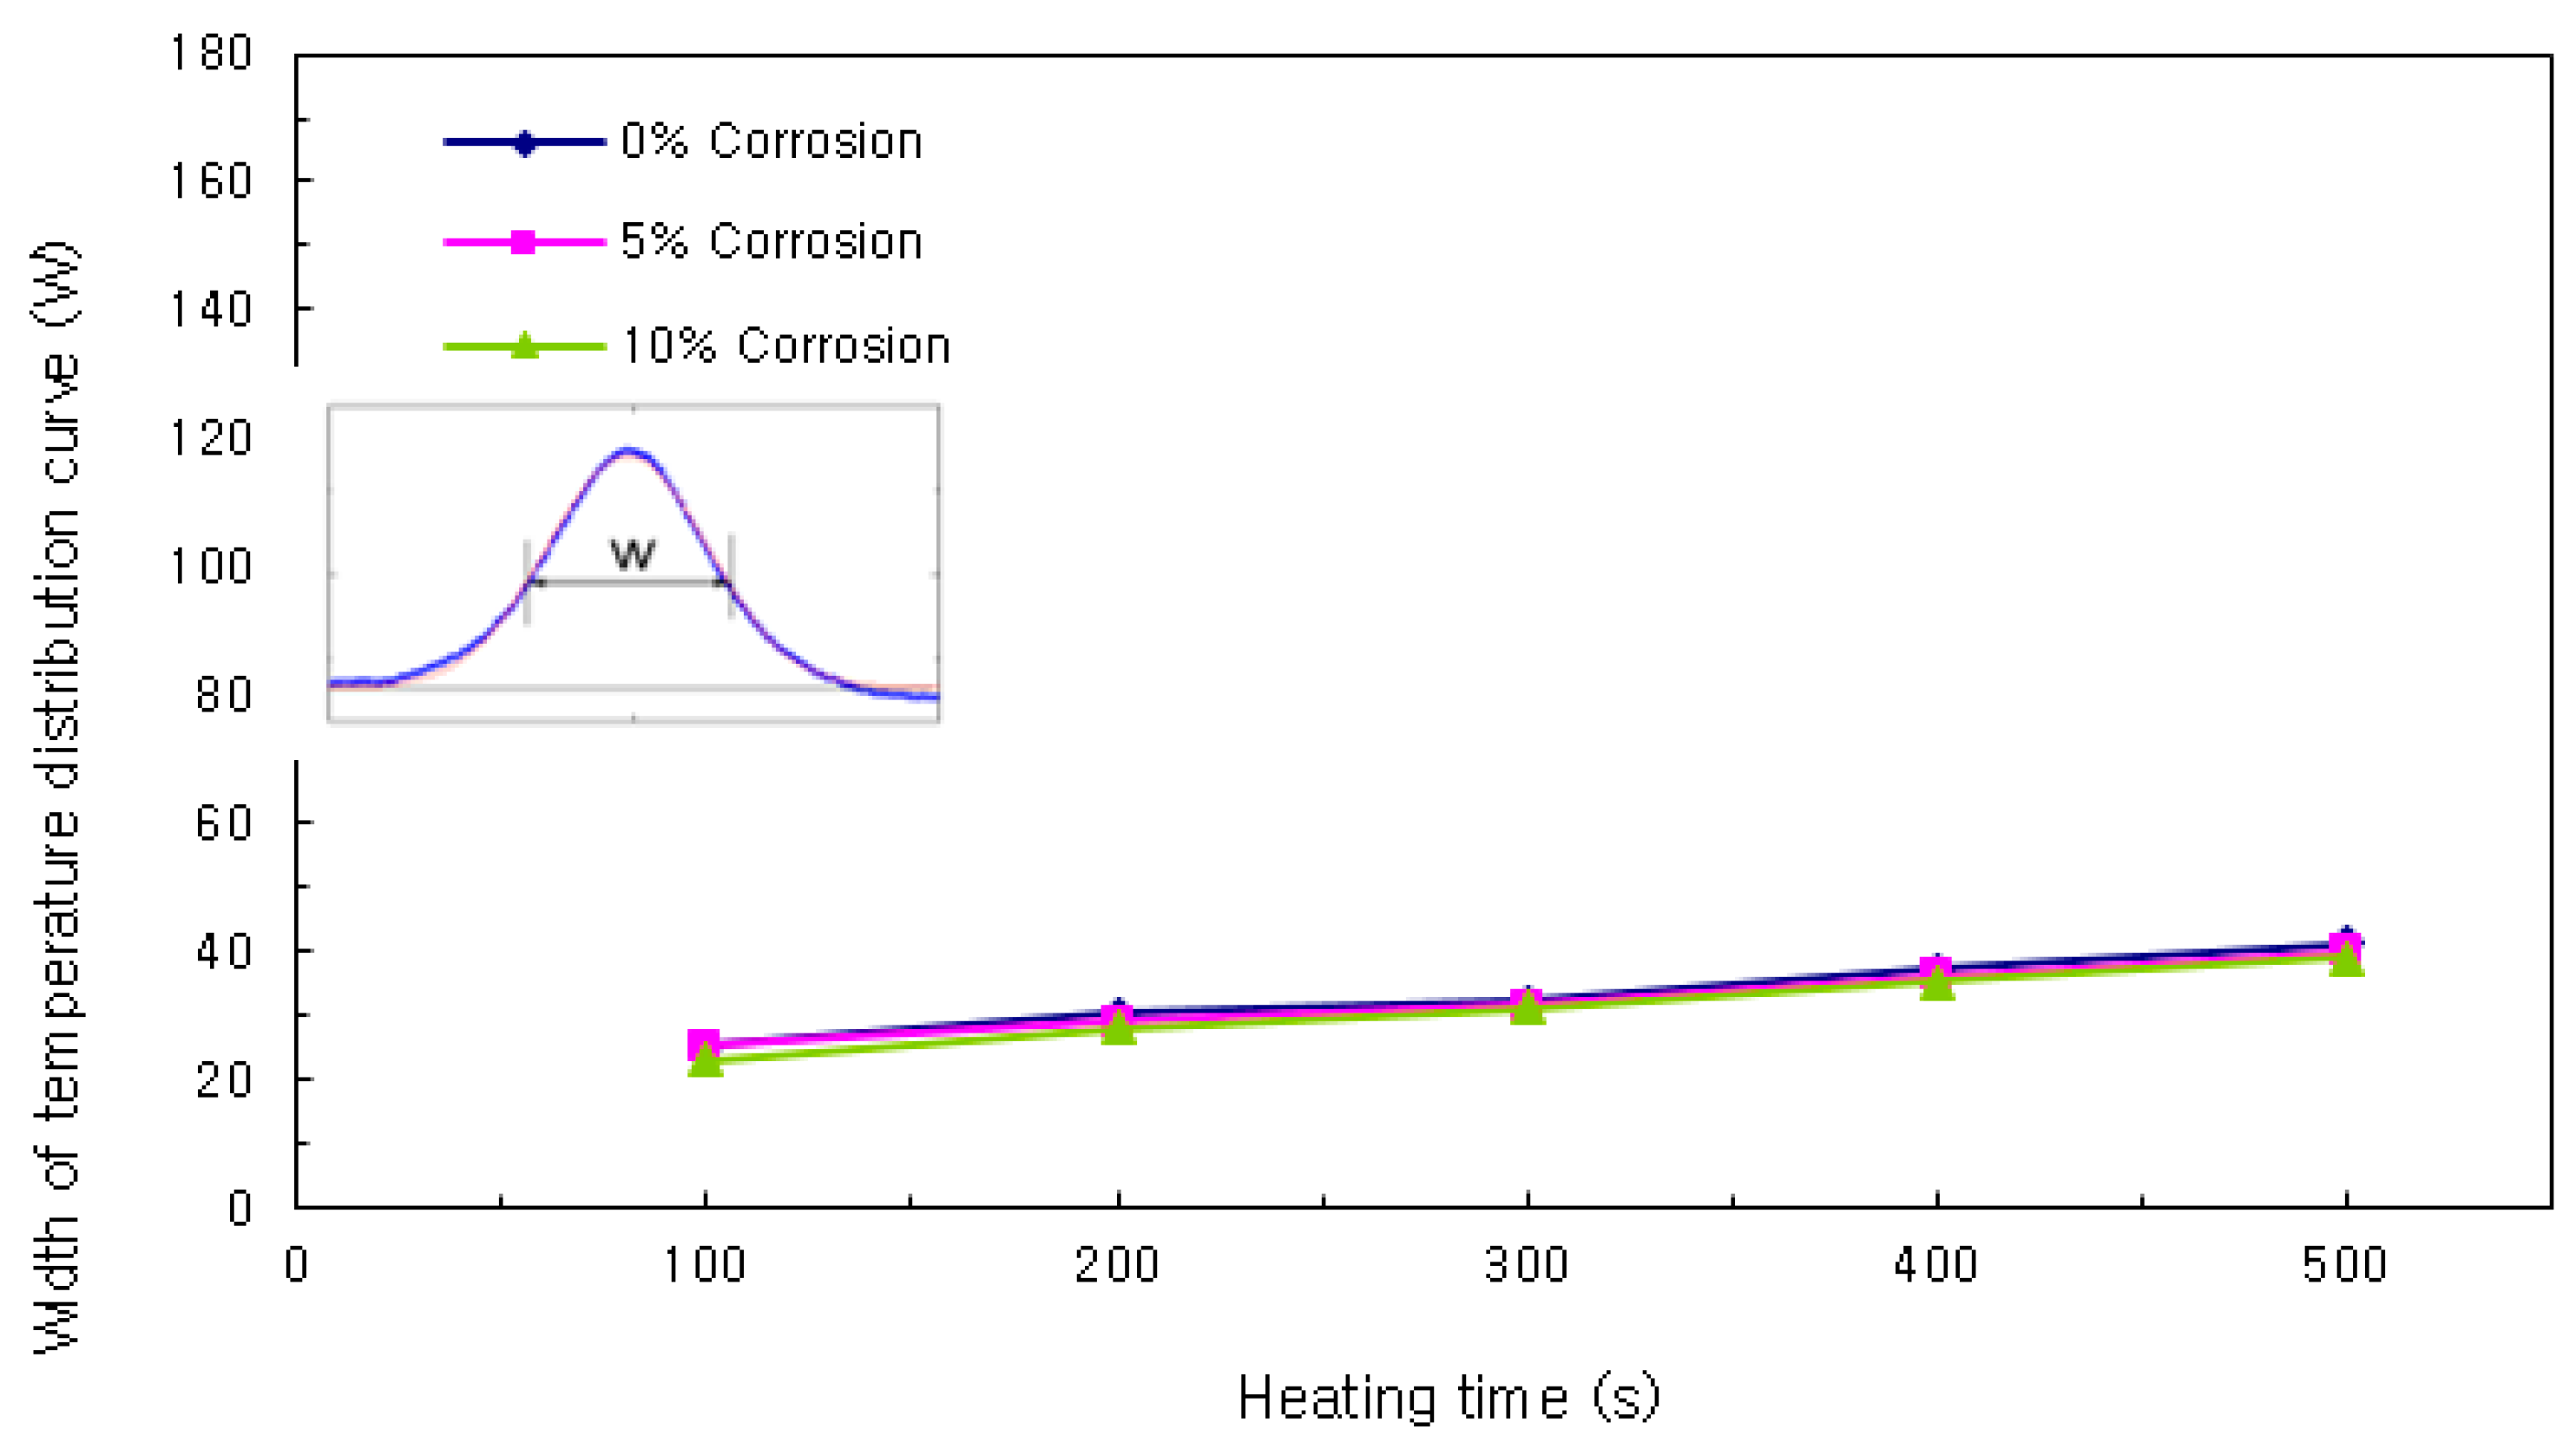
By examining the results of the comparison of the widths of the temperature distribution curve, it can be seen that the width increased with the heating time as shown in
Figure 10. After the heating was ceased, the slope was fixed without regard to the cover thickness. When the curves were examined with respect to the corrosion ratios of 0%, 5%, and 10%, no clear trend was observed in their variation. Because of this, the comparison of the widths of the temperature distribution curves was omitted when building the database.
Area of Temperature Distribution Curve
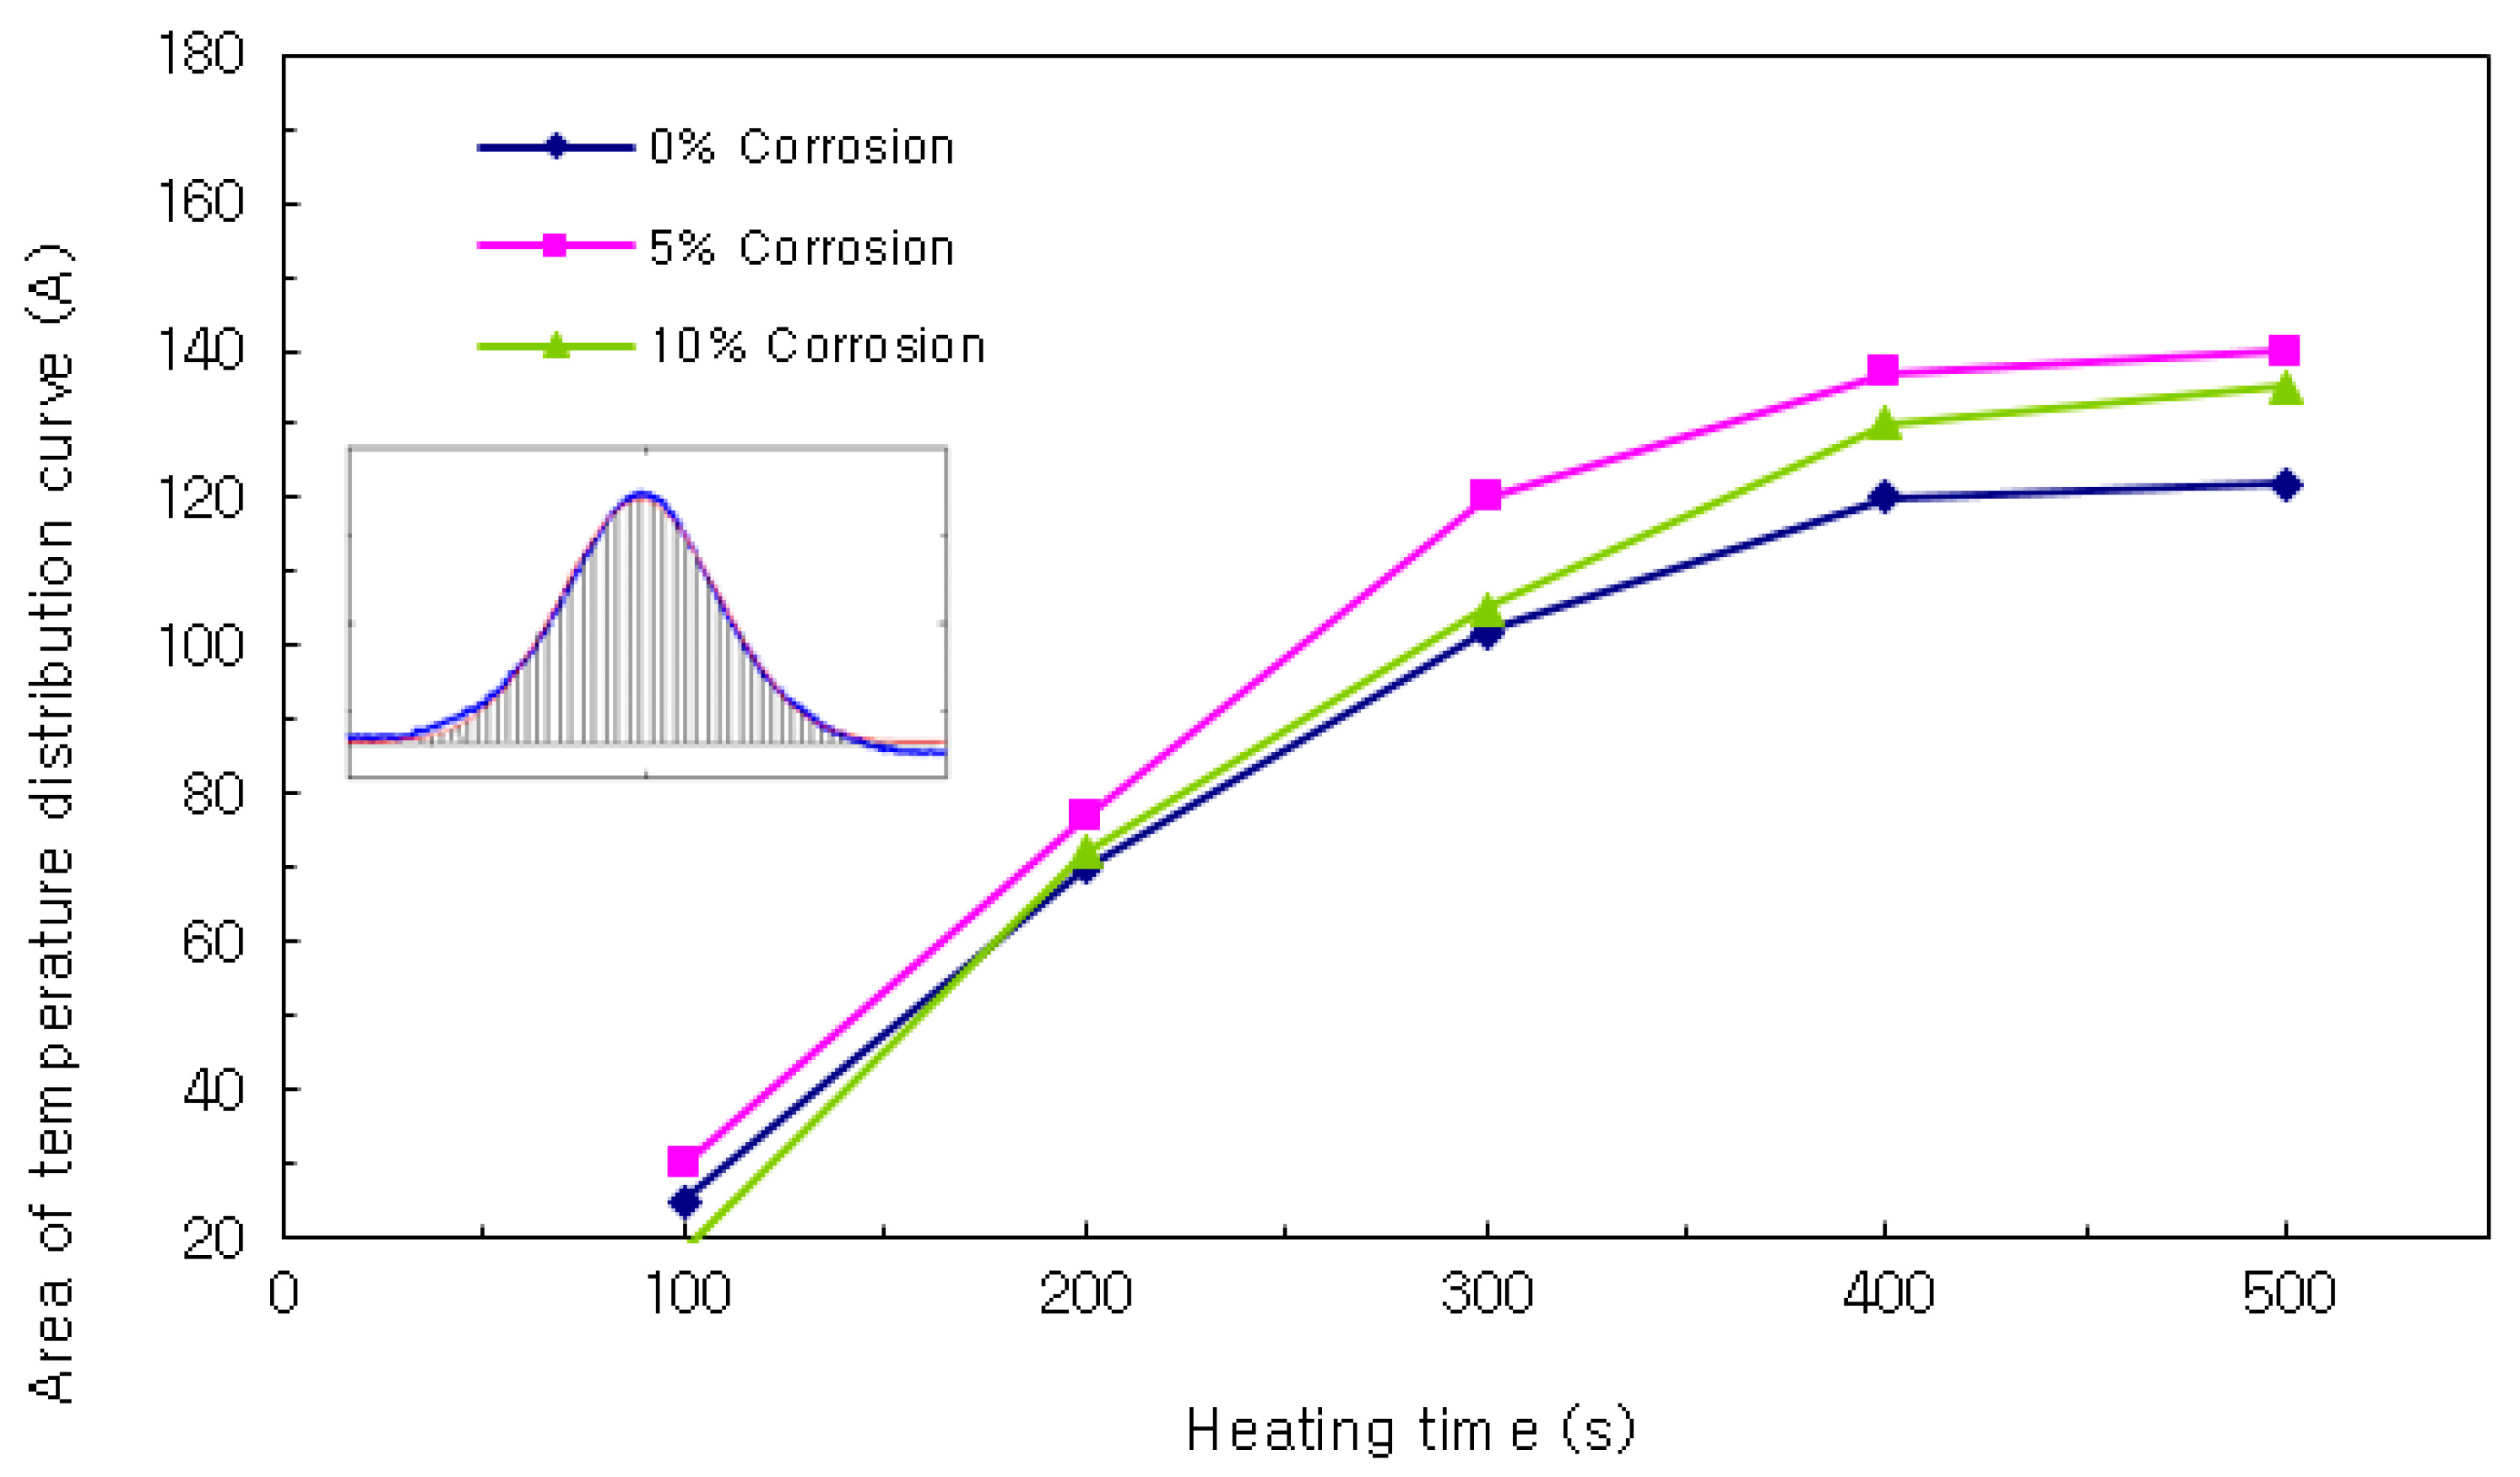
Next, the areas of the temperature distribution curves were compared (see
Figure 11). The results showed that the area increased with heating time, and the slopes became larger as the cover thickness increased. There was no clear trend in the variation of the curves according to the corrosion ratios of 0%, 5%, and 10%, as in the case of the heights of the temperature distribution curves. Because of this, the comparison of the areas of the temperature distribution curves was omitted when building the database.
4. Conclusions
The cross-sectional area of the rebar decreases as the rebar corrosion progresses, and the resistance of the conductor is proportional to its length and inversely proportional to its area. Therefore, the following hypothesis was established: When a fixed amount of current is applied to the rebar, the distribution of temperature curve that appears on the concrete’s surface varies owing to the differences in heat generation caused by the electrical resistance.
To examine the impact of the cover thickness, the experiment variables were set at cover thicknesses of 10, 20, and 30 mm and rebar corrosion ratios of 0%, 1%, 3%, 5%, 7%, and 10%. Each variable was tested and a total of 60 specimens were created (54 specimens and 6 preliminary specimens). In this study, corrosion was applied using an electrochemical corrosion method that employs Faraday’s law, i.e., the law of conservation of electric charge.
This study facilitated bidirectional control between the power supply and the computer, as well as the individual output of the two power output ports. A feature was added to turn the output off via program control when the desired cumulative voltage and current values were attained. In this study, the optimal IRT conditions that clearly distinguish the amount of corrosion was established prior to conducting the preliminary experiments. Based on the results of the experiments, the surface temperature indicates higher when the corrosion rate of rebar is high. In particular, the variations of the temperature distribution were great when the specimen was left 480 s after the 300 s heating was stopped.
The test results of height, width, and area of temperature distribution curve were analyzed, and the height of temperature distribution curve was increased as the heating time was grown. In addition, the area of temperature distribution varied dependent upon the corrosion rate and cover thickness. In particular, the height of temperature distribution curve indicated similar variations even though the heating of rebars were stopped. Based on these results, the height of the temperature distribution curve would be useful to construct the database of corrosion rate of rebars.
