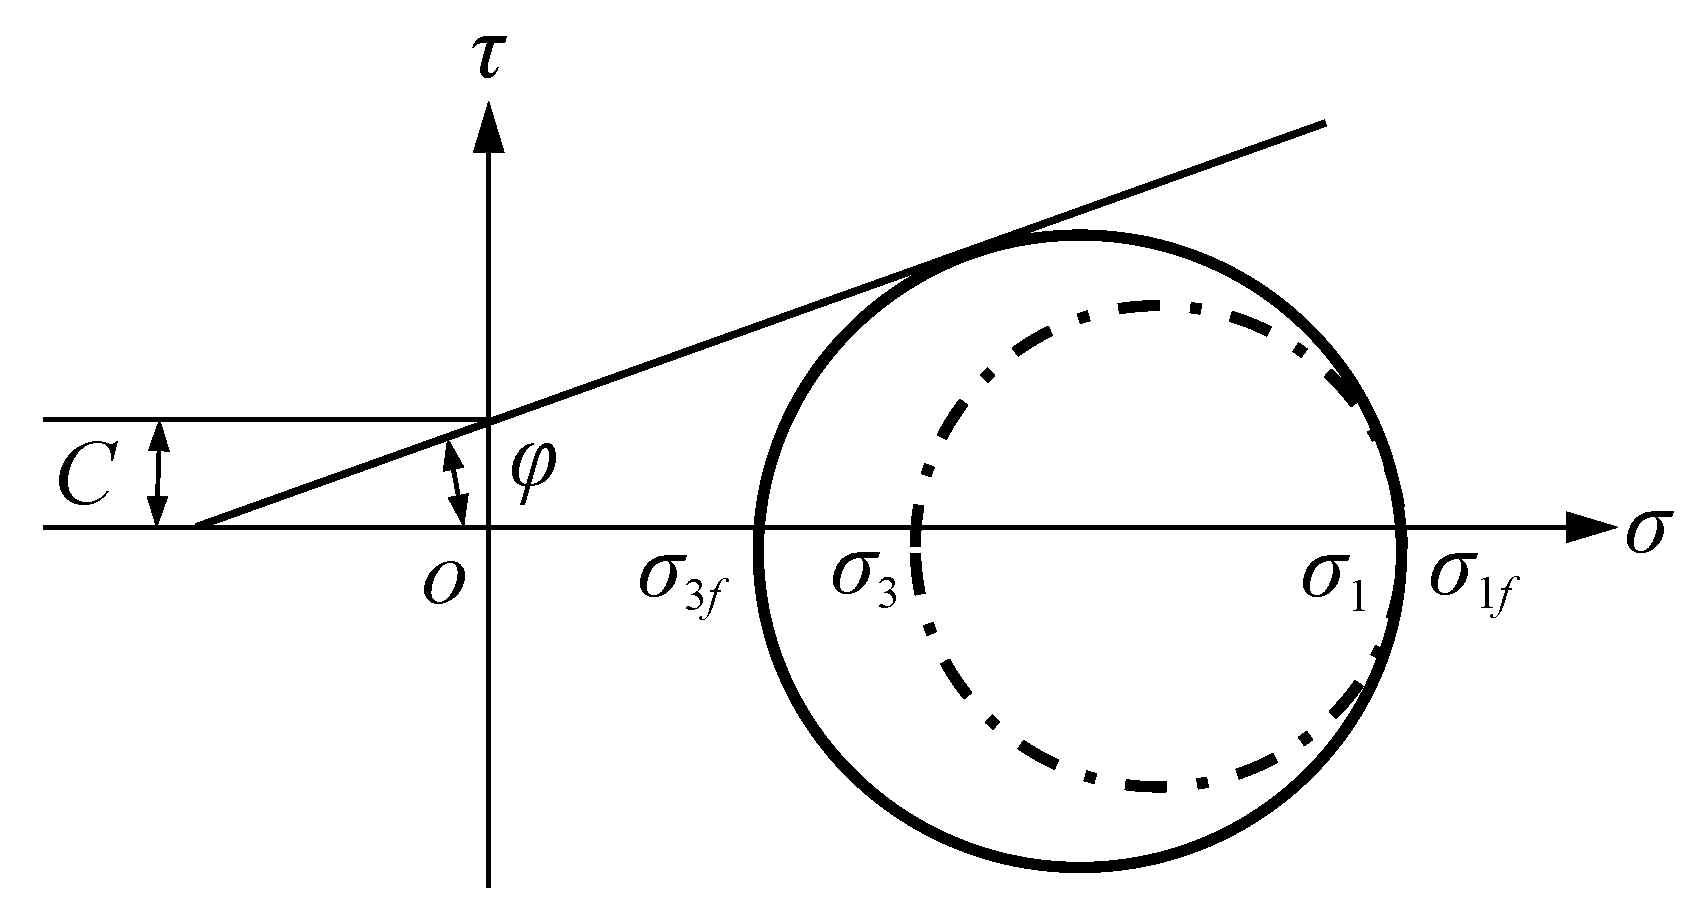
Article

Improvement Methods for Reduction of the High Stress of Ultra-High Asphalt Concrete Core Dams

1
School of Civil Engineering and Architecture, Xi’an University of Technology, No. 5 South Jinhua Road, Xi’an 710048, Shaanxi, China
2
State Key Laboratory of Eco-hydraulics in Northwest Arid Region, Xi’an University of Technology, No. 5 South Jinhua Road, Xi’an 710048, Shaanxi, China
*
Authors to whom correspondence should be addressed.
Appl. Sci. 2019, 9(21), 4618; https://doi.org/10.3390/app9214618
Submission received: 30 September 2019 / Revised: 14 October 2019 / Accepted: 22 October 2019 / Published: 30 October 2019
(This article belongs to the Special Issue Asphalt Materials)

Abstract

:
With the rapid development of asphalt concrete core rockfill dams (ACCRDs), the construction of ultra-high asphalt concrete core rockfill dams (UACCRDs) has been improved significantly. However, the security problems of asphalt concrete core (ACC) become very prominent with the increase of dam height. The shear failure control standard and tensile failure control standard of ACC are suggested. The mechanisms of ACC that generate high shear stress and high tensile stress are investigated. Based on the definition of stress level and the transmission mechanism of arch structures, the improvement methods that reduce the high shear stress and high tensile stress of ultra-high asphalt concrete core (UACC) are proposed and investigated. The results show that the stress level of ACC can be reduced significantly by the increase of the strength parameters of ACC (failure ratio, cohesion, and internal friction angle). The following value ranges of the failure ratio, cohesion, and internal friction angle of ACC for the suitable construction of UACCRDs are recommended: Rf ≥ 0.75, C ≥ 0.30 MPa, and φ ≥ 28.5° (h = 150 m), with the growth gradient adjusted by 5%, 15%, and 5%/25 m. The tensile stress and tensile stress area can be reduced obviously by the new type of dams (curved asphalt concrete core rockfill dams (CACCRDs)). The value ranges of the curvature of CACC (k ≥ 1.0 × 10⁻³) for the suitable construction of UACCRDs are recommended.

1. Introduction

Comparing with clay core rockfill dams (CCRDs), the development of asphalt concrete core rockfill dams (ACCRDs) is relatively late. The latter has become a very competitive type of dam because of its good seepage resistance, earthquake resistance, low cost, and ability to adapt to deformation [1,2,3,4,5,6,7,8]. Since the Kleine Dhuenn dam (it is the world’s first compacted asphalt concrete core rockfill dam and the dam height is 35 m) was built in Germany in 1962, there has been significant interest in the construction of ACCRDs all around the world such as the Finstertal Dam (the dam height is 149 m and the core height is 96 m) in Austria, the Storlomvatn Dam (the dam height is 125 m and the core height is 123 m) in Norway, and the Maopingxi Dam (the dam height is 104 m and the core height is 94 m) and Yele Dam (the dam height is 124.5 m and the core height is 120 m) in China. To date, more than 200 such dams have been built. The International Commission on Large Dams (ICOLD) [9], Höeg [10], and Wang [11] summarized the knowledge of ACCRDs in terms of design, construction, and performance. With the depth of research and the accumulation of damming experience [12,13,14,15,16,17,18,19,20,21,22,23], the Quxue Dam [24] was built in China in 2017 (the dam height is 174.2 m and the core height is 132 m), which is the highest asphalt concrete core rockfill dam (ACCRD) in the world. China has made a remarkable contribution to the development of ACCRDs. With the deepening of China’s western development strategy and the promotion of the Belt and Road (B&R) strategy, ACCRDs will move toward the construction of ultra-high asphalt concrete core rockfill dams (UACCRDs). However, there are few practical experiences and suitable design codes for UACCRDs. Furthermore, there are still numerous mechanical properties of UACCRDs that are not very clear.
The shear stress (stress level) and tensile stress of ACC will increase with dam height. If the shear stress (stress level) and tensile stress of ultra-high asphalt concrete core (UACC) exceed its shear strength (ultimate stress level) and tensile strength, the UACC will experience shear failure and tensile failure. These situations are hazardous for UACCRDs. Thus, improvement methods that reduce the high shear stress (high stress level) and high tensile stress of UACC are proposed and investigated in this paper. The purpose of this paper is to provide a reference for the construction of UACCRDs in the future.

2. Investigation on the Shear Stress Feasibility of UACC

2.1. Shear Failure Control Standard of ACC

Although the literature [7] indicates that the strength of asphalt concrete materials has a nonlinearity behavior, asphalt concrete materials are dispersive materials with obvious particle-like characteristics comparing with other homogeneous or hydrogel knot materials. The strength of asphalt concrete materials is mainly associated with the cohesion of asphalt, the internal friction resistance of aggregate, and the adhesion between aggregate and asphalt binder. Therefore, Mohr–Coulomb strength theory can be applied to asphalt concrete materials successfully [8,25,26], and it is considered that the shear strength of asphalt concrete materials obeys the following relationship:
τ = C + σ tan φ
where, C is the cohesion and φ is the internal friction angle.
The values of C and φ can be determined by Mohr–Coulomb strength theory and the conventional triaxial test of cylindrical specimens. The confining pressure is applied while the axial pressure is gradually increased until the specimen is failed. The intercept between strength envelope and longitudinal axis is the cohesion C, and the dip angle is the internal friction angle φ, as shown in Figure 1. The Mohr–Coulomb strength theory takes C and φ values as material strength indices, and the expression is given by:
σ 1 σ 3 = ( σ 1 + σ 3 ) sin φ + 2 C cos φ
where, σ1 is the major principal stress and σ3 is the minor principal stress.
The ACC is the anti-seepage barrier of ACCRDs, which can determine the safety of ACCRDs directly. The shear safety of ACC can be determined by the stress level S (the ratio of current shear stress to failure shear stress); the expression of stress level S is as follows:
S = σ 1 σ 3 ( σ 1 σ 3 ) f
where (σ1σ3)f is the failure shear stress.
The “Design specification for rolled earth-rock fill dams” (DL/T 5395-2007) stipulates that the minimum anti-sliding stability safety factor of dam slope for I type of dams should not be less than 1.30. The ratio of ultimate stress 1.0 to stress level is defined as the shear safety factor of ACC in this paper. It is assumed that the shear safety factor of ACC is consistent with the anti-sliding stability safety factors of dam slope, i.e., 1.30 is the yield shear safety factor of ACC (the corresponding yield stress level 0.77 is the yield shear failure control standard (YSFCS) of ACC) and 1.0 is ultimate shear safety factor (the corresponding ultimate stress level 1.0 is the ultimate shear failure control standard (USFCS) of ACC). If the stress level of ACC is less than or equal to 0.77 (the shear safety factor is more than or equal to 1.30), the ACC is considered to be safe and will not experience shear failure. If the stress level of ACC is more than 0.77 and less than or equal to 1.0 (the shear safety factor is less than 1.30 and more than or equal to 1.0), it is considered that the ACC has the probability that experiences shear failure. If the stress level of ACC is more than 1.0 (the shear safety factor is less than 1.0), it is considered that the ACC experiences shear failure.

2.2. Mechanism of UACC that Generates High Shear Stress

The ACC will inevitably generate settlement under the vertical load (gravity stress). Moreover, the ACC is restricted by valley slope. Thus, the band between ACC and valley will generate shear-slip deformation, which is parallel to valley slope. The result of shear-slip deformation is that the ACC will generate potential shear band. The mechanical diagram of ACC in shear band is shown in Figure 2.
The equilibrium conditions of the potential shear band on the left of ACC in the vertical plane are as follows:
F L 1 = G L sin α F L 2 = G L cos α }
where, GL = γhL is the gravity stress of ACC at L segment. γ is the bulk density of ACC. FL1 = GLsinα = FL2tanα is the shear stress of the shear band of ACC loaded by the left valley, which is parallel to the left valley slope. FL2 = GLcosα is the normal stress of the shear band of ACC loaded by the left valley, which is perpendicular to the left valley slope. If FL1τf = C + σ3tanφ (τf is the shear strength of ACC), the left of ACC will experience shear failure (the stress level of ACC is more than or equal to 1.0).
Similarly, the equilibrium conditions of the potential shear band on the right of ACC in the vertical plane are as follows:
F R 1 = G R sin β F R 2 = G R cos β }
where, GR = γhR is the gravity stress of ACC at R segment. FR1 = GRsinβ = FR2tanβ is the shear stress of the shear band of ACC loaded by the left valley, which is parallel to the right valley slope. FR2 = GRcosβ is the normal stress of the shear band of ACC loaded by the right valley, which is perpendicular to the right valley slope. If FR1τf = C + σ3tanφ (τf is the shear strength of ACC), the right of ACC will experience shear failure (the stress level of ACC is more than or equal to 1.0).
Equations (4) and (5) show that the higher the dam height and the steeper the valley slope, the larger or higher the settlement, shear-slip deformation, shear band, shear stress, and stress level of ACC. If the shear stress of ACC exceeds its shear strength (the stress level of ACC exceeds its ultimate stress level), the ACC will experience shear failure, which is very dangerous for the safety of UACCRDs. Thus, it is essential to propose the improvement method that reduces the high stress level of UACC.

2.3. Improvement Method that Reduces the High Stress Level of UACC

When the failure shear stress (σ1σ3)f is unchanged, the stress level of ACC can reflect its shear stress, i.e., the higher the stress level of ACC, the larger the shear stress of ACC. The definition of (σ1σ3)f is as follows:
( σ 1 σ 3 ) f = 2 C cos φ + 2 σ 3 sin φ 1 sin φ
Substituting Equation (6) into Equation (3), the stress level S can be written as:
S = ( σ 1 σ 3 ) ( 1 sin φ ) 2 C cos φ + 2 σ 3 sin φ
Equation (7) shows that the stress level of ACC can be reduced by the increase of the cohesion and internal friction angle of ACC. The definition of failure ratio Rf is as follows:
R f = ( σ 1 σ 3 ) f ( σ 1 σ 3 ) ult
Substituting Equation (8) into Equation (3), the stress level S can be rewritten as:
S = σ 1 σ 3 R f ( σ 1 σ 3 ) ult
Equation (7) shows that the stress level of ACC can be reduced by the increase of the failure ratio of ACC also. In summary, the stress level of ACC can be reduced by the increase of the strength parameters of ACC (failure ratio, cohesion, and internal friction angle). The improvement method that reduces the stress level of ACC is to magnify the denominator of Equation (3). It is the mechanism that reduces the stress level of ACC.

2.4. Reasonable Value Ranges of the Strength Parameters of UACC

2.4.1. Shear Characteristics of UACC

The ratios of upstream and downstream dam slope are both 1.0:2.0. The width of dam crest is 10 m. The thickness of transition material is 3 m. The thickness of core crest is 0.5 m. The thickness of core base is 1/100 of dam height. The dam heights are 100, 125, 150, 175, 200, 225, and 250 m. The left valley slope ratios are 0.5:1.0, 1.0:1.0, 1.5:1.0, 2.0:1.0, and 2.5:1.0. The right valley slope ratio is 2.0:1.0. The diagram of calculation schemes is shown in Figure 3. ABAQUS is employed for finite element method (FEM) models in this paper. The material regions of FEM standard model (the dam height is 200 m and the left valley slope ratio is 1.0:1.0) are shown in Figure 4. The meshes of FEM standard model are shown in Figure 5. The element type of dam is C3D8R and the element number of dam is 18240 (the element number of ACC is 2000). The element type of bedrock is C3D10 and the element number of bedrocks is 27401. The boundary conditions are that the four sides of models are normally constrained and the bottom of models is fully constrained. The hyperbolic model (proposed by Duncan-Chang [27]) has been well developed for predicting the stress–strain relationship of geo-material in dams. Thus, this model is used in this paper and the characteristic parameters of dam materials are shown in Table 1.
According to Section 2.1, the settlement of ACC is the fundamental reason that the UACC generates high shear stress (high stress level). Thus, the settlement and stress level of UACC are only discussed in the following section. The settlement of UACC toward up is negative, and the settlement of UACC toward down is positive.
Figure 6 shows that the settlement of ACC is circularly distributed. The settlement maximum at the center of ACC is 1.24 m, which is approximately 0.6% of dam height and less than 1%. Figure 7 shows that the stress level of ACC is symmetrically distributed. The stress level maximum at the steeper end of ACC is 0.938. Figure 8 and Figure 9 and Table 2 show that the settlement and stress level of ACC increase sharply with dam height. When h = 100 m, the settlement of ACC is −0.385 m. The stress level of ACC is 0.558 (the shear safety factor is 1.79), which is far less than the YSFCS. The ACC is safe and will not experience shear failure. When h = 150 m and h = 200 m, the settlements of ACC are −0.704 m and −1.067 m. The stress levels of ACC are 0.807 and 0.938 (the shear safety factors are 1.24 and 1.05), which are more than the YSFCS and less than the USFCS. The ACC has the probability that experiences shear failure. When h = 250 m, the settlement of ACC is −1.508 m. The stress level of ACC is 1.036 (the shear safety factor is 0.97), which is more than the USFCS. The ACC experiences shear failure.
Figure 10 and Figure 11 and Table 3 show that the settlement of ACC decreases slightly with valley slope ratio and the stress level of ACC increases sharply with valley slope ratio. When the valley slope ratio is 0.5:1.0, the settlement of ACC is −1.098 m. The stress level of ACC is 0.852 (the shear safety factor is 1.17), which is more than the YSFCS and less than the USFCS. The ACC has the probability that experiences shear failure. When the valley slope ratio is 2.5:1.0, the settlement of ACC is −1.066 m. The stress level of ACC is 1.216 (the shear safety factor is 0.82), which is more than the USFCS. The ACC experiences shear failure.
In summary, the stress level of ACC increases sharply with dam height and valley slope ratio, which shows that the “Mechanism of UACC that generates high shear stress” is correct. Its value may exceed the YSFCS or even the USFCS. The ACC experiences shear failure. It is very dangerous for UACCRDs in this situation. The necessity that reduces the high stress level (high shear stress) of UACC has been proved again.

2.4.2. Value Ranges of the Strength Parameters of UACC That Independently Meet YSFCS

The “Improvement method that reduces the high stress level of UACC” shows that the stress level of ACC can be reduced by the increases of the strength parameters of ACC. Thus, the value ranges of the strength parameters (failure ratio Rf, cohesion C, and internal friction angle φ) of ACC that independently meet the YSFCS are back-calculated. It is assumed that other material parameters are unchanged and only the failure ratio Rf, cohesion C, and internal friction angle φ of ACC are independently changed. The stress level of UACC satisfies: S ≤ 0.77 (YSFCS).
Figure 12, Figure 13 and Figure 14 and Table 4 show that the failure ratio, cohesion, and internal friction angle of ACC that meets the YSFCS increase with dam height. The area above the curve shown in Figure 12 represents the safe value range of the failure ratio of ACC, when other material parameters are unchanged. The failure ratio minimum of UACC that meets the YSFCS is 0.75 ≤ Rf ≤ 1.2, when 150 m ≤ h ≤ 250 m. The area above the curve shown in Figure 13 represents the safe value range of the cohesion of ACC, when other material parameters are unchanged. The cohesion minimum of UACC that meets the YSFCS is 0.34 ≤ C ≤ 0.89, when 150 m ≤ h ≤ 250 m. The area above the curve shown in Figure 14 represents the safe value range of the internal friction angle of ACC when other material parameters are unchanged. The internal friction angle minimum of ACC that meets the YSFCS is 29.5° ≤ φ ≤ 39°, when 150 m ≤ h ≤ 250 m. The high stress level of UACC can be reduced apparently by the increases of the strength parameters of ACC, which shows that the “Improvement method that reduces the high stress level of UACC” is correct. However, it is impossible for the failure ratio, cohesion, and internal friction angle of ACC to reach the values that independently meet the YSFCS, when 200 m ≤ h ≤ 250 m. Thus, the contribution of the failure ratio, cohesion, and internal friction angle of ACC that reduces the stress level of ACC is comprehensively considered in the following section.

2.4.3. Value Ranges of the Strength Parameters of UACC That Comprehensively Meet YSFCS

The value ranges of the strength parameters (failure ratio Rf, cohesion C, and internal friction angle φ) of ACC that comprehensively meet the YSFCS are back-calculated. It is assumed that other material parameters are unchanged and only the failure ratio Rf, cohesion C, and internal friction angle φ of ACC are comprehensively changed. The stress level of UACC satisfies: S ≤ 0.77 (YSFCS).
The area above the curved faces shown in Figure 15 represents the safe value ranges of the cohesion and internal friction angle of ACC, when Rf = 0.6, 0.7, and 0.8. Figure 15 and Table 5 show that the cohesion and internal friction angle of ACC that meet the YSFCS increase with dam height, when the failure ratio of ACC is unchanged. The failure ratio and cohesion of ACC that meet the YSFCS increase with dam height, when the internal friction angle of ACC is unchanged. The failure ratio and internal friction angle of ACC that meet the YSFCS increase with dam height, when the cohesion of ACC is unchanged. The cohesion and internal friction angle of ACC that meet the YSFCS decreases with the failure ratio of ACC, when the dam height is unchanged. The failure ratio and cohesion of ACC that meet the YSFCS decrease with the internal friction angle of ACC when the dam height is unchanged. The failure ratio and internal friction angle of ACC that meet the YSFCS decreases with the cohesion of ACC when the dam height is unchanged.
The data of Maopingxi asphalt concrete core rockfill dam is referred. The failure ratio of ACC is [0.49, 0.91], the cohesion of ACC is [0.16 MPa, 0.51 MPa], and the internal friction angle of ACC is [28.4°, 36.2°] with the triaxial test under different mixture formulas of ACC. Therefore, the following value ranges of the failure ratio, cohesion, and internal friction angle of ACC for the suitable construction of UACCRDs are recommended: Rf ≥ 0.75, C ≥ 0.30 MPa, and φ ≥ 28.5° (h = 150 m), with the growth gradient adjusted by 5%, 15%, and 5%/25 m. The stress levels of ACC under different dam heights are shown in Table 6. Table 6 shows that the stress levels of ACC under different dam heights are less than or equal to the YSFCS, i.e., the shear safety factors of ACC under different dam heights are more than or equal to the yield shear safety factor 1.30. The UACC is safe and will not experience shear failure. Thus, the recommended strength parameters of ACC are reasonable.

3. Investigation on the Tensile Stress Feasibility of UACC

3.1. Tensile Failure Control Standard of ACC

The most popular method that judges the tensile safety of ACC is as follows:
σ t σ b
where, σt is the tensile stress of ACC and σb is the tensile strength of ACC.
The tensile strength of ACC is relatively low, which can be obtained by three-point bending tests, direct tensile tests, and indirect tensile tests. Nevertheless, it is very difficult to obtain accurate and objective tensile strength via tests. Firstly, asphalt concrete materials have prominent temperature sensitivity. Asphalt concrete materials have significant brittle behavior (elastic mechanical behavior) at low temperature and have obvious rheology (viscoelastic-plastic mechanical behavior) at high temperature. Secondly, the tensile properties of asphalt concrete materials are different, when the content of asphalt and the particle gradation of aggregate are different. In addition, the production of asphalt concrete specimens has limitations. Thus, the cohesion C of ACC is approximately taken as the tensile strength of ACC in this paper.
The ratio of tensile strength to tensile stress is defined as the tensile safety factor of ACC in this paper, which is similar to the shear safety factor of ACC. It is assumed that the tensile safety factor of ACC is consistent with the anti-sliding stability safety factors of dam slope, i.e., 1.30 is the yield tensile safety factor of ACC (the corresponding yield tensile strength C/1.30 is the yield tensile failure control standard (YTFCS) of ACC) and 1.0 is ultimate tensile safety factor (the corresponding ultimate tensile stress C is the ultimate tensile failure control standard (UTFCS) of ACC). If the tensile stress of ACC is less than or equal to C/1.30 (the tensile safety factor is more than or equal to 1.30), the ACC is considered to be safe and will not experience tensile failure. If the tensile stress of ACC is more than C/1.30 and less than or equal to C (the tensile safety factor is less than 1.30 and more than or equal to 1.0), it is considered that the ACC has the probability that experiences tensile failure. If the tensile stress of ACC is more than C (the tensile safety factor is less than 1.0), it is considered that the ACC experiences tensile failure.

3.2. Mechanism of UACC that Generates High Tensile Stress

ACCRDs are different from concrete face rockfill dams [28] and clay core rockfill dams [29]. The ACC is an anti-seepage barrier and cannot be divided into deformation joints. Moreover, the width of valley is a fixed value. Therefore, the ACC inevitably generates flexural deformation (deflection) under horizontal loads (active earth pressure and hydrostatic pressure) at the operation period. The result of the flexural deformation of ACC is that its axis is stretched, i.e., the ACC generates tensile stress. The higher the dam height, the greater the flexural deformation of ACC, the larger the tensile stress of ACC, and the greater the probability of ACC that experiences tensile failure. It is very dangerous for UACCRDs in this situation. Therefore, it is very necessary to propose the improvement method that reduce the high tensile stress of UACC. The ACC of traditional ACCRDs (straight asphalt concrete core rockfill dams (SACCRDs)) is called as straight asphalt concrete core (SACC) in the following section. The mechanical diagram of SACC is shown in Figure 16.

3.3. Improvement Method that Reduces the High Tensile Stress of UACC

Considering the probability that the SACC may experience tensile failure, the improvement method that designs SACCRDs into curved asphalt concrete core rockfill dams (CACCRDs) is proposed by the special transmission mechanism of arch structures. The ACC of CACCRDs is called as curved asphalt concrete core (CACC) in the following section. The design intention of CACC is to reduce the tensile stress of ACC via the “arch effect” of arch structures, so as to reduce the probability that the SACC experiences tensile failure. The mechanical diagram of CACC is shown in Figure 17.
The CACC also generates flexural deformation at the operation period. The result of the flexural deformation of CACC is that its axis is compressed, i.e., the CACC generates compressive deformation along its axis, which can partially counteract tensile stress. Moreover, the CACC reduces the effect of axial tension loads via partially transforming horizontal loads (active earth pressure and water pressure) into axial compressive loads. This is the original intention that designs SACC into CACC.

3.4. Reasonable Value Ranges of the Curvatures of UACC

3.4.1. Tensile Characteristics of UACC

According to Section 3.2, the flexural deformation of ACC is the fundamental reason that the UACC generates high tensile stress. Thus, the flexural deformation and tensile stress of SACC are only discussed in the following section. The flexural deformation of SACC toward upstream is negative, and the flexural deformation of UACC toward downstream is positive. The compressive stress is negative, and the tensile stress is positive.
Figure 18 shows that the flexural deformation of SACC is circularly distributed. The flexural deformation maximum at the center of SACC is 0.687 m. The deflection to span ratio is 0.2% and less than 1%. Figure 19 shows that the major principle stress of SACC is hierarchically distributed. It should be noted that tensile stress regions appear in the major principle stress of SACC. The tensile stress maximum at the steeper end of SACC is 0.349 MPa. Figure 20, Figure 21 and Figure 22 and Table 7 show that the flexural deformation, tensile stress, and tensile stress area of SACC increase sharply with dam height. When h = 100 m, the flexural deformation of SACC is 0.197 m. The tensile stress of SACC is 0.078 MPa (the tensile safety factor is 3.85), which is far less than the YTFCS. The SACC is safe and will not experience tensile failure. The tensile stress area of SACC is 307 m2. When h = 150 m, the settlements of SACC are 0.408 m. The tensile stress of SACC is 0.232 MPa (the tensile safety factors is 1.29), which is more than the YTFCS and far less than the UTFCS. The SACC has the probability that experiences tensile failure. The tensile stress area of SACC is 681 m2. When h = 200 m and h = 250 m, the settlements of SACC are 0.687 m and 1.042 m. The tensile stresses SACC are 0.349 MPa and 0.522 MPa (the tensile safety factors are 0.86 and 0.57), which are far more than the UTFCS. The SACC experiences tensile failure. The tensile stress areas of SACC are 1335 m2 and 2097 m2.
Figure 23, Figure 24 and Figure 25 and Table 8 show that the flexural deformation of SACC deceases with valley slope ratio and the tensile stress and tensile stress area of SACC increases sharply with valley slope ratio. When the valley slope ratio is 0.5:1.0, the flexural deformation of SACC is 0.750 m. The tensile stress of SACC is 0.126 MPa (the tensile safety factor is 2.38), which is far more than the YTFCS. The SACC is safe and will not experience tensile failure. The tensile stress area of SACC is 1013 m2. When the valley slope ratio is 2.5:1.0, the flexural deformation of SACC is 0.640 m. The tensile stress of SACC is 0.737 MPa (the tensile safety factor is 0.41), which is far more than the UTFCS. The SACC experiences tensile failure. The tensile stress area of SACC is 1334 m2.
In summary, the tensile stress and tensile stress area of SACC increase sharply with dam height and valley slope ratio, which shows that the “Mechanism of UACC that generates high tensile stress” is correct. Its value may exceed the YTFCS or even the UTFCS. The SACC experiences tensile failure. It is very dangerous for UACCRDs. The necessity that reduces the high tensile stress of UACC has been verified again.

3.4.2. Improvement Effect of CACCRDs

The material regions shown in Figure 26, meshes shown in Figure 27, element type, element number, boundary conditions, et al., of FEM standard model for CACCRDs are the same as those of SACCRDs. The characteristic parameters of dam materials are shown in Table 1.
Figure 28 shows that the flexural deformation of CACC is circularly distributed, which is similar to that of SACC. Figure 29 shows that the major principle stress of SACC is hierarchically distributed, which is similar to that of SACC also. Figure 28, Figure 29, Figure 30, Figure 31 and Figure 32 and Table 9 show that the flexural deformation of CACC increases slightly with the curvature of CACC, while the tensile stress and tensile stress area of CACC decrease sharply with the curvature of CACC. When the curvature of CACC is 0.28 × 10⁻³, the flexural deformation of CACC is 0.690 cm, which is 0.4% more than that of SACC. The tensile stress of CACC is 0.305 MPa (the tensile safety factor is 0.98), which is more than the UTFCS. The CACC still experiences tensile failure. The tensile stress of CACC is 12.6% less than that of SACC. The tensile stress area of CACC is 1275 m2, which is 4.5% less than that of SACC. When the curvature of CACC is 0.85 × 10⁻³, the flexural deformation of CACC is 0.692 cm, which is 0.6% more than that of SACC. The tensile stress of CACC is 203 MPa (the tensile safety factor is 1.48), which is less than the YTFCS. The CACC is safe and will not experience tensile failure. The tensile stress of CACC is 41.8% less than that of SACC. The tensile stress area of CACC is 1065 m2, which is 20.2% less than that of SACC. When the curvature of CACC is 1.40 × 10⁻³, the flexural deformation of CACC is 0.694 cm, which is 1.0% more than that of SACC. The tensile stress of CACC is 0.138 MPa (the tensile safety factor is 2.17), which is far less than the YTFCS. The CACC is safe and will not experience tensile failure. The tensile stress of CACC is 60.5% less than that of SACC. The tensile stress area of CACC is 925 m2, which is 30.7% less than that of SACC.
It is noted that the design intention of CACC does not reduce the flexural deformation of CACC. Although the flexural deformation of CACC is more than that of SACC, the result of the flexural deformation of CACC is that its axis is compressed. This is the first advantage of CACC. The high tensile stress of SACC can be reduced apparently by the increase of the curvature of CACC, which shows that the “Improvement method that reduces the high tensile stress of UACC” is correct. The CACC can significantly reduce tensile stress, which is mainly attributable to the special transmission mechanism of arch structures, i.e., the partial or all horizontal loads can be transformed into axial compressive loads. This is the fundamental reason that the tensile stress of CACC is less than that of SACC, and this is the second advantage of CACC.
In summary, the tensile stress and tensile stress area of CACC can be reduced apparently by the increase of the curvature of CACC, which fully reflects the great advantage of arch structures. Therefore, it is suggested that CACCRDs should be adopted for ultra-high SACCRDs, especially for the condition that the tensile stress of SACC approaches or exceeds its tensile strength. The curvature of CACC should be more than 1.0 × 10⁻³ for ultra-high CACCRDs.
Similar to SACCRDs, the flexural deformation and tensile stress of CACC are only discussed in the following section. The flexural deformation of CACC toward upstream is negative, and the flexural deformation of UACC toward downstream is positive. The compressive stress is negative, and the tensile stress is positive.

4. Conclusions

(1) The stress level (shear stress) and tensile stress of ACC increase with dam height and valley slope ratio. The ACC will experience shear failure and tensile failure if the stress level (shear stress) and tensile stress ACC exceed the ultimate stress level (shear strength) and tensile strength of ACC. Thus, the improvement method that increases the strength parameters of ACC and the improvement method that designs SACCRDs into CACCRDs are proposed respectively to reduce the high stress level (high shear stress) and high tensile stress of UACC.
(2) The stress level of ACC can be reduced with the increase of the failure ratio, cohesion, and internal friction angle of ACC. The material properties of ACC and the contribution of the failure ratio, cohesion, and internal friction angle of ACC that reduces the stress level of ACC are comprehensively considered. The following value ranges of the failure ratio, cohesion, and internal friction angle of ACC for the suitable construction of UACCRDs are recommended: Rf ≥ 0.75, C ≥ 0.30 MPa, and φ ≥ 28.5° (h = 150 m), with the growth gradient adjusted by 5%, 15%, and 5%/25 m.
(3) The tensile stress and tensile stress area of CACC are less than those of SACC. Moreover, the tensile stress and tensile stress area of CACC decrease obviously with the curvature of CACC. Therefore, CACCRDs are recommended for the construction of UACCRDs, especially for the condition that the tensile stress of ACC approaches or exceeds its tensile strength. The curvature of CACC should be more than 1.0 × 10⁻³ for ultra-high CACCRDs.

Author Contributions

Founding Acquisition, F.D.; Investigation, J.G.; Methodology, J.G. and F.D.; Conceptualization, J.G., F.D., Z.M., Y.X., and J.R.; Writing–original draft, J.G.; Writing–review & editing, J.G., Z.M., and Y.X.

Funding

The research was supported by the National Natural Science Foundation of China (Grant Nos. 51979225, 51679199), the Special Funds for Public Industry Research Projects of the Ministry of Water Resources (Grant No. 201501034-04), and the Key Laboratory for Science and Technology Co-ordination and Innovation Projects of Shaanxi Province (Grant No. 2014SZS15-Z01).

Conflicts of Interest

The authors declare no conflict of interest.

References

  1. Wang, Z.X.; Hao, J.T.; Yang, J.; Cao, Y.; Li, X.; Liu, S. Experimental study on hydraulic fracturing of high asphalt concrete core rock-Fill dam. App. Sci. 2019, 9, 2285. [Google Scholar] [CrossRef]
  2. Feizi-Khankandi, S.; Mirghasemi, A.A.; Ghalandarzadeh, A.; Hoeg, K. Cyclic triaxial tests on asphalt concrete as a water barrier for embankment dams. Soils Found. 2008, 48, 319–332. [Google Scholar] [CrossRef]
  3. Akhtarpour, A.; Khodaii, A. Experimental study of asphaltic concrete dynamic properties as an impervious core in embankment dams. Constr. Build. Mater. 2013, 41, 319–334. [Google Scholar] [CrossRef]
  4. Zhang, Y.B.; Höeg, K.; Wang, W.B.; Zhu, Y. Watertightness, cracking resistance, and self-healing of asphalt concrete used as a water barrier in dams. Can. Geotech. J. 2013, 50, 275–287. [Google Scholar] [CrossRef]
  5. Zhang, Y.B.; Wang, W.B.; Zhu, Y. Investigation on conditions of hydraulic fracturing for asphalt concrete used as impervious core in dams. Constr. Build. Mater. 2015, 93, 775–781. [Google Scholar] [CrossRef]
  6. Wang, W.B.; Höeg, K. Simplified material model for analysis of asphalt core in embankment dams. Constr. Build. Mater. 2016, 124, 199–207. [Google Scholar] [CrossRef]
  7. Feng, J.J.; Ge, Y.X.; Sun, Z.X. Test study on stress-strain relationship for asphalt concrete. J. Hydraul. Eng. 1987. [Google Scholar] [CrossRef]
  8. Seo, J.W.; Park, D.W.; Le, T.H.M. Development of an asphalt concrete mixture for Asphalt Core Rockfill Dam. Constr. Build. Mater. 2017, 140, 301–309. [Google Scholar] [CrossRef]
  9. ICOLD. Bituminous Cores for Fill Dams; International Commission on Large Dams: Bulletin 84, Paris, France, 1992. [Google Scholar]
  10. Höeg, K. Asphaltic Concrete Cores for Embankment Dams; Norwegian Geotechnical Institute of Technology: Oslo, Norway, 1993. [Google Scholar]
  11. Wang, W.B. Research on the Suitability of Asphalt Concrete as Water Barrier in Dams and Dikes. Ph.D. Thesis, University of Oslo, Oslo, Norway, 2008. [Google Scholar]
  12. Hu, C.L.; Hu, A.M.; Li, Y.H. Mechanical property and construction control of the asphalt concrete core wall in Maopingxi earth-rock fill dam. Chin. J. Rock Mech. Eng. 2001, 20, 742–746. (In Chinese) [Google Scholar]
  13. Zhong, D.H.; Cui, B.; Liu, D.H. Theoretical research on construction quality real-time monitoring and system integration of core rockfill dam. Sci. China Ser. E 2009, 52, 3406–3412. [Google Scholar] [CrossRef]
  14. Zhang, J.F.; Wang, J.L.; Cui, H.D. Causes of the Abnormal Seepage Field in a Dam with Asphaltic Concrete Core. J. Earth Sci. 2016, 27, 74–82. [Google Scholar] [CrossRef]
  15. Rong, G.; Zhu, H.C. Deformation of asphalt concrete core wall of Maopingxi earth-rockfill dam in the stage of construction. J. Hydraul. Eng. 2003, 7, 115–120. (In Chinese) [Google Scholar]
  16. Wang, M.Y.; Zhou, X.H.; Bao, C.G.; Rao, X. Study on Behaviors of Maopingxi High Rockfill Dam with Asphalt Concrete Core of Three Gorges Project. Chin. J. Rock Mech. Eng. 2007, 26, 1470–1477. (In Chinese) [Google Scholar]
  17. Zhu, S.; Cao, G.J.; Zhang, C.R. Verification of rockfill dam safety according to back analysis of monitoring data. J. Hydraul. Eng. 2004, 11, 124–128. (In Chinese) [Google Scholar]
  18. Valstad, T.; Selnes, P.B.; Nadim, F.; Aspen, B. Seismic response of a rockfill dam with an asphaltic concrete core. Int. Water Power Dam Constr. 1991, 43, 22–27. [Google Scholar]
  19. Mahinroosta, R.; Mahabadi, S.G. Seismic analysis and design of asphaltic concrete core dams. Int. J. Hydropower Dams 2002, 9, 75–78. [Google Scholar]
  20. Baziar, M.H.; Salemi, S.; Heidari, T. Analysis of Earthquake Response of an Asphalt Concrete Core Embankment Dam. Int. J. Civ. Eng. 2006, 4, 192–210. [Google Scholar]
  21. Wang, W.B.; Höeg, K.; Zhang, Y.B. Design and performance of the Yele asphalt-core rockfill dam. Can. Geotech. J. 2010, 47, 1365–1381. [Google Scholar] [CrossRef]
  22. Wang, W.B.; Höeg, K. Developments in the Design and Construction of Asphalt Core Dams. Int. J. Hydropower Dams. 2010, 17, 83–91. [Google Scholar]
  23. Feizi-Khankandi, S.; Ghalandarzadeh, A.; Mirghasemi, A.A.; Hoeg, K. Seismic analysis of the Garmrood embankment dam with asphalt concrete core. Soils Found. 2009, 49, 153–166. [Google Scholar] [CrossRef]
  24. Wang, W.B.; Feng, S.; Zhang, Y.B. Investigation of asphalt core-plinth connection in embankment dams. Case Stud. Constr. Mater. 2017, 7, 305–316. [Google Scholar] [CrossRef]
  25. Tajdini, M.; Mahinroosta, R.; Taherkhani, H. An investigation on the mechanical properties of granular materials in interface with asphaltic concrete. Constr. Build. Mater. 2014, 62, 85–95. [Google Scholar] [CrossRef]
  26. Li, Q.; Ma, X.; Ni, F.J.; Li, G. Characterization of strain rate and temperature-dependent shear properties of asphalt mixtures. J. Test. Eval. 2015, 43, 1120–1133. [Google Scholar] [CrossRef]
  27. Duncan, J.M.; Chang, C.Y. Nonlinear analysis of stress and strain in soils. J. Soil Mech. Found. Div. ASCE 1970, 96, 1629–1653. [Google Scholar]
  28. Khalid, S.; Singh, B.; Nayak, G.C.; Jain, O.P. Nonlinear Analysis of Concrete Face Rockfill Dam. J. Geotech. Eng. 1990, 116, 822–837. [Google Scholar] [CrossRef]
  29. Lee, J.Y.; Choi, Y.K.; Kim, H.S.; Yun, S.T. Hydrologic characteristics of a large rockfill dam: Implications for water leakage. Eng. Geol. 2005, 80, 43–59. [Google Scholar] [CrossRef]
Figure 1. Strength envelope of asphalt concrete triaxial test.
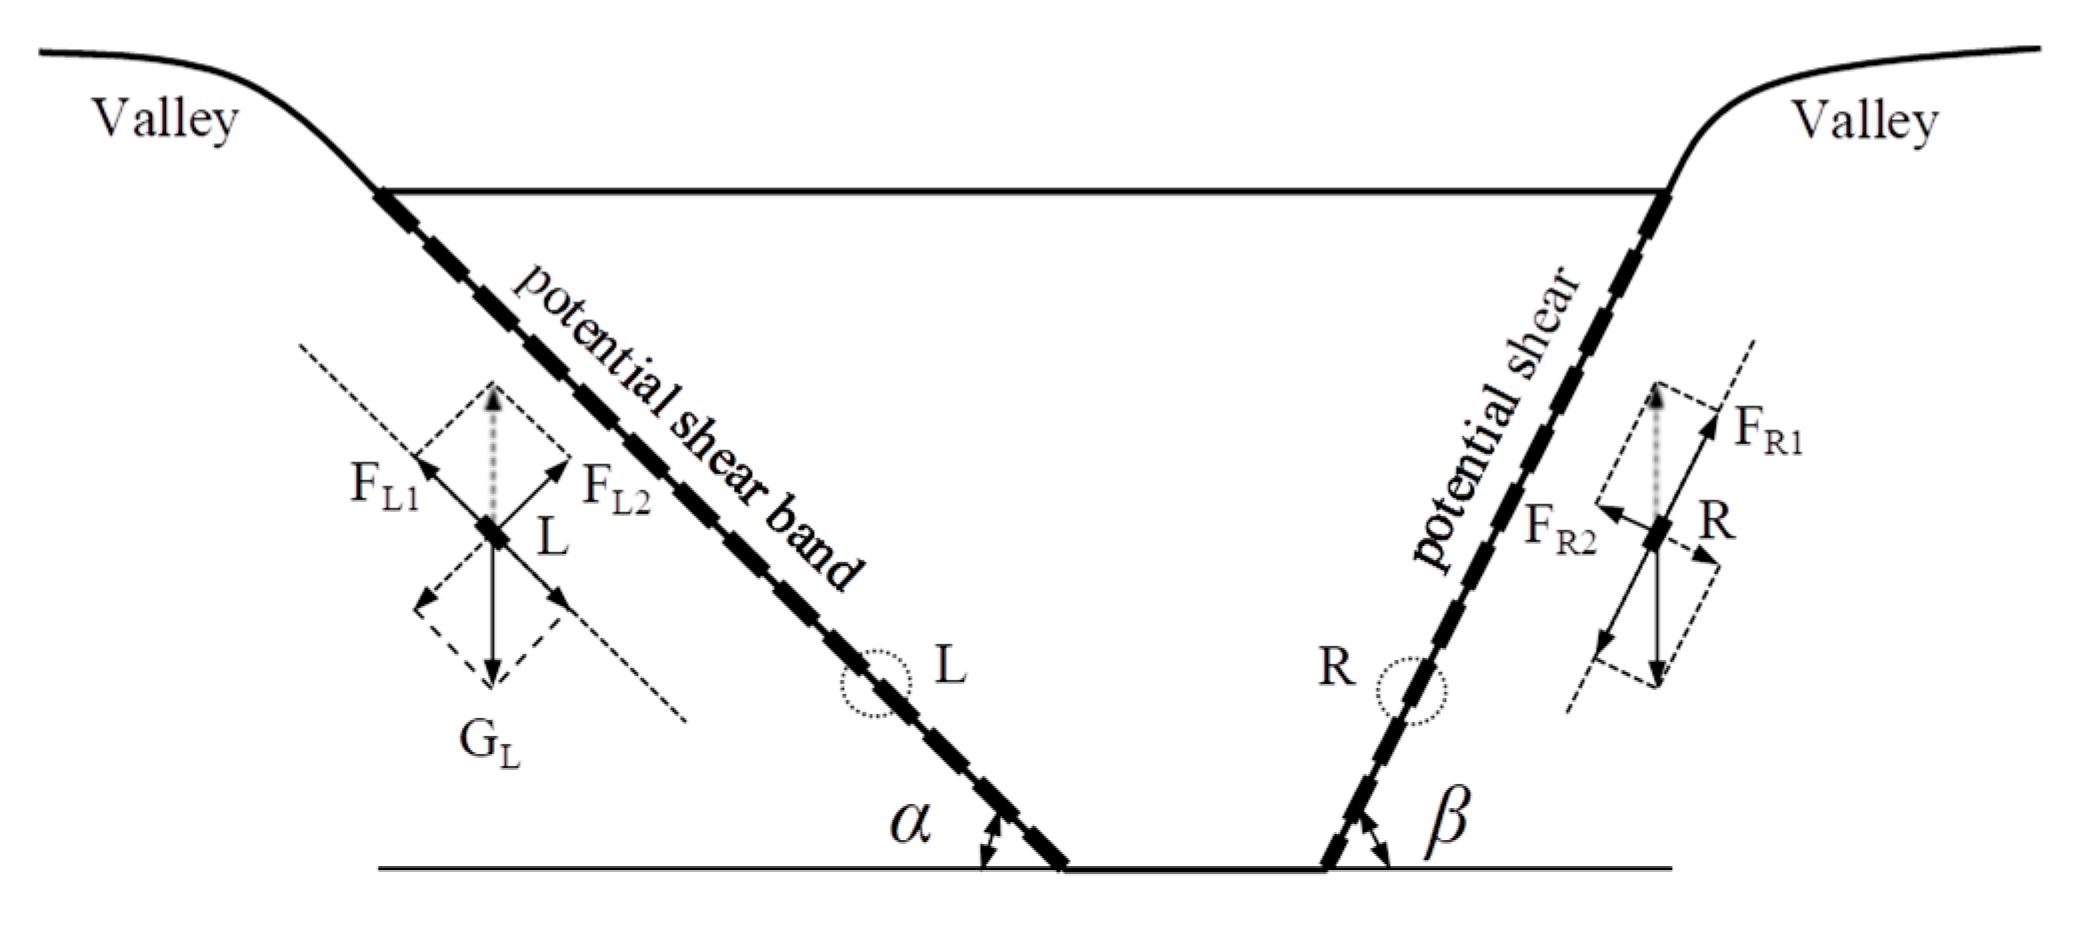
Applsci 09 04618 g001
Figure 2. Mechanical diagram of asphalt concrete core in potential shear band.
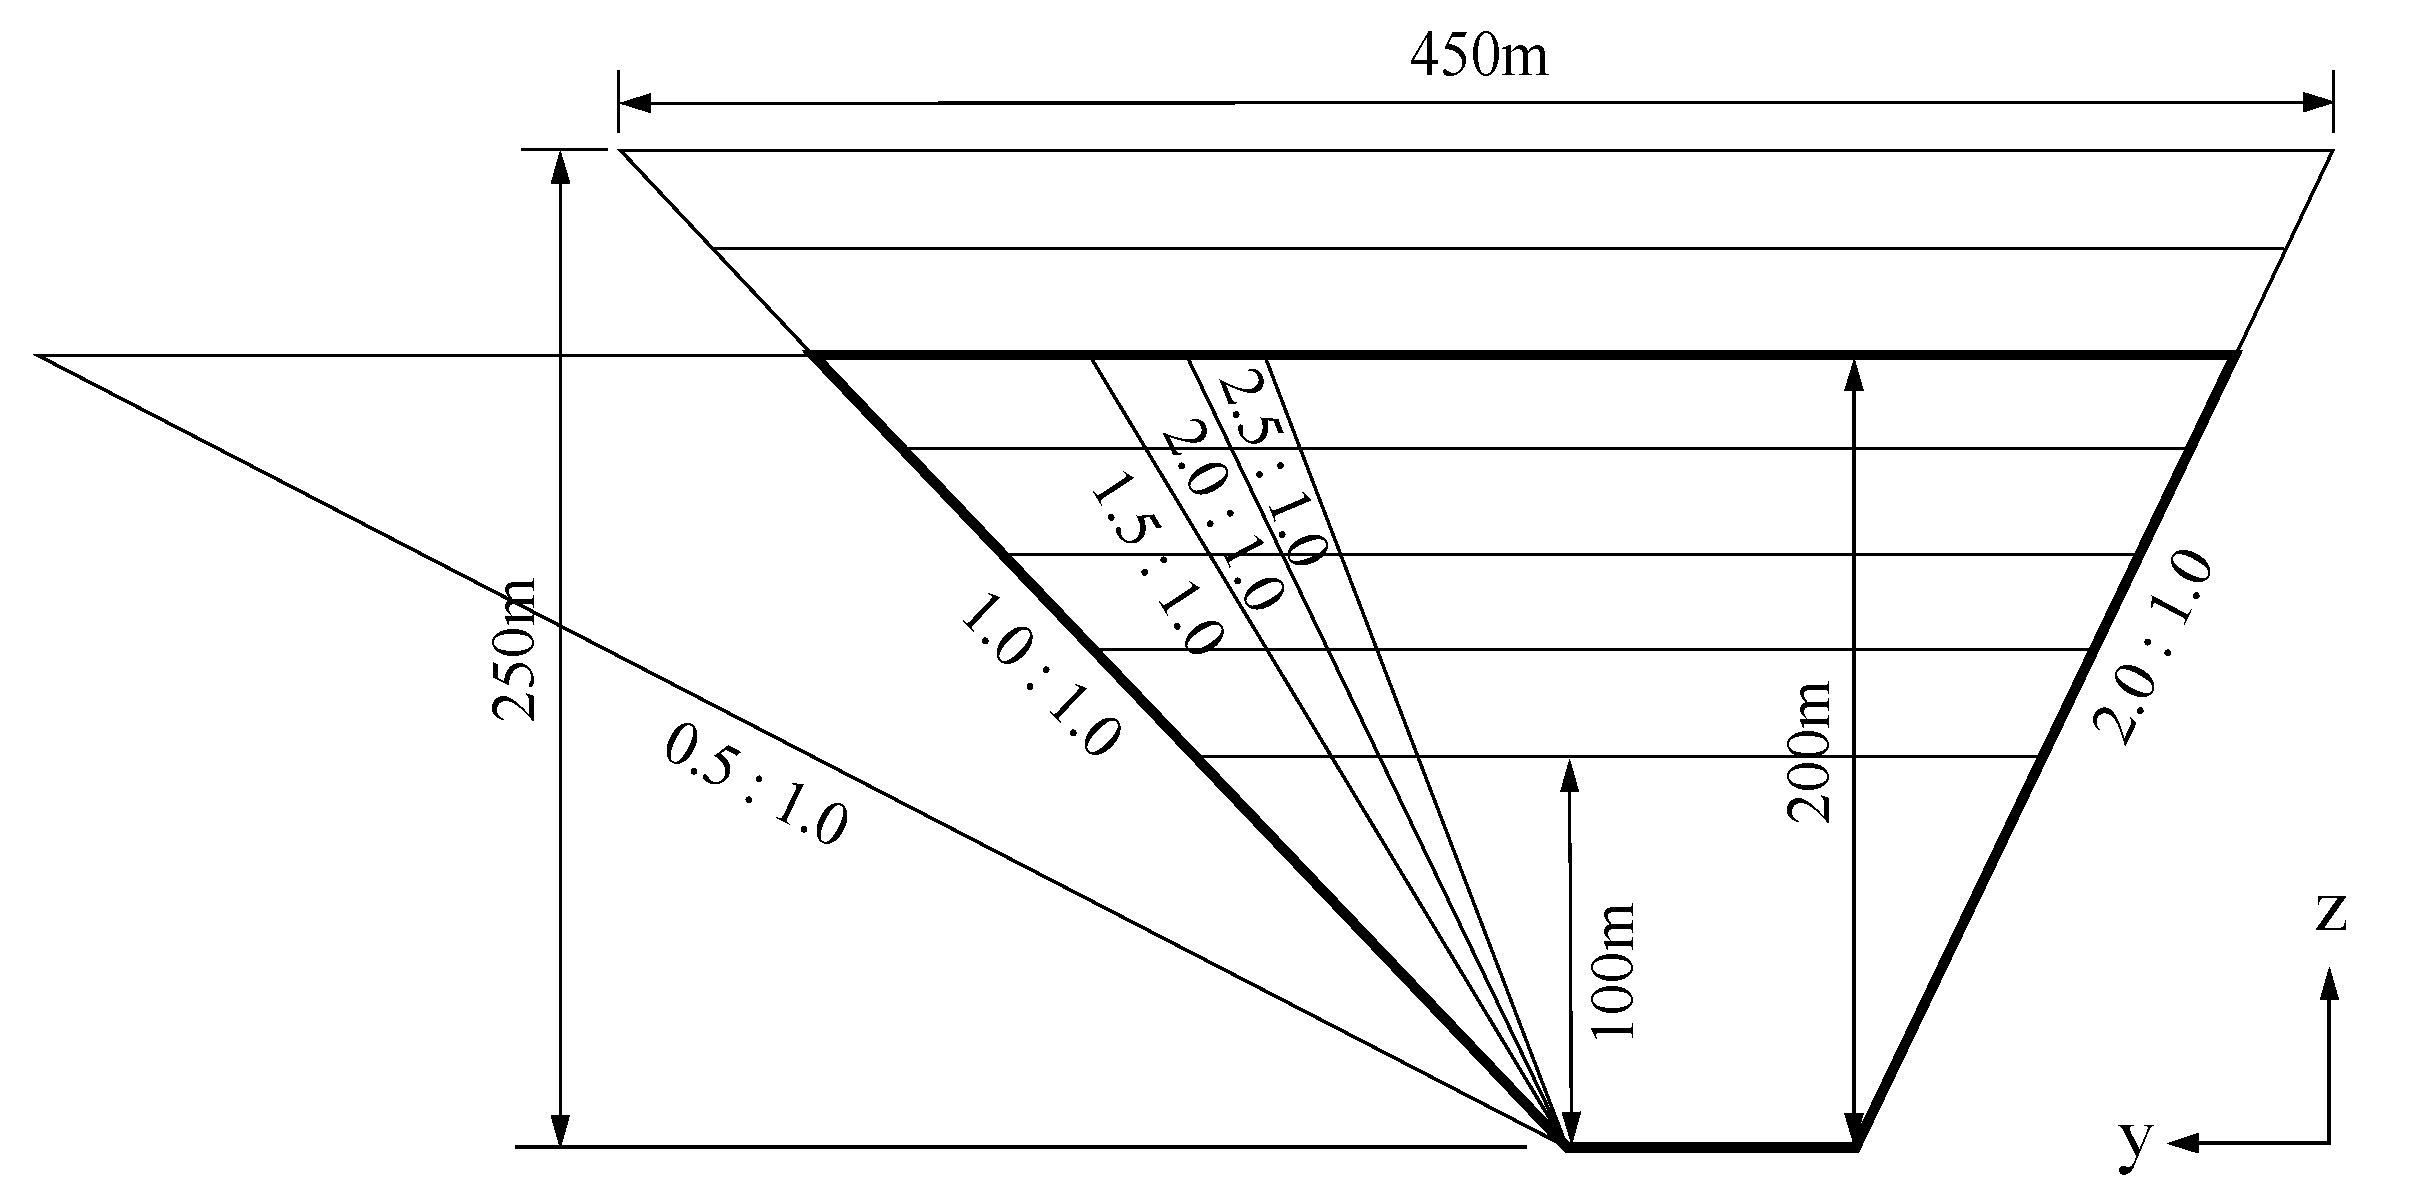
Applsci 09 04618 g002
Figure 3. Diagram of calculation schemes.
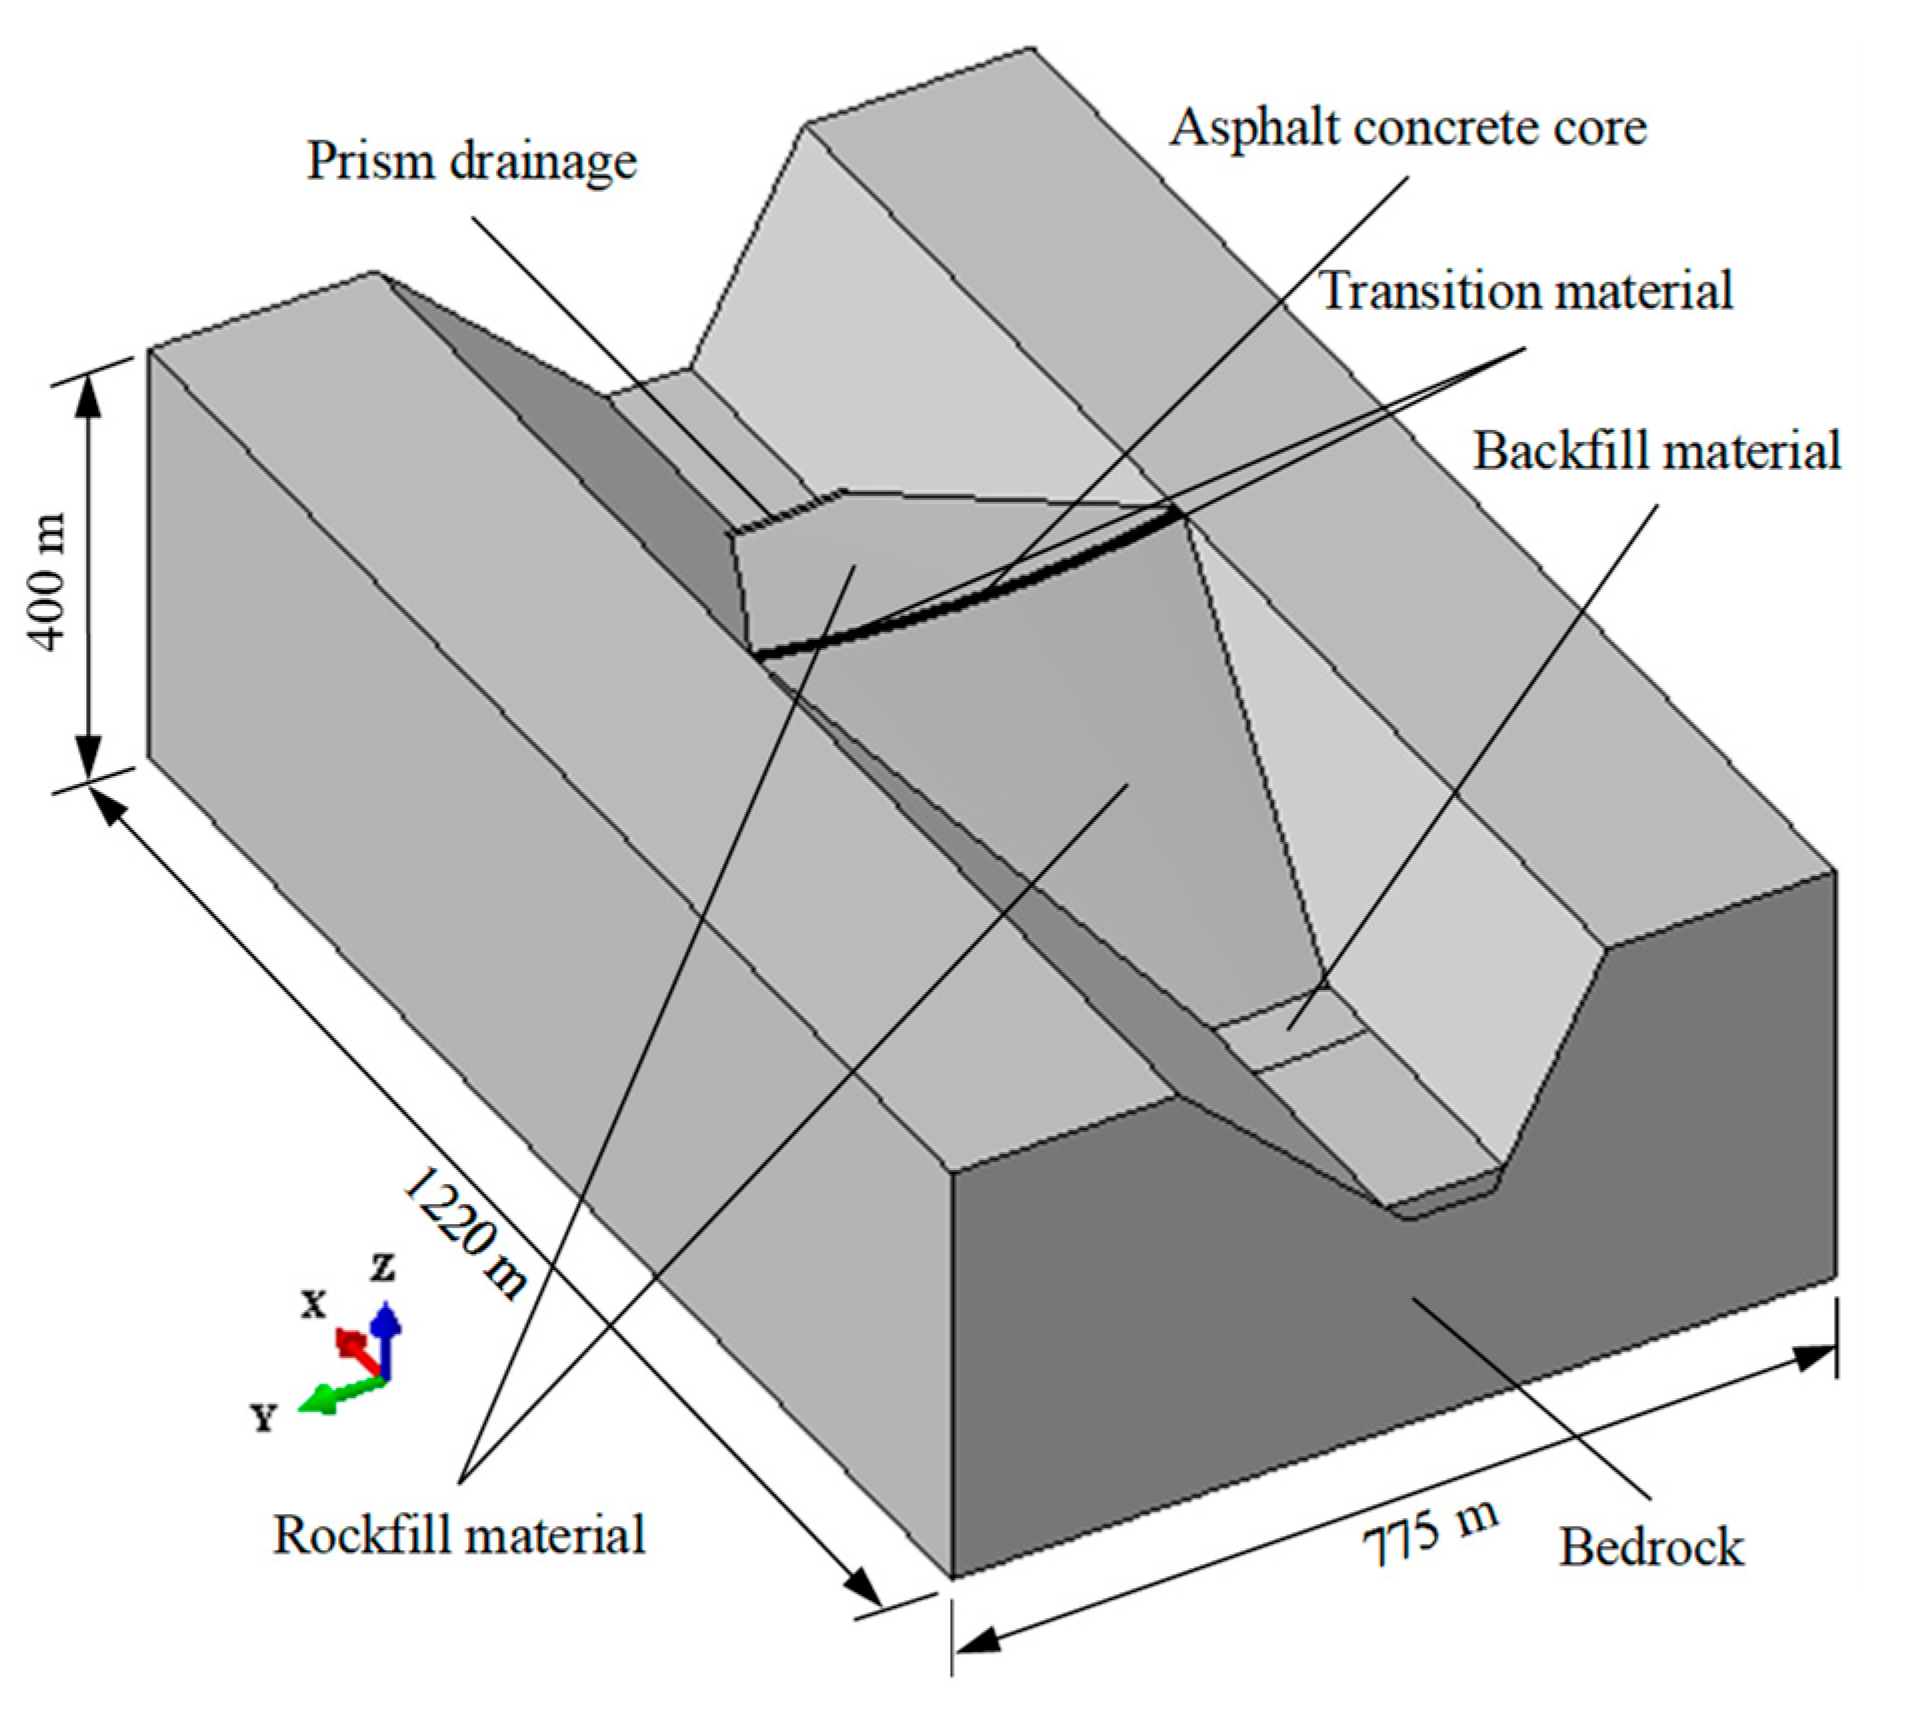
Applsci 09 04618 g003
Figure 4. Material regions of finite element method (FEM) standard model for asphalt concrete core rockfill dams (ACCRDs).
Applsci 09 04618 g004
Figure 5. Meshes of FEM standard model for ACCRDs.
Applsci 09 04618 g005
Figure 6. Settlement contour of ACC (h =200 m).
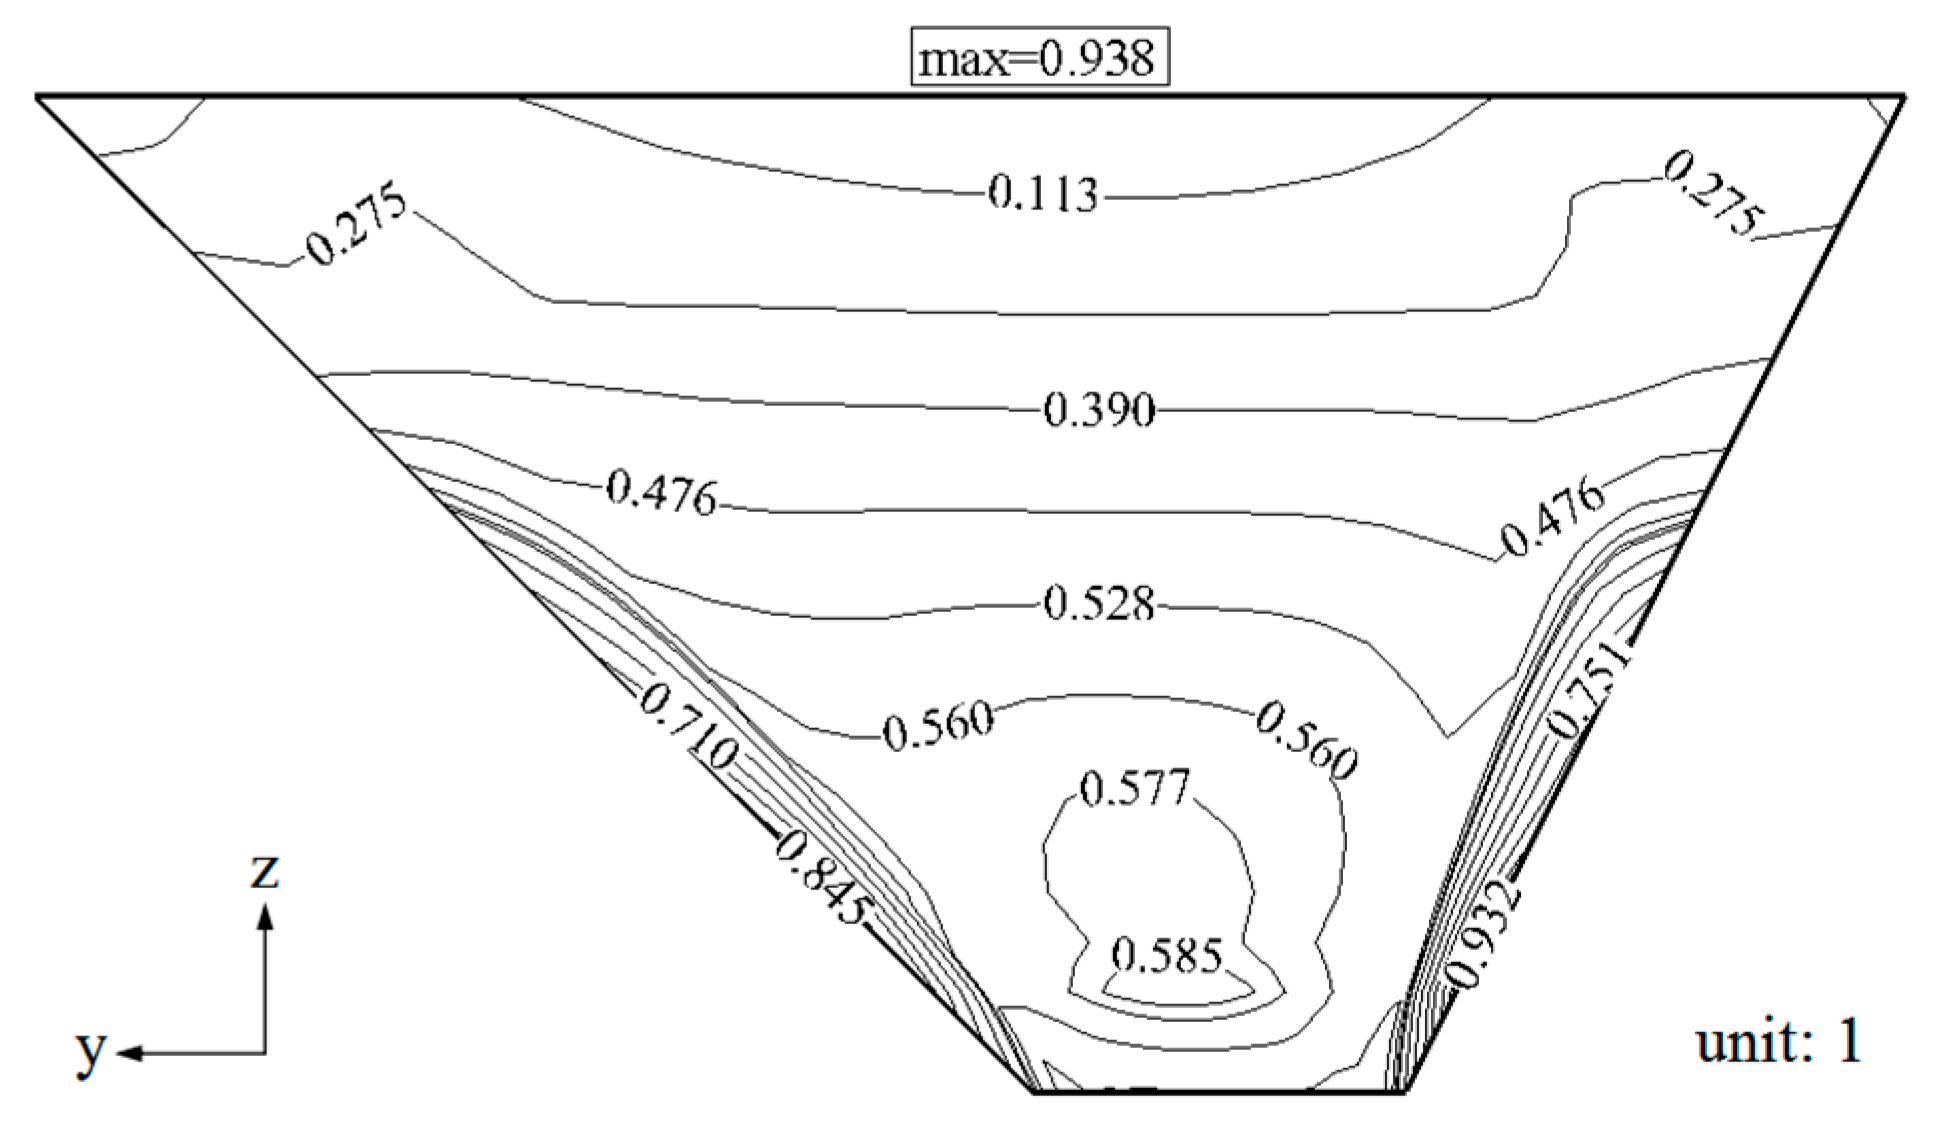
Applsci 09 04618 g006
Figure 7. Stress level contours of ACC (h =200 m).
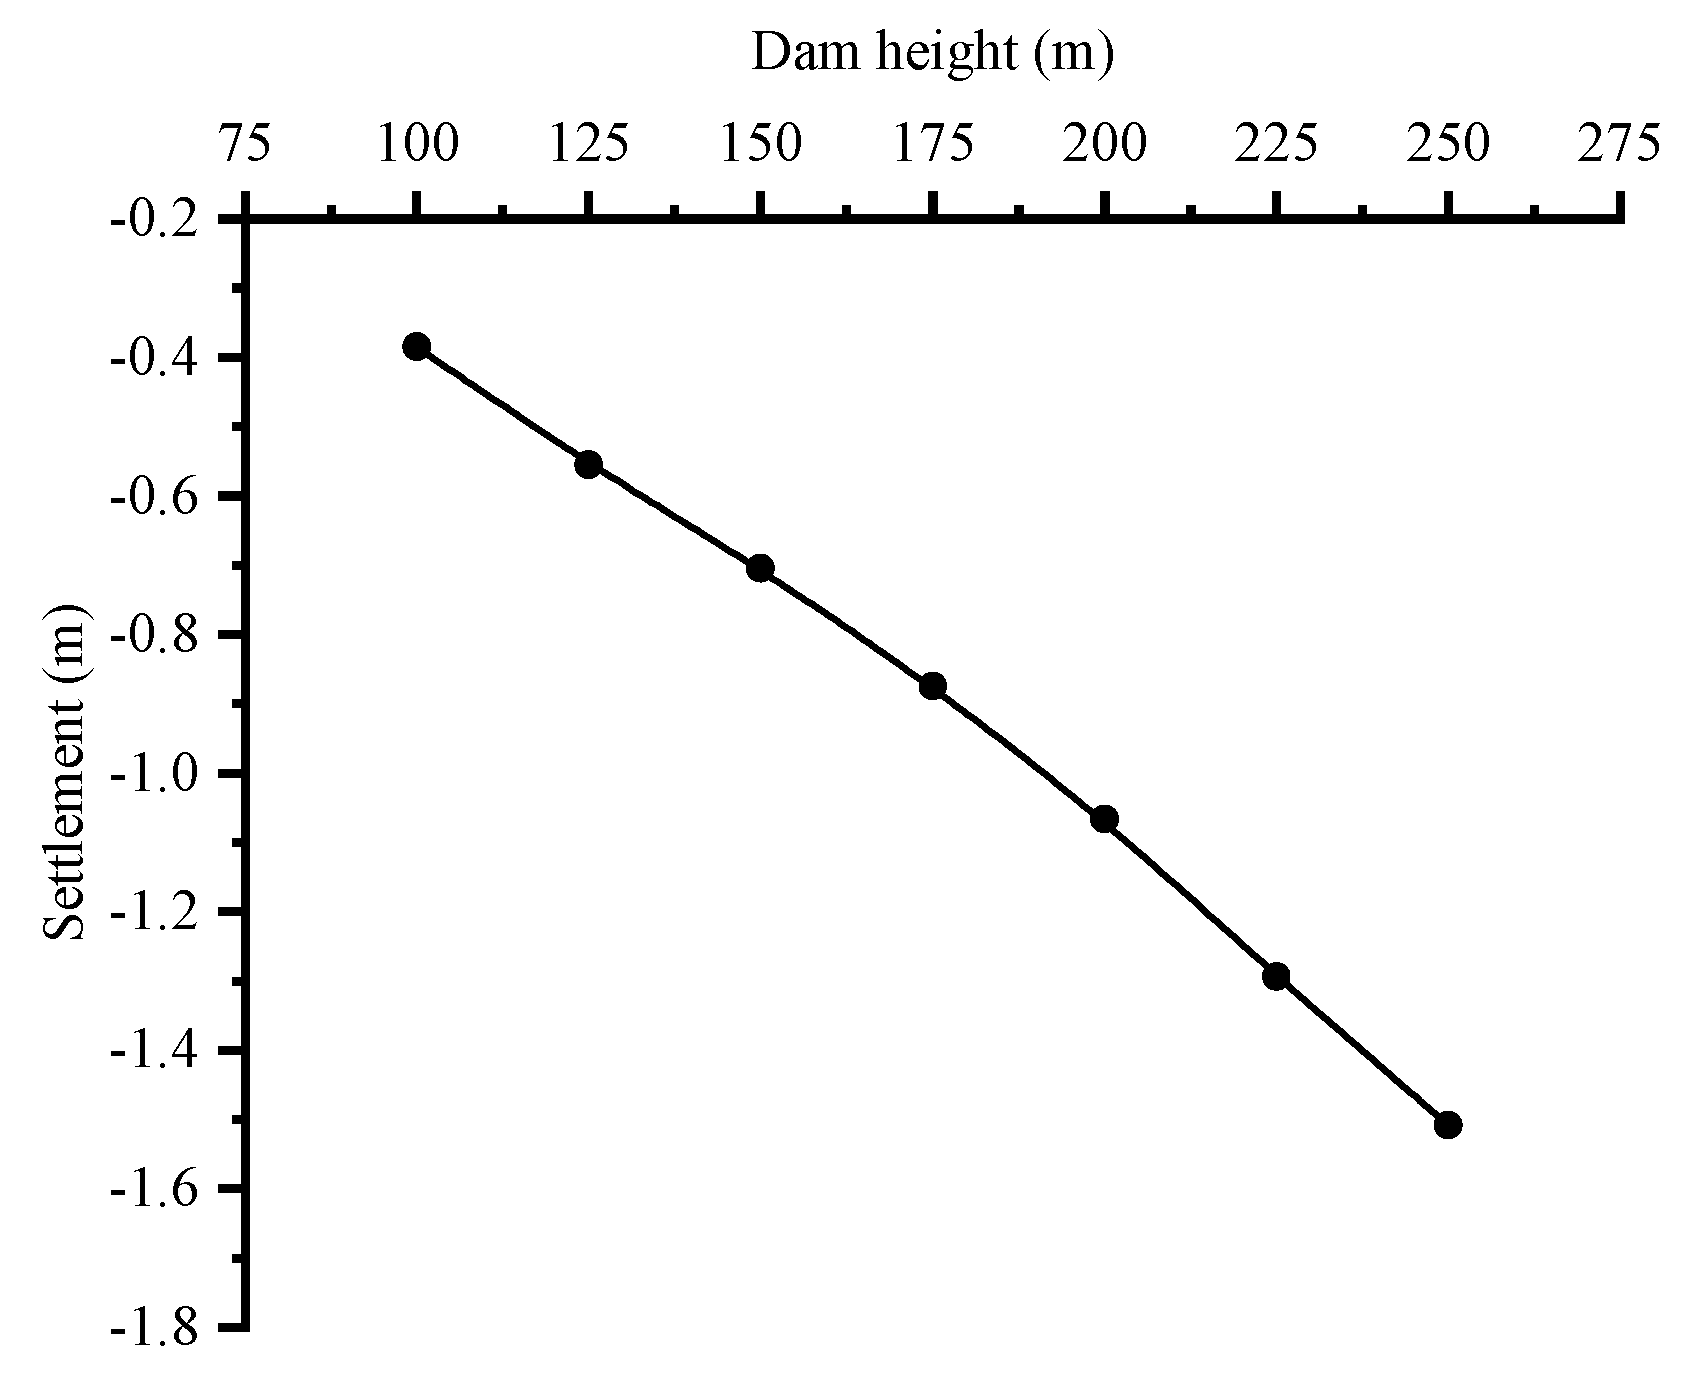
Applsci 09 04618 g007
Figure 8. Relationship between settlement maximum of ACC and dam height.
Applsci 09 04618 g008
Figure 9. Relationship between stress level maximum of ACC and dam height.
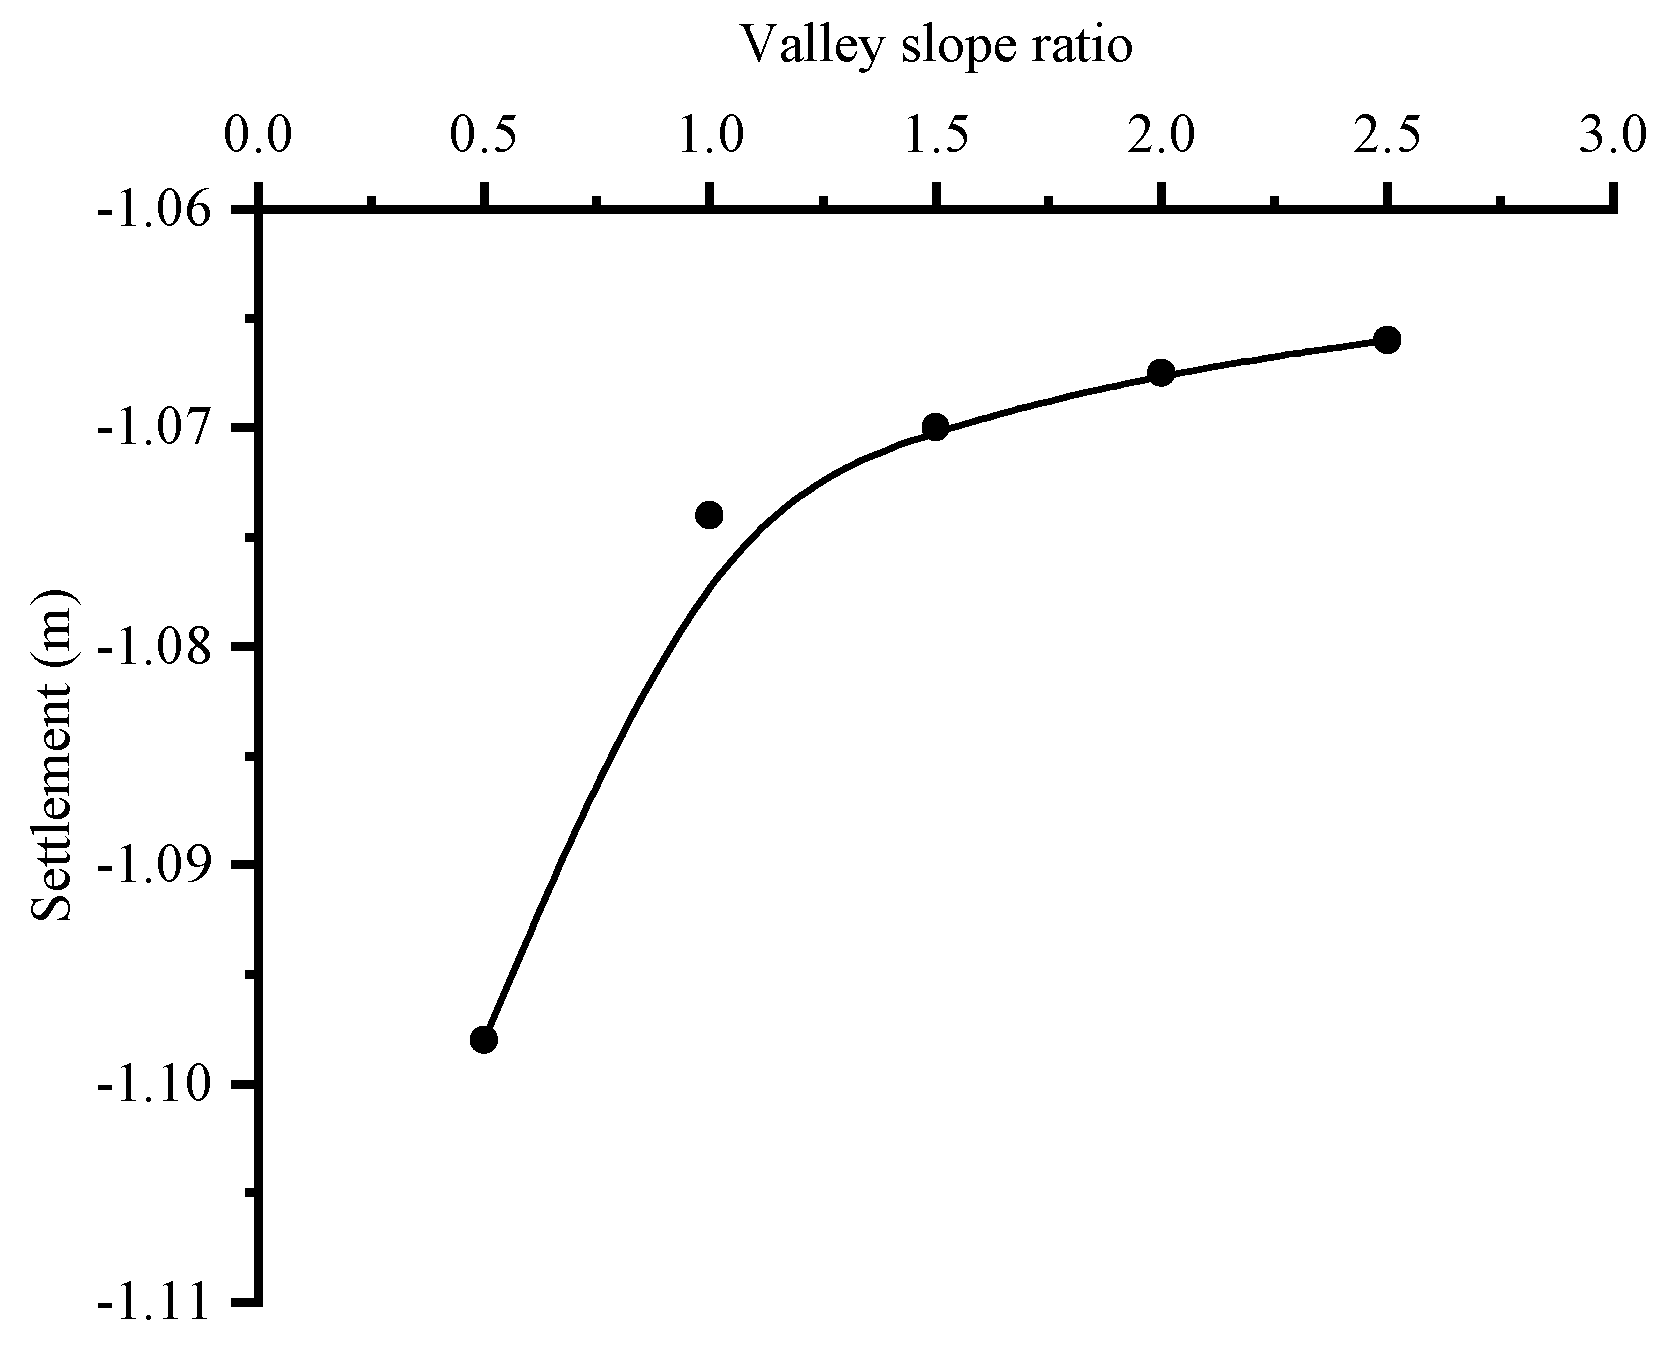
Applsci 09 04618 g009
Figure 10. Relationship between settlement maximum of ACC and valley slope ratio.
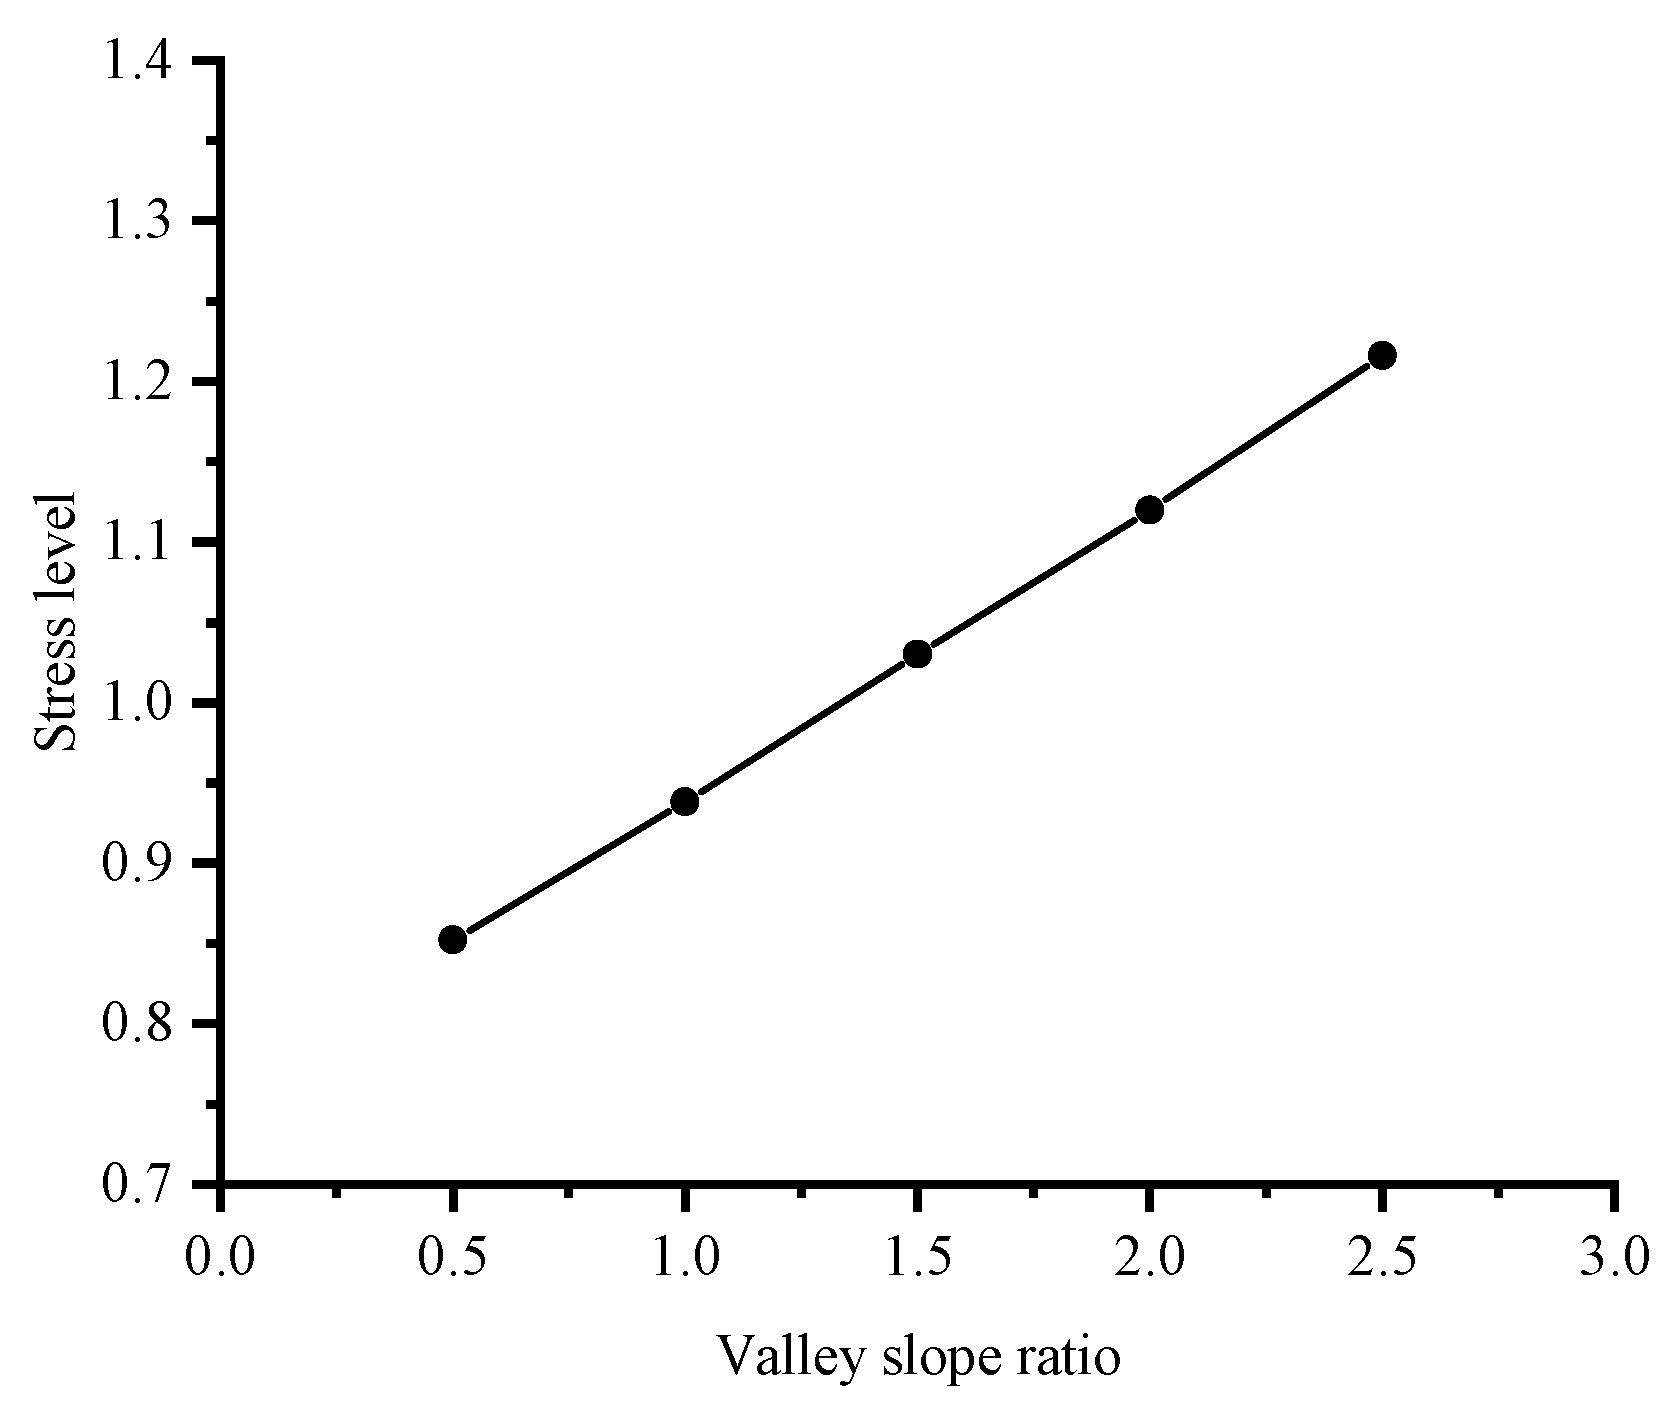
Applsci 09 04618 g010
Figure 11. Relationship between stress level maximum of ACC and valley slope ratio.
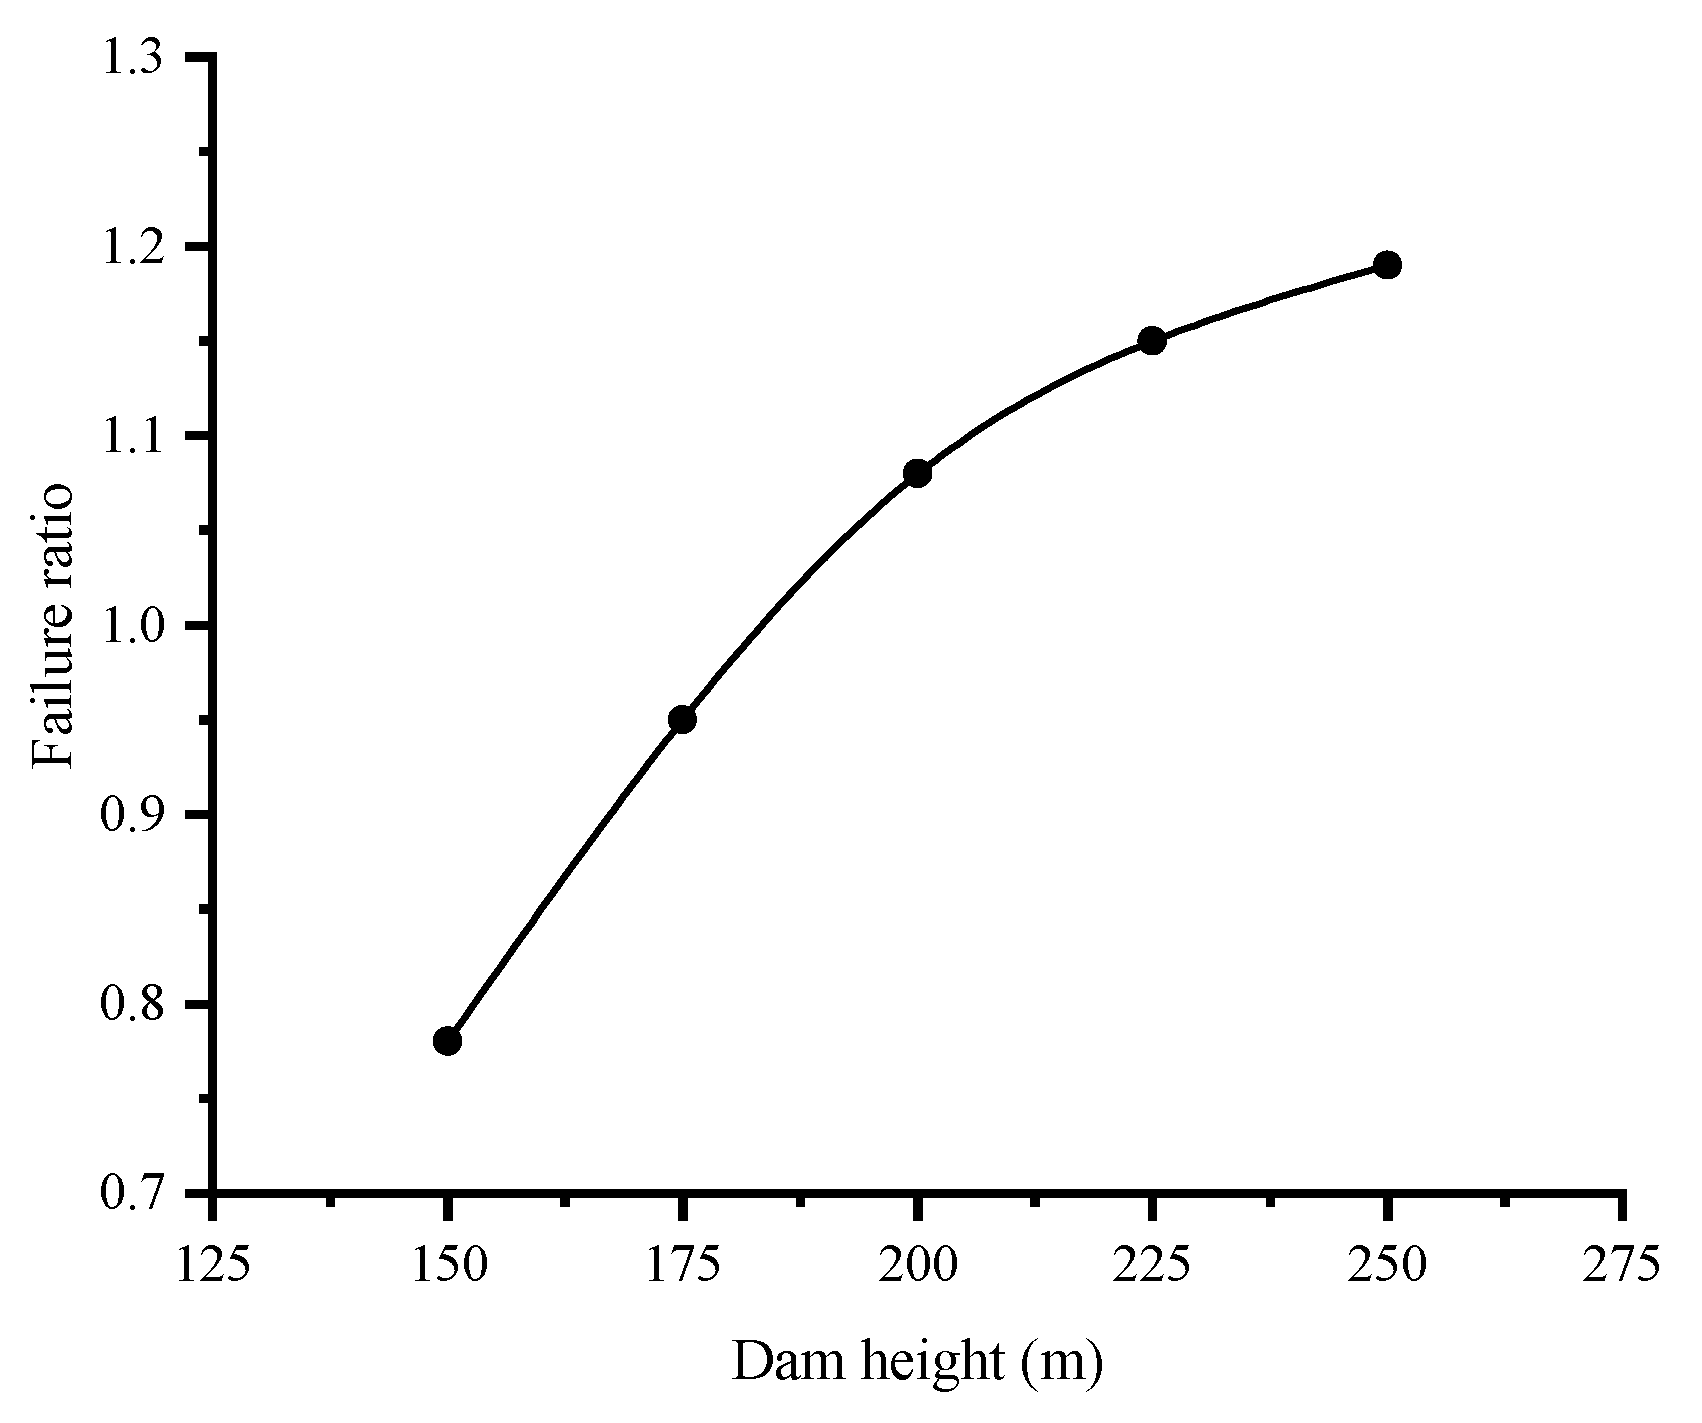
Applsci 09 04618 g011
Figure 12. Relationship between failure ratio of ACC that meets YSFCS and dam height.
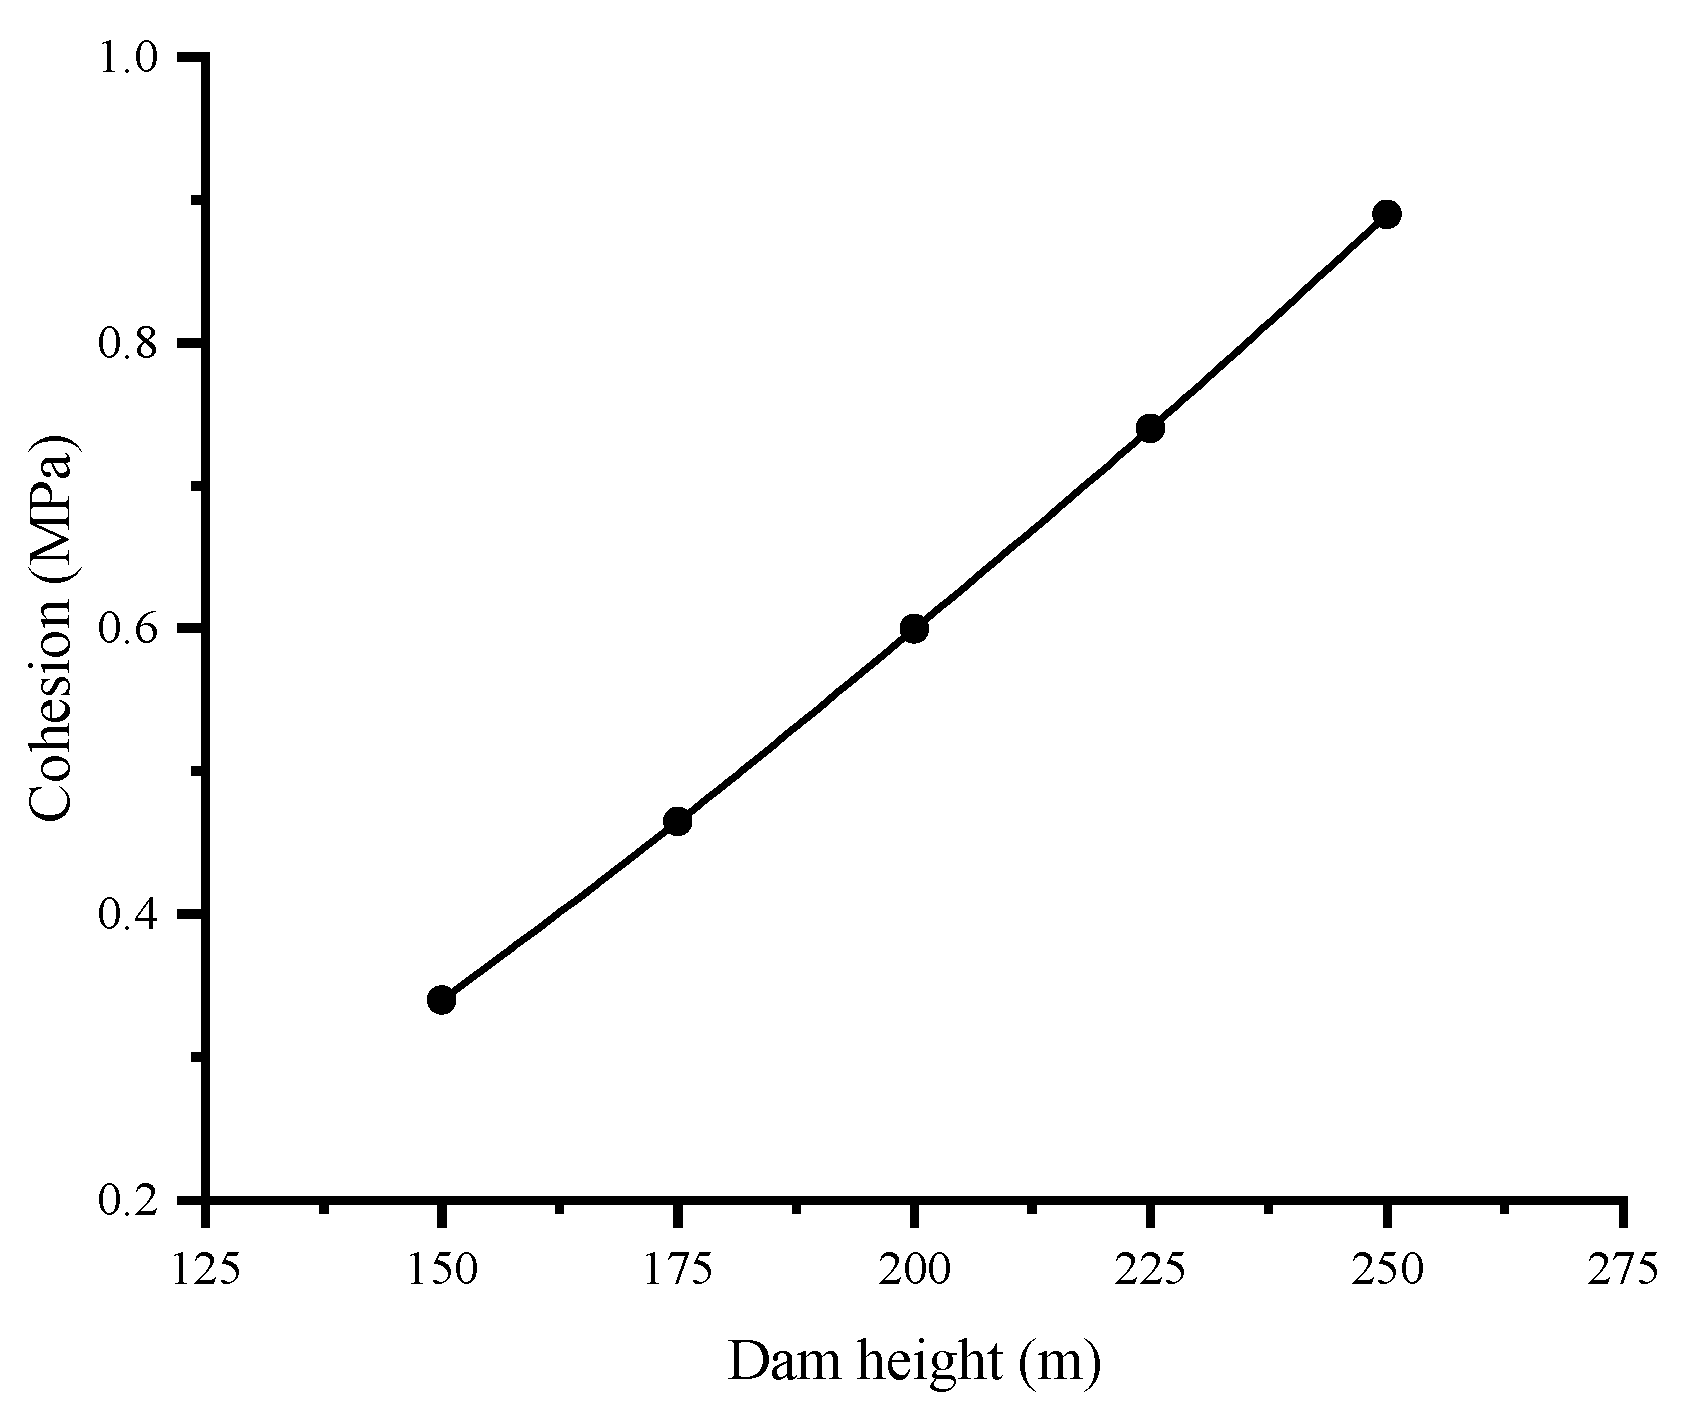
Applsci 09 04618 g012
Figure 13. Relationship between cohesion of ACC that meets YSFCS and dam height.
Applsci 09 04618 g013
Figure 14. Relationship between internal friction angle of ACC that meets YSFCS and dam height.
Applsci 09 04618 g014
Figure 15. Reasonable value ranges for the failure ratio, cohesion, and internal friction angle of ACC that comprehensively meet YSFCS under different dam heights.
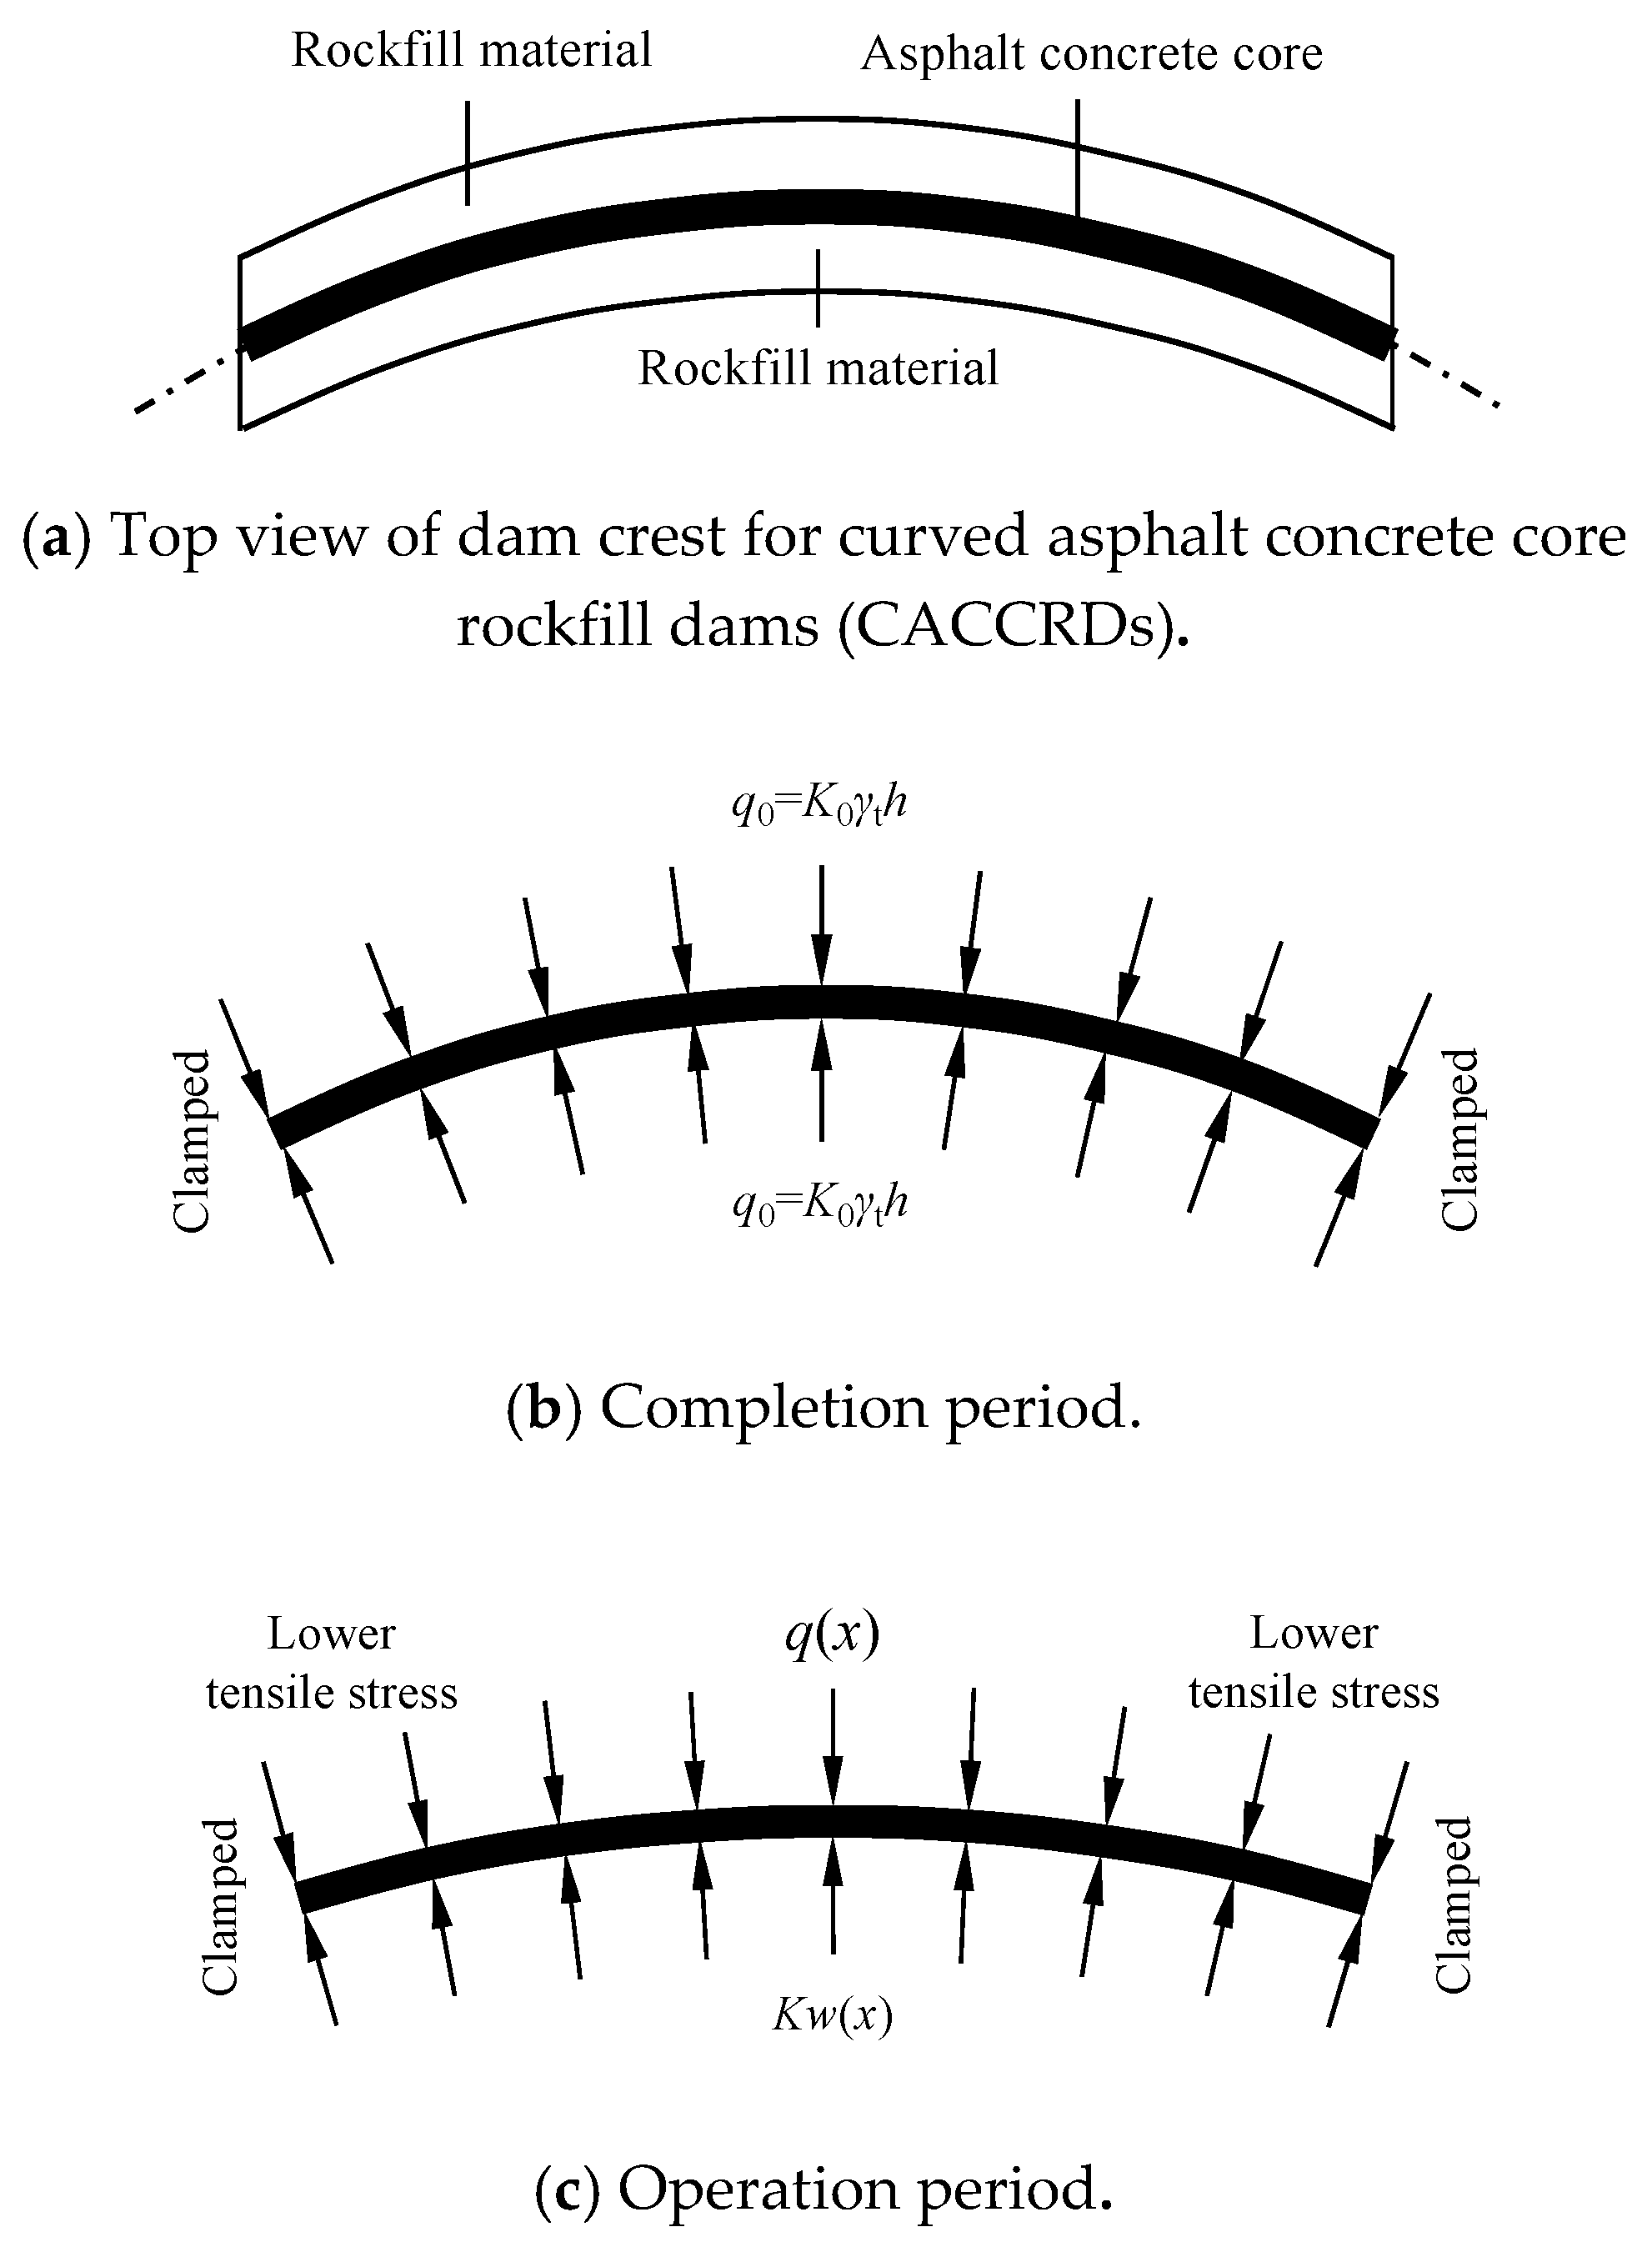
Applsci 09 04618 g015
Figure 16. Mechanical diagram of SACC (completion period and operation period).
Applsci 09 04618 g016
Figure 17. Mechanical diagram of curved asphalt concrete core (CACC) (completion period and operation period).
Applsci 09 04618 g017
Figure 18. Flexural deformation contours of SACC (h = 200 m).
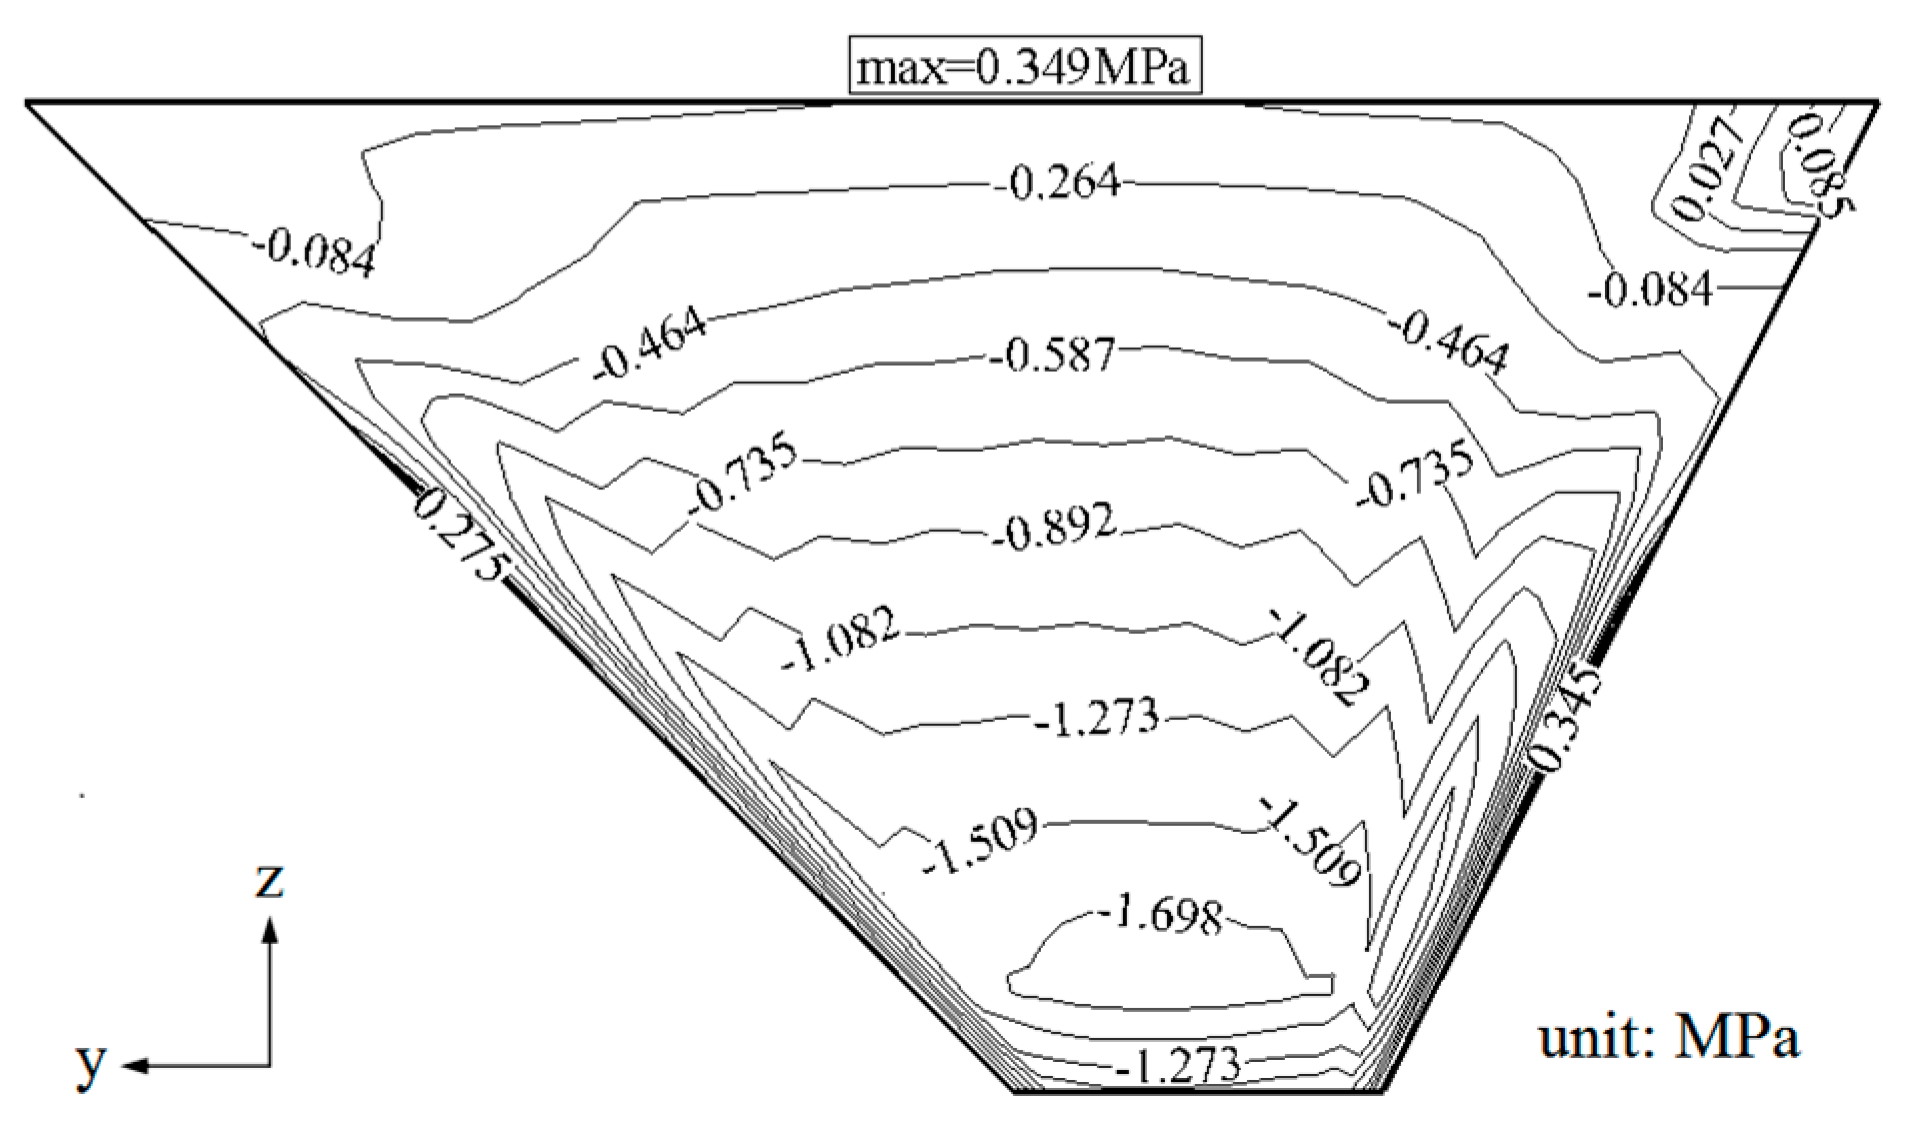
Applsci 09 04618 g018
Figure 19. Major principal stress contours of SACC (h = 200 m).
Applsci 09 04618 g019
Figure 20. Relationship between flexural deformation maximum of SACC and dam height.
Applsci 09 04618 g020
Figure 21. Relationship between tensile stress maximum of SACC and dam height.
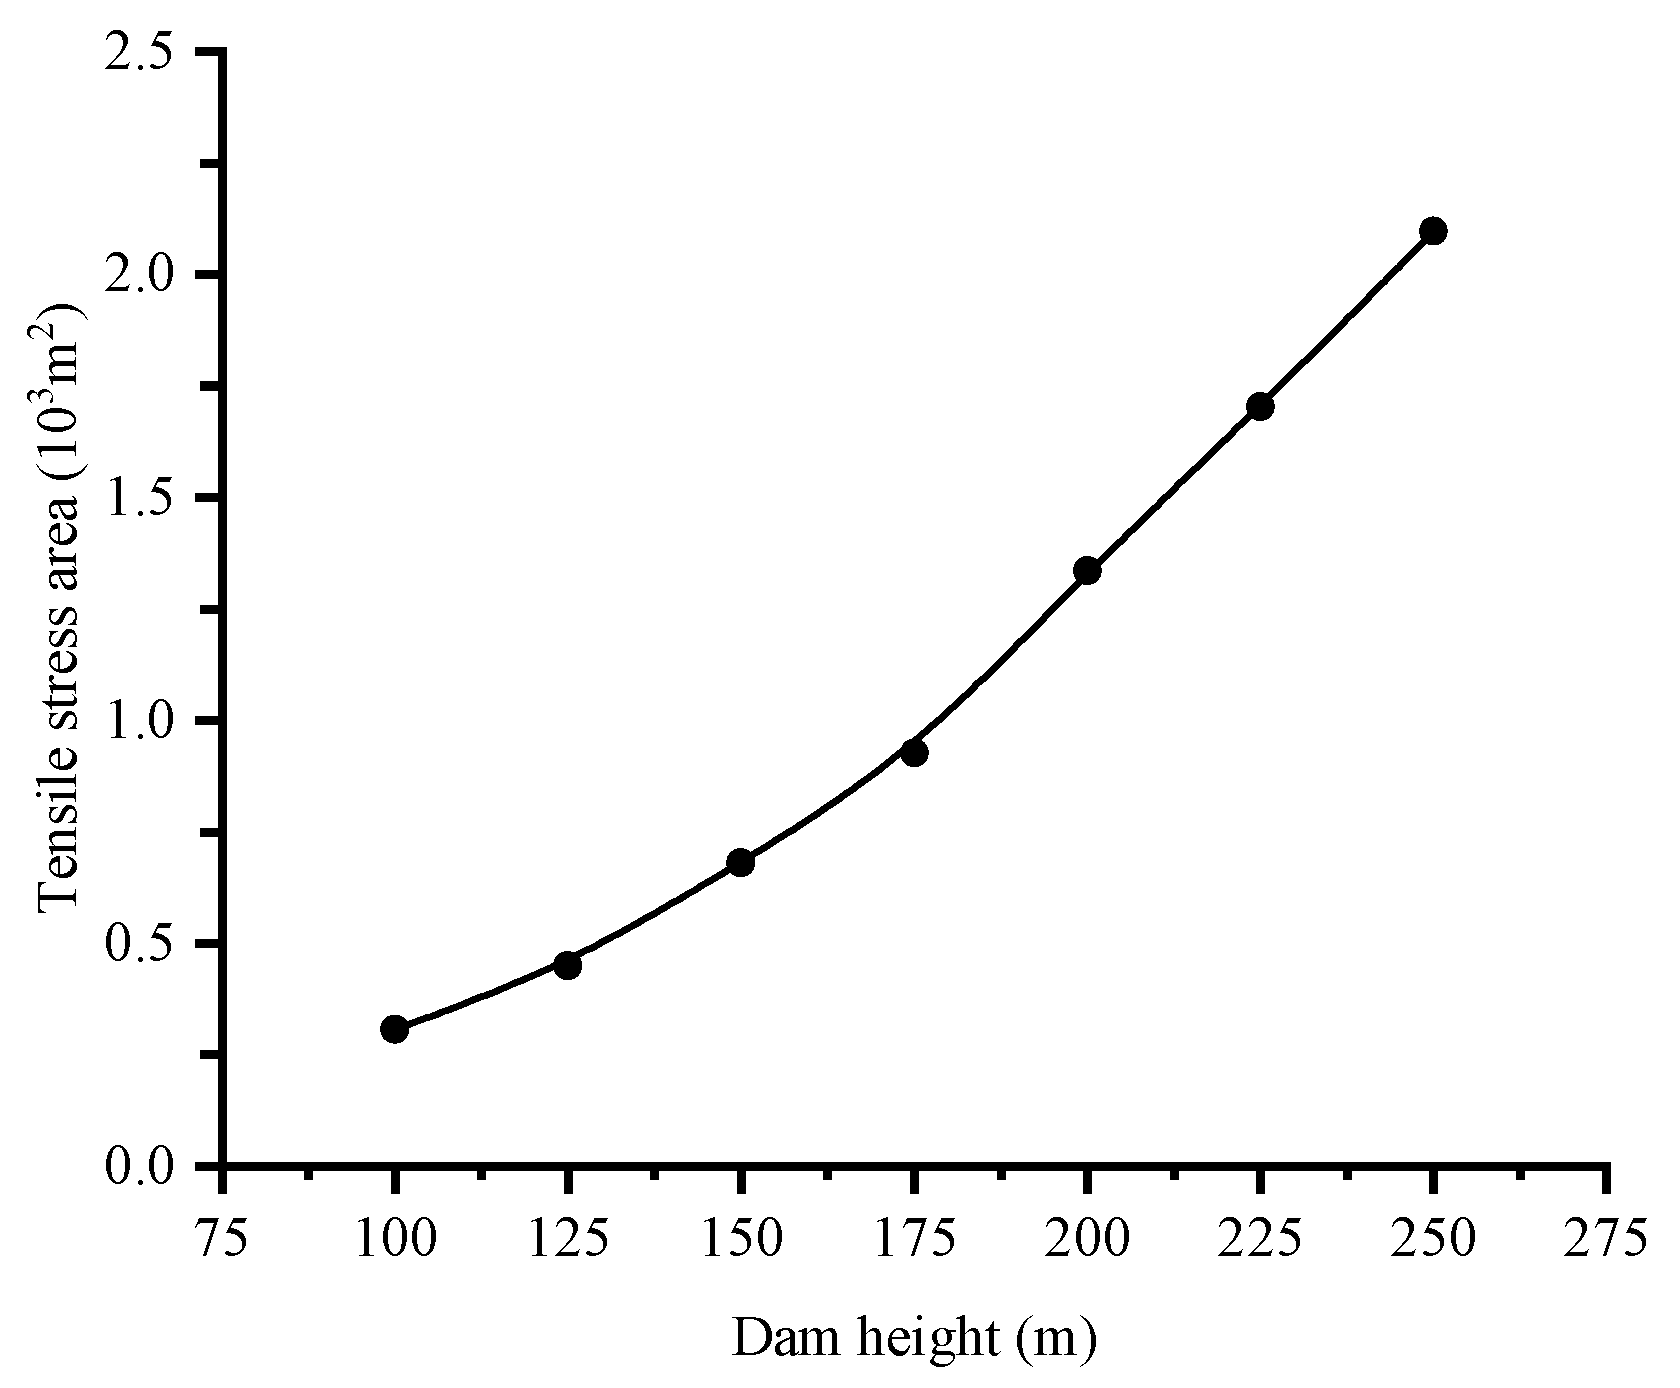
Applsci 09 04618 g021
Figure 22. Relationship between tensile stress area maximum of SACC and dam height.
Applsci 09 04618 g022
Figure 23. Relationship between flexural deformation maximum of SACC and valley slope ratio.
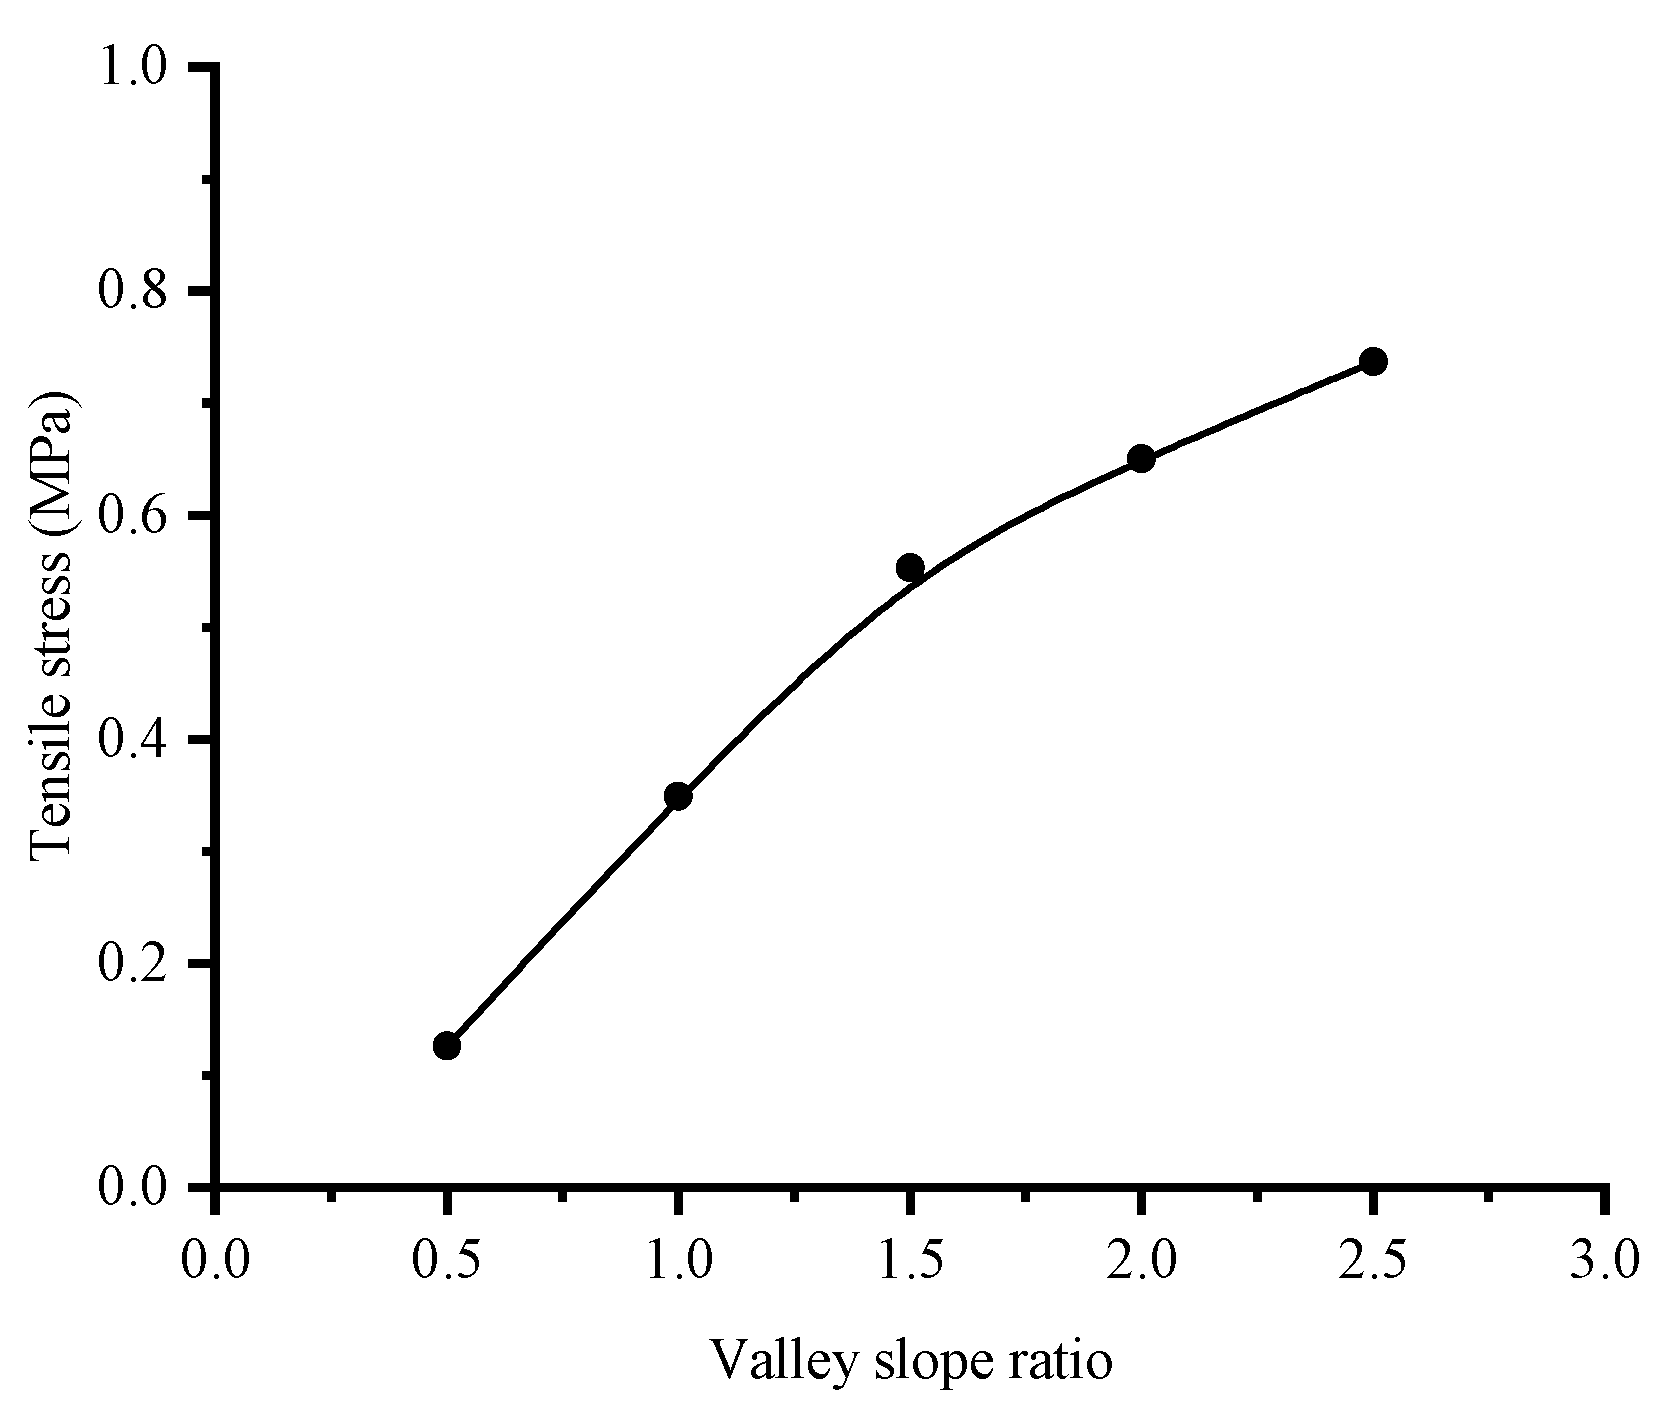
Applsci 09 04618 g023
Figure 24. Relationship between tensile stress maximum of SACC and valley slope ratio.
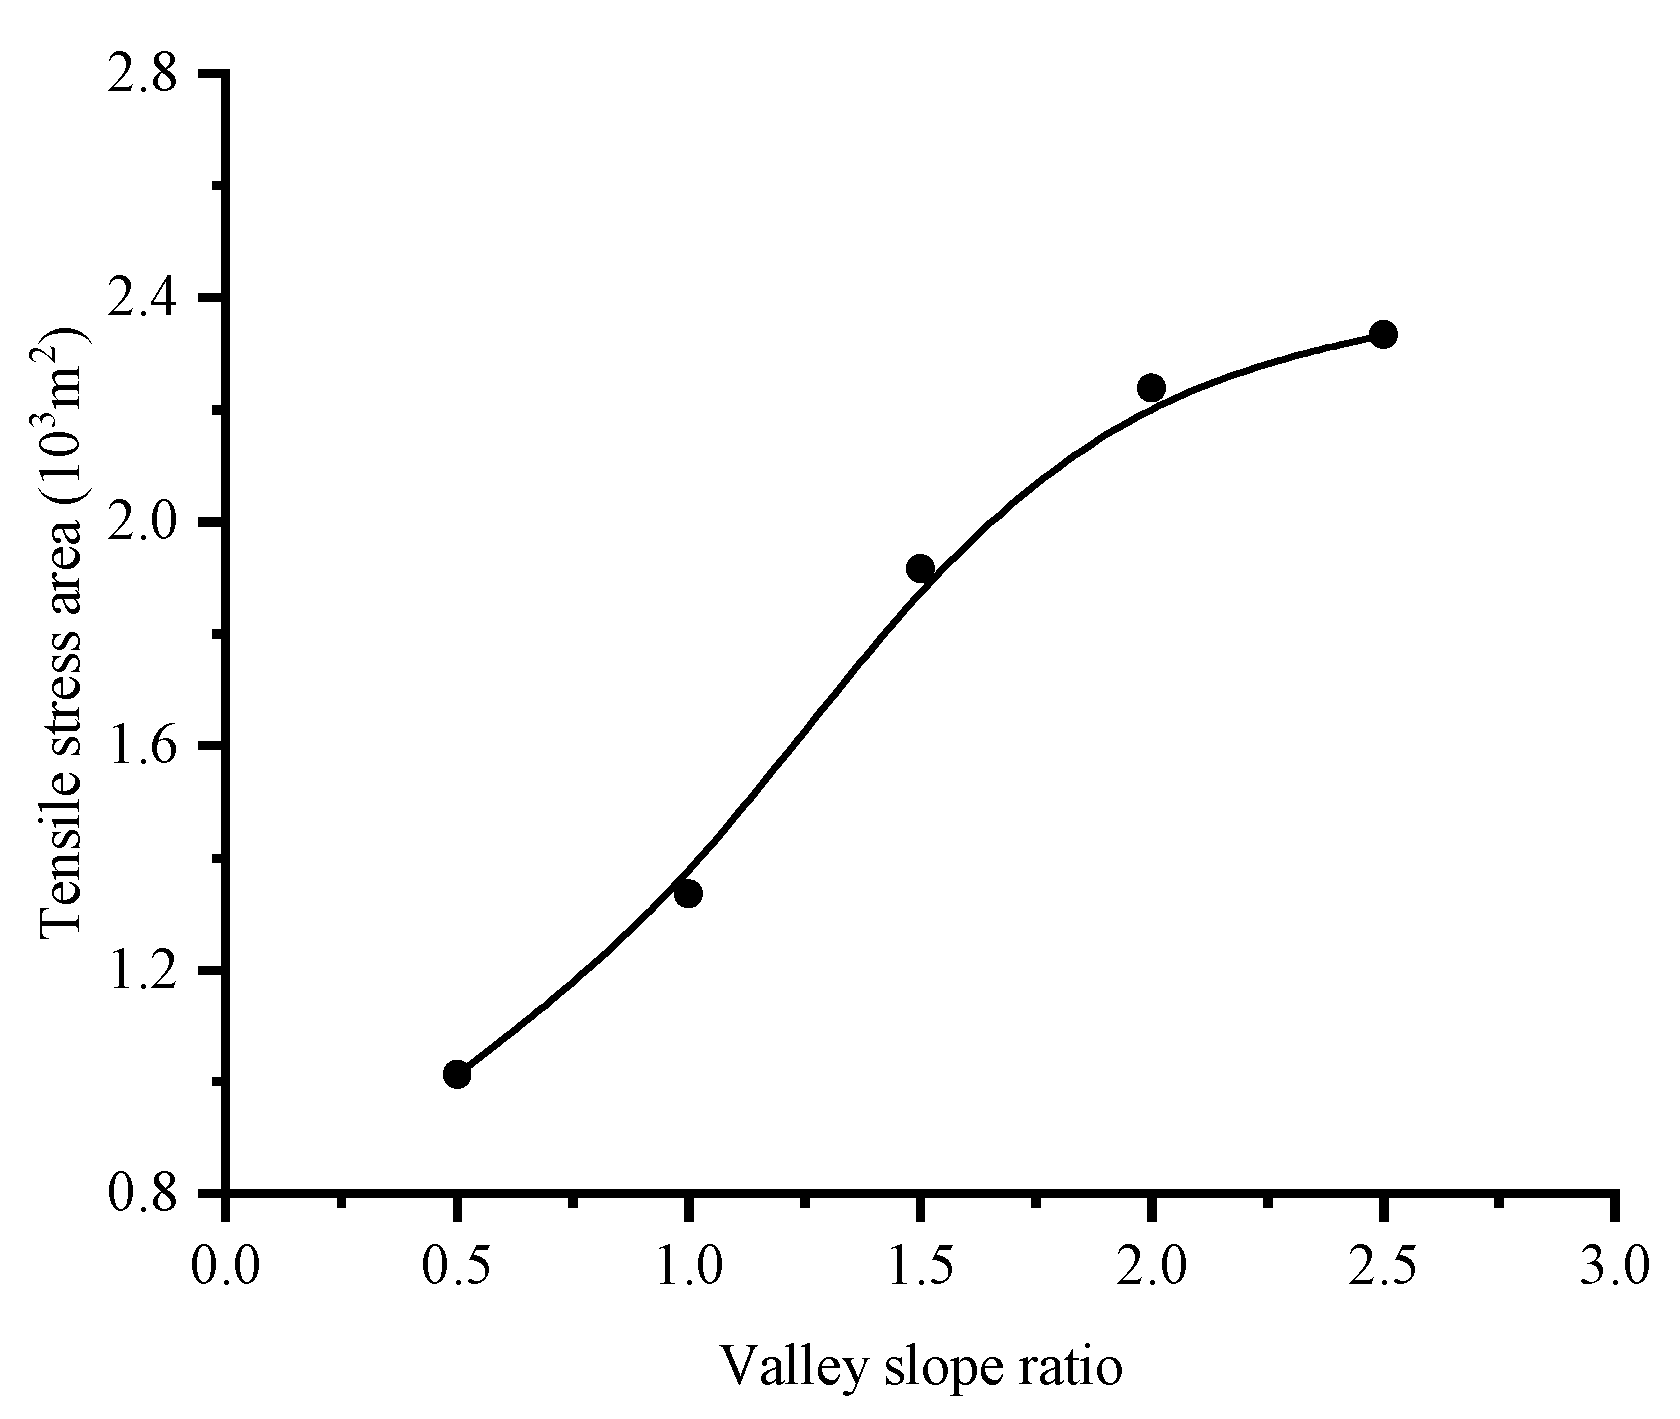
Applsci 09 04618 g024
Figure 25. Relationship between tensile stress area maximum of SACC and valley slope ratio.
Applsci 09 04618 g025
Figure 26. Material regions of FEM standard model for CACCRDs.
Applsci 09 04618 g026
Figure 27. Meshes of FEM standard model for CACCRDs.
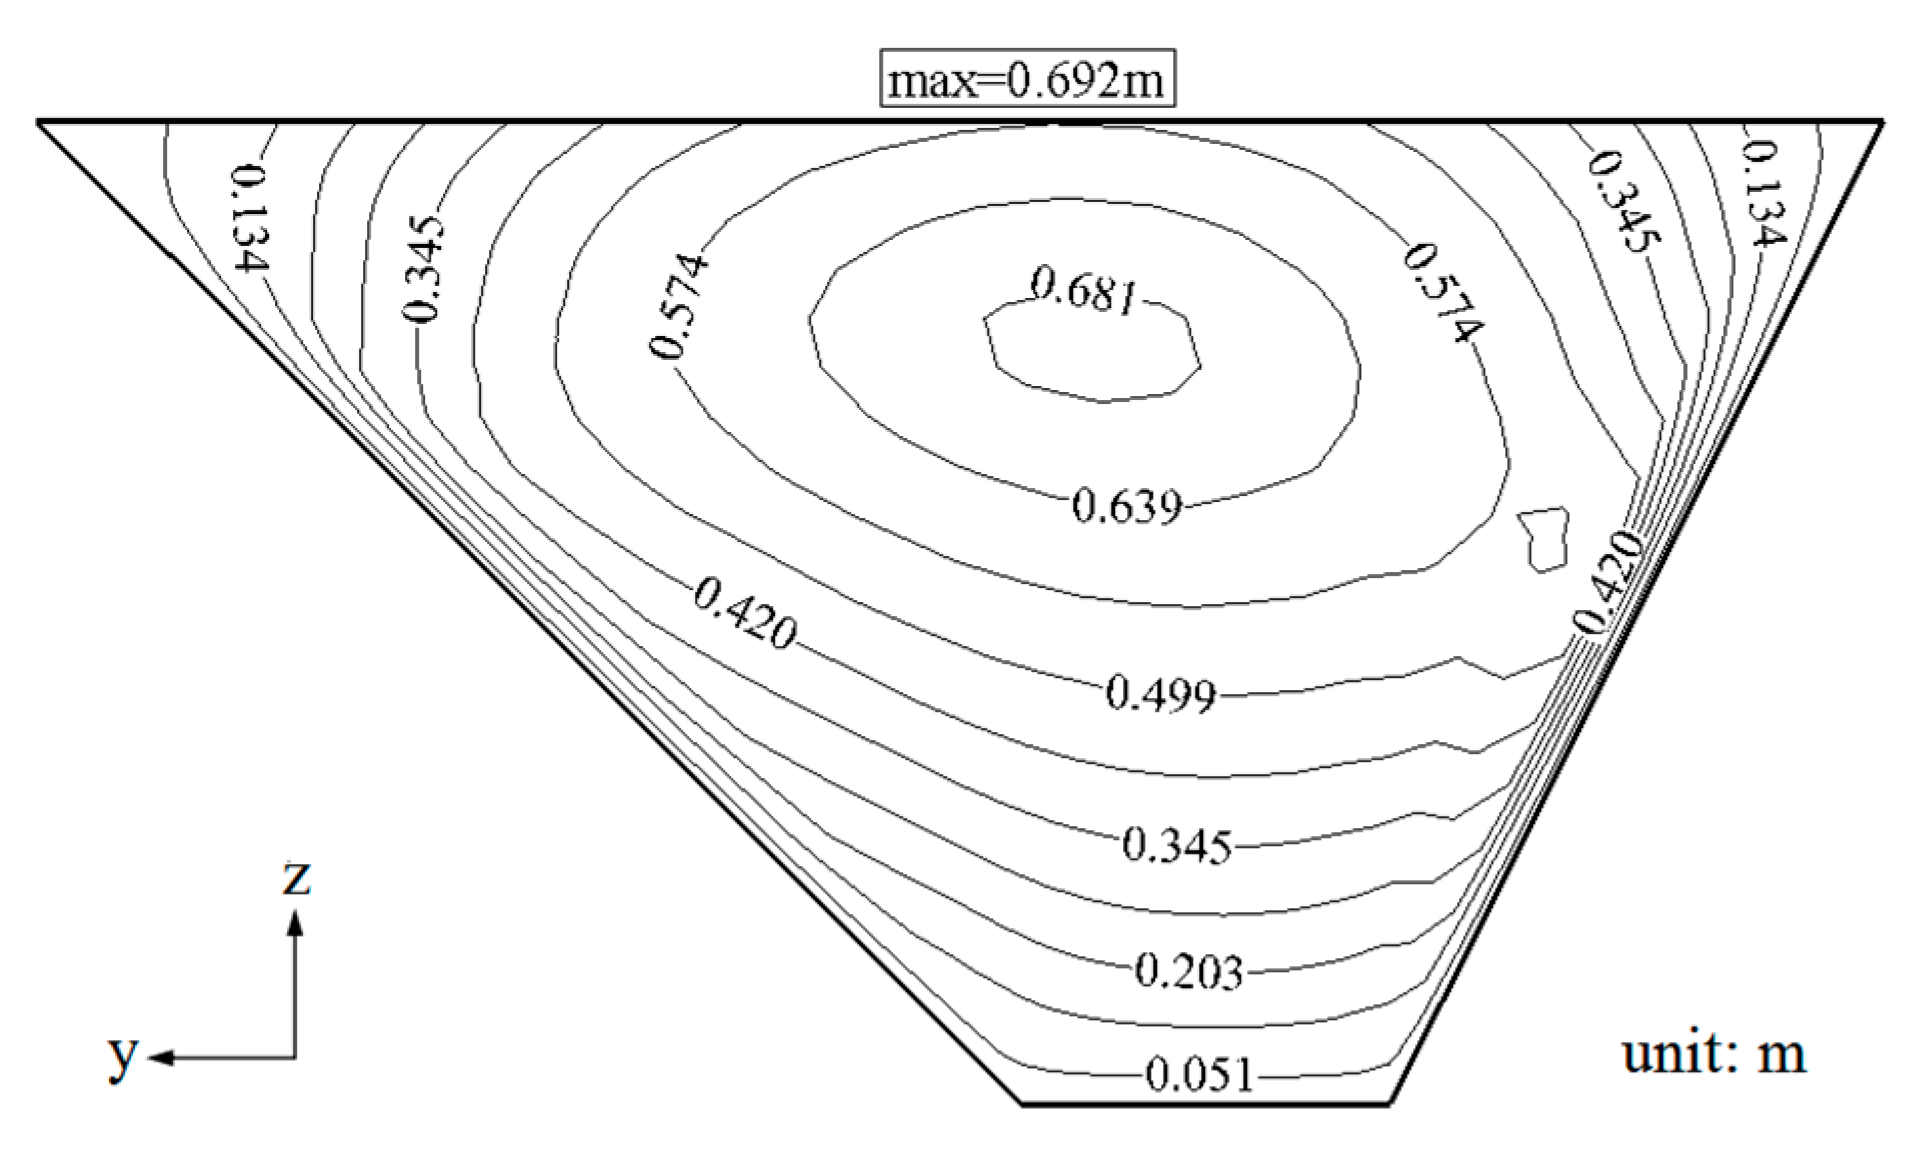
Applsci 09 04618 g027
Figure 28. Flexural deformation contours of CACC (k = 0.85 × 10⁻³).
Applsci 09 04618 g028
Figure 29. Major principal stress contours of CACC (k = 0.85 × 10⁻³).
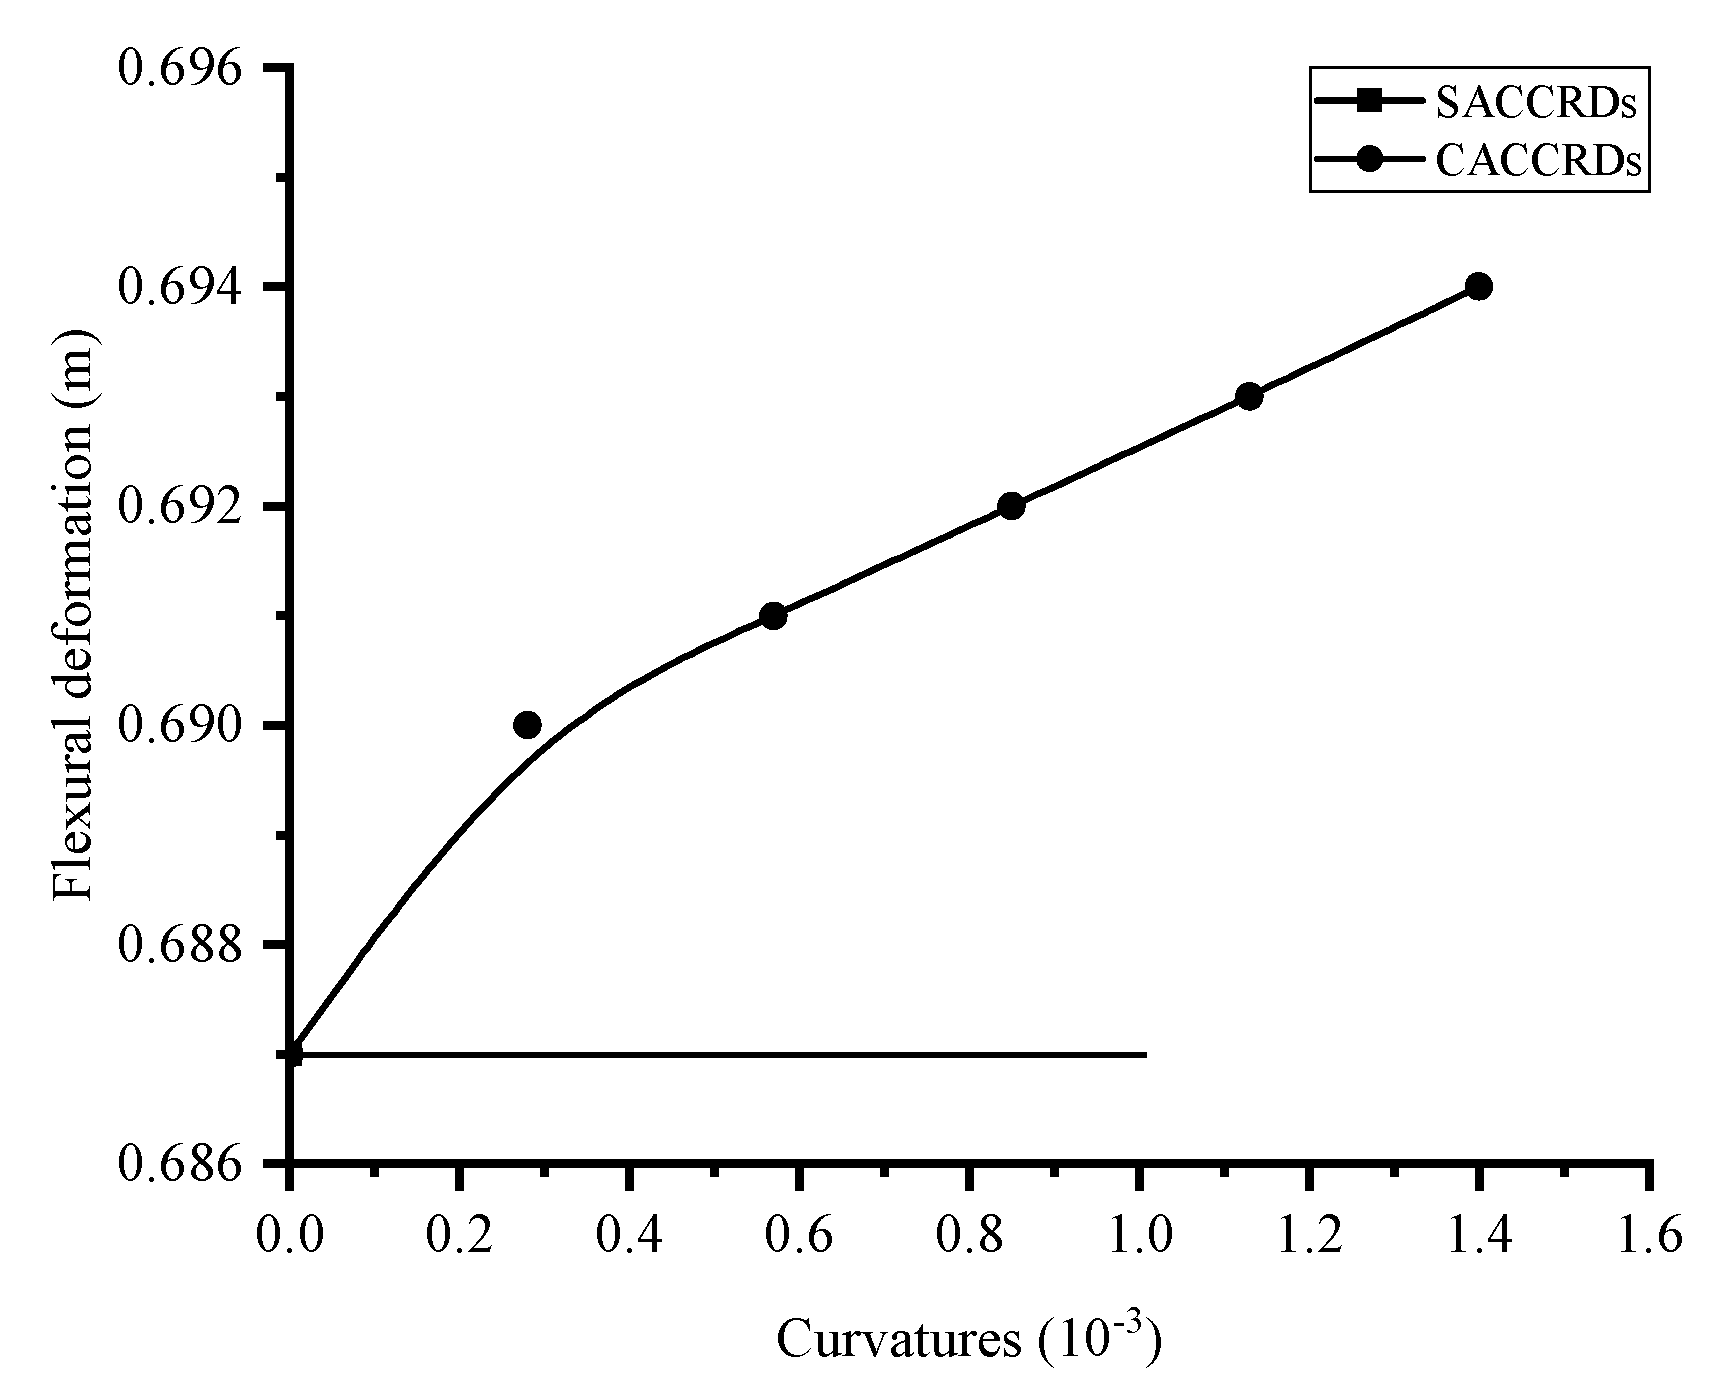
Applsci 09 04618 g029
Figure 30. Relationship between flexural deformation maximum of CACC and curvature of CACC.
Applsci 09 04618 g030
Figure 31. Relationship between tensile stress maximum of CACC and curvature of CACC.
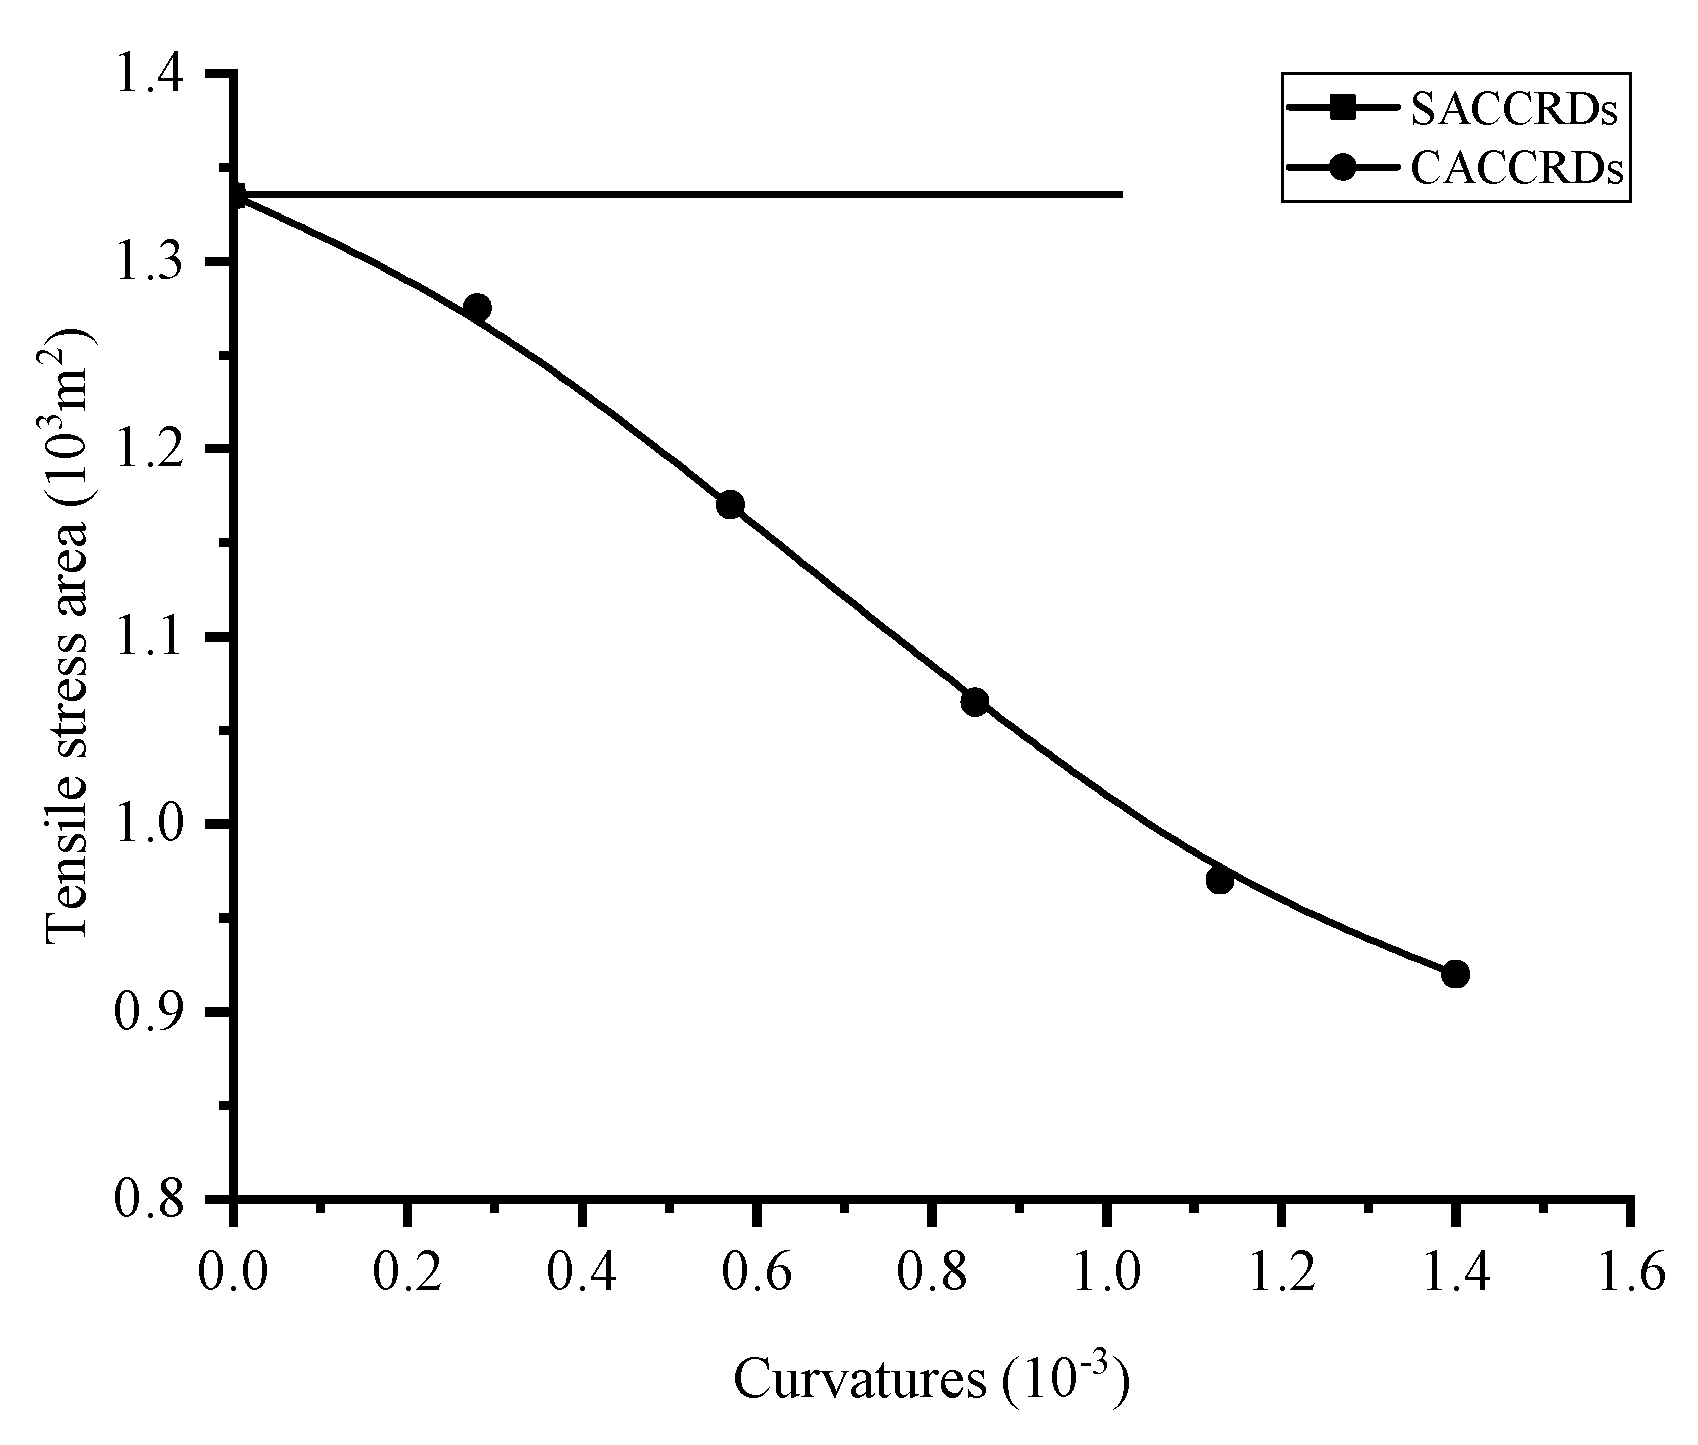
Applsci 09 04618 g031
Figure 32. Relationship between tensile stress area maximum of CACC and curvature of CACC.
Applsci 09 04618 g032
Table 1. Characteristic parameters of dam materials (E-B model).
Parameters
Materials
KnRfC/kPaφφKbmKurρ(g/cm3)
Rockfill material11000.40.75755085500.2521002.15
Transition material12000.450.82044.577000.37524002.35
Asphalt concrete core4500.50.7300285.512000.415502.45
Prism drainage10000.3750.651552105250.3520002.3
Backfill material8500.350.64547.58.54750.317002.1
BedrockΡ = 2.75 g/cm3; E = 12.5 GPa; μ = 0.2
where K is the modulus number, n is the modulus index, Rf is the failure ratio, C is the cohesion, φ is the internal friction angle, ∆φ is the increment of internal friction angle φ, Kb is the bulk modulus number, m is the bulk modulus index, Kur is the modulus number for unloading and reloading, ρ is the density, E is the Young’s modulus, and μ is the Poisson’s ratio.
Table 2. Settlement, stress level, and shear safety factor of ACC with different dam heights.
Dam Height (m)100125150175200225250
Settlement (m)−0.385−0.555−0.704−0.875−1.067−1.294−1.508
Stress level0.5580.6840.8070.8840.9480.9961.036
Shear safety factor1.791.461.241.131.051.010.97
Table 3. Settlement, stress level, and shear safety factor of ACC with different valley slope ratios.
Valley Slope Ratio0.5:1.01.0:1.01.5:1.02.0:1.02.5:1.0
Settlement (m)−1.098−1.074−1.070−1.067−1.066
Stress level0.8520.9381.0301.1201.216
Shear safety factor1.171.070.970.890.82
Table 4. Failure ratio, cohesion, and internal friction angle minimums of ACC that independently meet YSFCS with different dam heights.
Dam Height (m)150175200225250
Failure ratio0.750.951.081.151.20
Cohesion (MPa)0.340.470.600.740.89
Internal friction angle (°)29.533.035.537.539.0
Table 5. Failure ratio, cohesion, and internal friction angle minimums of ACC that comprehensively meet YSFCS with different dam heights.
Strength Parameters
Dan Height (m)
Failure Ratio Rf = 0.6, 0.7, 0.8
Cohesion (MPa)Internal Friction Angle (°)
1500.234.7, 33.3, 31.8
0.331.5, 30.1, 28.5
0.428.3, 26.9, 25.3
0.525.1, 23.7, 22.1
0.621.9, 20.5, 18.8
1750.237.4, 36.1, 34.5
0.334.6, 33.3, 31.6
0.431.9, 30.5, 28.7
0.529.1, 27.7, 25.7
0.626.3, 24.9, 22.8
2000.239.7, 38.2, 36.5
0.337.3, 35.8, 33.9
0.434.9, 33.4, 31.4
0.532.4, 30.9, 28.8
0.631.2, 28.5, 26.2
2250.241.5, 39.7, 38.0
0.339.4, 37.5, 35.7
0.437.3, 35.4, 33.4
0.535.2, 33.3, 31.1
0.633.1, 31.2, 28.8
2500.243.0, 40.8, 38.8
0.341.2, 38.9, 36.8
0.439.3, 37.1, 34.8
0.537.5, 35.3, 32.9
0.635.6, 33.4, 30.9
Table 6. Stress levels and shear safety factors of ACC with different dam heights.
Dam Height (m)150175200225250
Failure ratio0.750.7880.8250.8630.90
Cohesion (MPa)0.300.3450.390.4350.48
Internal friction angle (°)28.529.9331.3532.7834.2
Stress level0.770.770.750.740.72
Shear safety factor1.301.301.331.351.39
Table 7. Flexural deformation, tensile stress, tensile stress area, and tensile safety factor of SACC with different dam heights.
Dam Height (m)100125150175200225250
Flexural deformation (m)0.1970.2970.4080.5380.6870.8621.042
Tensile stress (MPa)0.0780.1380.2320.2980.3490.4450.522
Tensile stress area (103 m2)0.3070.4500.6810.9271.3351.7042.097
Tensile safety factor3.852.171.291.010.860.670.57
Table 8. Flexural deformation, tensile stress, tensile stress area, and tensile safety factor of SACC with different valley slope ratios.
Valley Slope Ratio0.5:1.01.0:1.01.5:1.02.0:1.02.5:1.0
Flexural deformation (m)0.7500.6880.6600.6420.64
Tensile stress (MPa)0.1260.3490.5530.6500.737
Tensile stress area (103 m2)1.0131.3351.9172.2382.334
Tensile safety factor2.380.860.5420.460.41
Table 9. Flexural deformation, tensile stress, tensile stress area, and tensile safety factor of CACC with different curvatures of CACC.
Curvature (10−3)0.000.280.570.851.131.40
Flexural deformation (m)0.6870.6900.6910.6920.6930.694
Tensile stress (MPa)0.3490.3050.2530.2030.1650.138
Tensile stress area (103 m2)1.3351.2751.1721.0650.9730.925
Tensile safety factor0.860.981.191.481.822.17

