Abstract
A field study was conducted to identify the vortex-induced vibrations (VIVs) of stay cables in a cable-stayed bridge. A full-scale health-monitoring system was established to observe the wind effects of the selected cables. The vibration amplitudes in the twenty selected stay cables were first studied. The results indicate that only cable CAC20 has large amplitudes with a multimode and high-frequency vibration in the investigated period. The correlation between the wind and cable vibration was subsequently investigated. The large vibration amplitudes are primarily located in the mean speed scope of 4 to 6 m/s, simultaneously close to the reduced velocity of five when the wind was almost perpendicular to the bridge axis and had a smaller turbulence intensity. Moreover, the relationship between the maximum vibration amplitude with the mean wind speed was fitted by a function that was validated by the measured data. Finally, an estimation method was presented to predict the participative vibration modes that would happen in the VIVs of the stay cables, according to the known wind and cable parameters. The measured cable vibrations were employed to validate this estimation method. The results indicate the estimated vibration modes are close to the measured vibration modes.
1. Introduction
Long-span cable-stayed bridges with excellent structural performance and elegant appearance have been frequently built worldwide in recent years. Inclined cables serve as key components of the long-span cable-stayed bridges, and their increasing lengths make them prone to oscillations under the actions of wind, rain, traffic, and seismic loads. The vortex-induced vibration (VIV) of an inclined cable easily occurs when it is subjected to a wind field [1,2]. Generally, uniform incoming airflow generates a mono process of vortex shedding. By contrast, nonuniform flow, e.g., a shear flow, could possibly excite responses with multiple modal frequencies. This is mainly because the vortex-shedding process changes with the flow speed passing by and multimodal frequencies will be covered. Because all of the long-span bridges are constructed in the atmospheric boundary layer, the sheared oncoming airflow acting on the inclined cables increases with height and can easily excite multimodal VIVs of cables [3,4].
Main and Jones [1] conducted a field study on the Fred Hartman Bridge (Texas, USA) and investigated the wind effects of the approaching speed, direction, and rainfall on the vibration amplitude of cables. Zuo et al. [5] and Zuo and Jones [6] then conducted field investigations on the wind-induced cable vibrations on the same bridge. These studies found both wind–rain induced vibrations under rain condition and large amplitude vibrations of dry-cable at high reduced velocities. It was suggested that the large-amplitude vibration with or without rain might be due to a new type of vortex shedding at high reduced velocities that is different from the classical VIV induced by von Karman vortex shedding. Based on numerical simulations, Chen et al. [3] found that a long flexible cable (length L > 100 m) would experience mono-modal and multimodal VIVs when subject to varying velocity profiles. More recently, Chen et al. [4] tested the VIV of a flexible cable with a length of 6.08 m, under a sheared flow in the wind tunnel. The speed difference between two ends of the cable was found to determine the vibration type: single-modal or multimodal VIV. As the speed difference increased, a single-modal VIV of the testing model would shift to a multimode.
The VIVs of oceanic risers take place more frequently compared to stay cables. Under shear flows, the experimental and field tests were performed on long, flexible marine risers, which had multiple frequencies of response (e.g., [7,8,9,10]). Trim et al. [7] conducted an experimental investigation on VIVs of flexible marine risers, with an aspect ratio of 1400. The results indicated that the in-line (IL) displacement is less than the cross-flow (CF) displacement for each velocity case. Moreover, the IL vibration modes are nearly twice as great as those of the CF vibration modes. The band of dominant vibration modes is relatively narrow at a smaller flow velocity, and the band extends at a higher flow velocity, which is most evident for the CF response. Lie and Kaasen [8] performed a modal analysis on the large-scale VIV in a linearly sheared flow by employing a riser model with a diameter of 3 cm and a length of 90 m. At a high velocity, the riser experienced multimode response, and no single mode (lock-in) was observed. Lucor et al. [9] performed an investigation on VIV for linear and exponential shear flows by using long and flexible circular cylinders, which usually have larger aspect ratios than 500. These researchers found that the bandwidth of a large vibration under an exponential shear flow was larger than that in a linearly sheared flow. Marcollo and Hinwood [10] found that the long flexible cylinder response might change from classic lock-in to non-lock-in multimode responses in the sheared flow, which was a simplified two-slab flow, with each slab having uniform flow.
Vandiver et al. [11] performed experimental investigations on VIVs of a very long (152.4 m) flexible riser with a very large aspect ratio (more than 3000) in the ocean. VIV mainly behaved in a traveling wave at high mode numbers with strongly-high harmonic components and the stable figures of eight trajectories. Bourguet et al. [12] studied VIVs of a long and flexible cable, which has an aspect ratio of 200 under a sheared flow. For the multimode VIV, the flow structures are dominated by the traveling waves between the cylinder ends and predominated by the standing waves close to the ends. Nearly 30% of the cylinder length was covered by the synchronization region, which was usually observed within the zone of high-velocity. The results indicated that the frequency ratio of the IL and CF vibrations was approximately equal to two. However, Huera-Huarte [13] and Huera-Huarte and Bearman [14] performed experimental investigations on the dynamic response of a vertical long flexible cylinder with an aspect ratio of 94, vibrating at low-mode frequencies. It was determined that the dominant frequencies between the in-line and cross-flow vibrations are the same because the IL response frequency would not lock onto the second mode even with added mass.
While it is difficult to perform wind tunnel tests of VIVs with full-scale cables, the field observations are also hitherto limited. With these considerations, we performed a field study to investigate the VIVs of long-span cables in a real bridge. In this study, the VIVs of stay cables for a cable-stayed bridge were examined based on a structural health-monitoring system installed on-site. In Section 2, the full-scale health-monitoring system to measure the wind and the cable vibration is introduced. In Section 3, the characteristics of the cable vibrations are presented and analyzed. In Section 4, the correlation between the cable response and the wind characteristics are subsequently analyzed, followed by some concluding remarks.
2. Full-Scale Health-Monitoring System
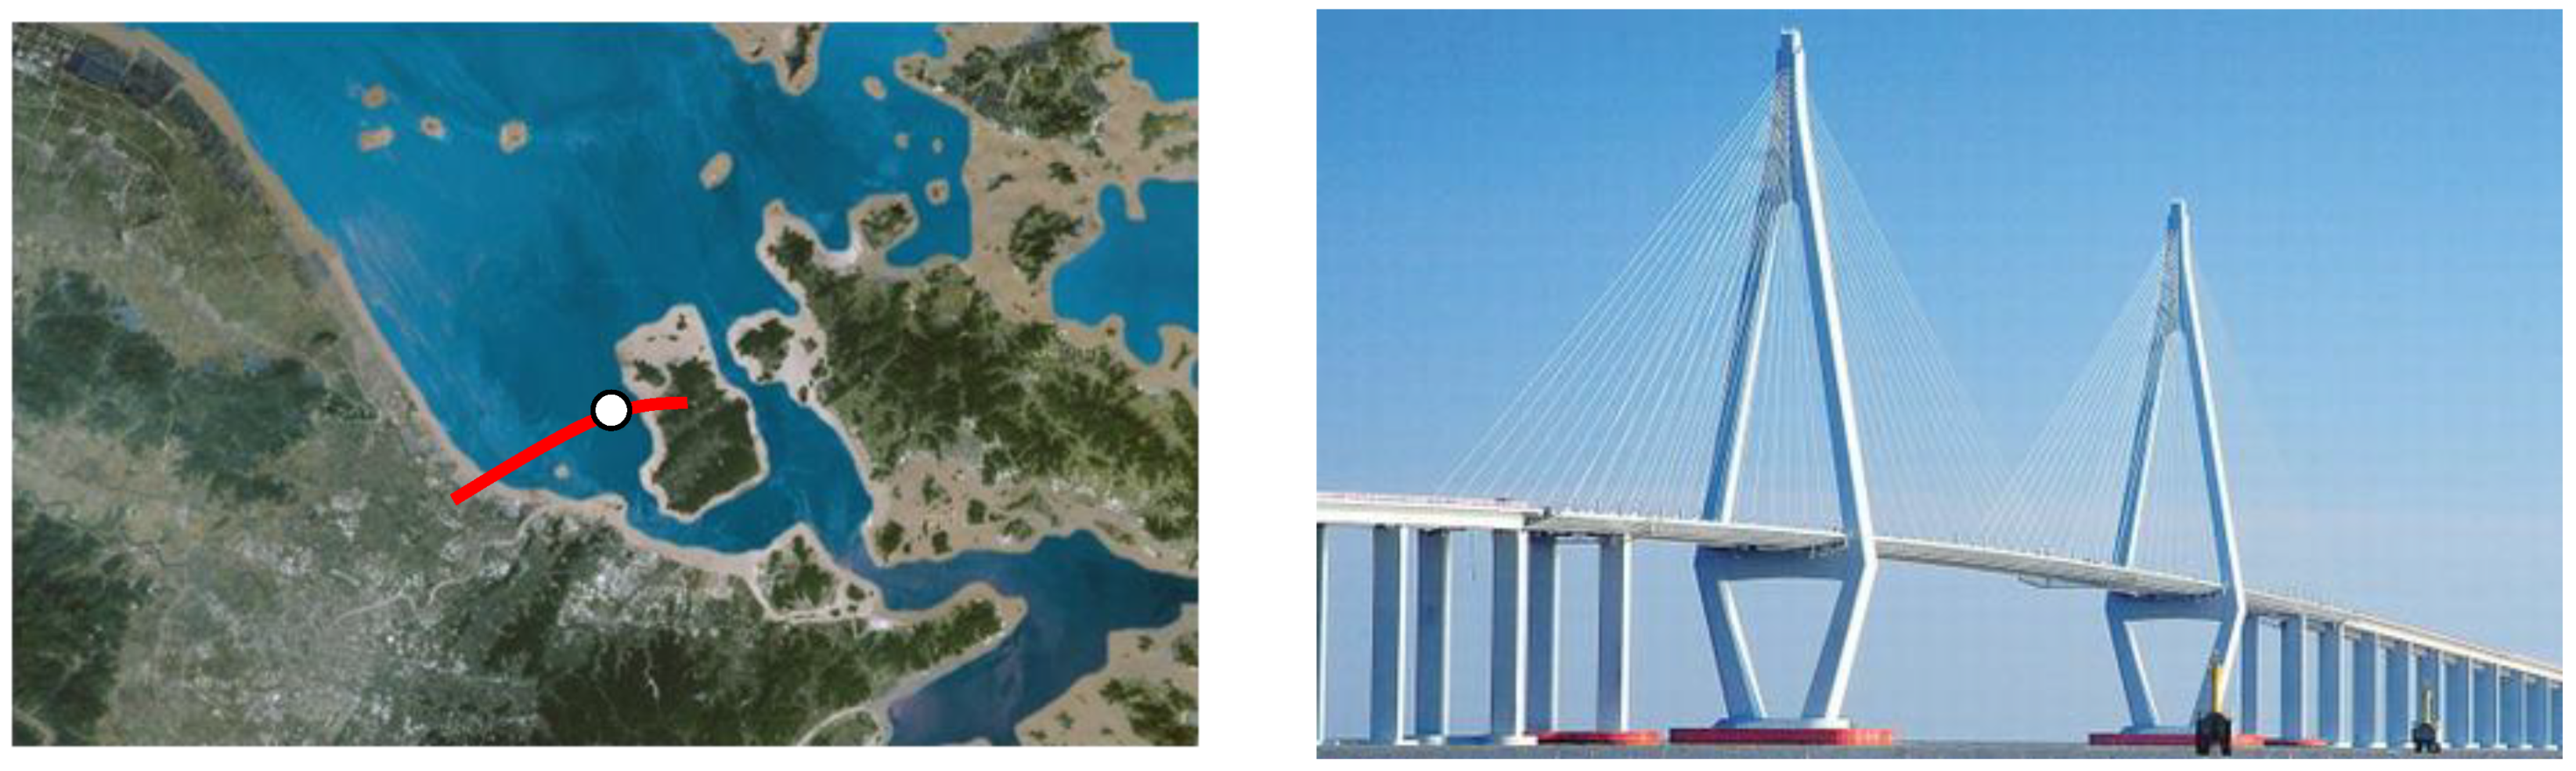
The present study on the VIVs of stay cables was performed based on the field data obtained through a long-term full-scale measurement system on a cable-stayed bridge, which is located in the East China Sea, as shown in Figure 1. With a main-span of 620 m, the investigated bridge is a single steel-box-girder-section cable-stayed bridge. The deck has a 30.1 m width and a 3.0 m height, and it is supported by a total of 168 stay cables that are arranged in two inclined planes.
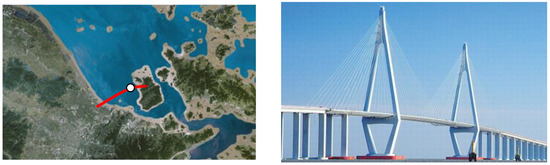
Figure 1.
Location of the investigated bridge.
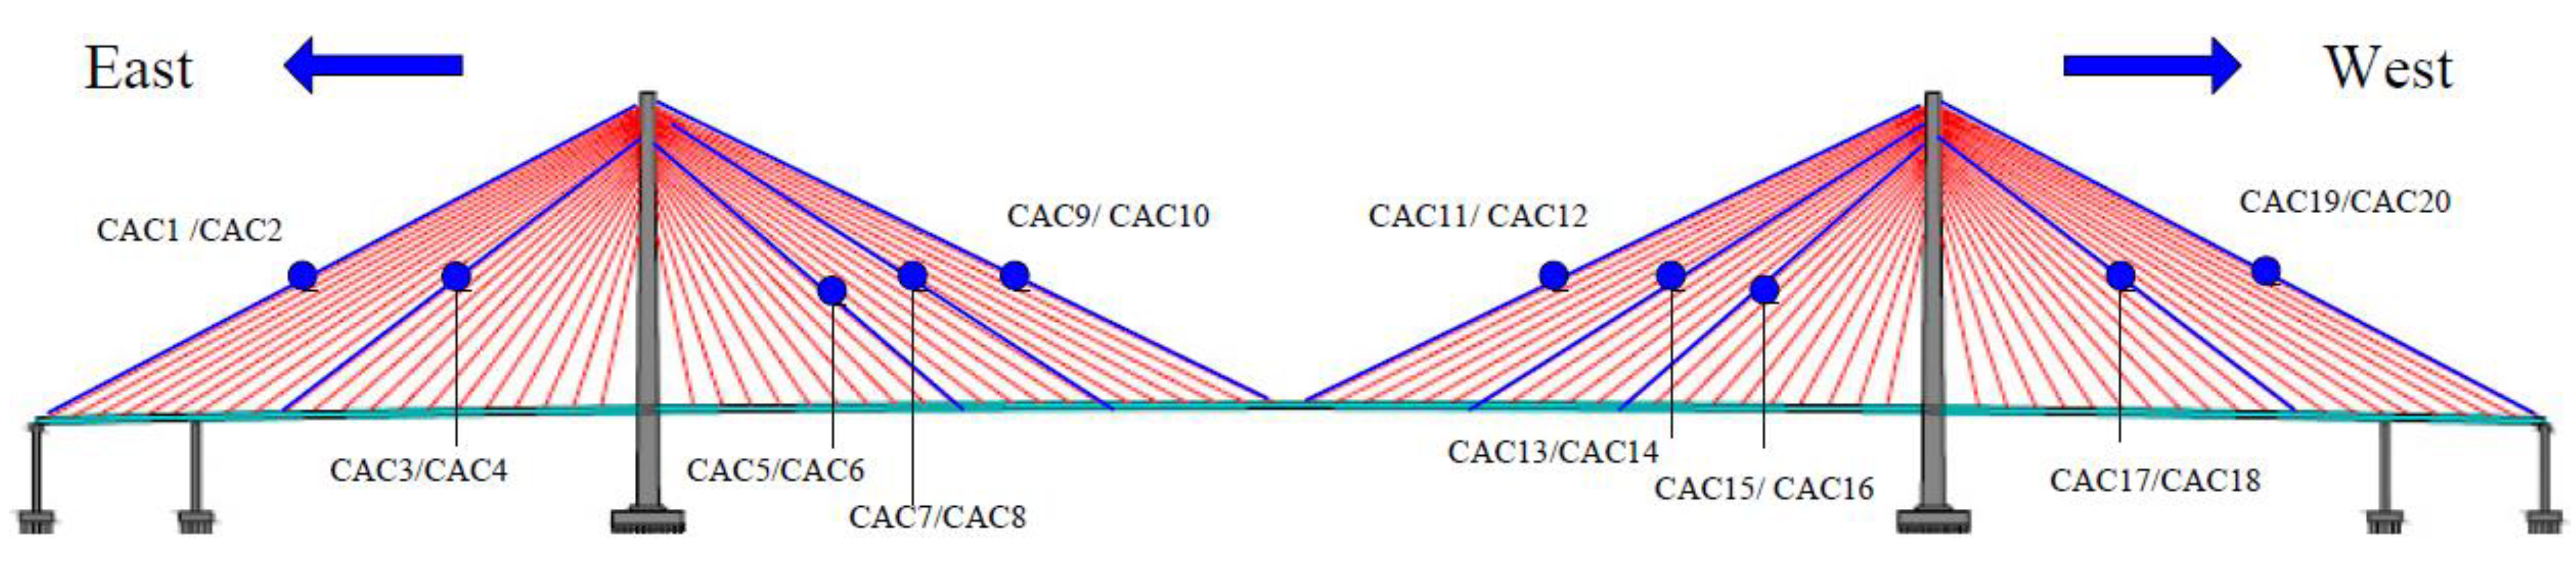
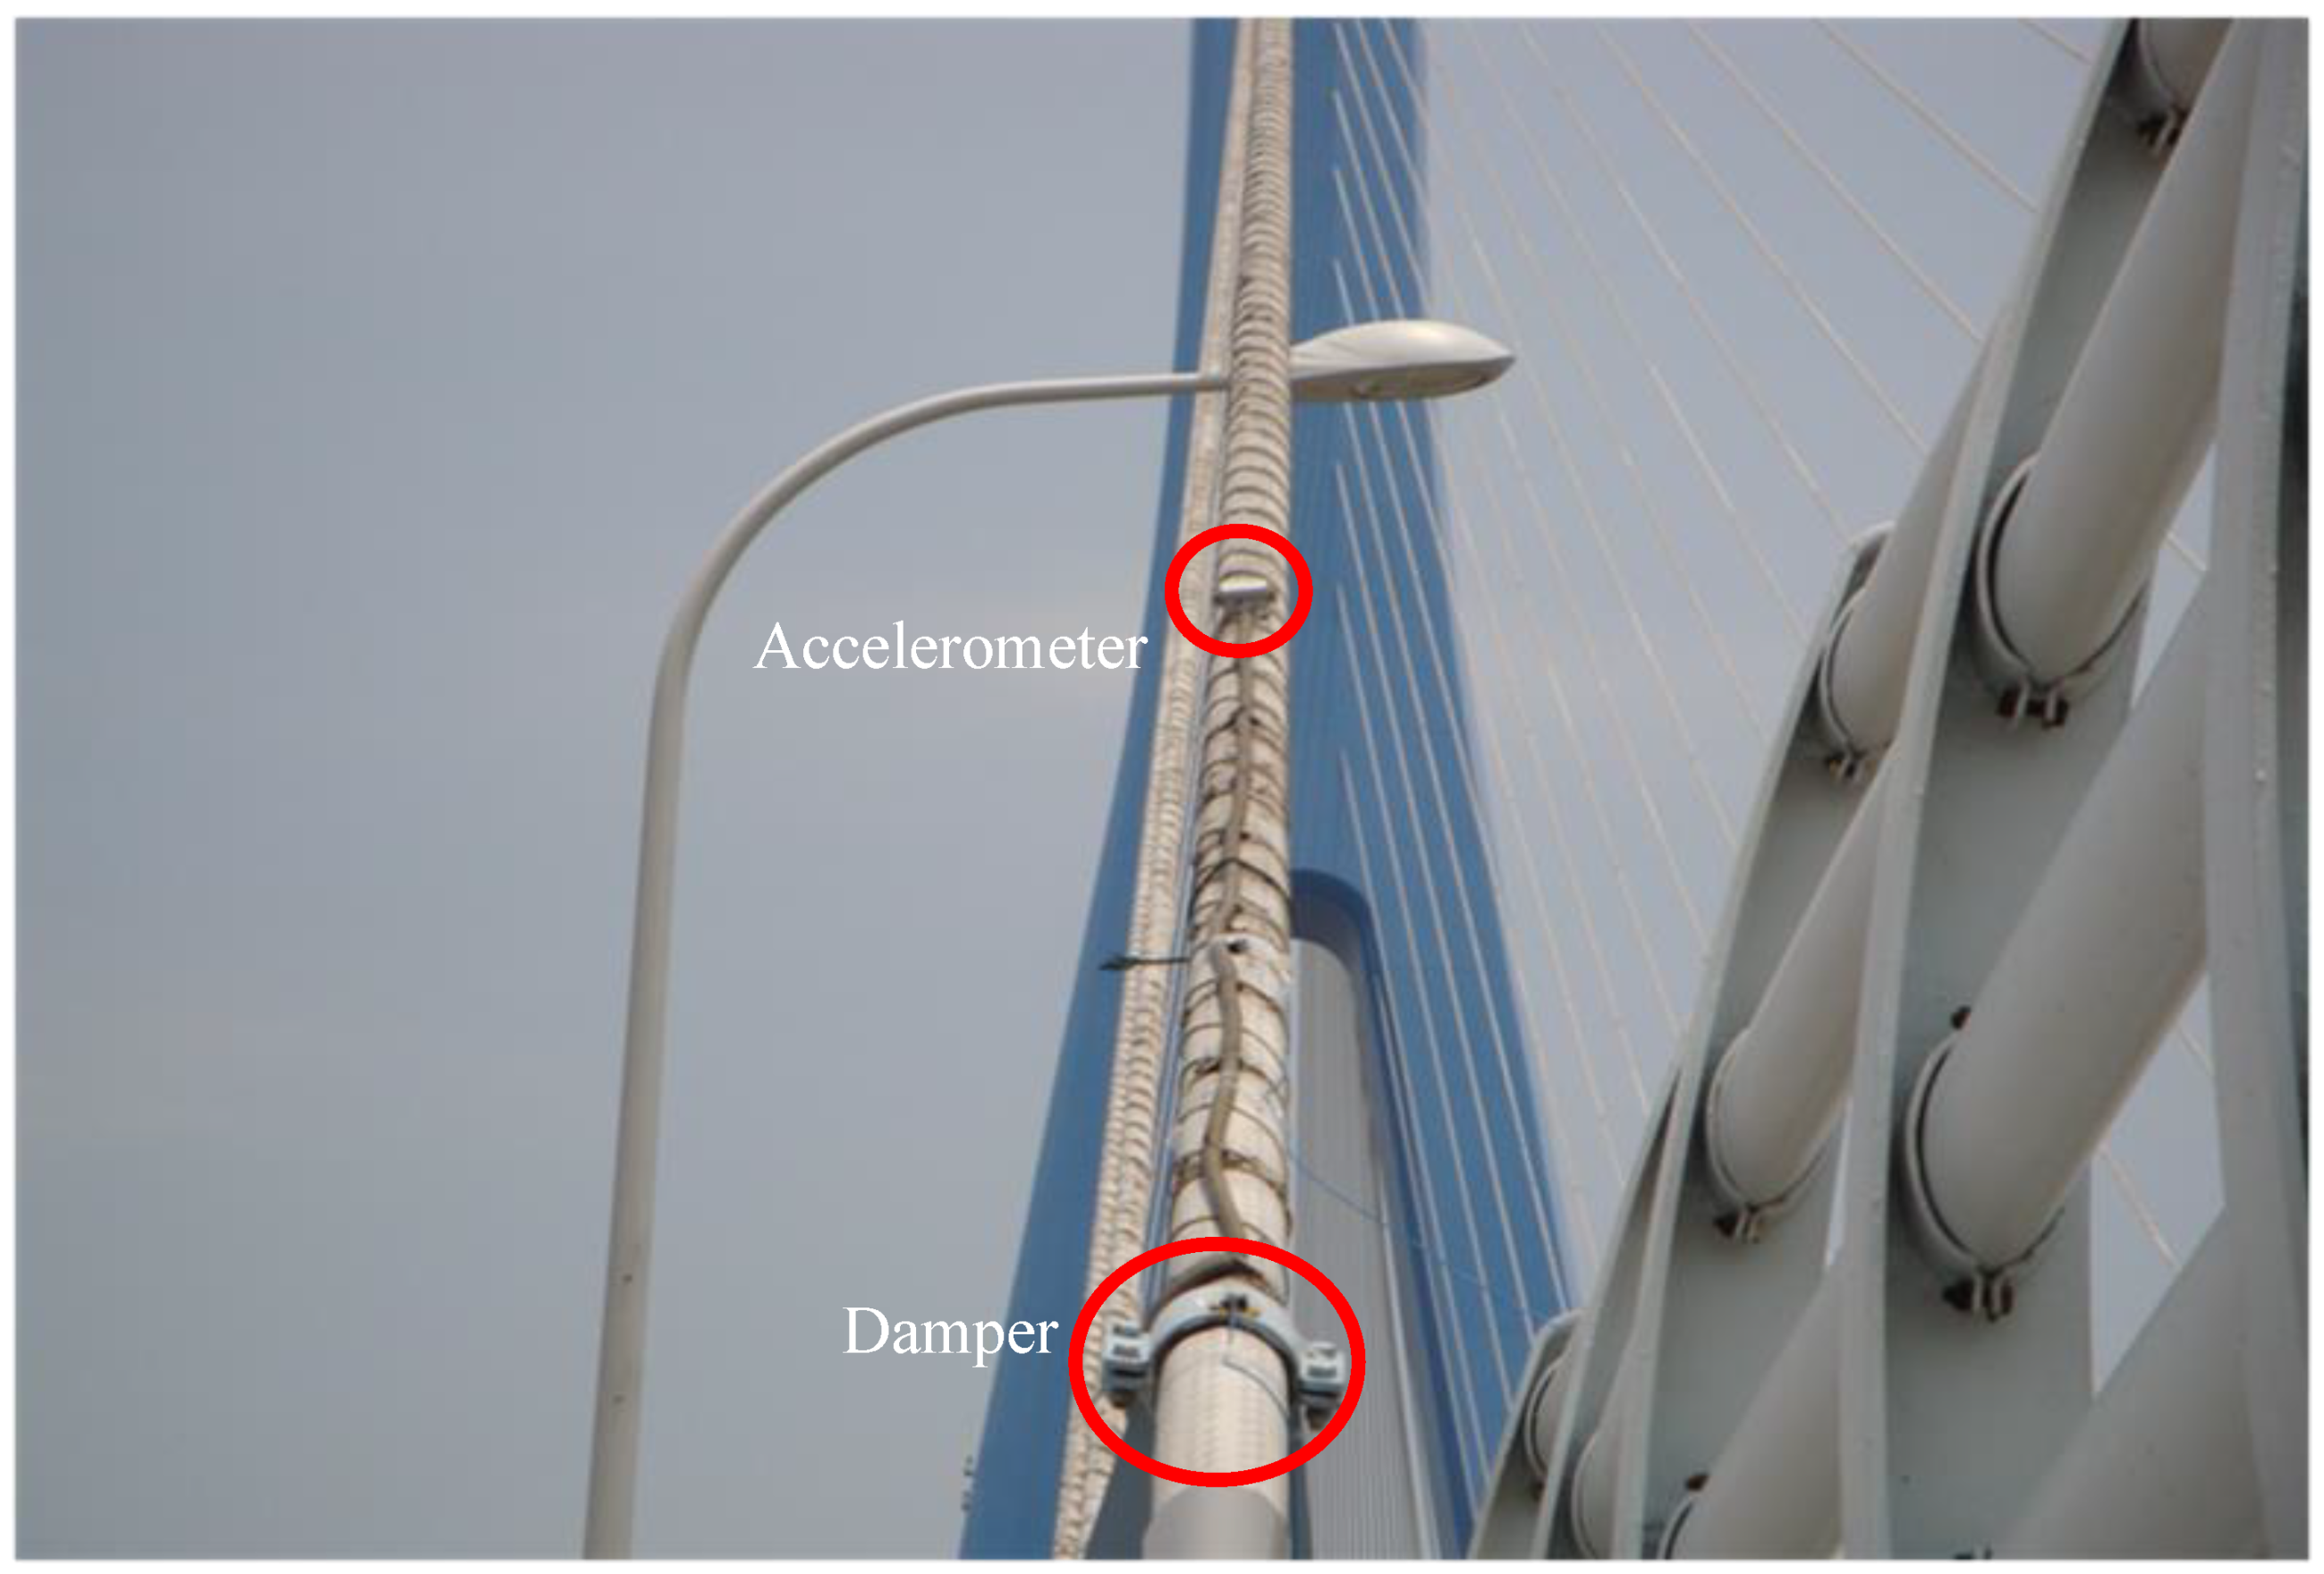
The full-scale measurement system on the cable-stayed bridge was installed and began to collect data when the bridge was finished in December 2009. The measurement data included the vibration response of stayed cables and the ambient wind conditions. Twenty stay cables were selected and were named CAC1 to CAC20, as shown in Figure 2. At the same location, CAC1/CAC2 means that one cable is the upstream cable in the upstream cable plane and that the other cable is the downstream cable in the upstream cable plane. Only in-plane vibration responses of the selected cables were measured by single axial accelerometers (hrbcaomu, model GTR1) installed at a cable location with an elevation of 6 m above the bridge-deck’s surface. The accelerometer measurement range is ±5 g, with a high accuracy of 1%, a sensitivity of 1000 mV/g, a frequency band of 0 to 400 Hz, and a sampling frequency of 100 Hz. Two three-dimensional ultrasonic anemometers (DELTA OHM HD2003) were installed on the upstream and downstream lighting columns at the mid-span section of the deck, and each anemometer is located at 6.0 m above the deck’s surface. This type of anemometer has good resolution (wind speed: 0.01 m/s, wind direction: 0.1°) and high accuracy (wind speed: ±1%, wind direction: ±1°). The anemometer has a threshold of 0.1 m/s and can record the wind speeds up to 60 m/s. At the top of the east or west tower, the speed and direction of wind were measured and recorded by a propeller-vane anemometer (Young Instruments Model 05103) installed on a steel guardrail that extended 2.1 m above the tower top. The propeller-vane anemometer can cover the wind speed range of 0 to 80 m/s. The resolution of wind speed measurement is 0.3 m/s, while the direction measurement is ±3°. The sampling frequencies of the anemometers were set as 32 Hz. A damper was installed on each cable to mitigate the vibration amplitude, and spiral wires were also implemented to prevent the rain–wind-induced cable vibrations.


Figure 2.
Deploy of accelerometers at a cable. The anemometers are installed 6.0 m vertically above the deck’s surface.
3. Vibration Characteristics of Stay Cables and Wind Characteristics at the Bridge Site
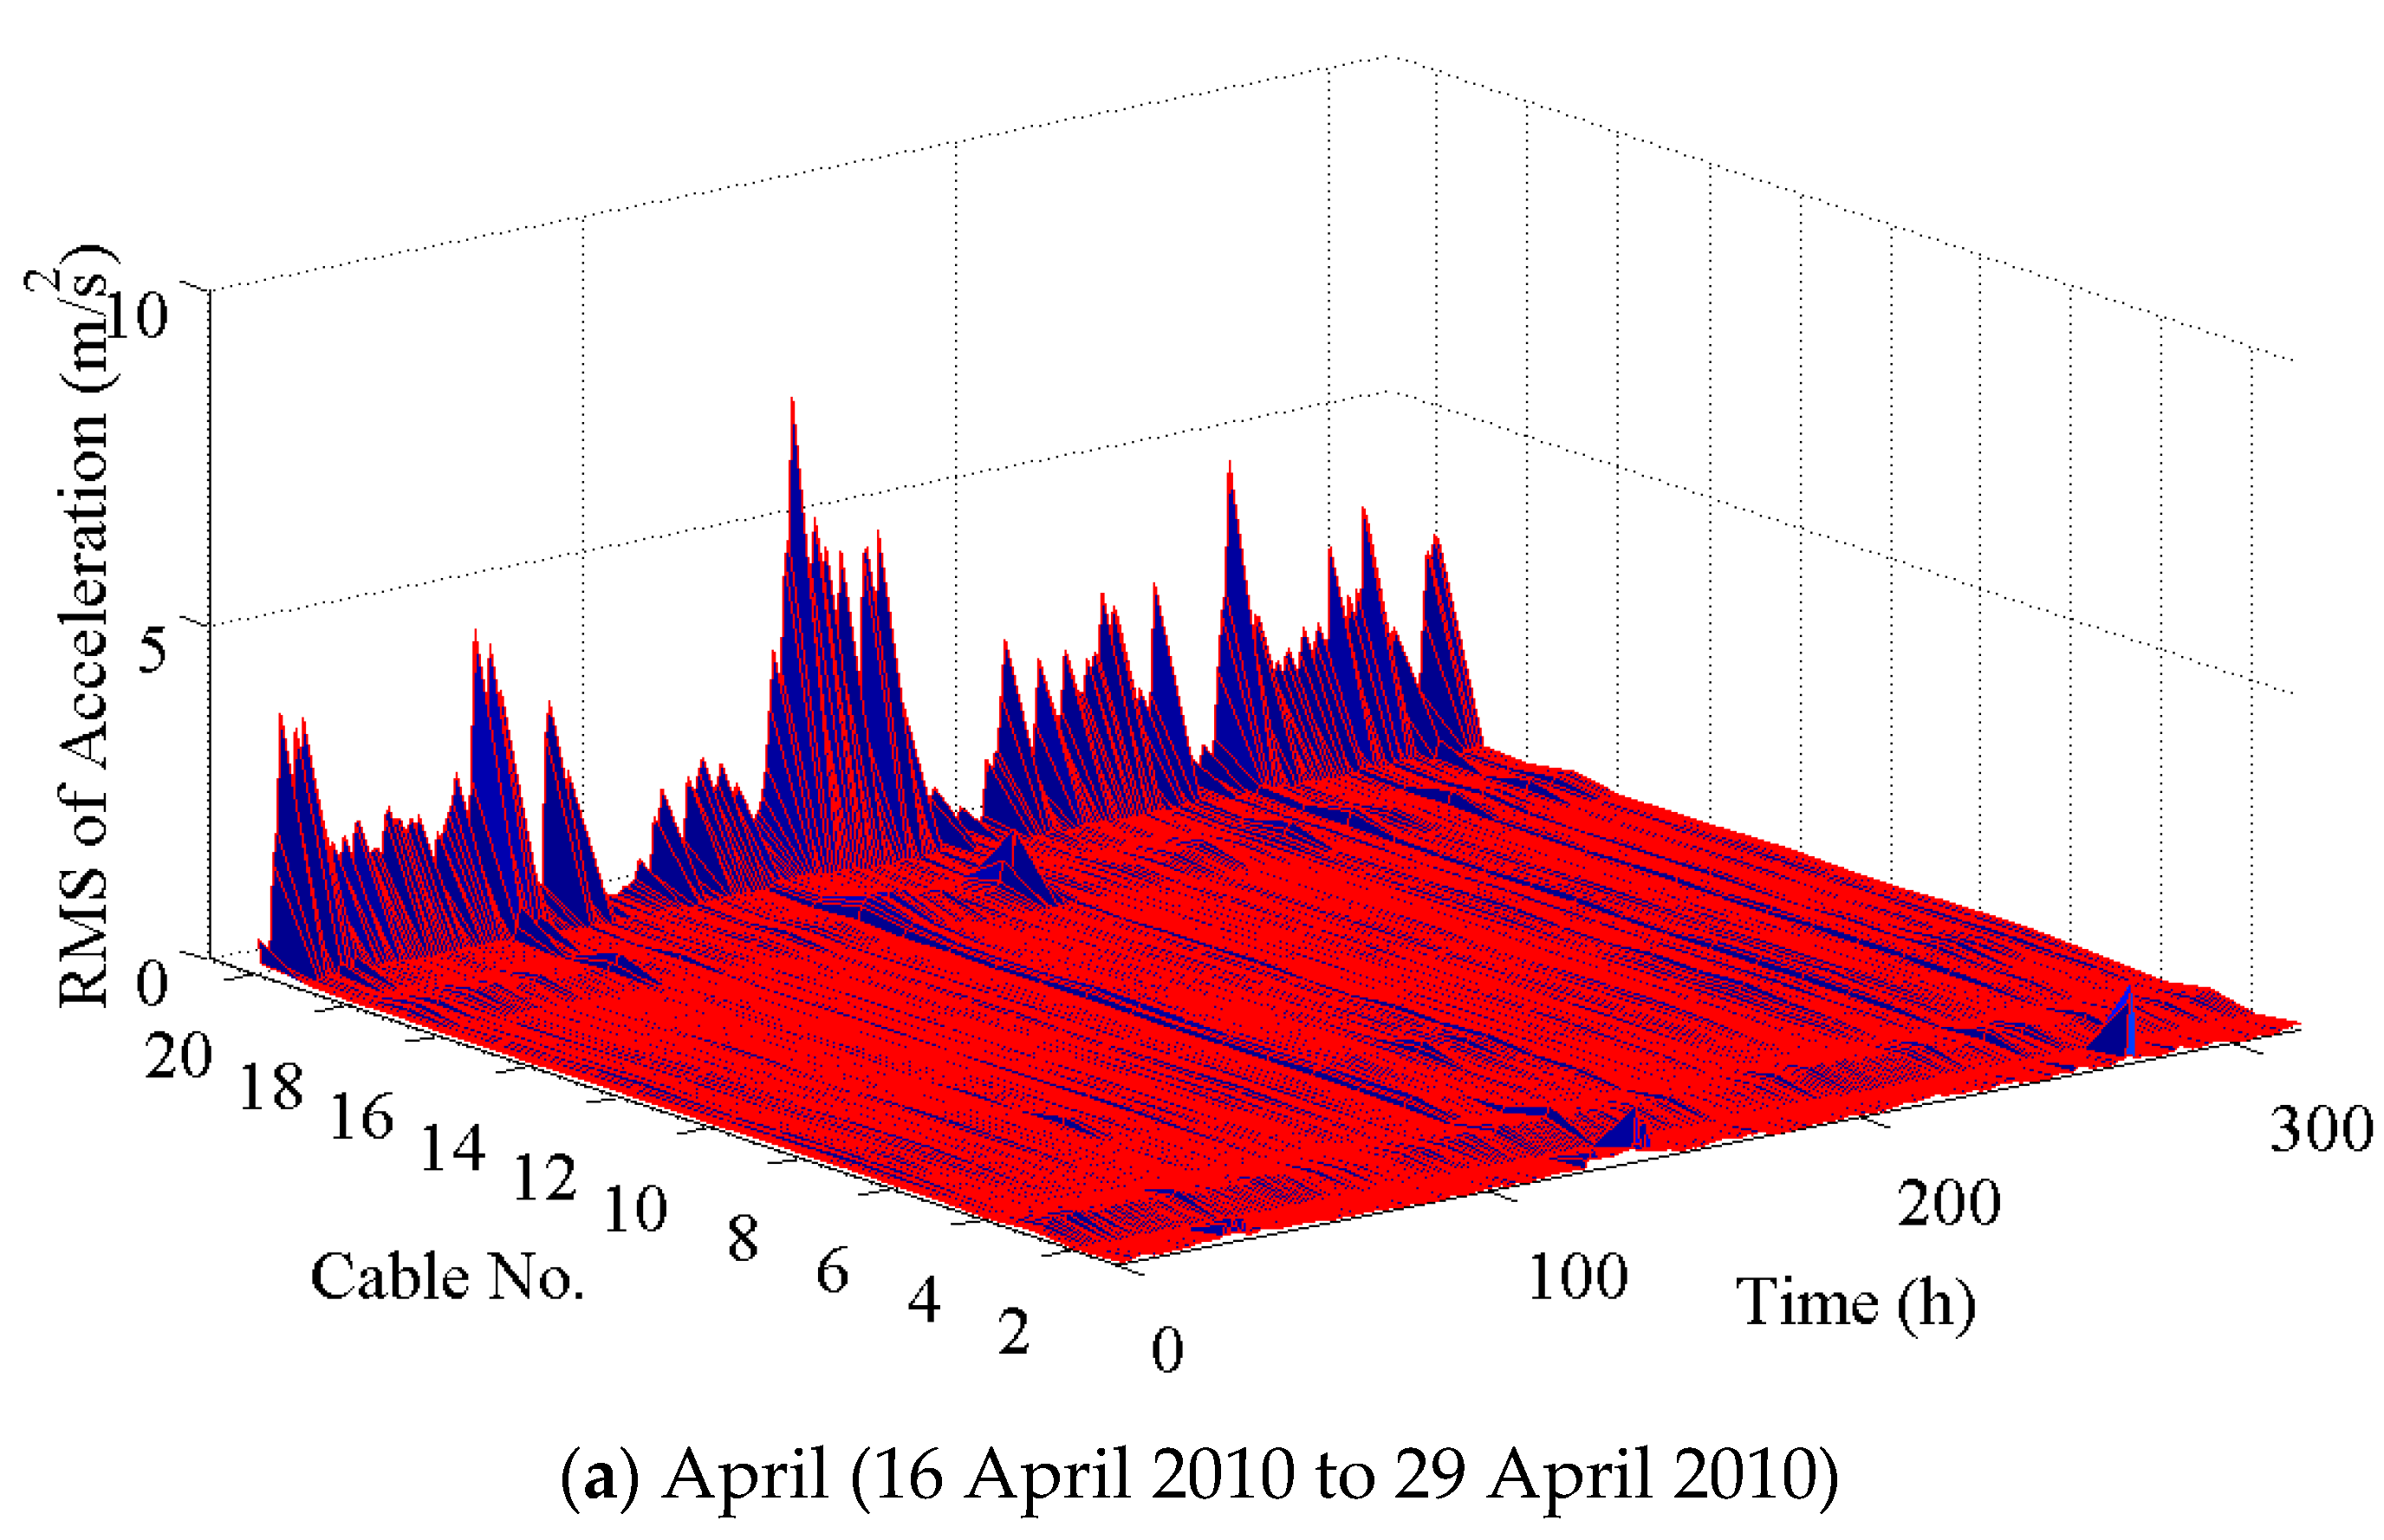
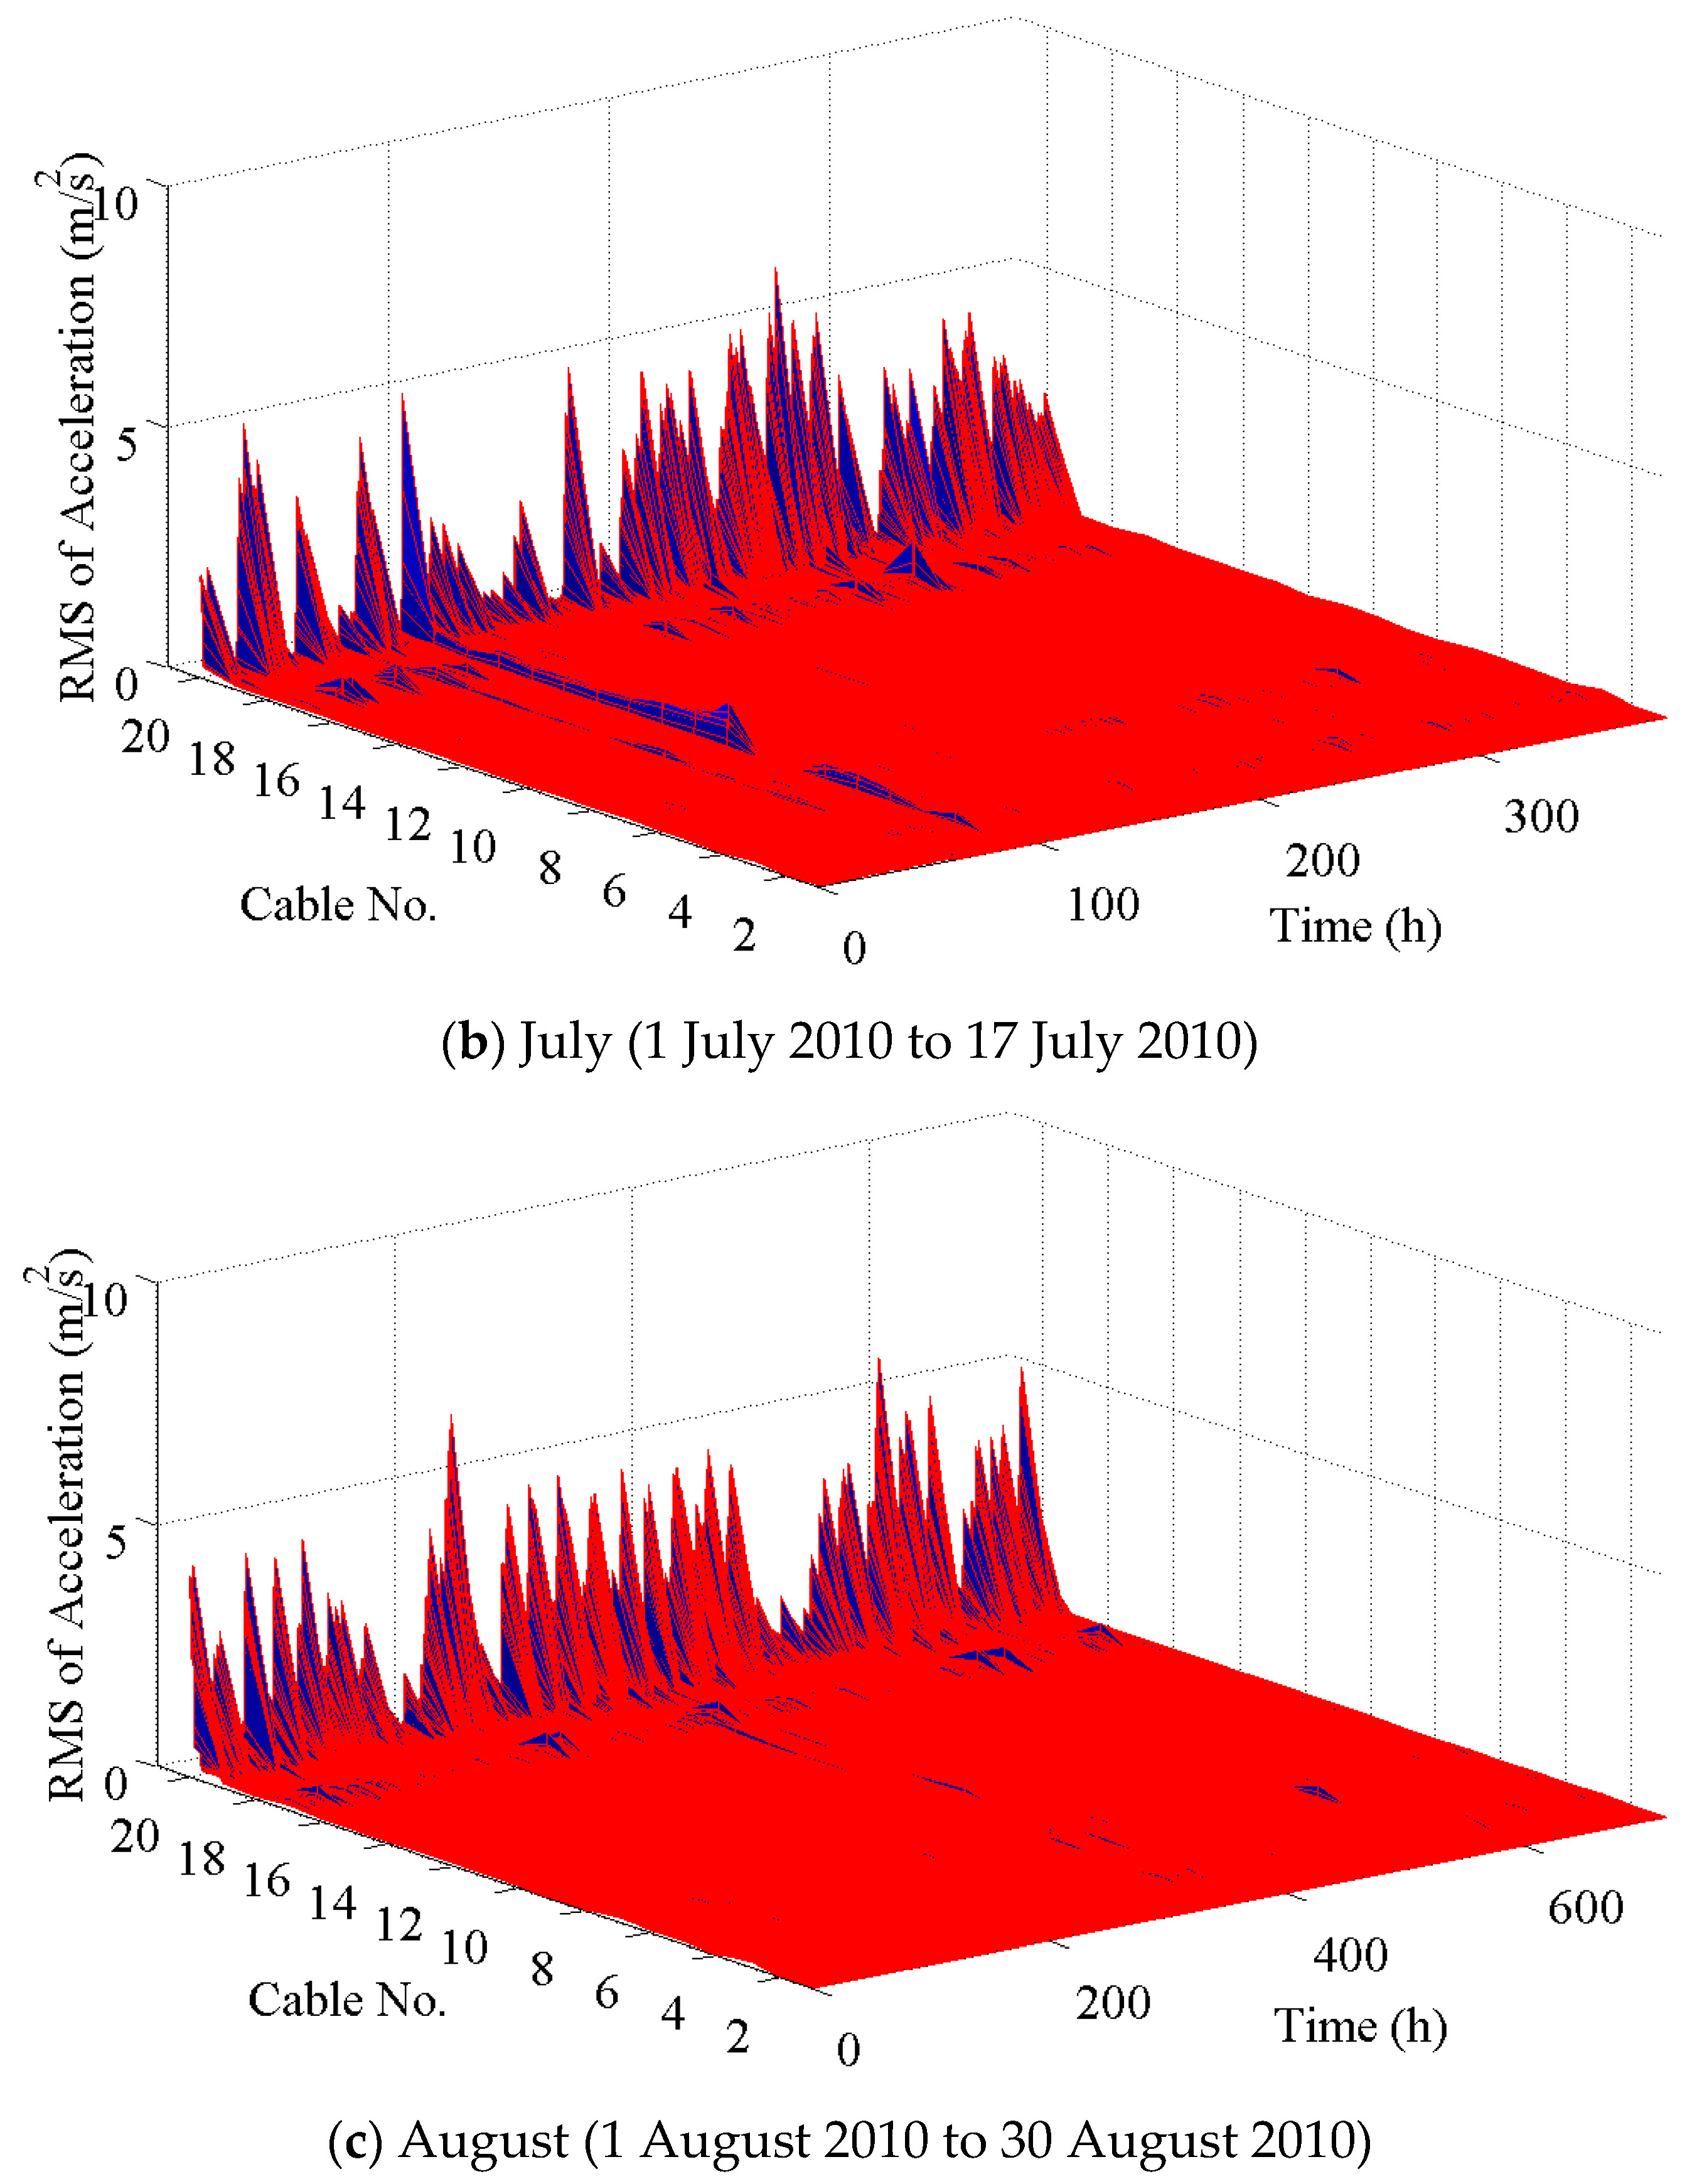
The vibration responses of selected stay cables were first studied. The data from three months (April, July, and August) in 2010 were collected to analyze the vibration characteristics of these stay cables. The statistical analysis for the vibration amplitudes in 10 min (10-min mean) was performed to observe the magnitude level of each stay cable. Because the vibration amplitudes of the stay cables were not steady with time, the root mean squares (RMSs) of 10 min acceleration time histories were employed to denote the vibration amplitudes, as shown in Figure 3. Two horizontal axes indicate the cable numbers and time, and the vertical axis denotes the RMS of acceleration, respectively.
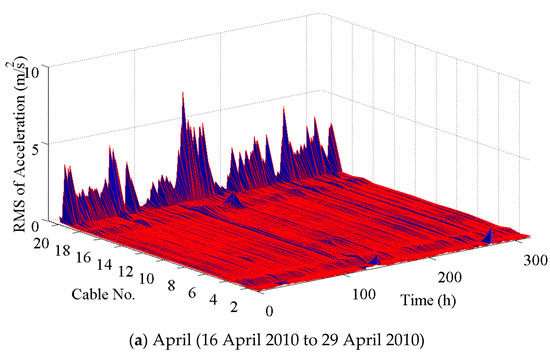

Figure 3.
Vibration response of stay cables of the stayed-cable bridge (10 min mean) in 2010.
It is found that the stay cable CAC20 always has a larger amplitude than any other cables. The cable CAC20 has the same parameters as the cable CAC19. These two cables have a length of 323 m and a diameter of 0.12 m, resulting in an aspect ratio of 2692. The inclined angle is 26.3°, and the angle between the cable plane and the longitudinal bridge axis is 2.59°. The only difference is that one cable is at the upstream side, and the other cable is located at the downstream side. One damper was installed on each cable to control the wind-induced vibration. The ambient wind conditions, e.g., the mean wind speed, around the two cables should be close to each other; however, their vibration characteristics behave very differently. To determine the reason, an eye observation was performed to determine whether the damper was working. It was found that the connection between the damper with the cable CAC20 was loose and that the damper was not working well, which could be the reason why the cable CAC20 always has a larger amplitude for each month. After fastening the connection between the damper with the cable CAC20 from 2013, the larger amplitude vibration of the cable CAC20 was greatly suppressed by the damper, as shown in Figure 4. Therefore, the following analysis is mainly focused on the cable CAC20 in 2010 for the present study.
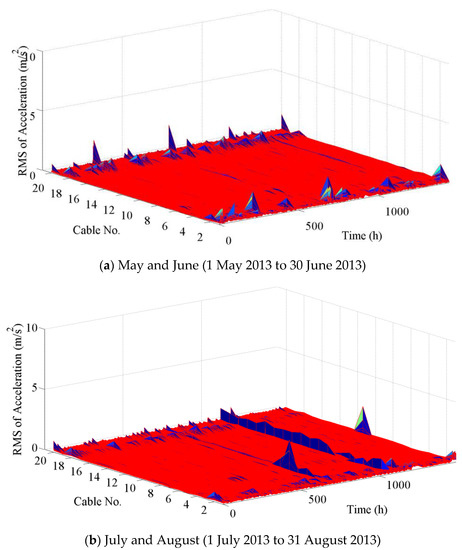
Figure 4.
Vibration response of stay cables of the stayed-cable bridge (10 min mean) in 2013.
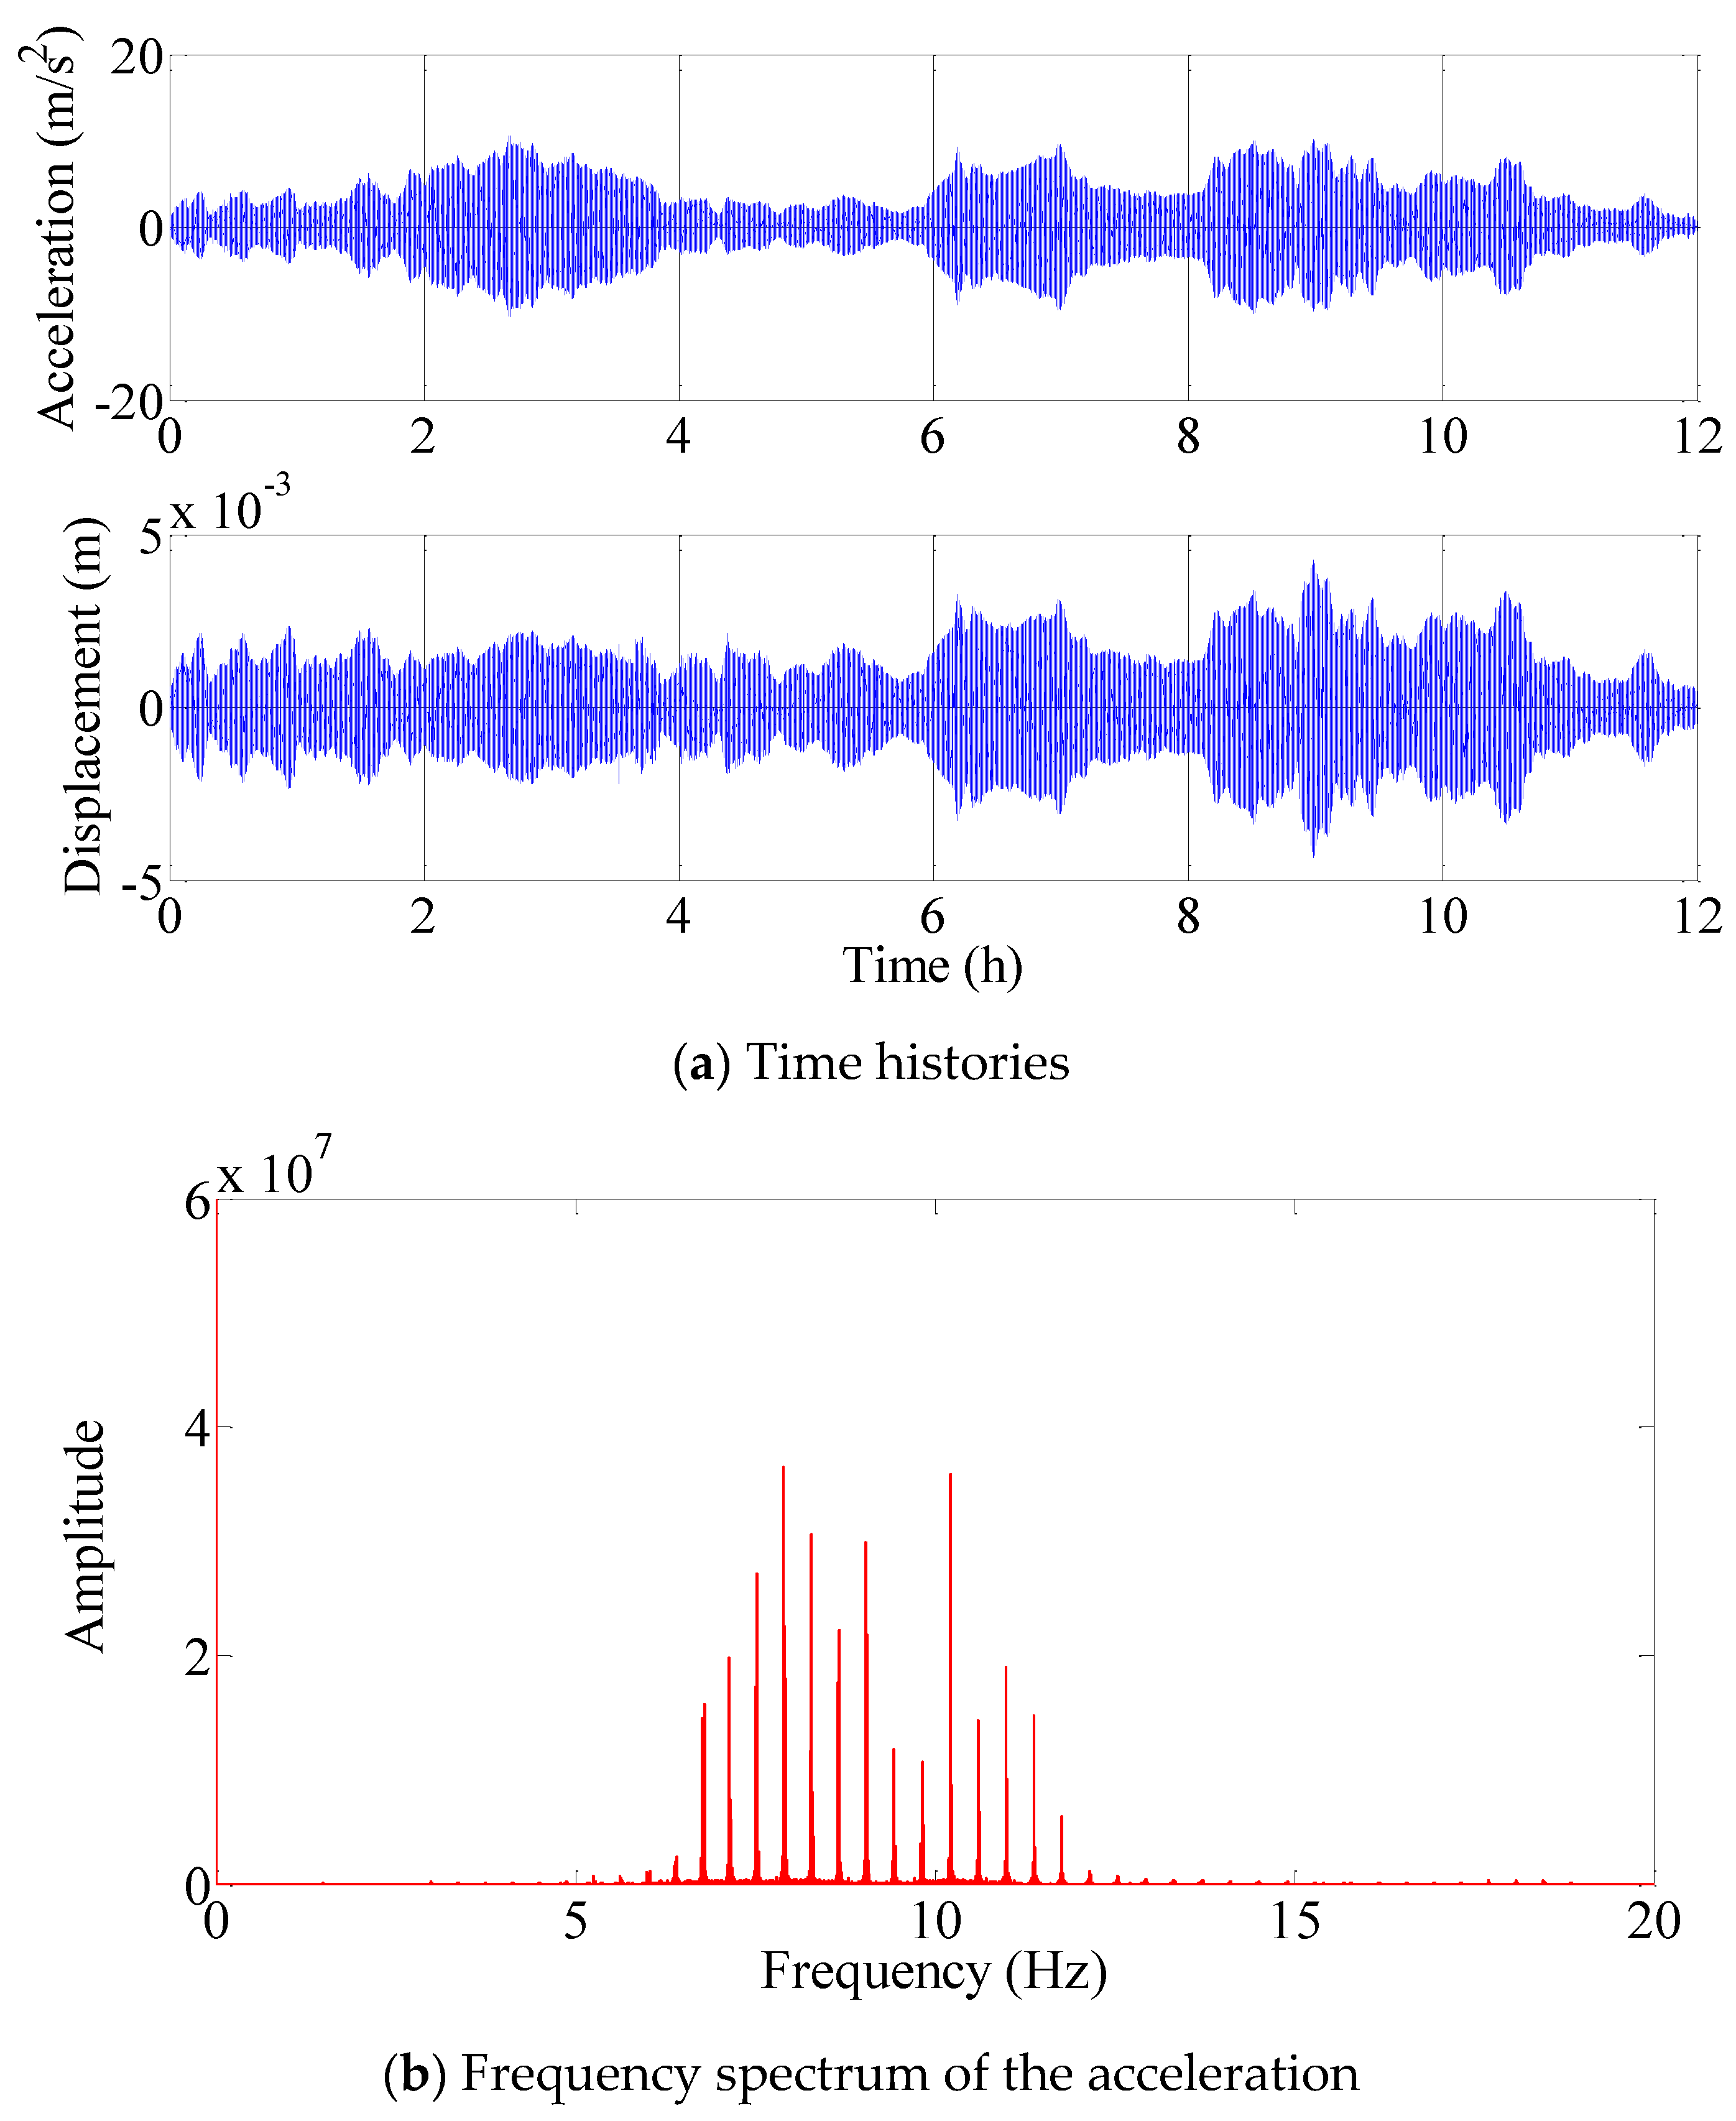
In the analysis of this study, the time histories of acceleration signals were numerically integrated in the frequency domain to obtain the corresponding time histories’ displacements [15]. One record of time histories of acceleration and displacement for 12 h was shown in Figure 5a, and the corresponding frequency spectrum of the acceleration history was shown in Figure 5b. Whatever the acceleration and displacement, their amplitudes are not steady with time because the ambient wind conditions around the stayed cables are not uniform.
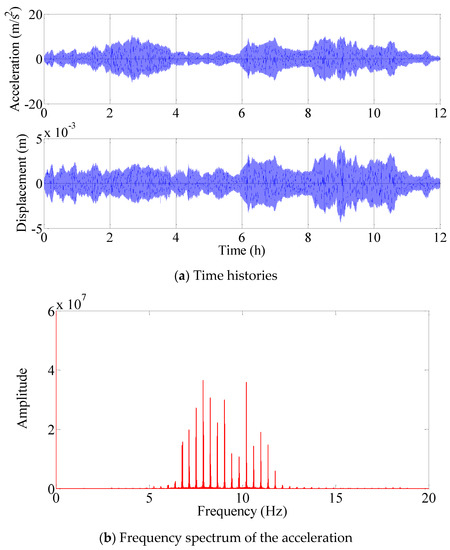
Figure 5.
Vibration response of cable CAC20.
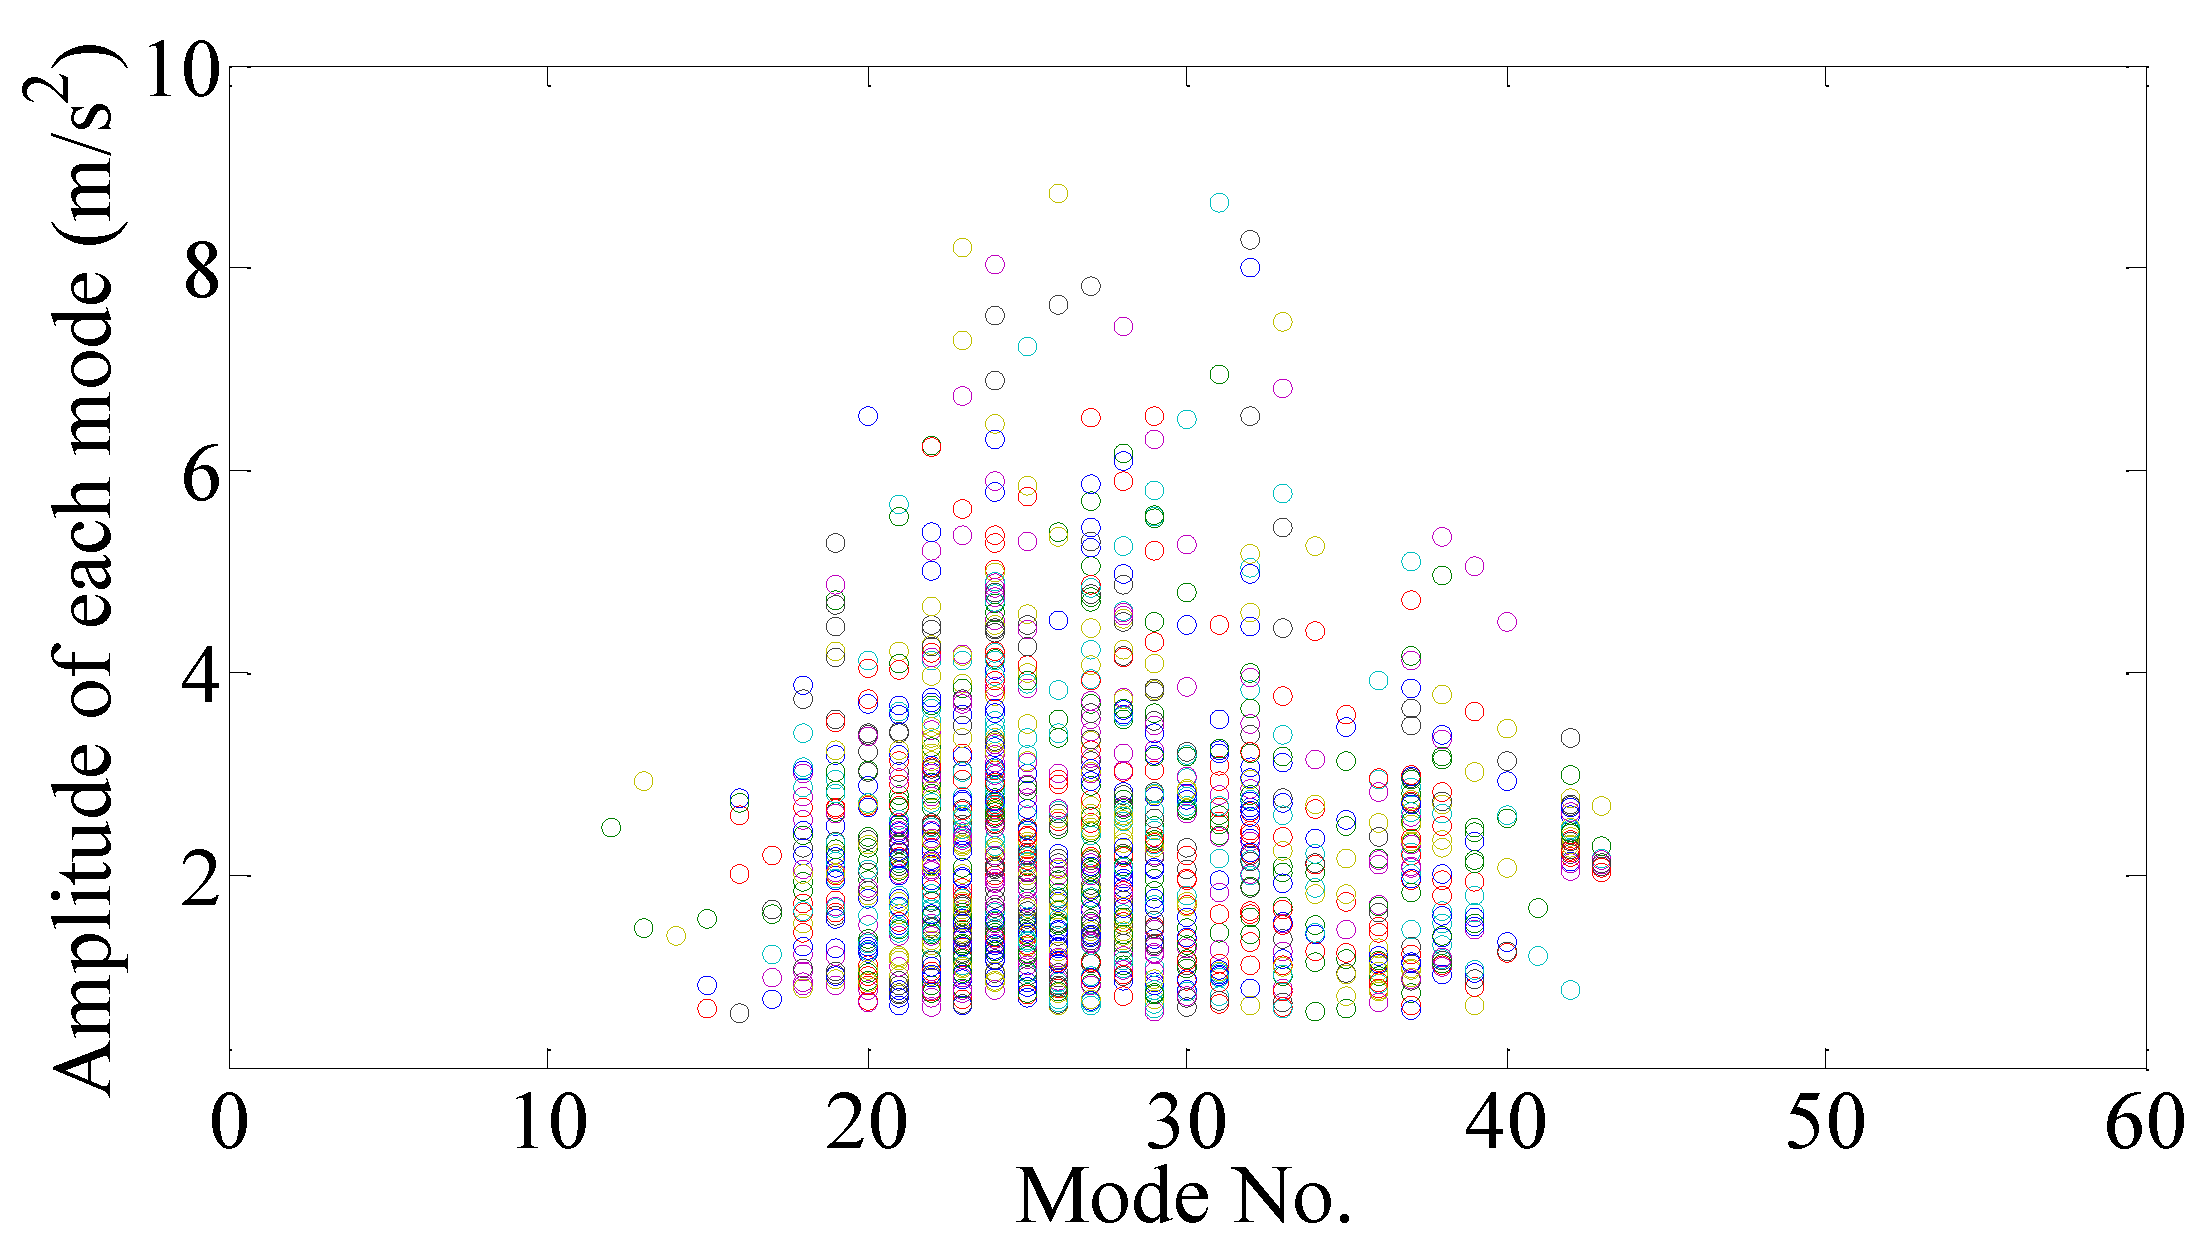
As a long flexible stay cable of an actual cable-stayed bridge, high modal frequencies are the multiple of the fundamental natural frequency, which can be calculated as 0.378 Hz from Figure 5b. It is found that the cable CAC20 has a multimode vibration with high frequencies. The vibration amplitude corresponding to each mode was shown in Figure 6. The larger vibration amplitudes are mainly located in the vibration mode range of 18th to 40th. Therefore, as a high-frequency vibration, the acceleration amplitude of the cable is large; however, the corresponding displacement amplitude is small.
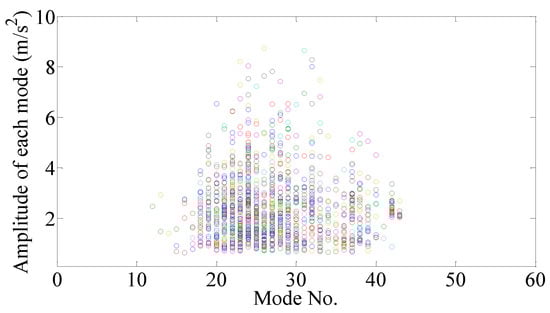
Figure 6.
Vibration amplitude versus vibration modes of CAC20 cable.
Examining the vibration characteristics in the time and frequency domains cannot determine whether the vibration of the cable CAC20 is a VIV or other types of vibrations at present. Further investigation of the correlation between the vibration responses and wind characteristics will be performed to examine the vibration type and VIV mechanism of the cable CAC20.
4. Correlation between Cable Response and Wind Characteristics
4.1. Vibration Amplitude Versus Wind Characteristics
The wind data of two anemometers installed on the upstream and downstream sides of the mid-span section of the deck were collected to investigate the wind characteristics and their correlation with the cable response. The wind data of two anemometers are denoted as “incoming flow” and “wake flow”, respectively. It should be noted that “incoming flow” and “wake flow” do not absolutely indicate the inflow and wake flow and that they are only used to distinguish the wind data measured by the two anemometers. Figure 7 shows 10 min mean wind speeds and directions of incoming and wake flows in April, July, and August, measured by the two anemometers, respectively. It is found that the data measured by two anemometers are close to each other for most of the samples, and the 10 min mean wind speeds are almost less than 15 m/s, with only several points larger than 15 m/s. The wind direction between the flow and the longitudinal bridge axis shows that the wind is nearly perpendicular to the bridge axis when the wind blows from the south.
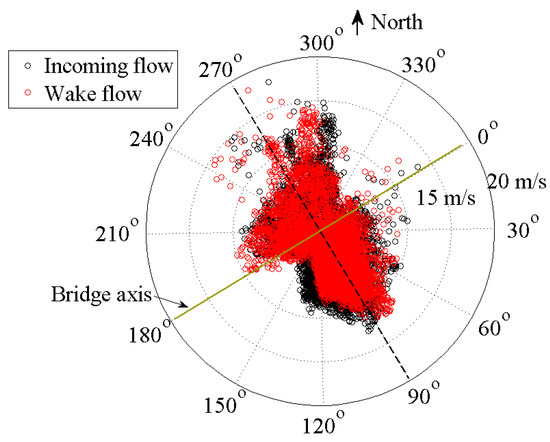
Figure 7.
Ten-minute mean wind speed and direction in April, July, and August.
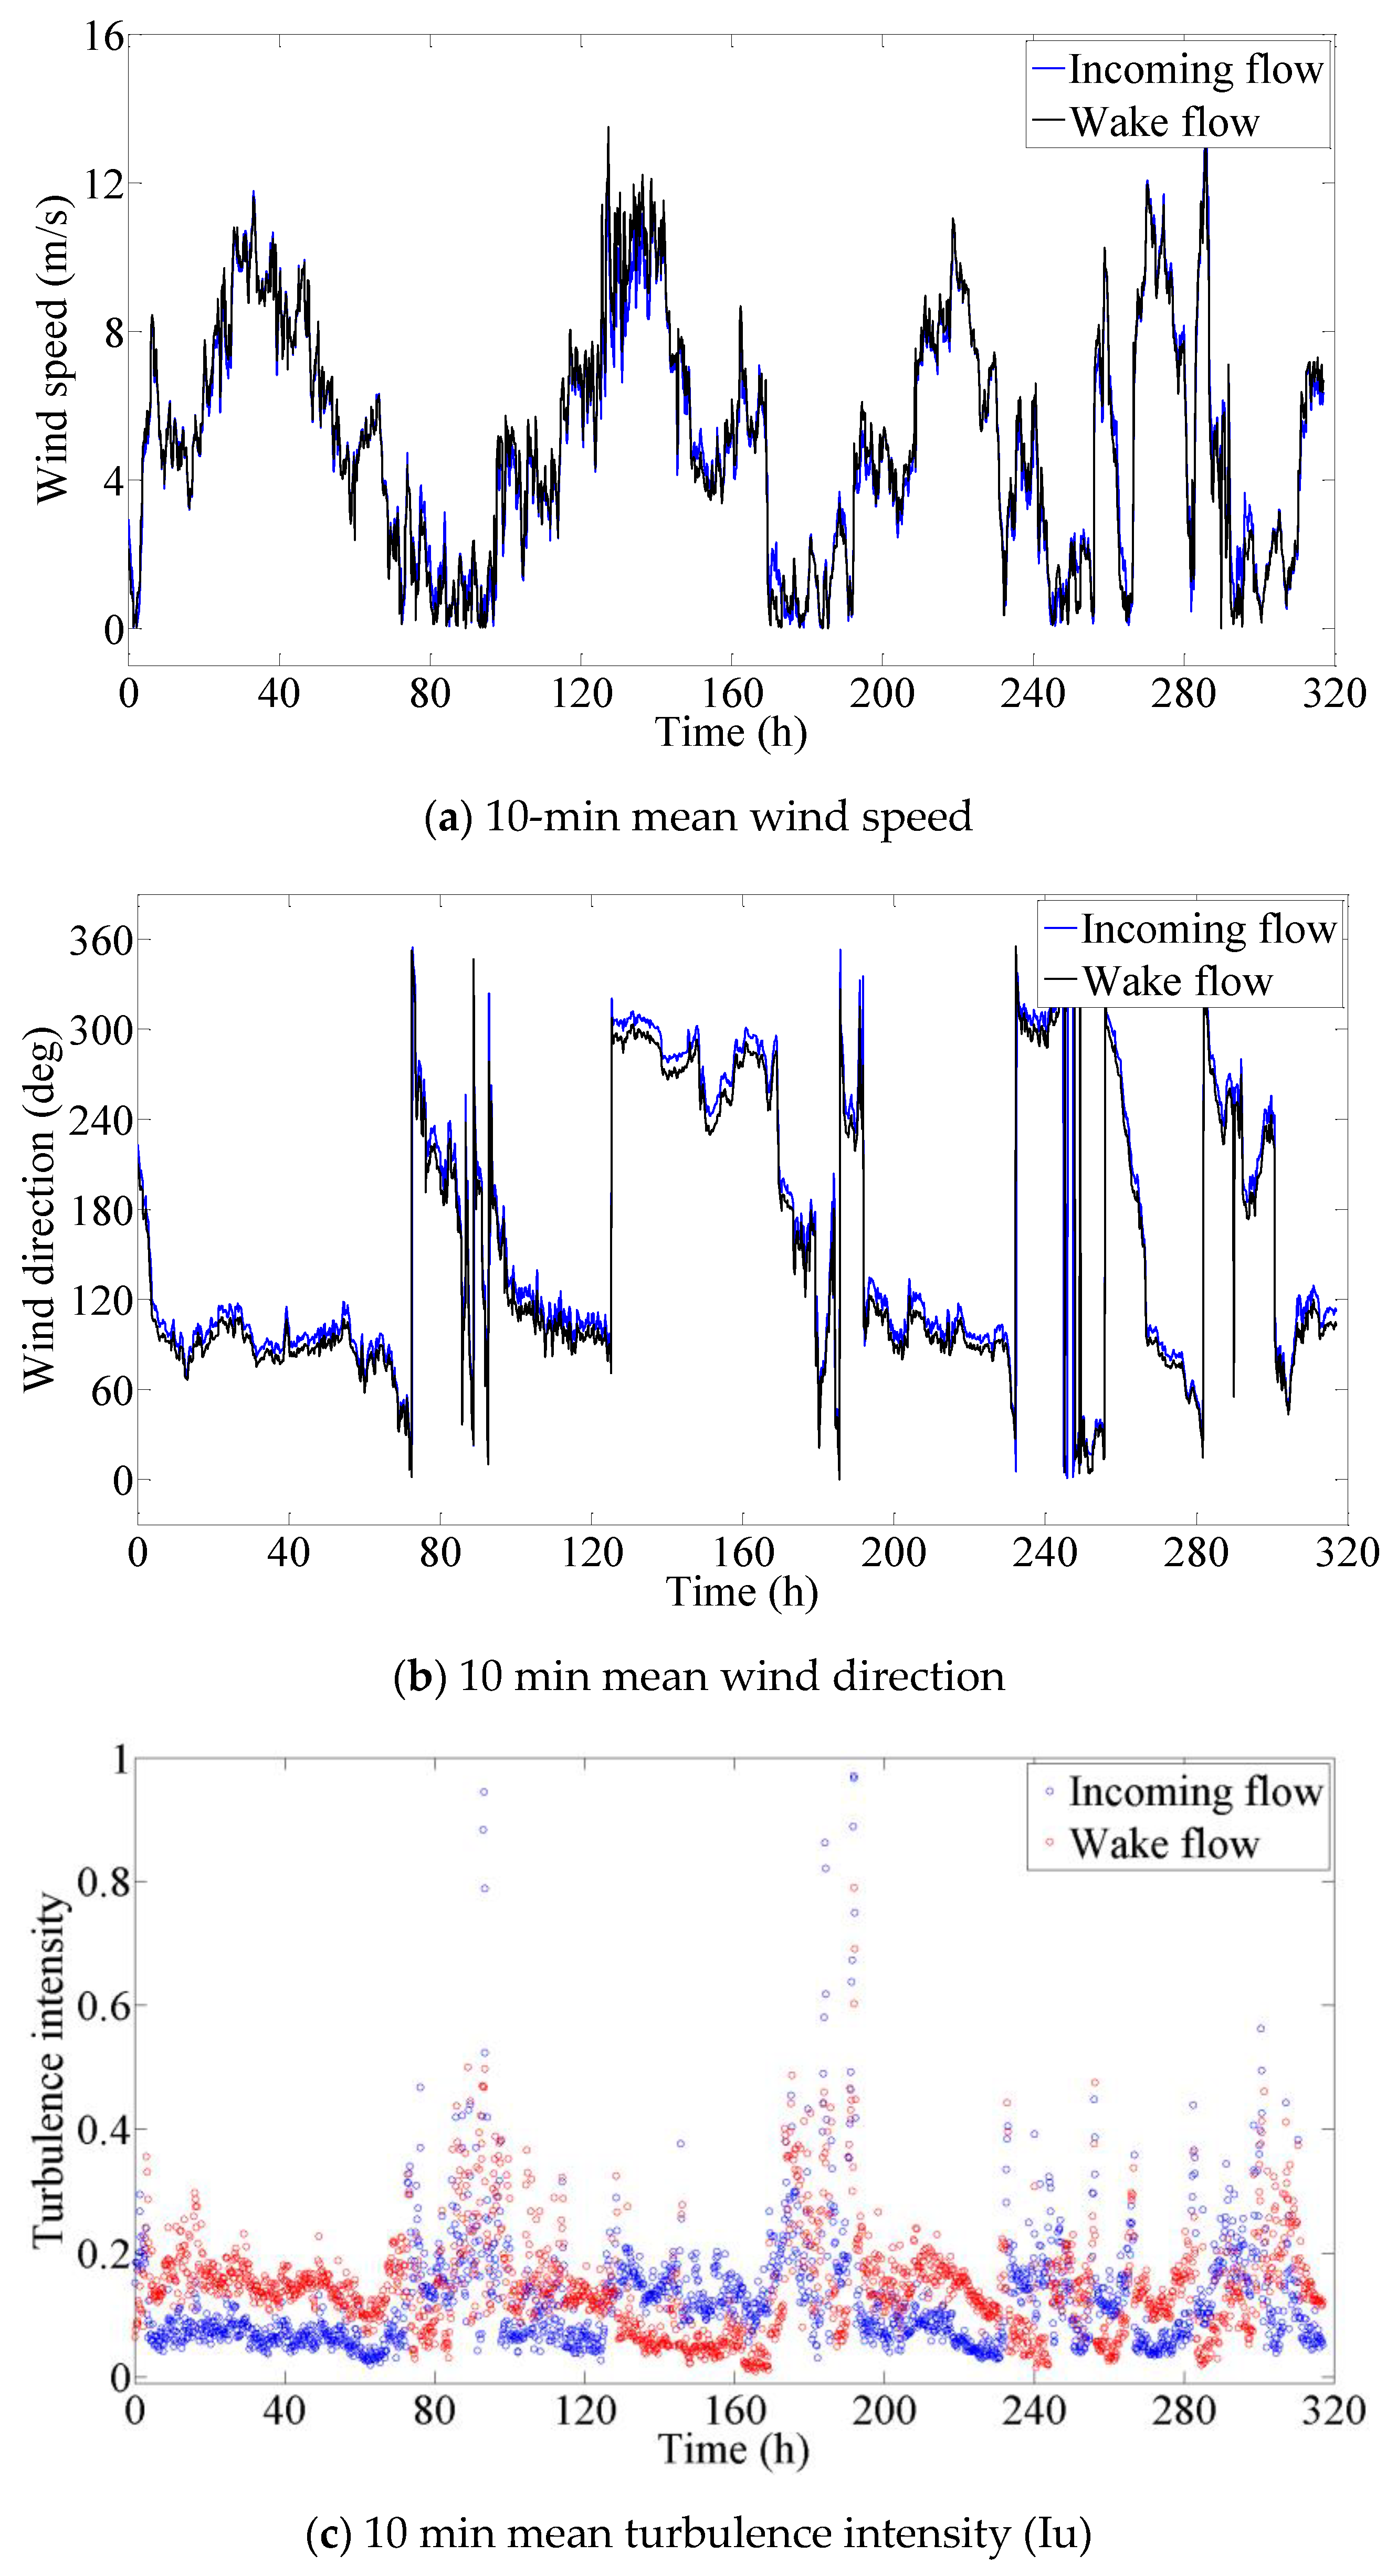
Figure 8 shows the time histories of 10 min mean wind speeds, directions, and turbulence intensities of incoming and wake flows measured by two anemometers in April (16 April 2010 to 29 April 2010). The 10 min mean wind speeds are primarily located in the range of 3 to 12 m/s, as shown in Figure 8a. It was found that, while 10 min mean wind speed histories are close to each other, there is a smaller phase difference of the wind direction between the incoming flow and wake flow, as shown in Figure 8b. The largest difference between two anemometers happens in the turbulence intensity (Iu) of the stream-wise direction, as shown in Figure 8c, because one anemometer is located in the incoming flow and the other is inevitably in the wake flow when the flow is nearly perpendicular to the bridge axis. The turbulence intensity in the incoming flow is certainly less than that in the wake flow. The larger numerical values of the turbulence intensities measured by two anemometers alternately change with time. Whatever the incoming flow or wake flow, the turbulence intensities are mainly less than 0.2. The large value of the turbulence intensity is mainly induced by a small mean wind speed, as shown in Figure 8a.
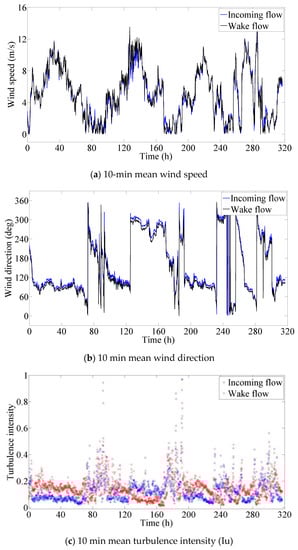
Figure 8.
Ten-minute mean wind characteristics at the mid-span section of the investigated bridge in April (16 April 2010 to 29 April 2010).
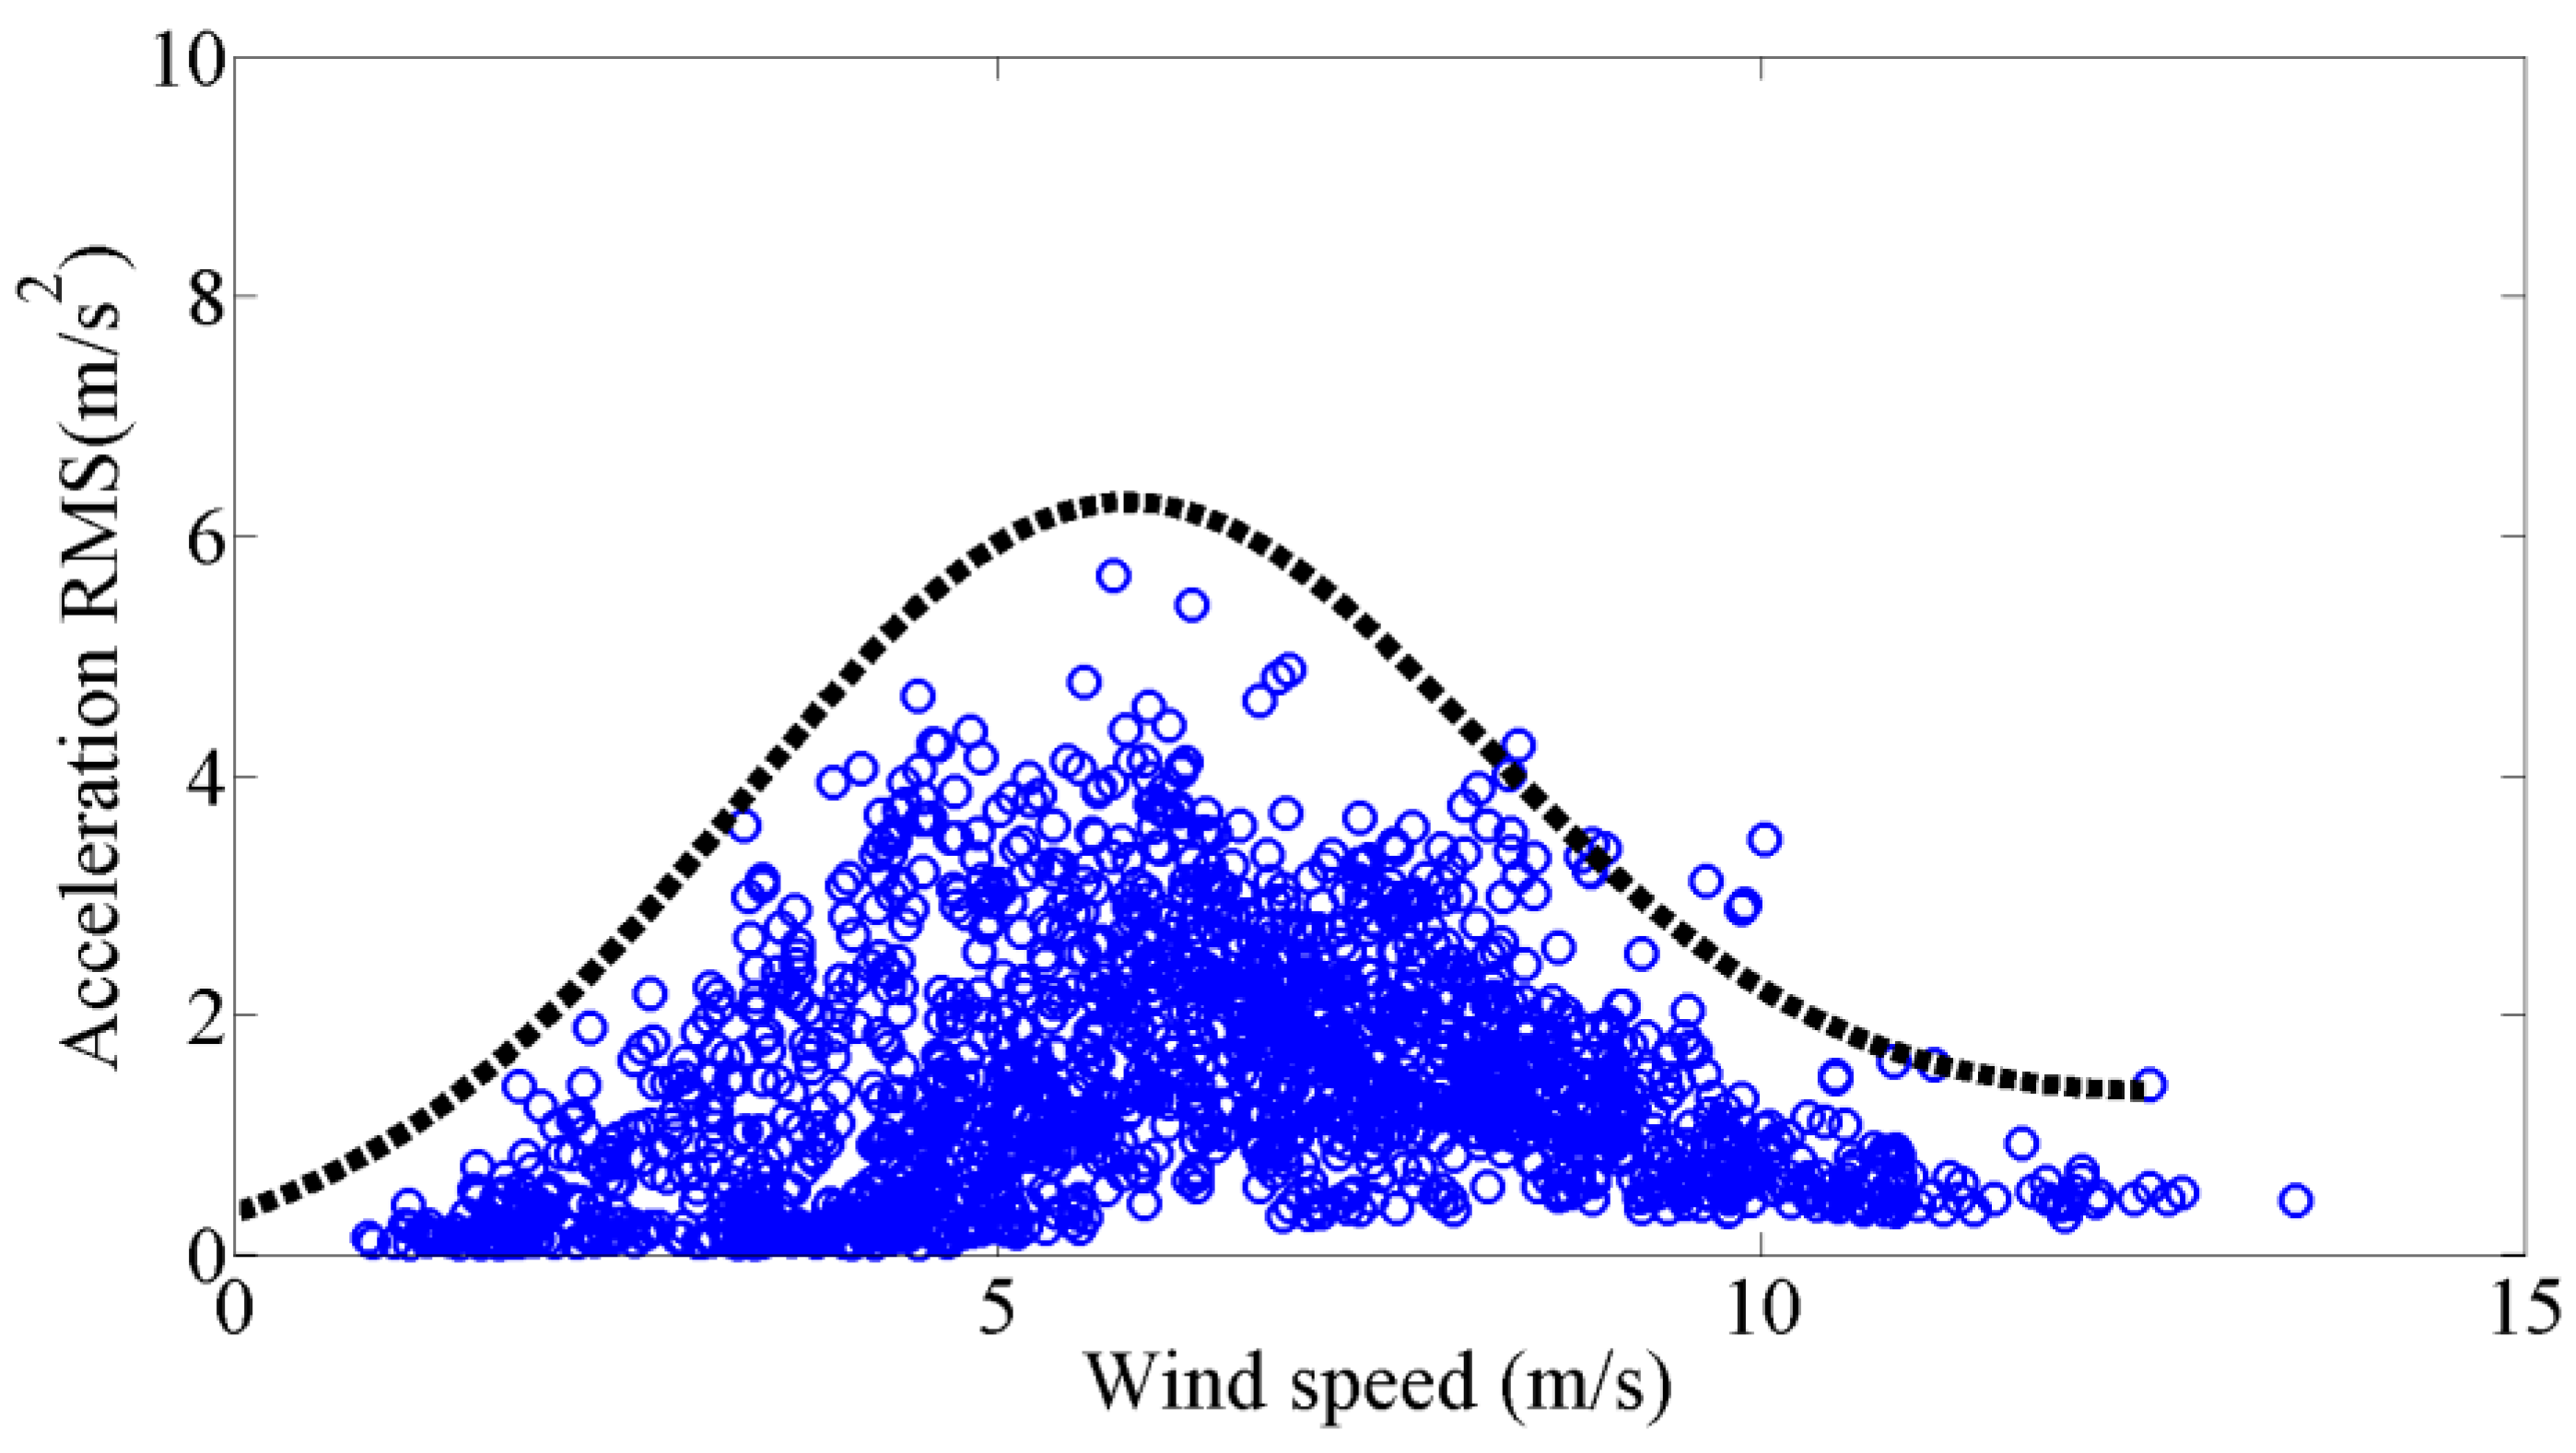
Figure 9 shows the relationship between the acceleration RMSs of 10 min for the cable CAC20 and the corresponding 10 min mean wind speed in three months of April, July, and August. It is found that the vibration amplitude initially increases with the mean wind speed, reaches the largest amplitude at the mean wind speed of approximately 4 to 6 m/s, and then decreases with the mean wind speed. The large amplitude is mainly located in the range of 3 to 12 m/s.
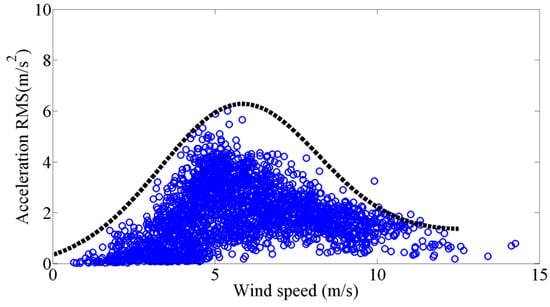
Figure 9.
Vibration amplitude versus 10 min mean speed in April, July, and August.
According to the characteristics of the distribution of the vibration amplitude with the mean wind speed, the relationship between the maximum vibration amplitude and the mean wind speed can be fitted and denoted by the following form of expression:
where is the mean wind speed, is fitted to be 0.1, is 5.75 m/s, is 0.07 m/s, and the factor is 1200. The first term of the right side of Equation (1) is a linear function, which means the forced vibration component increases with the mean wind speed. The second term of the right side is a modified function of normal distribution, which has a factor of to meet the statistical samples. The additional data of September and October of 2010 was employed to validate the presented relationship between the vibration amplitude and the mean wind speed, as shown in Figure 10. It is suggested that the maximum vibration amplitude at different mean wind speeds can be reflected by the presented relationship.
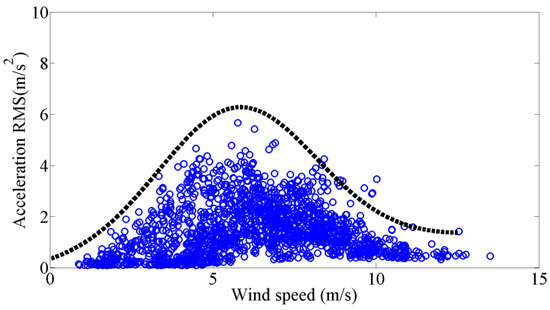
Figure 10.
Validation of the presented relationship between the vibration amplitude and the mean wind speed.
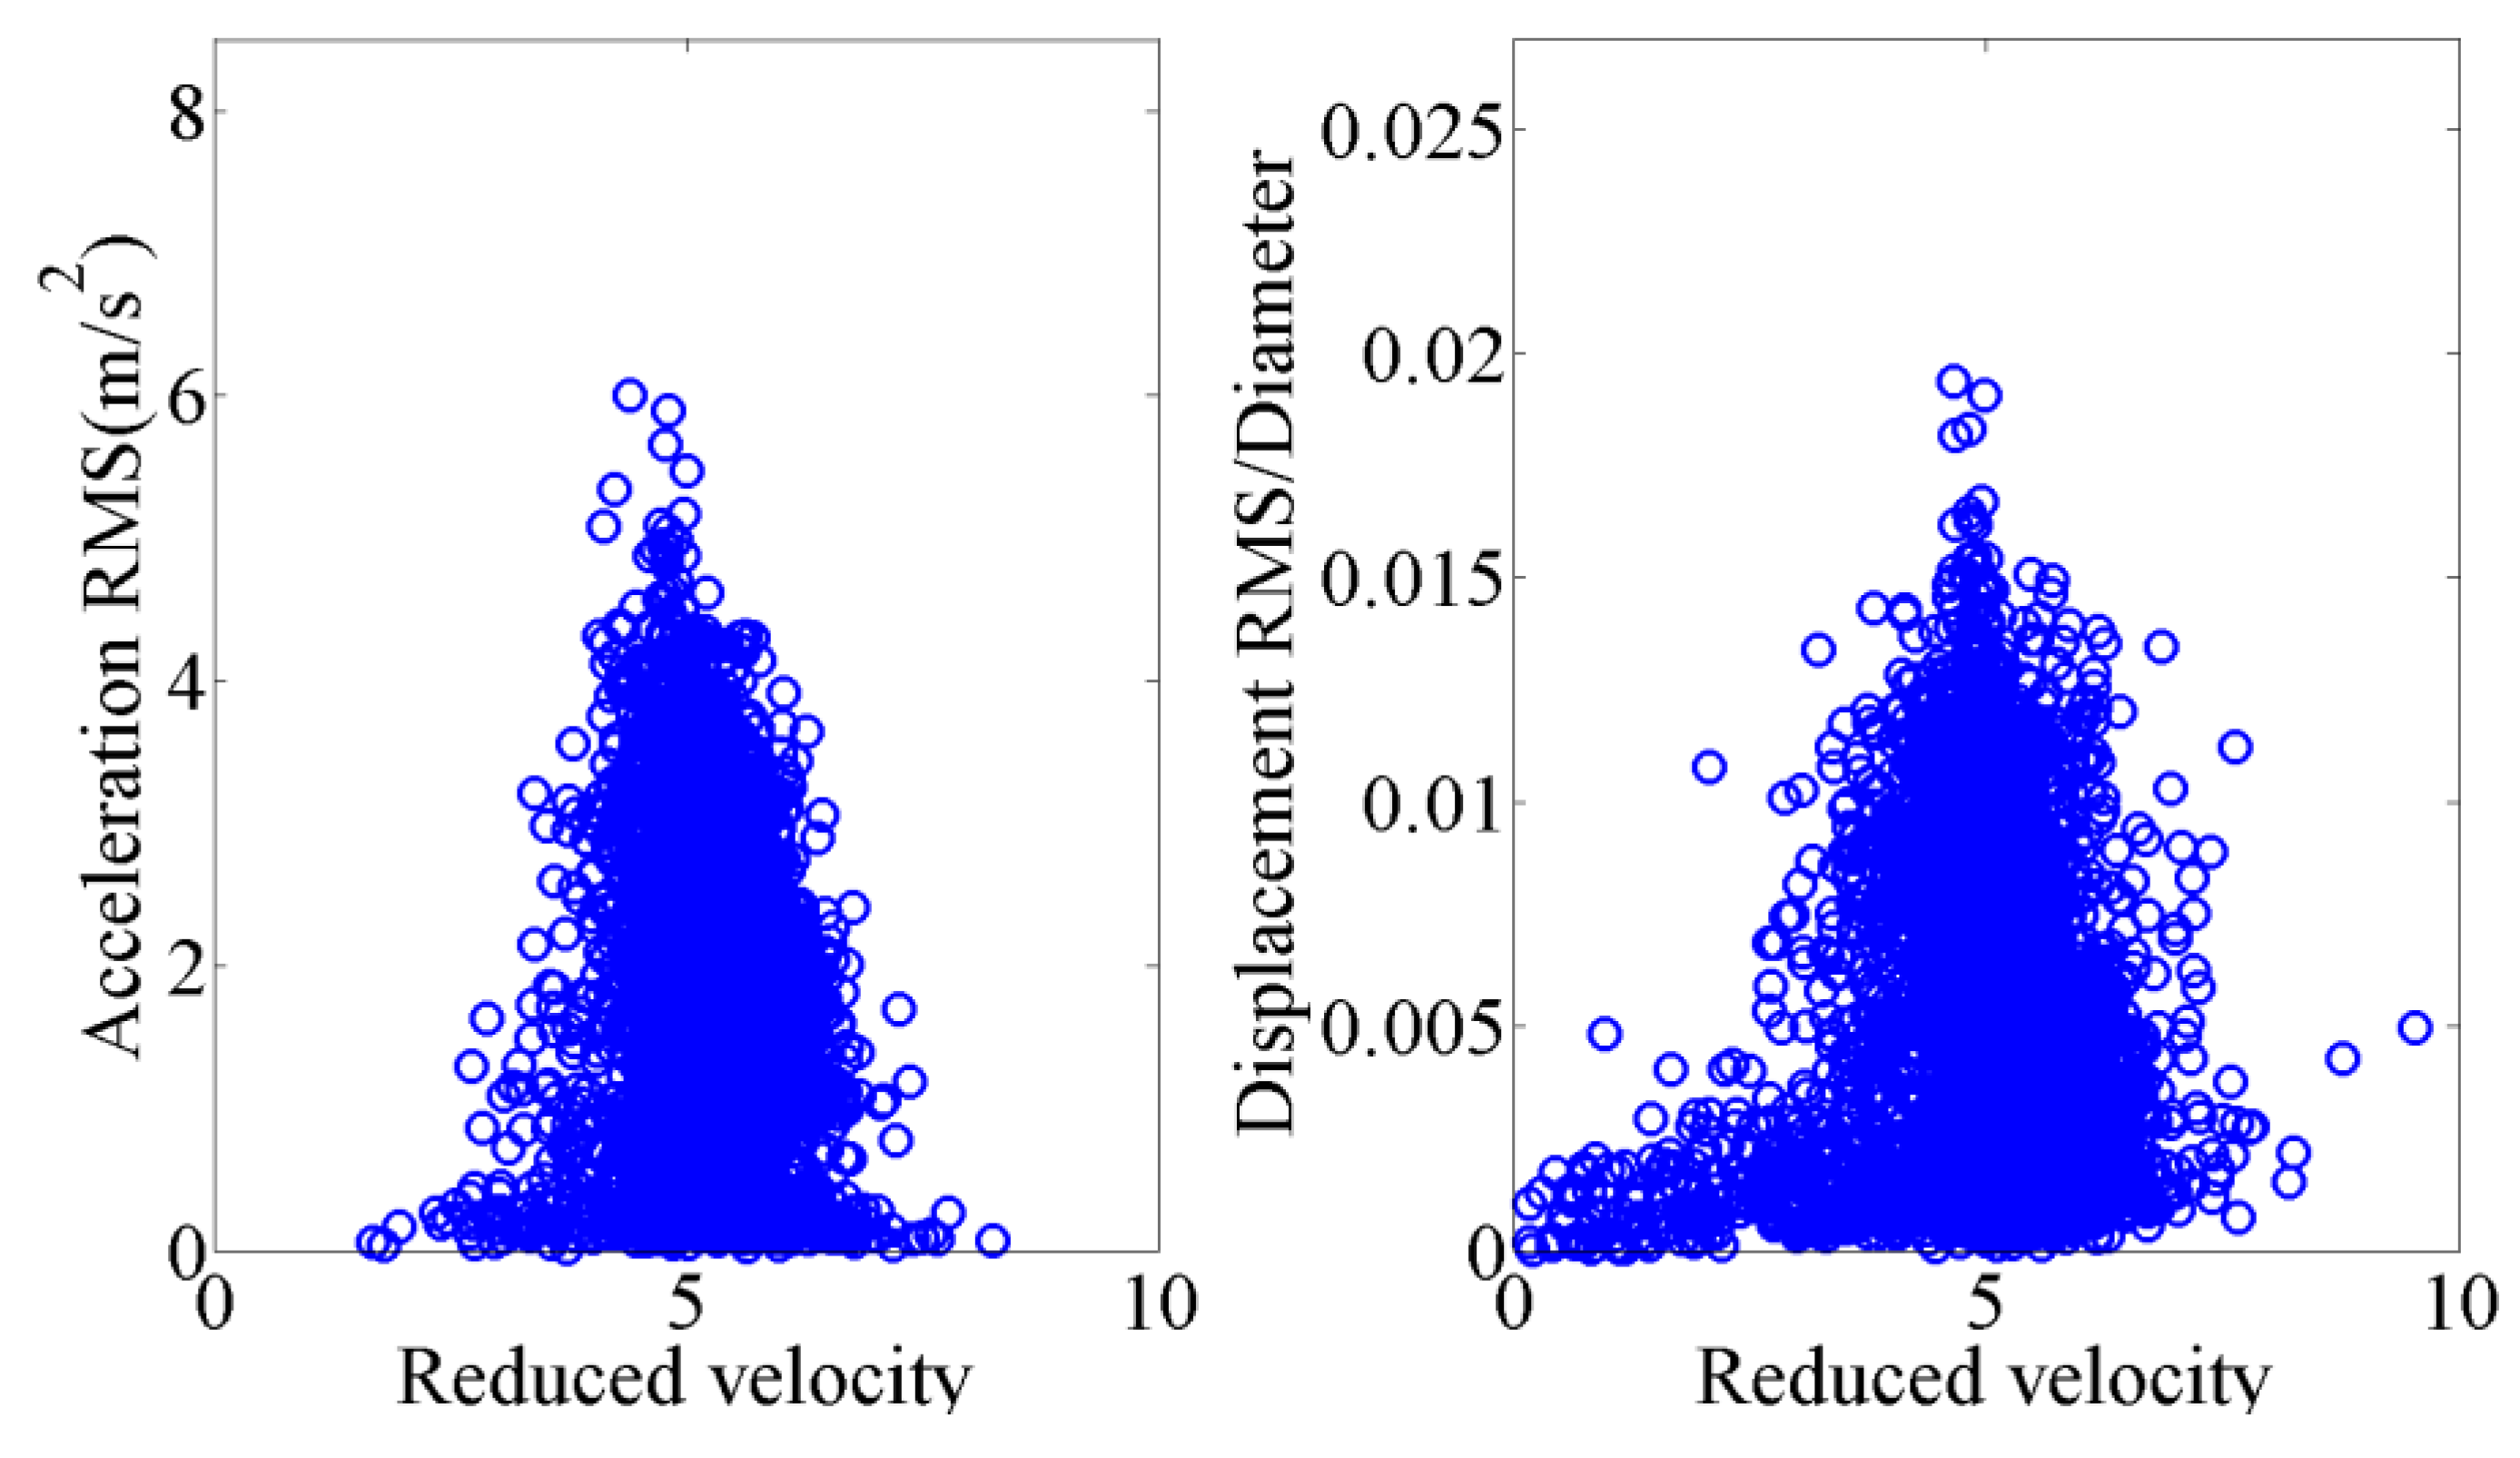
To reveal the correlation between the cable vibration and the velocity, the mean wind speed was often changed into the reduced velocity, i.e., , where is the nth modal frequency and is the diameter of the cable. As a multimode vibration in the present study, the reduced velocity was calculated based on the dominant mode frequency that had the maximum vibration amplitude in all vibration participative modes. Figure 11a shows the correlation of the 10 min acceleration RMSs and the corresponding 10 min mean reduced velocity. Next, the relationship of the dimensionless vibration amplitude with the reduced velocity is obtained, as shown in Figure 11b. The results indicate that the large vibration amplitudes are mainly located in the region near the reduced velocity of five. This phenomenon is similar to the feature of a vortex-induced vibration of a stayed cable observed by Zuo and Jones [6].
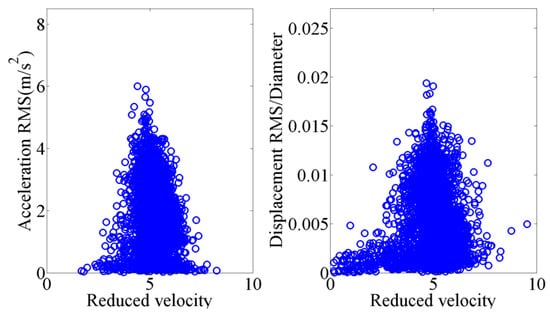
Figure 11.
Vibration response versus reduced velocity in April.
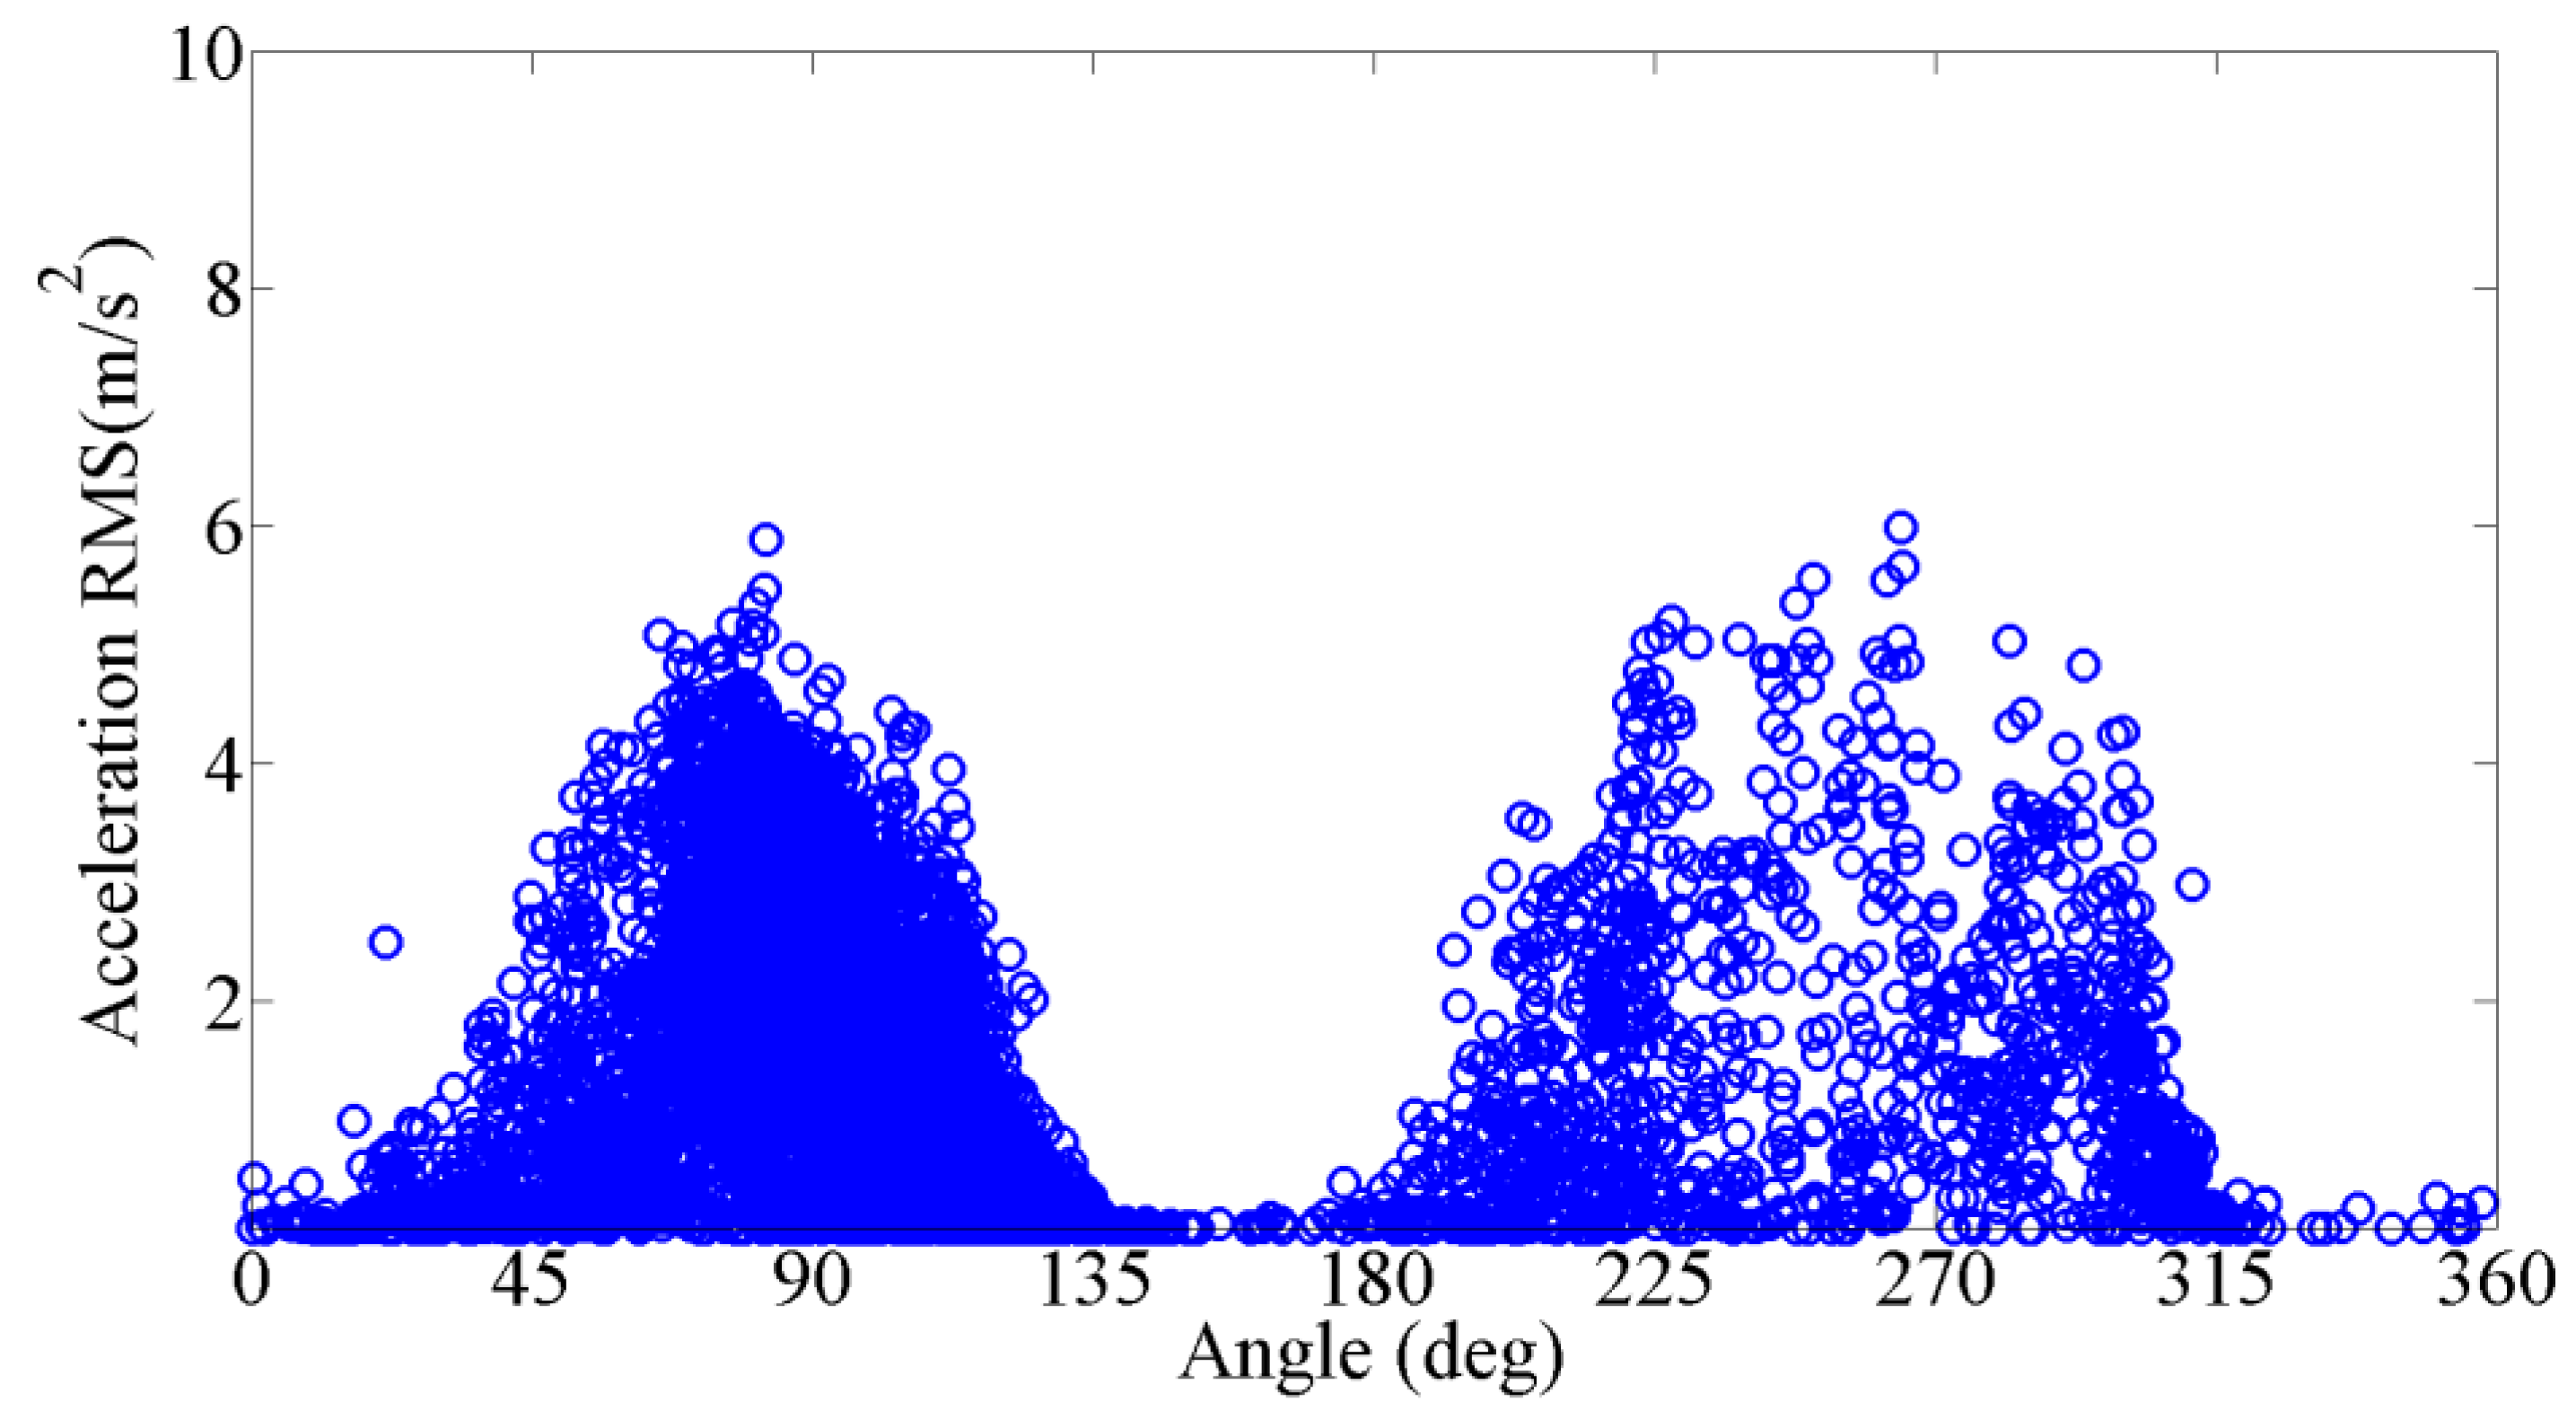
Figure 12 shows the relationship of the RMS of the acceleration of the CAC20 cable and the corresponding mean wind direction in April, July, and August. It is found that the large amplitudes mainly happen at the wind direction nearly perpendicular to the bridge. The large amplitudes are more concentrated, with a wind direction near 90 degrees (deg), and are distributed wider when the wind direction nears 270 degrees. The reason is believed to be that the wind direction is mainly concentrated in the direction perpendicular to the bridge axis when the wind blows from the south; and the wind direction covers more angles when the wind comes from the north, as shown in Figure 7.
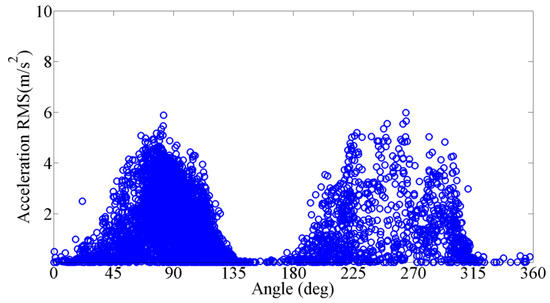
Figure 12.
Vibration amplitude versus yaw angle in April.
Figure 13 shows the relationship of the RMS of the acceleration of the CAC20 cable and the corresponding turbulence intensity in three months. The large vibration amplitudes mainly occur when the turbulence intensity is less than 20%.
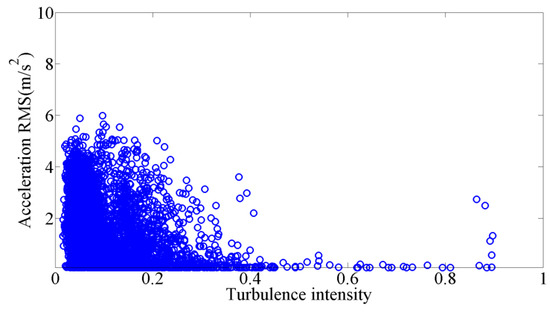
Figure 13.
Vibration amplitude versus turbulence intensity in April.
4.2. Estimation Method of the Participative Modes of VIVs
The mean wind speed profile acting on the stay cables was not uniform, because the investigated cable-stayed bridge was constructed in the atmospheric boundary layer. According to the log law, the mean wind speed profile in the atmospheric boundary layer can be defined as the following:
where is the reference height above the ground, is the arbitrary height above the ground, is the mean wind speed at the height , is the mean wind speed at the height, , and is the terrain roughness index, equal to 0.12, 0.16, 0.22, and 0.30 for A, B, C, and D terrains, respectively, according to the Chinese Standard GB 5009-2001 (National Standard of the People’s Republic of China, 2001 version, see [16]).
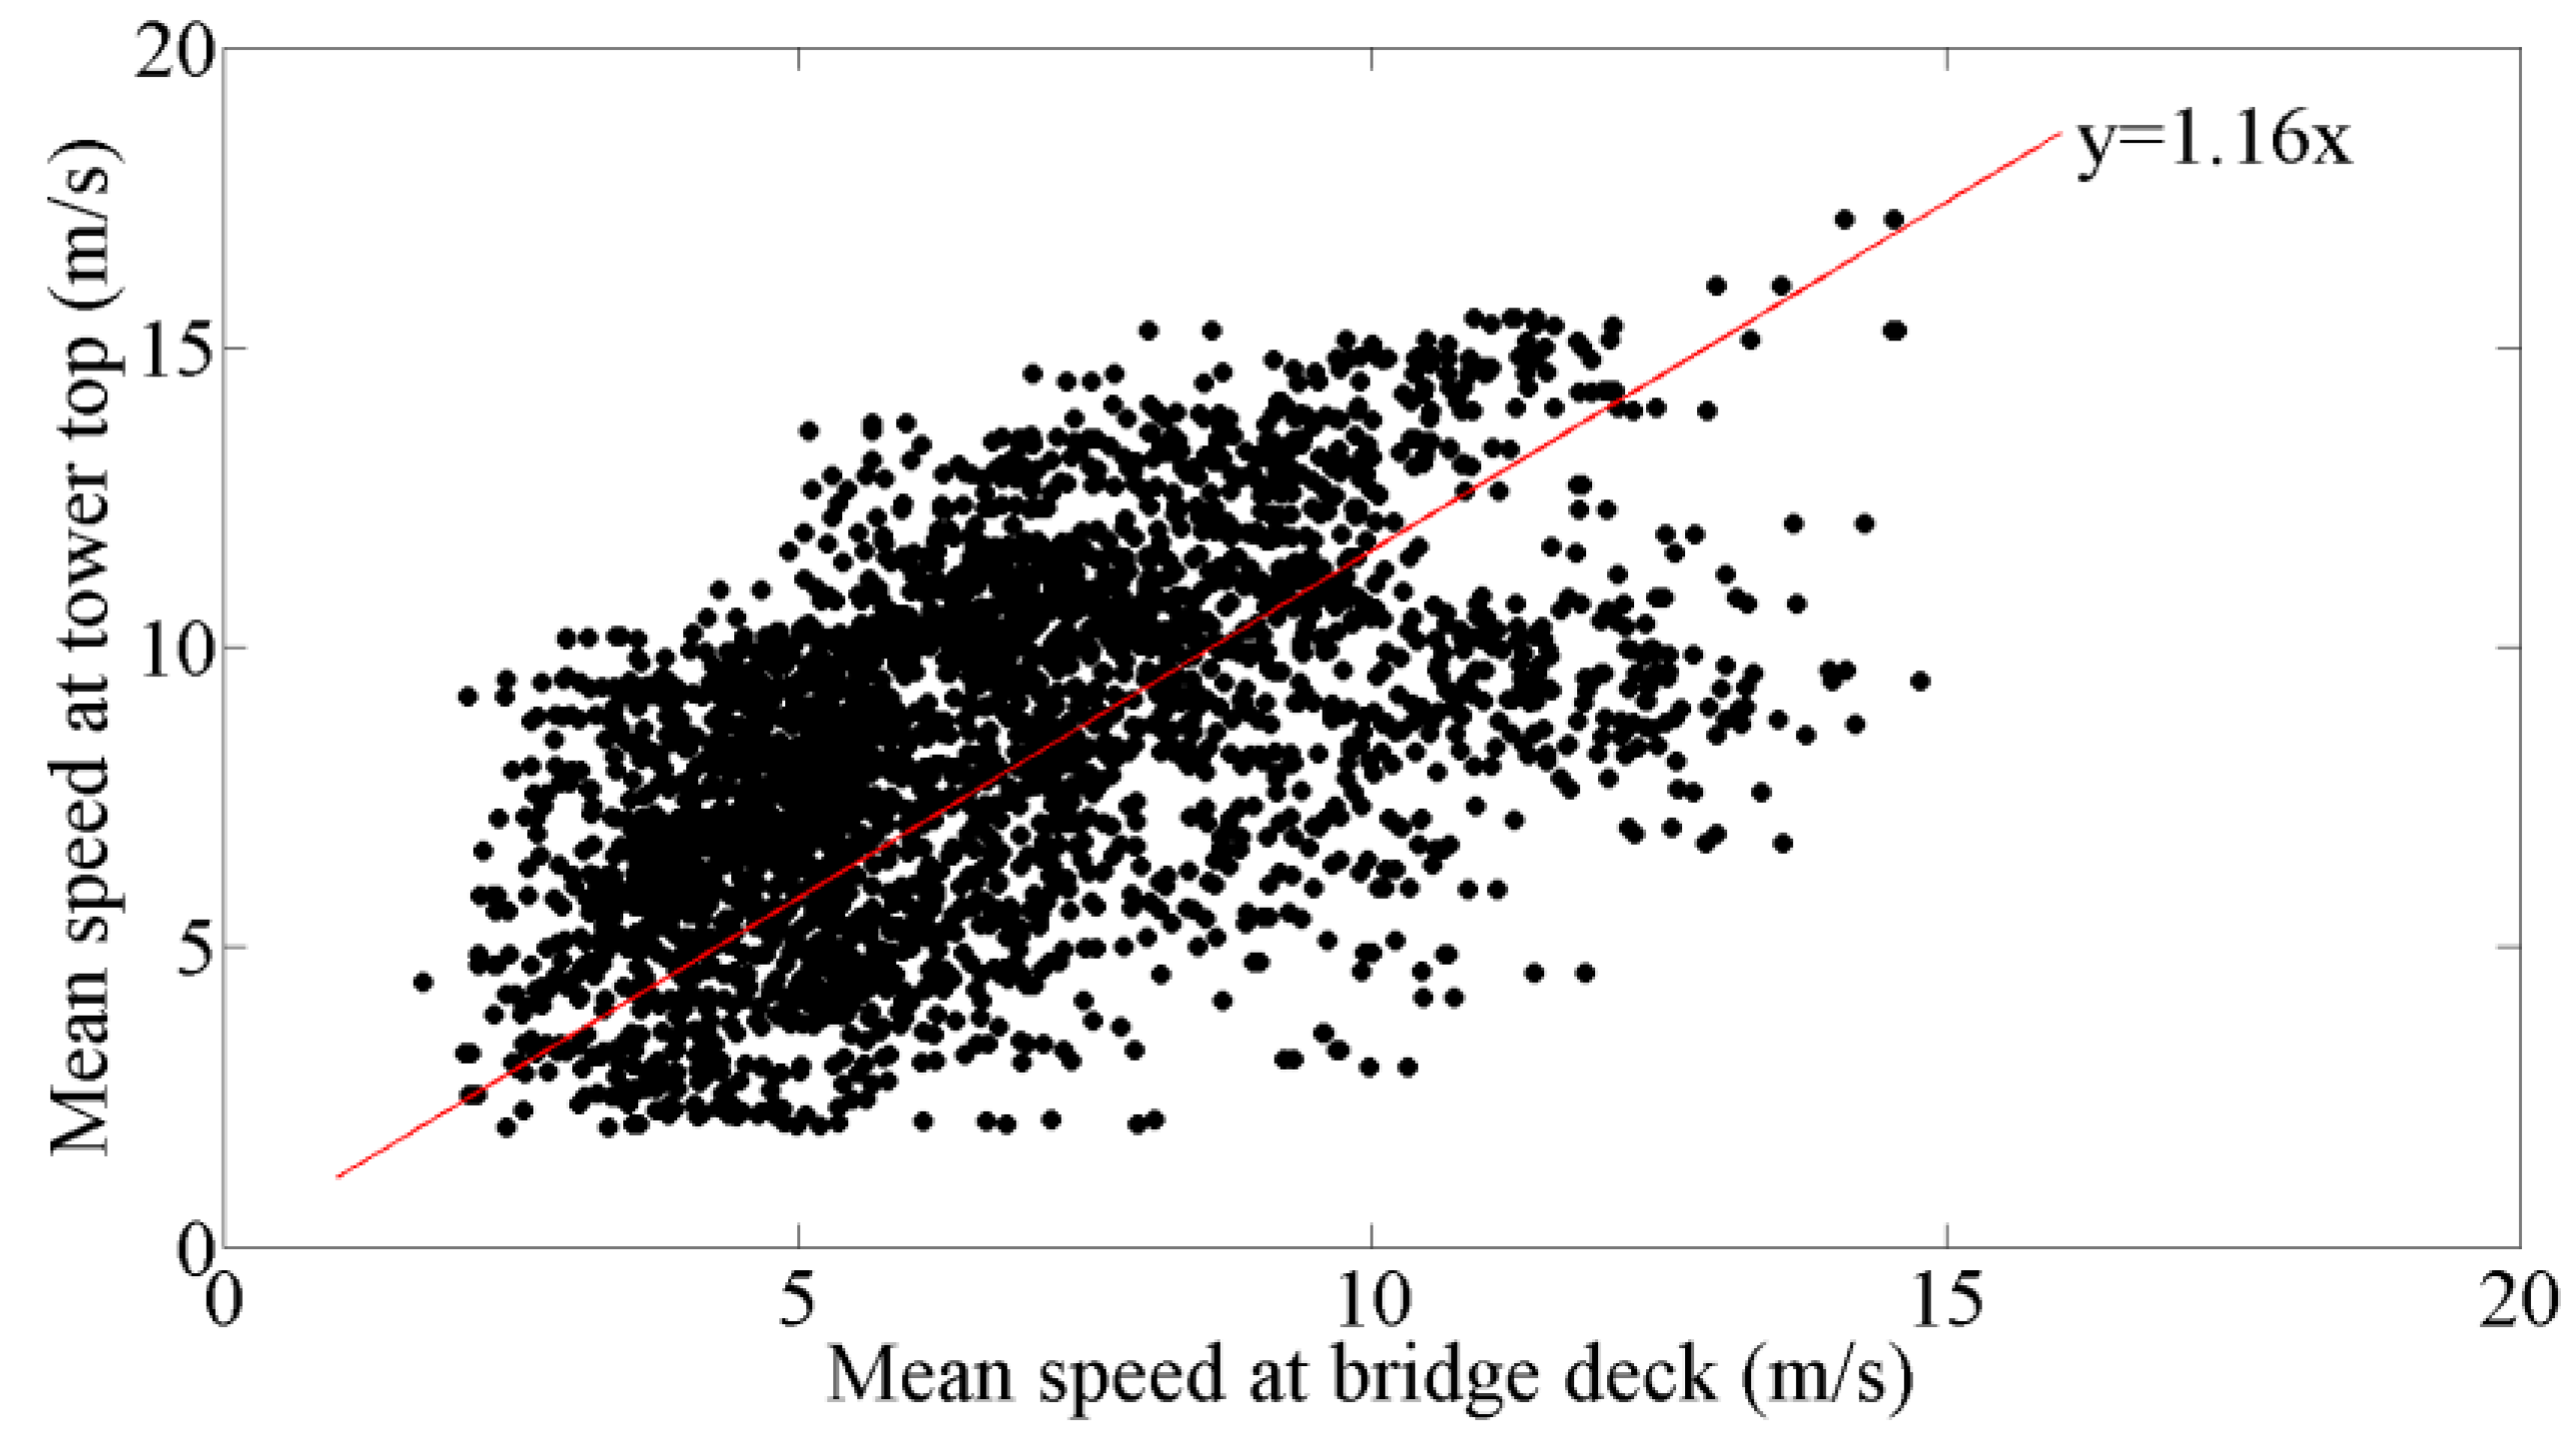
According to the wind data measured by the anemometers installed at the tower top and bridge deck, the correlation of the mean wind speeds between the tower top and deck level of the bridge was obtained, as shown in Figure 14. The mean wind speed on the tower top is nearly 1.16 times that on the bridge deck level, according to the fitting line.
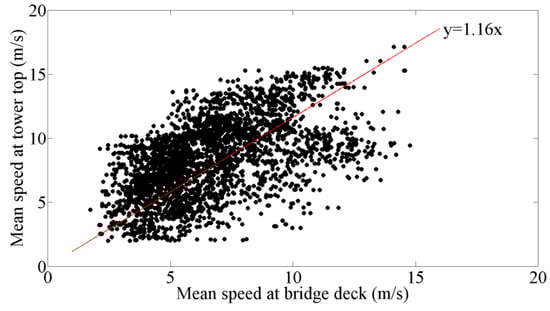
Figure 14.
Correlation between mean wind speeds at tower top and deck level of the bridge.
In the present study, the height of the deck level is 59.0 m above the ground, and the corresponding height of the reference height (i.e., the deck anemometer installing height) is 65.0 m above the ground. The height of the tower top is 151.0 m above the bridge deck, and the corresponding height, , of the anemometer of the tower top is 212.1 m, with the anemometer 2.1 m above the tower top. According to Equation (2), the terrain roughness index, , can be calculated as 0.125, which is close to 0.12 because the investigated bridge is constructed near the sea; therefore, the terrain of the bridge is close to a type of A terrain. Next, according to by the anemometer at the deck level, the mean wind speed at an arbitrary height can be calculated by Equation (2).
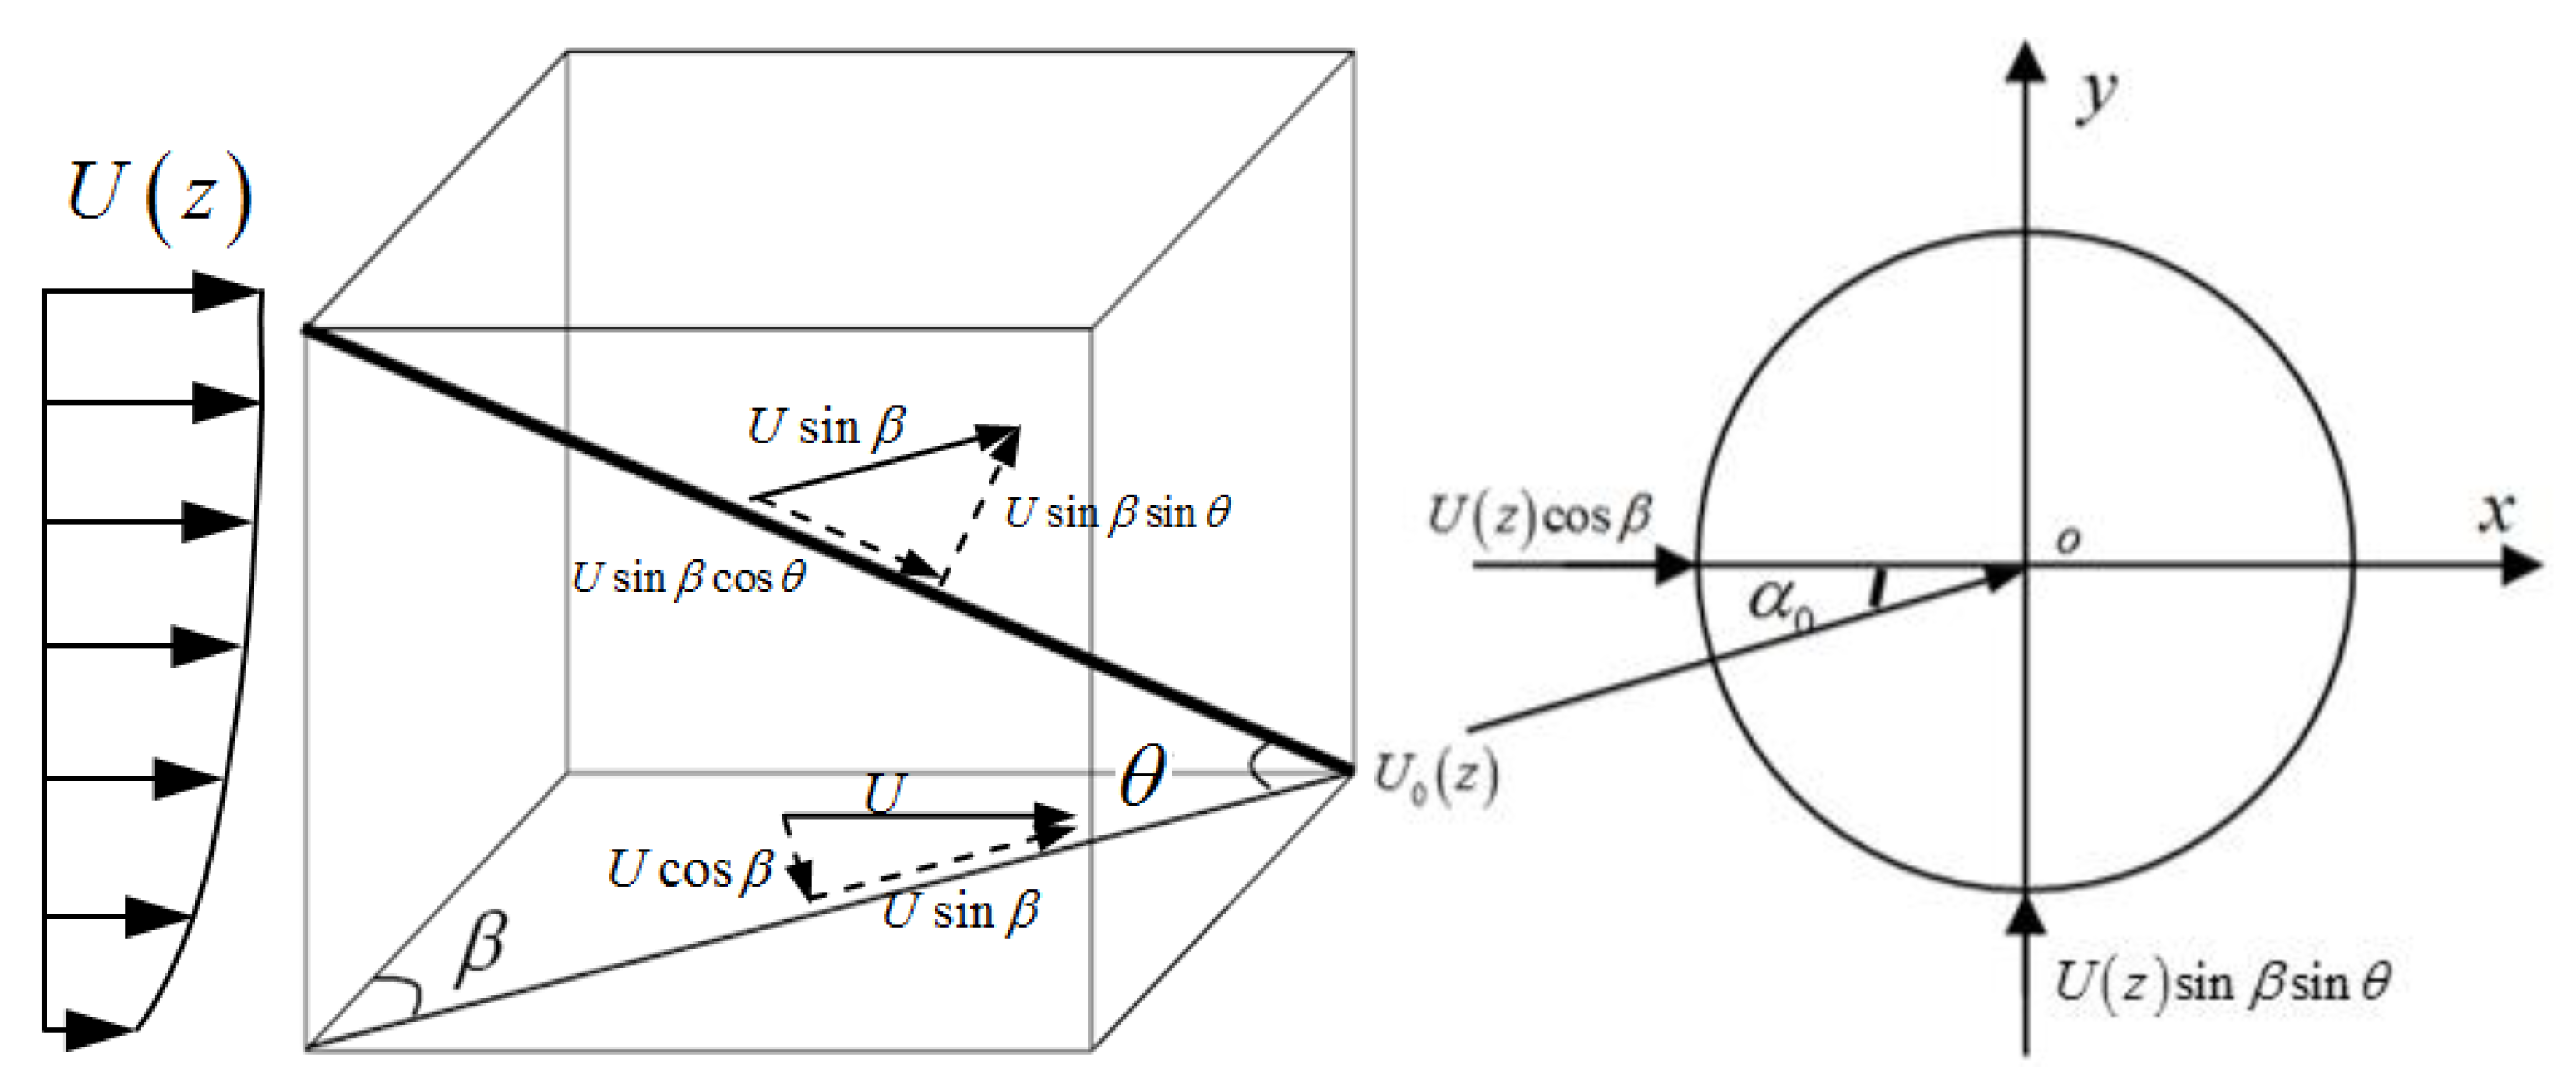
Actually, the wind is not perpendicularly acting on the stay cable plane, as shown in Figure 15, and the yaw angle of the stay cable plane is . The inclination angle of the stay cable is . The incoming velocity is decomposed into two components that are perpendicular to the cable spanwise direction: and . The axial flow component is neglected in the present study. The relative velocity and the attack of angle are subsequently obtained, as follows:
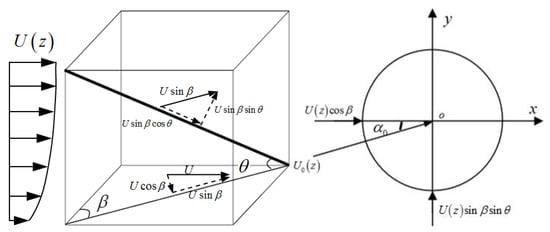
Figure 15.
Schematic diagram of the inclination angle and wind yaw angle of the cable model.
Because the Reynolds number varies at different heights of the wind velocity profile, the Strouhal number, , can be estimated by using the following formula [17]:
where, is the cable diameter at the height of z (in this study, it is constant along the cables), is the Reynolds number depending on z, is the coefficient of kinematic viscosity, and is the incoming relative velocity.
The vortex-shedding frequency, , of a long cable can be expressed as the following:
According to the velocities at the upper and lower ends of the stay cable, the vortex-shedding frequencies of two ends of the stay cable, and , can be calculated from Equation (6). For a long flexible stay cable of a real cable-stayed bridge, high modal frequencies are usually the multiple of its natural frequency. If the fundamental natural frequency is known, the participative modes of VIVs can be estimated from the vortex-shedding-frequency range, [, ].
4.3. Comparison of the Estimated Participative Modes with the Measured Vibration Modes of VIVs
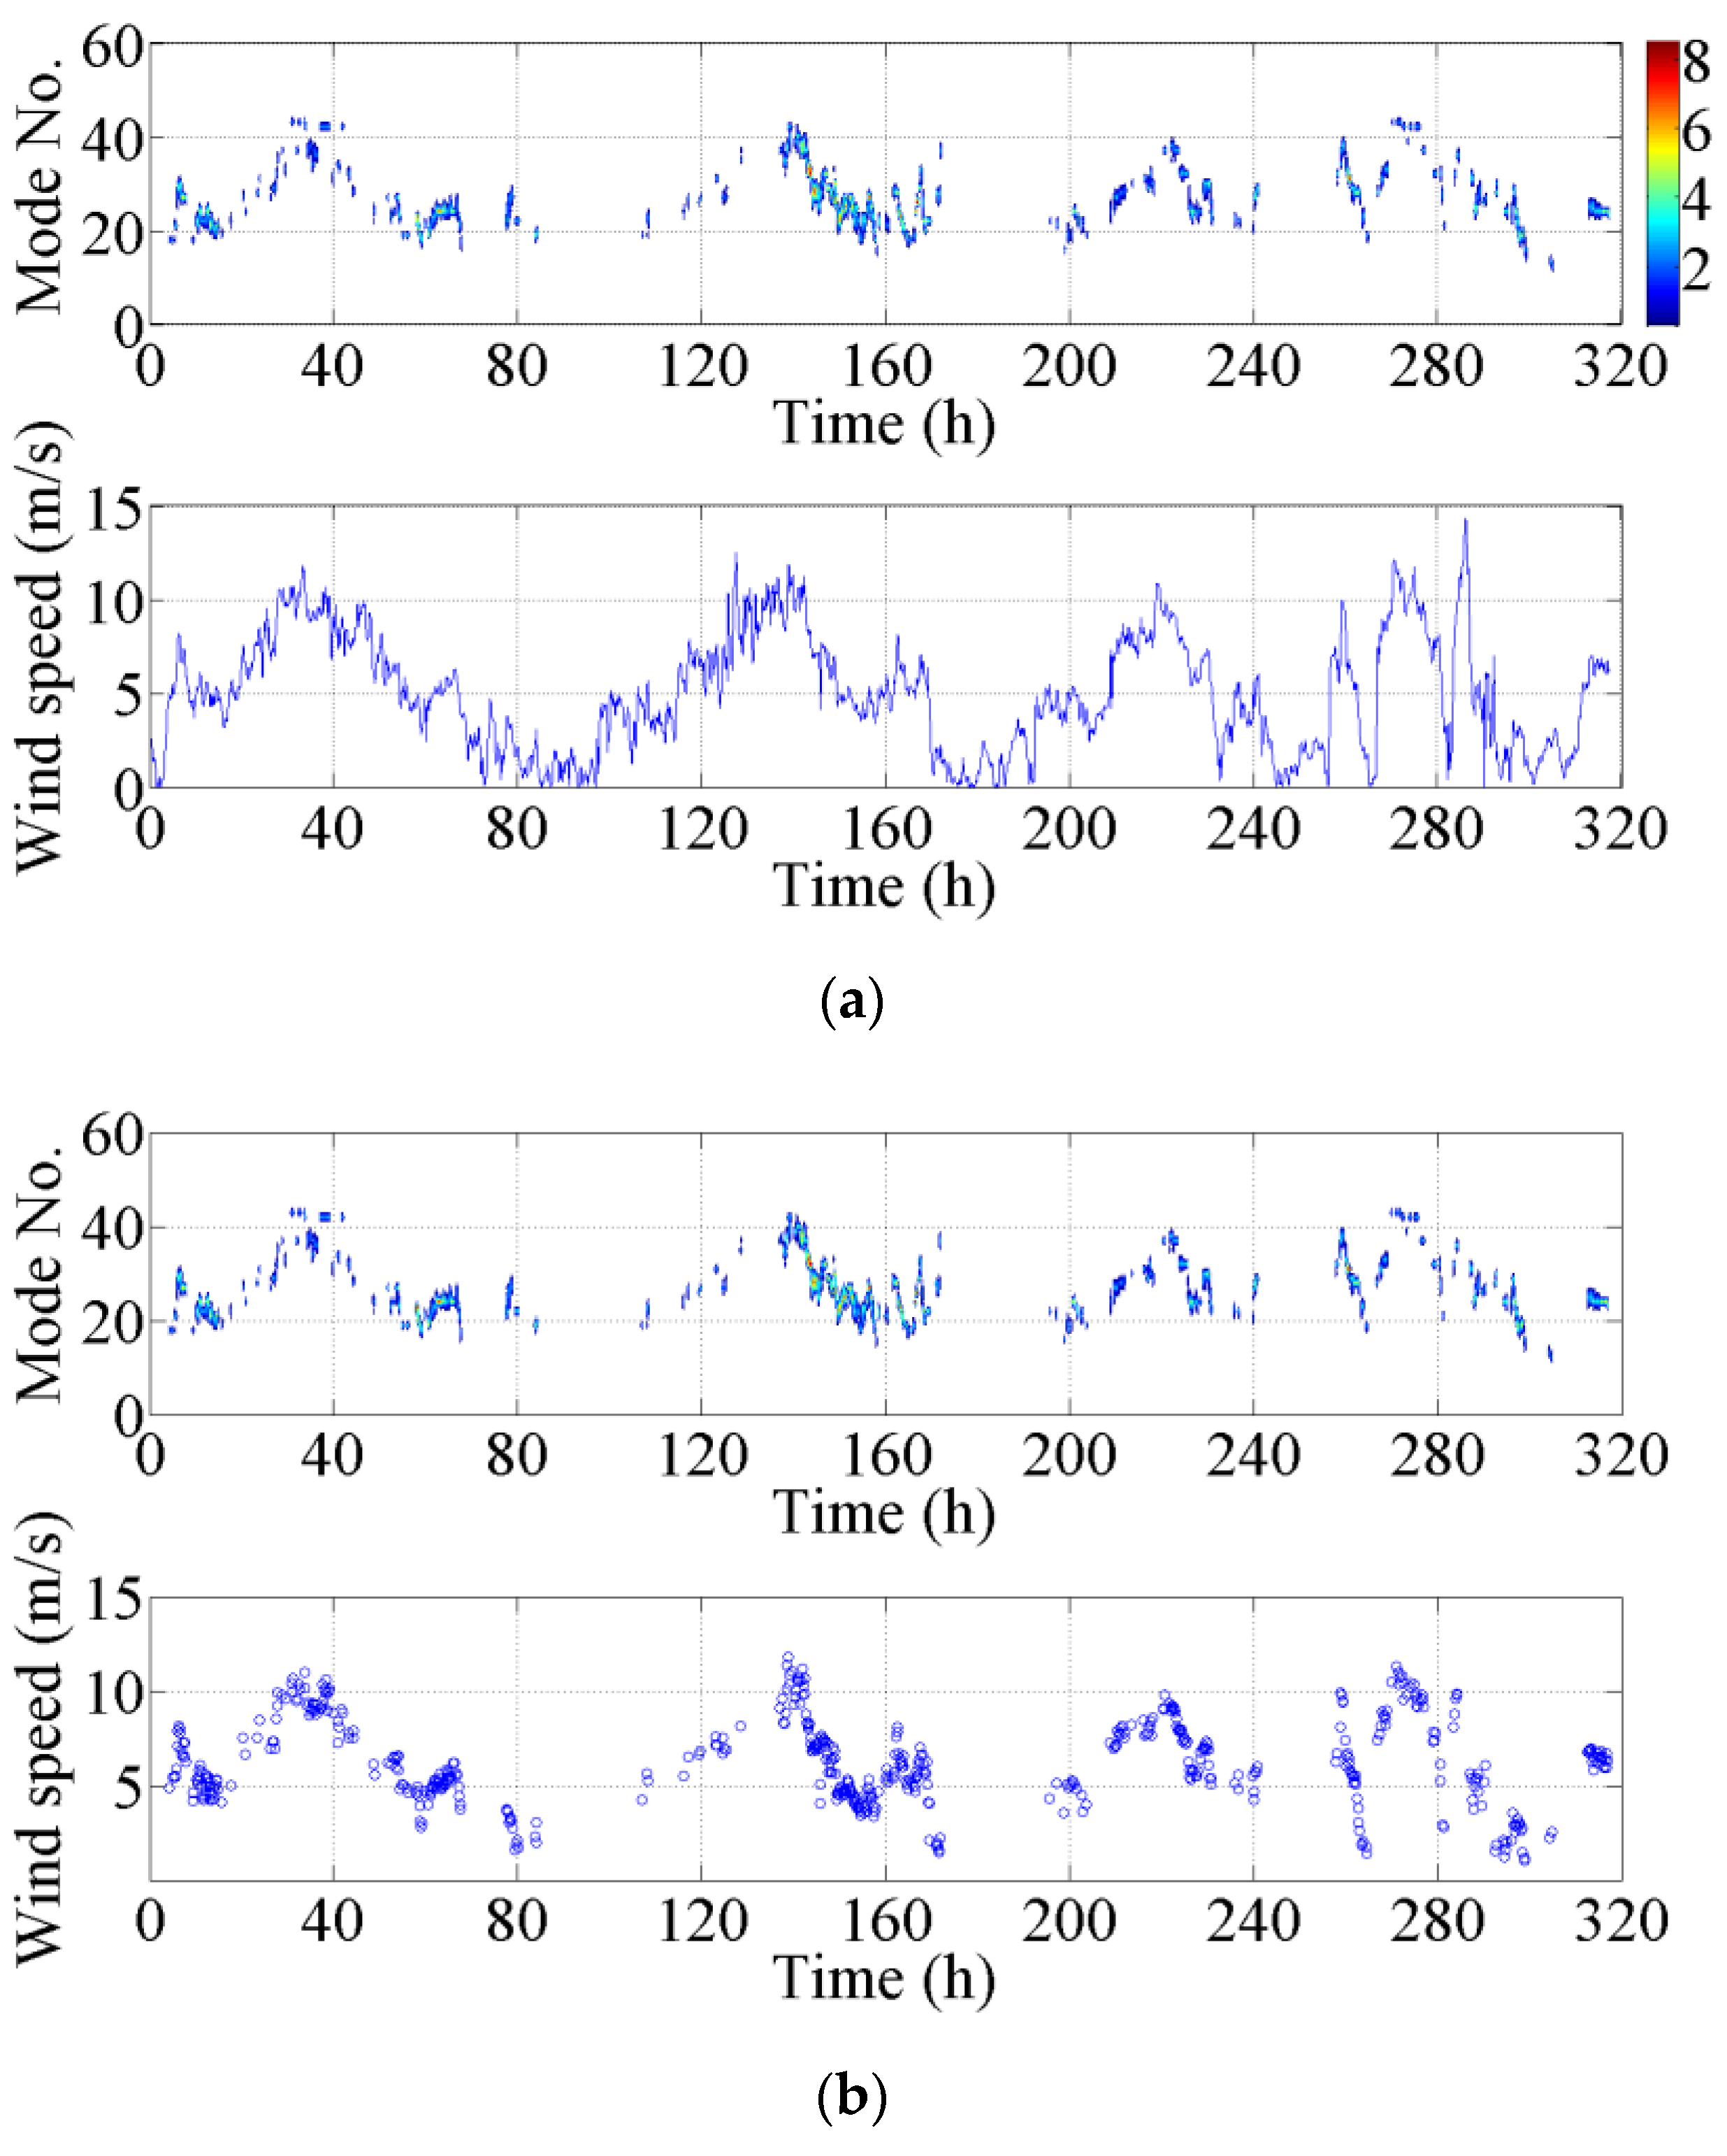
The data from April 2010 were first employed to estimate the participative modes of VIVs, and the estimated participative modes were subsequently compared with the measured vibration modes of VIVs. The preprocessing of the data was performed in advance, and the data with the acceleration amplitude of less than 2 m/s2 were deleted first. The time history of the measured vibration modes was shown in the upper sub-figure of Figure 16. The colors indicate the participative mode numbers. The lower sub-figure of Figure 16a is the time history of the mean wind speed measured by only one anemometer at the bridge deck level, because the mean wind speeds are close to each other for two anemometers, as shown in Figure 8a.
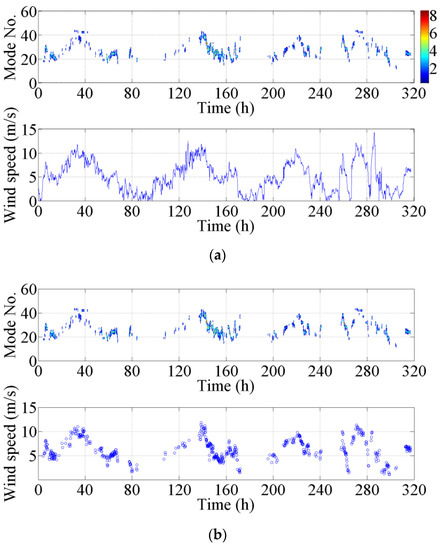
Figure 16.
Change of measured vibration modes and mean velosities with time. (a) Change of measured vibration modes versus mean velocities; (b) Change of measured vibration modes versus mean velocities with the small components being filtered.
Figure 16a shows that the mean wind speeds corresponding to the acceleration amplitudes less than 2 m/s2 are notably small. These parts of the mean wind speeds are subsequently deleted, as shown in Figure 16b. It is determined that the shapes of the time histories of the measured vibration modes and the mean wind speeds are similar to each other. The magnitude of the vibration mode increases or decreases with the mean wind speed.
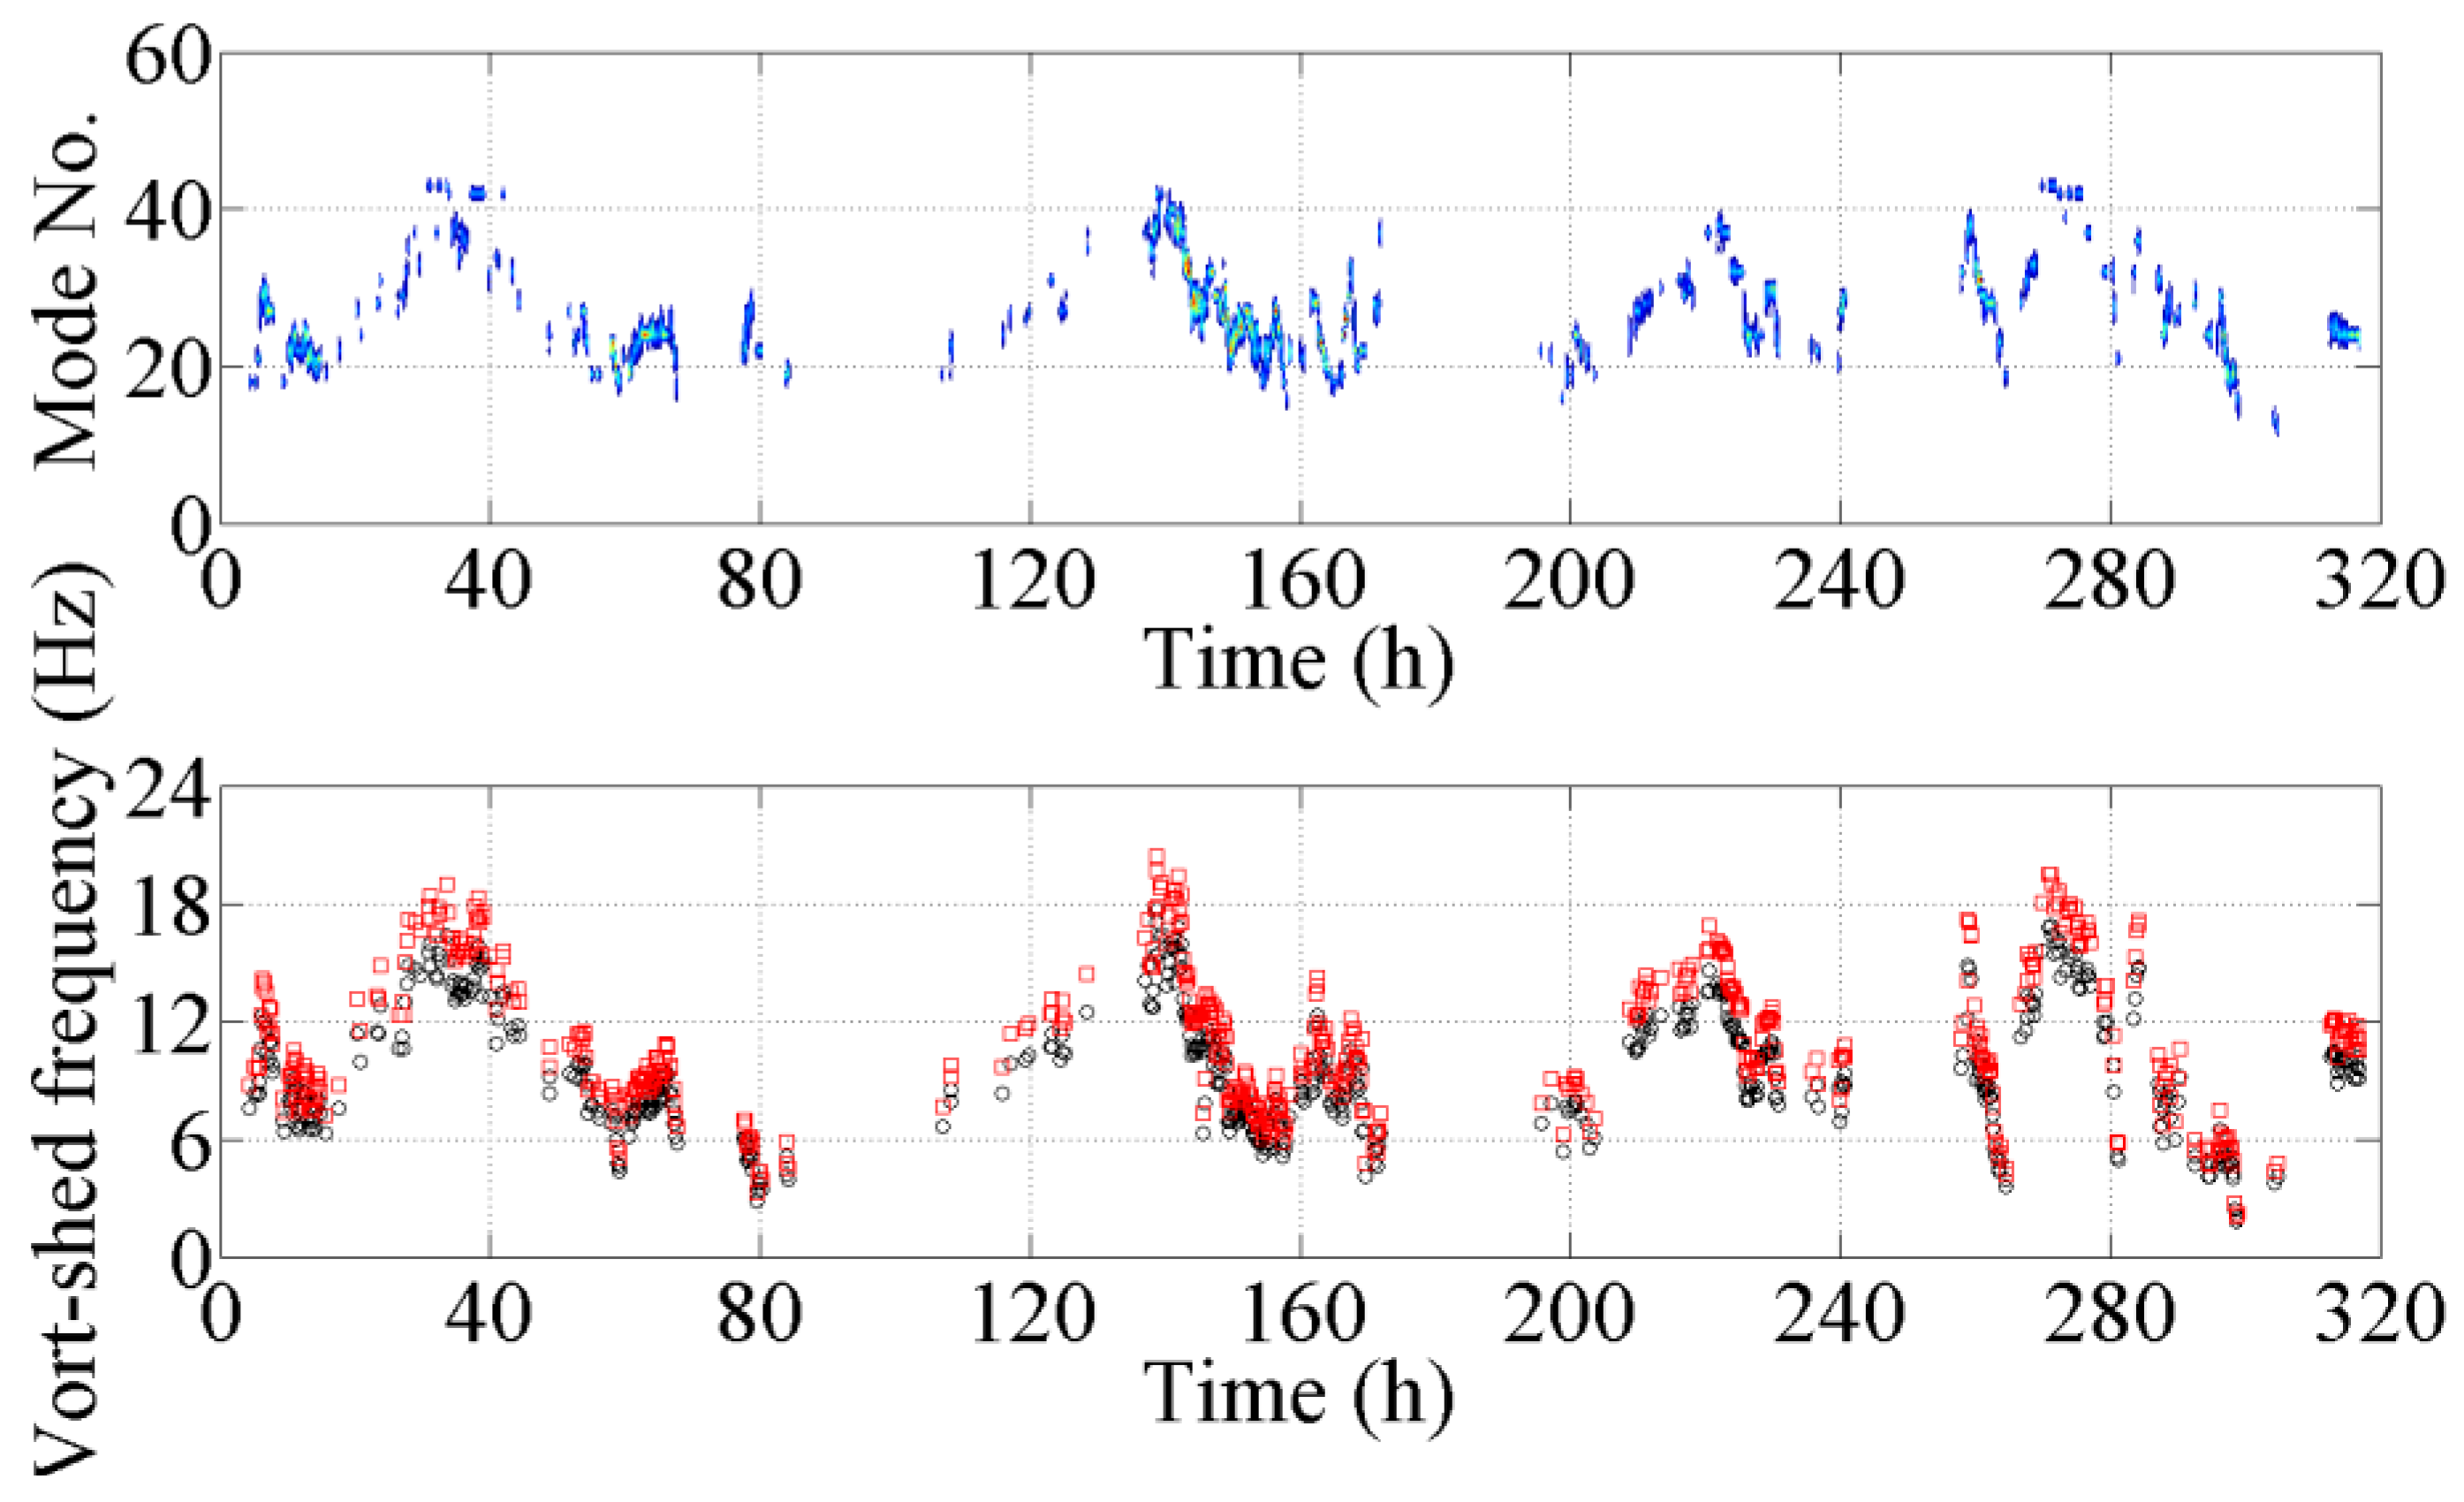
According the present estimation method for the participative modes, the lower and upper ends of the velocities were first obtained according to Equation (2) and the lower sub-figure of Figure 16b. Then, the vortex-shedding-frequency range, [, ], was calculated by using Equation (6), as shown in Figure 17. Similar to the results in Figure 16, the vortex-shedding-frequency range changing with time has a similar trend to that of the measured vibration modes, varying with time.

Figure 17.
Change of measured vibration modes and estimated vortex-shedding-frequency range with time.
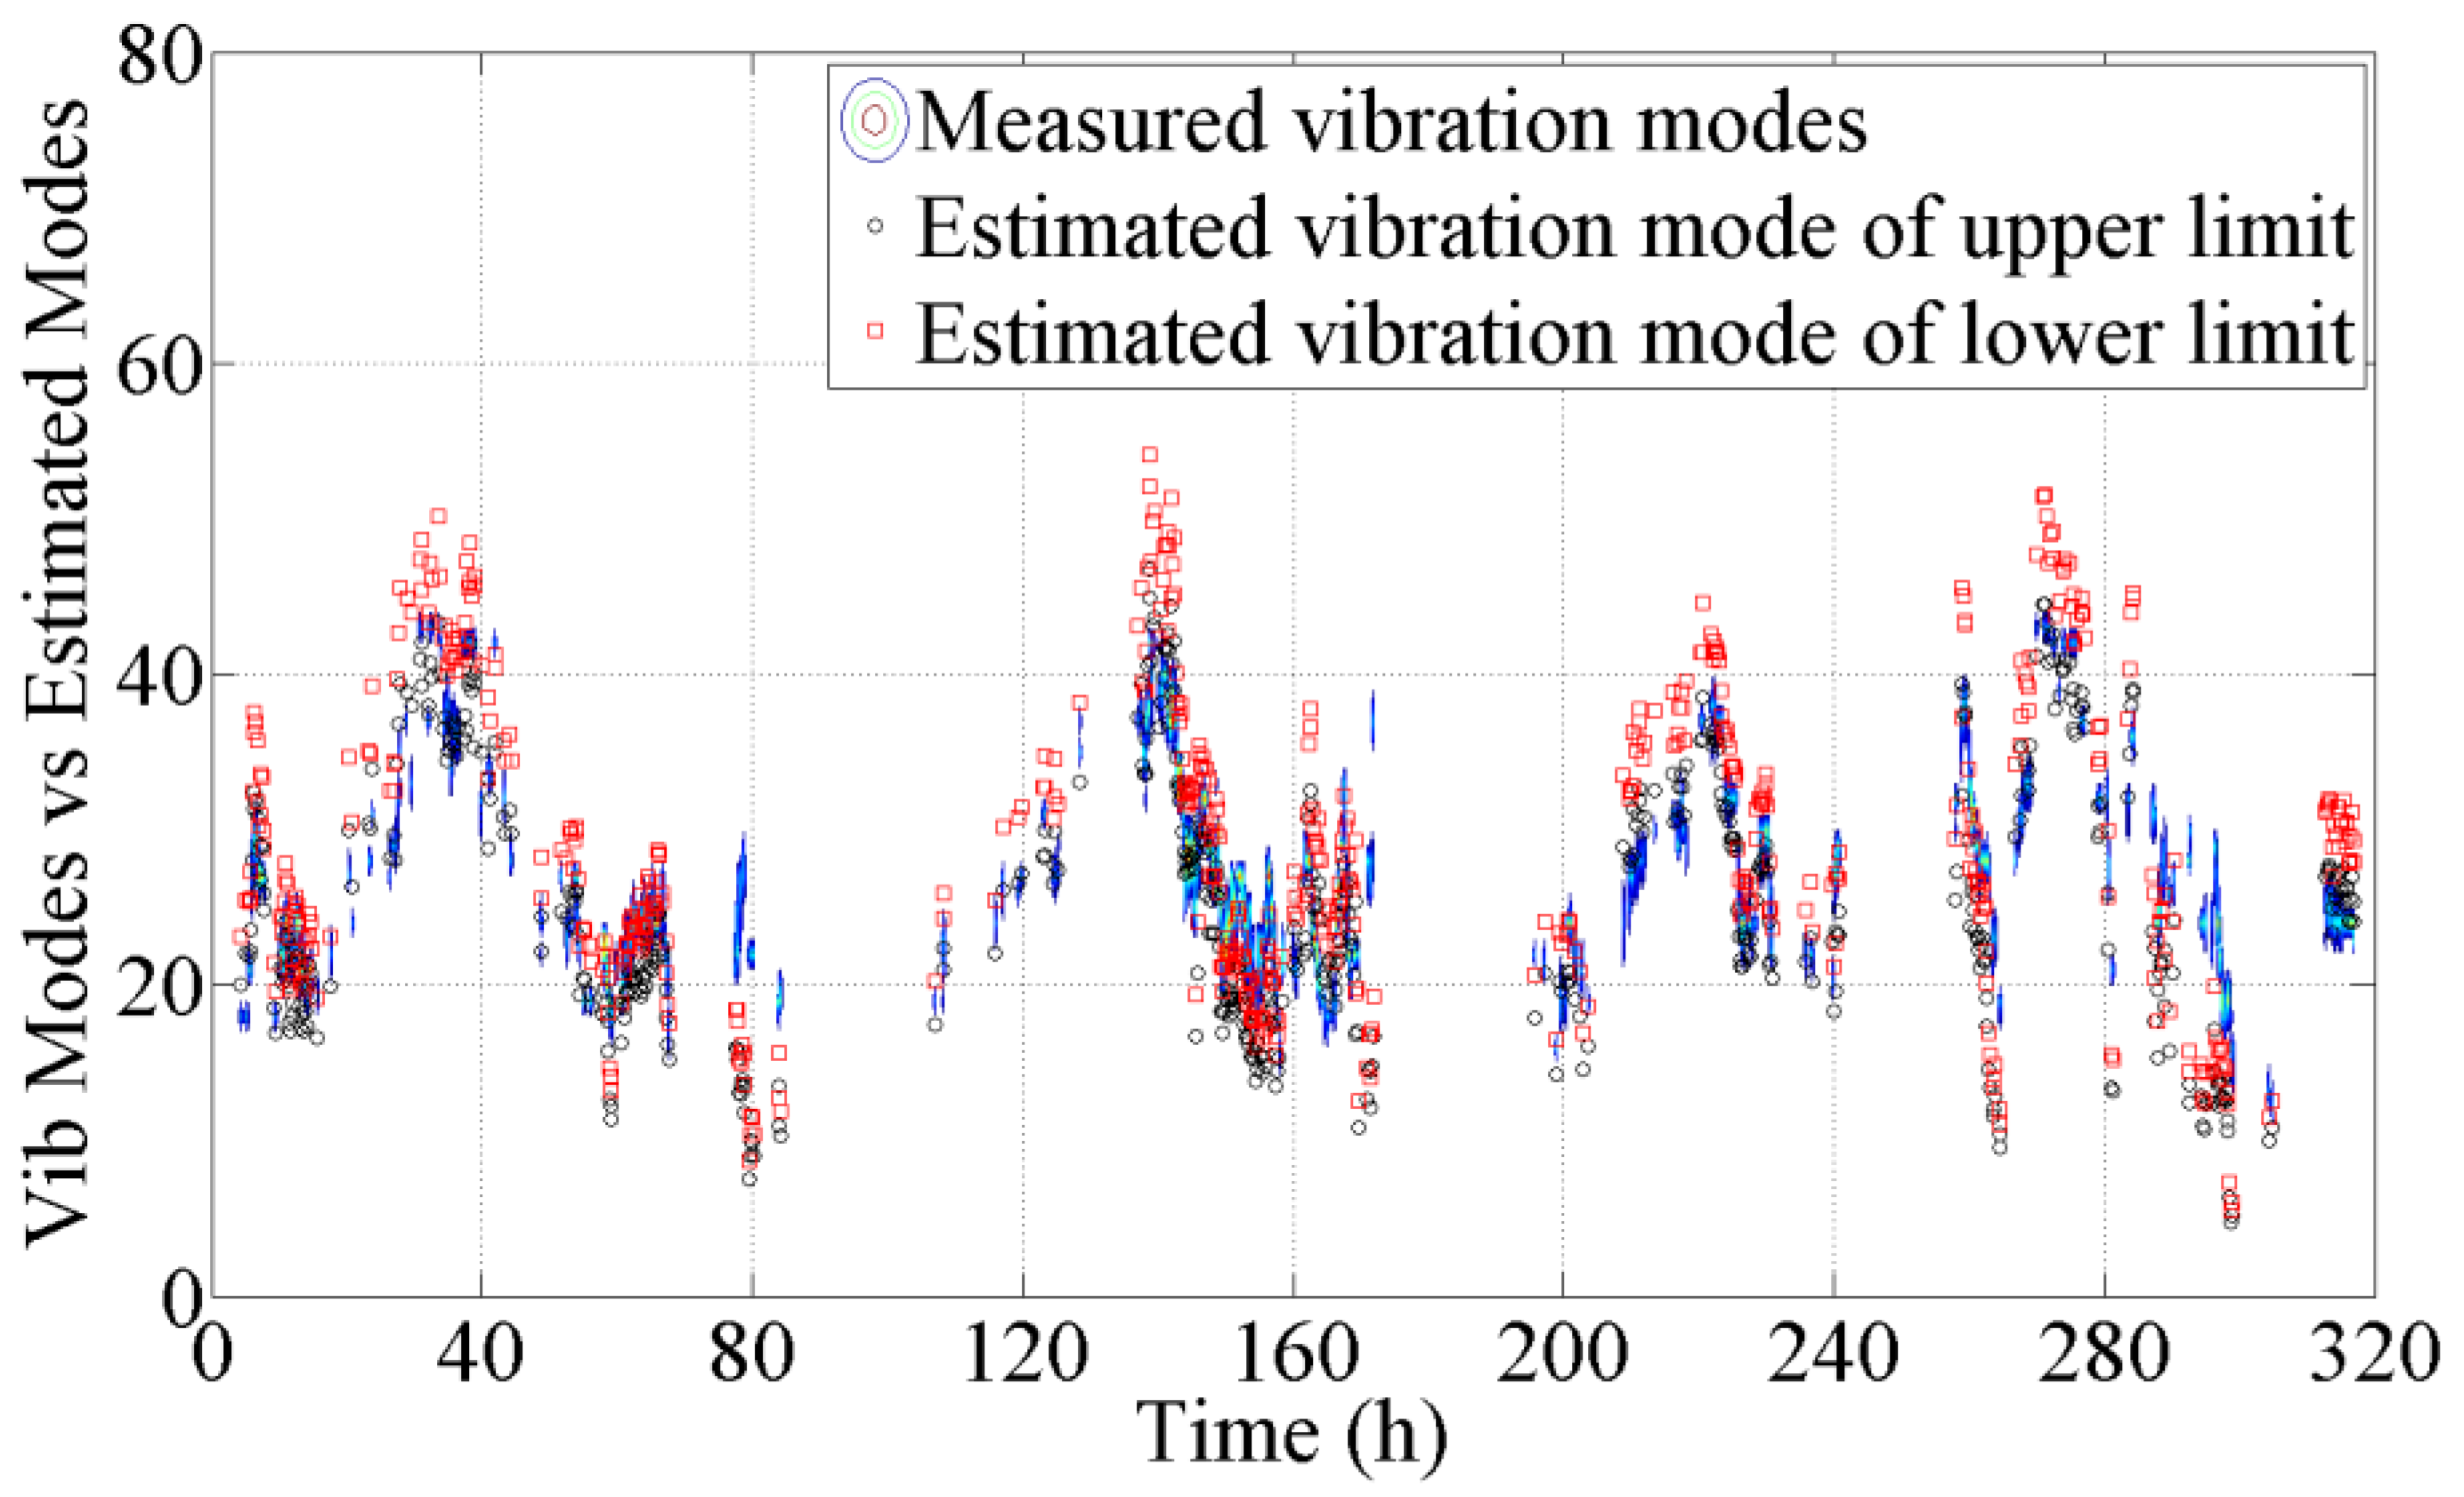
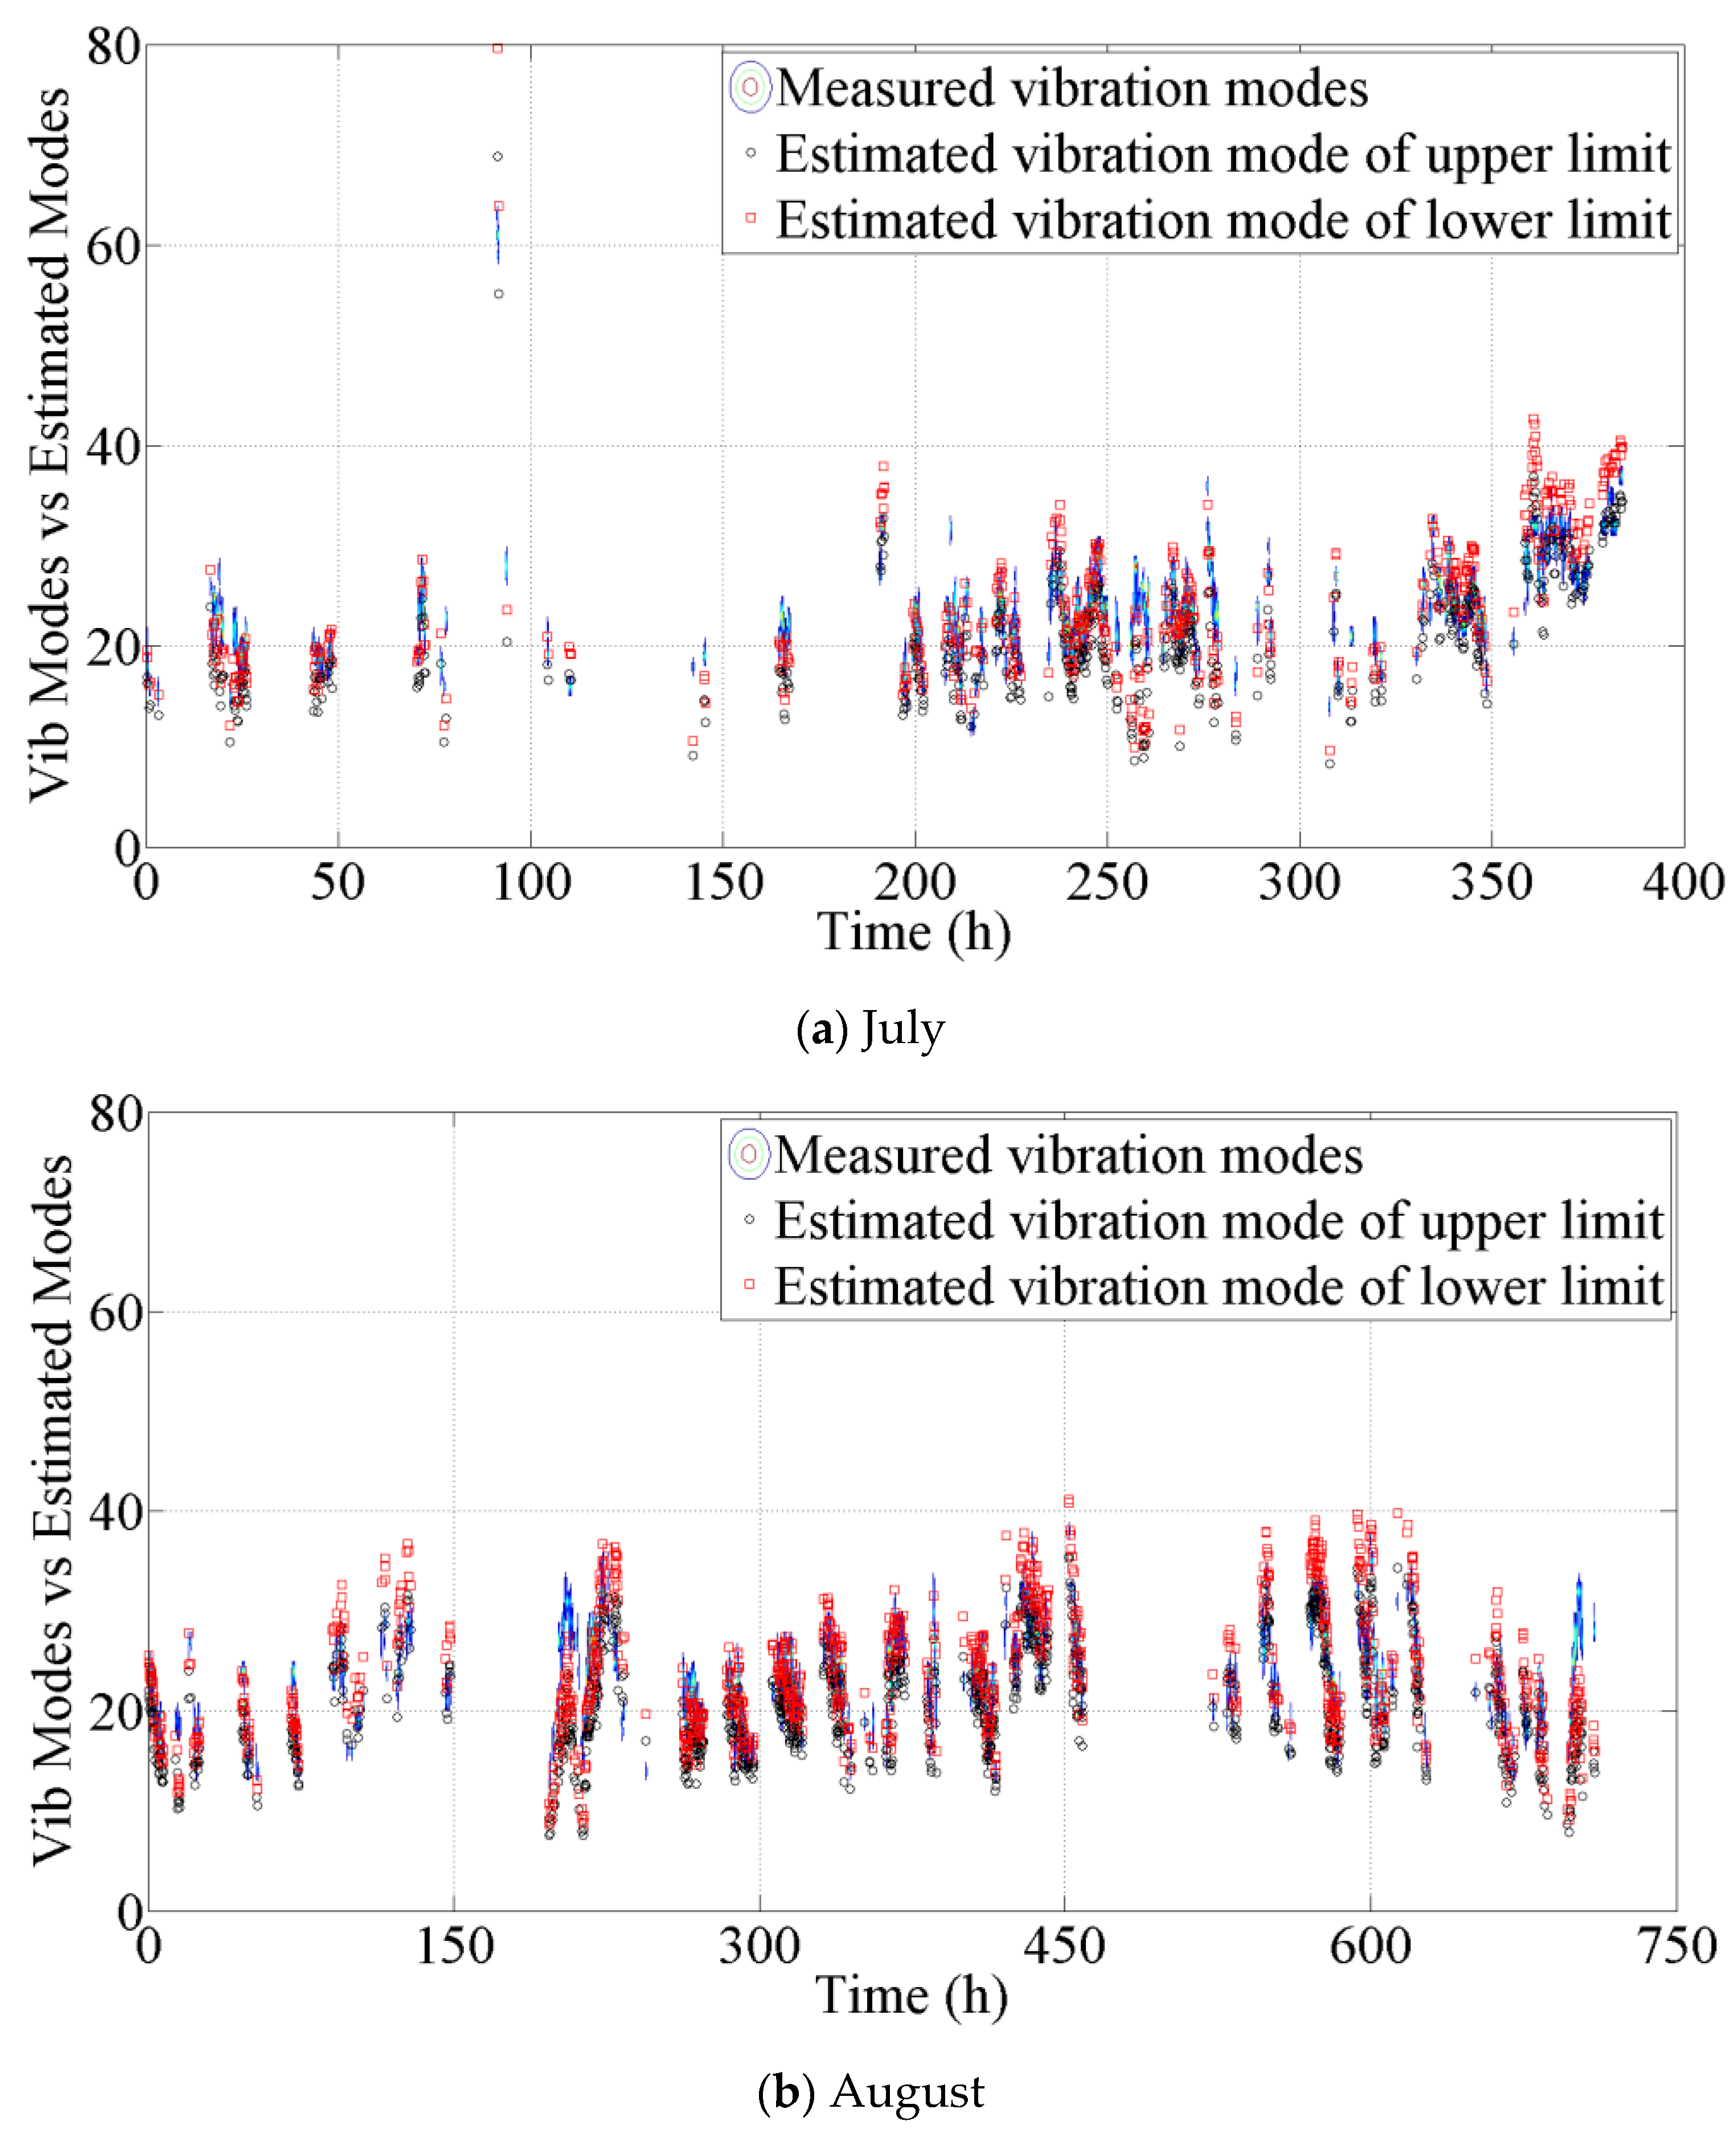
After they were combined with the fundamental natural frequency of the cable CAC20, the estimated participative vibration modes were then calculated and compared with the measured vibration modes in April, as shown in Figure 18. The results indicate that the estimated vibrations are close to the measured vibration modes. Simultaneously, the presented method was validated by the data in July and August, and the same conclusion can be obtained from the comparison shown in Figure 19. Therefore, the results finally denote that the monitoring vibration of the stay cable is a VIV. The validity and reliability of the present estimated method for the participative vibration modes of VIVs are also approved by the above results.
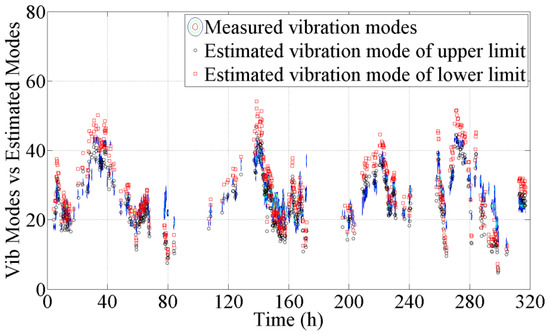
Figure 18.
Comparison of measured vibration modes and estimated vibration modes in April.
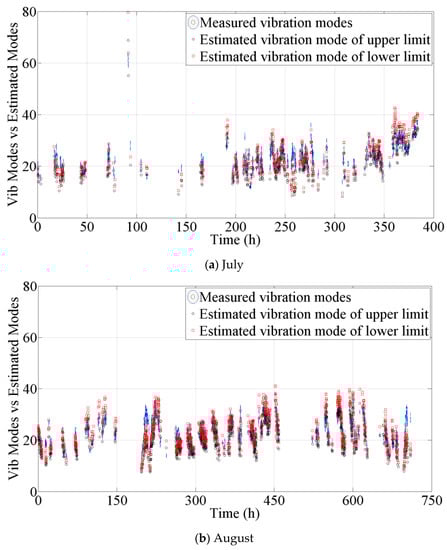
Figure 19.
Comparison of measured vibration modes and estimated vibration modes. (a) Measured vibration modes versus estimated results in July; (b) Measured vibration modes versus estimated results in August.
5. Conclusions
This paper reported a field study to monitor the vortex-induced vibrations (VIVs) of stay cables of a cable-stayed bridge. The characteristics of the wind and cable responses and their correlations were investigated and analyzed. An estimation method for predicting the vibration modes of VIVs was proposed and validated by the field-measured data. Based on the field-monitoring study, some conclusions can be drawn as follows.
The mean wind speeds on the investigated bridge are mostly less than 15 m/s for the investigated period. The mean wind speeds in the incoming flow and the wake flow, which are measured respectively on the upstream and downstream sides of the mid-span bridge section, are found close. In addition, there is a small phase difference for the wind direction, but a notable difference for the turbulence intensity between these two sites.
The VIVs of stay cables frequently occur at low wind speeds and are characterized as being of high-frequency and multimode when the wind is nearly perpendicular to the cable plane and has a low turbulence intensity. As for the multimode VIV, the larger vibration amplitudes are mainly located in the region next to the reduced velocity of five. The relationship between the maximum vibration amplitude and the mean wind speed could be expressed by a function that agrees with the measured data.
The estimation method for the participative vibration modes was presented and validated by the field-monitoring data. The results showed that the estimated vibration modes are consistent with the measured vibration modes.
Author Contributions
Conceptualization, W.-L.C. and H.L.; methodology, W.-L.C., H.L. and D.G.; investigation, D.G. and S.L.; writing—original draft preparation, W.-L.C. and D.G.; writing—review and editing, W.-L.C. and D.G.; supervision, W.-L.C. and H.L.; project administration, W.-L.C. and H.L.
Funding
This research received no external funding.
Acknowledgments
This research was funded by the National Natural Science Foundation of China (51578188 and 51722805) and the Fundamental Research Funds for the Central Universities (HIT.BRETIV 201803).
Conflicts of Interest
The authors declare no conflicts of interest.
References
- Main, J.A.; Jones, N.P. Full-scale measurements of stay cable vibration. In Proceedings of the 10th International Conference on Wind Engineering (10ICWE), Wind Engineering into the 21st Century, Copenhagen, Denmark, 21–26 June 1999; Volume 1–3, pp. 963–970. [Google Scholar]
- Matsumoto, M.; Shirato, H.; Yagi, T.; Goto, M.; Sakai, S.; Ohya, J. Field observation of the full-scale wind-induced cable vibration. J. Wind Eng. Ind. Aerodyn. 2003, 91, 13–26. [Google Scholar] [CrossRef]
- Chen, W.L.; Li, H.; Ou, J.P.; Li, F.C. Numerical simulation of vortex-induced vibrations of inclined cables under different wind profiles. ASCE J. Bridge Eng. 2013, 18, 42–53. [Google Scholar] [CrossRef]
- Chen, W.L.; Zhang, Q.Q.; Li, H.; Hu, H. An experimental investigation on vortex induced vibration of a flexible inclined cable under a shear flow. J. Fluids Struct. 2015, 54, 297–311. [Google Scholar] [CrossRef]
- Zuo, D.; Jones, N.P.; Main, J.A. Field observation of vortex- and rain-wind-induced stay-cable vibrations in a three-dimensional environment. J. Wind Eng. Ind. Aerodyn. 2008, 96, 1124–1133. [Google Scholar] [CrossRef]
- Zuo, D.; Jones, N.P. Interpretation of field observations of wind- and rain-wind-induced stay cable vibrations. J. Wind Eng. Ind. Aerodyn. 2010, 98, 73–87. [Google Scholar] [CrossRef]
- Trim, A.D.; Braaten, H.; Lie, H.; Tognarelli, M.A. Experimental investigation of vortex-induced vibration of long marine risers. J. Fluids Struct. 2005, 21, 335–361. [Google Scholar] [CrossRef]
- Lie, H.; Kaasen, K.E. Modal analysis of measurements from a large-scale VIV model test of a riser in linearly sheared flow. J. Fluids Struct. 2006, 22, 557–575. [Google Scholar]
- Lucor, D.; Mukundan, H.; Triantafyllou, M.S. Riser modal identification in CFD and full-scale experiments. J. Fluids Struct. 2006, 22, 905–917. [Google Scholar] [CrossRef]
- Marcollo, H.; Hinwood, J.B. On shear flow single mode lock-in with both cross-flow and in-line lock-in mechanisms. J. Fluids Struct. 2006, 22, 197–211. [Google Scholar] [CrossRef]
- Vandiver, J.K.; Jaiswal, V.; Jhingran, V. Insights on vortex-induced, traveling waves on long risers. J. Fluids Struct. 2009, 25, 641–653. [Google Scholar] [CrossRef]
- Bourguet, R.; Karniadakis, G.E.; Triantafyllou, M.S. Vortex-induced vibrations of a long flexible cylinder in shear flow. J. Fluid Mech. 2011, 667, 342–382. [Google Scholar] [CrossRef]
- Huera-Huarte, F.J. Multi-Mode Vortex-Induced Vibrations of a Flexible Circular Cylinder. Ph.D. Thesis, Imperial College London, London, UK, 2006. [Google Scholar]
- Huera-Huarte, F.J.; Bearman, P.W. Wake structures and vortex-induced vibrations of a long flexible cylinder—Part 1: Dynamic response. J. Fluids Struct. 2009, 25, 969–990. [Google Scholar] [CrossRef]
- Zhu, Y.; Jiang, W.; Kong, X.; Zheng, Z.; Hu, H. An Accurate Integral Method for Vibration Signal Based on Feature Information Extraction. Shock Vib. 2015, 2015, 962793. [Google Scholar] [CrossRef]
- GB 50009-2001. Load Code for the Design of Building Structures; National Standard of the People’s Republic of China: Beijing, China, 2002. (In Chinese)
- Norberg, C. Fluctuating lift on a circular cylinder: Review and new measurements. J. Fluids Struct. 2003, 17, 57–96. [Google Scholar] [CrossRef]


© 2019 by the authors. Licensee MDPI, Basel, Switzerland. This article is an open access article distributed under the terms and conditions of the Creative Commons Attribution (CC BY) license (http://creativecommons.org/licenses/by/4.0/).