Article

The New Empirical Equation Describing Damping Phenomenon in Dynamically Loaded Subgrade Cohesive Soils

1
Department of Geotechnical Engineering, Institute of Civil Engineering, Warsaw University of Life Sciences, 02-787 Warsaw, Poland
2
Water Centre, Warsaw University of Life Sciences, 02-787 Warsaw, Poland
*
Author to whom correspondence should be addressed.
Appl. Sci. 2019, 9(21), 4518; https://doi.org/10.3390/app9214518
Submission received: 17 September 2019 / Revised: 16 October 2019 / Accepted: 22 October 2019 / Published: 24 October 2019
(This article belongs to the Section Civil Engineering)

Abstract

:

Featured Application

The damping ratio is one of the key soil parameters in geotechnical issues in which the soil is subjected to dynamic loads. Thanks to the provided empirical equation, it can be estimated based on the basic physical properties of the cohesive soil.

Abstract

The damping ratio (D) is one of the key soil parameters in geotechnical issues where the soil is subjected to dynamic loads, like machines foundation, city tram and subway traffic, and driving of sheet pile or precast pile. Each of the abovementioned geotechnical problems is connected with significant damping, so its effect should be included in the dynamical analysis. Therefore, this article focuses on the damping phenomenon in cohesive soils from the capital of Poland, which is described by damping ratio (D). In this research, a set of the damping tests by free vibration method in resonant column device were conducted, and the influence of four selected factors, i.e., shear strain (γ), effective stress (p’), plasticity index (PI), and void ratio (e) on damping ratio in wide strain range was investigated and discussed. Based on the laboratory tests, the shear strain has the most impacts on the damping ratio characteristics; the plasticity index and the effective stress also have a significant influence. Based on the performed analysis, the authors propose the empirical equations with two sets of variables, the first for low and medium cohesive soil (PI < 20%) and the second for very cohesive soils (PI > 20%).

1. Introduction

The shear modulus G and the damping ratio D are the key soil parameters in geotechnical issues in which the soil is subjected to dynamic loads, for example, machines foundation [1], city tram and subway traffic, driving of sheet pile or precast pile, or mechanical soil compaction at the bottom of the excavation. These two mentioned parameters are also used in the soil-structure interaction when a large area of soil is employed to interaction with construction [2], e.g., in diaphragm walls’ construction, tunnel housing, or subway stations. Each one of the abovementioned geotechnical problems should be solved based on geotechnical parameters obtained in small [3] and medium strain range, in which soil behaves like an elastic and elastic-plastic medium. Reliable evaluation of the stress–strain response of the soil, leading to a correct prediction of ground and structure deformations under static and dynamic loading and is directly dependent on the accurate assessment of the dynamic properties [4].
However, when energy dissipation is small, undamped analysis can be employed. Nevertheless, every abovementioned geotechnical problem is connected with significant damping, so its effect should be included in the dynamical analysis [5]. Damping is used to describe the ability of subsoil or structures to dissipate energy during dynamic loading [6]. However, the damping process relates to several possible processes, not to a unique process, so it is challenging to model it properly. The value of damping depends on many factors, like vibration amplitude, material properties, structural configurations, fundamental periods of vibration, mode shape, etc. [7]. In engineering practices, several types of damping are used, i.e., hysteretic damping [8], viscous damping, damping caused by wave scattering, radiation damping, numerical damping, and damping as an alternative [9]. From the geotechnical point of view, the most important are hysteretic and viscous damping. There are two types of viscous damping: external damping and internal damping. External damping is caused by the interaction between the considered body and outside of the system. Internal damping is caused by the difference of the internal velocity between moving particles [9].
This paper focuses on the internal viscous damping ratio (D) of Quaternary cohesive soils from Warsaw and factors determining this parameter in studied material. It presents a literature review of the most important factors affecting the damping ratio. Moreover, the authors discuss the influence of identified factors on their results. For the damping ratio of cohesive soil in small and medium shear strain range obtained from resonant column tests, the authors created the new empirical model. A comparison with other models from the literature is also included in the paper. Conclusions from conducted research are drawn at the end of this work.

2. Literature Revive

2.1. Identification of Factors Affecting Damping Ratio

For the correct creation of the damping model, parameters affecting this soil property have to be designated. In factors determining the dynamic properties of soil, we can distinguish two main groups. The first is connected with loading condition, for example, effective stress, strain amplitude, strain frequency (strain speed), numbers of loading cycles, or stress history (OCR). The second group concerns physical soil parameters, like soil type, size, and shape of grains or void ratio [10]. Over the years, a lot of research was conducted to find the most important factors [11,12,13,14].
In Table 1, the influence of different parameters on the damping ratios of cohesive soil is summarized. According to [12], the most important factors are strain amplitude, effective stress, void ratio, and numbers of loading cycles. Based on [12], one of the first equations for the damping ratio of saturated cohesive soil was presented in [15]:
D = DMAX(1 − G/GMAX)
DMAX = 31 − (3 + 0.03f)σ01/2 + 1.5f1/2 − 1.5(logN)
where: f—frequency of loading, σ0—effective stress, N—number of loading cycle, and G/GMAX—normalized shear modulus.
Further research marginalized the impact of void ratio but showed much more influence of soil type and plasticity on the damping ratio [13,14]. However, an investigation conducted by [13] shows that the damping ratio could stay constant with increasing confining pressure. Moreover, they indicated that damping decreased with the increasing void ratio, which proved to have much influence on damping characteristics. A number of loading cycles were another difference between [13] and [12,14]. In [13], N had no significant effect on damping for moderate numbers; however, [12,14] presented the number of loading cycles as a very important factor for the mentioned dynamic parameter. Each of the referenced publications [12,13,14] showed small or no influence OCR on D.

2.2. Shear Strain

As shown in Table 1, shear strain is the most important parameter effecting the damping ratio, according to the presented references [11,12,13,14]. This issue is connected with the so-called threshold strains. In soil dynamics, we can specify three soil reaction zones for loading. Each zone is separated from each other by threshold strains. The first zone, small strain, is characterized by the linear elastic response. In this strain range, the damping ratio has minimum constant values (DMIN), in contrast to the shear modulus, which takes maximum values (GMAX). The strain amplitude at which shear modulus decreases to 98% of its maximum value and D/DMIN = 1.02 is called the nonlinearity threshold strain ( γ t e ) [16,17]. Above γ t e , soil behaves nonlinearly but is still elastic. It means that the stress–strain characteristic is curved. However, deformations are recoverable upon unloading [14]. In this zone, increases of damping ratio D and decreases of shear modulus G are observed. The degradation threshold strain γ t c [16,17] is reached when shear modulus decreased to about 80% of the GMAX, and the damping ratio was about 3% higher than the DMIN [18]. After crossing γ t c deformation becomes irrecoverable.
It is common practice to replace strain amplitude by normalized shear modulus in equations for damping ratio (Equation (1)) because G/GMAX values refer to different soil reaction zones: 1–0.98 linear elastic, 0.98–0.80 nonlinear elastic, <0.8 plastic. Furthermore, it is easier to use from an engineering point of view. In Figure 1, the definition of threshold strains based on D-DMIN and normalized D/DMIN curves is presented.

2.3. Effective Stress

Effective stress is, next to shear strain, the most important factor affecting the dynamic parameters of the soil. It influences dynamic soil responses in linear elastic, nonlinear elastic, and plastic ranges of strain. Research on this topic has been conducted since the 1960s until now [11,19,20,21,22,23,24].
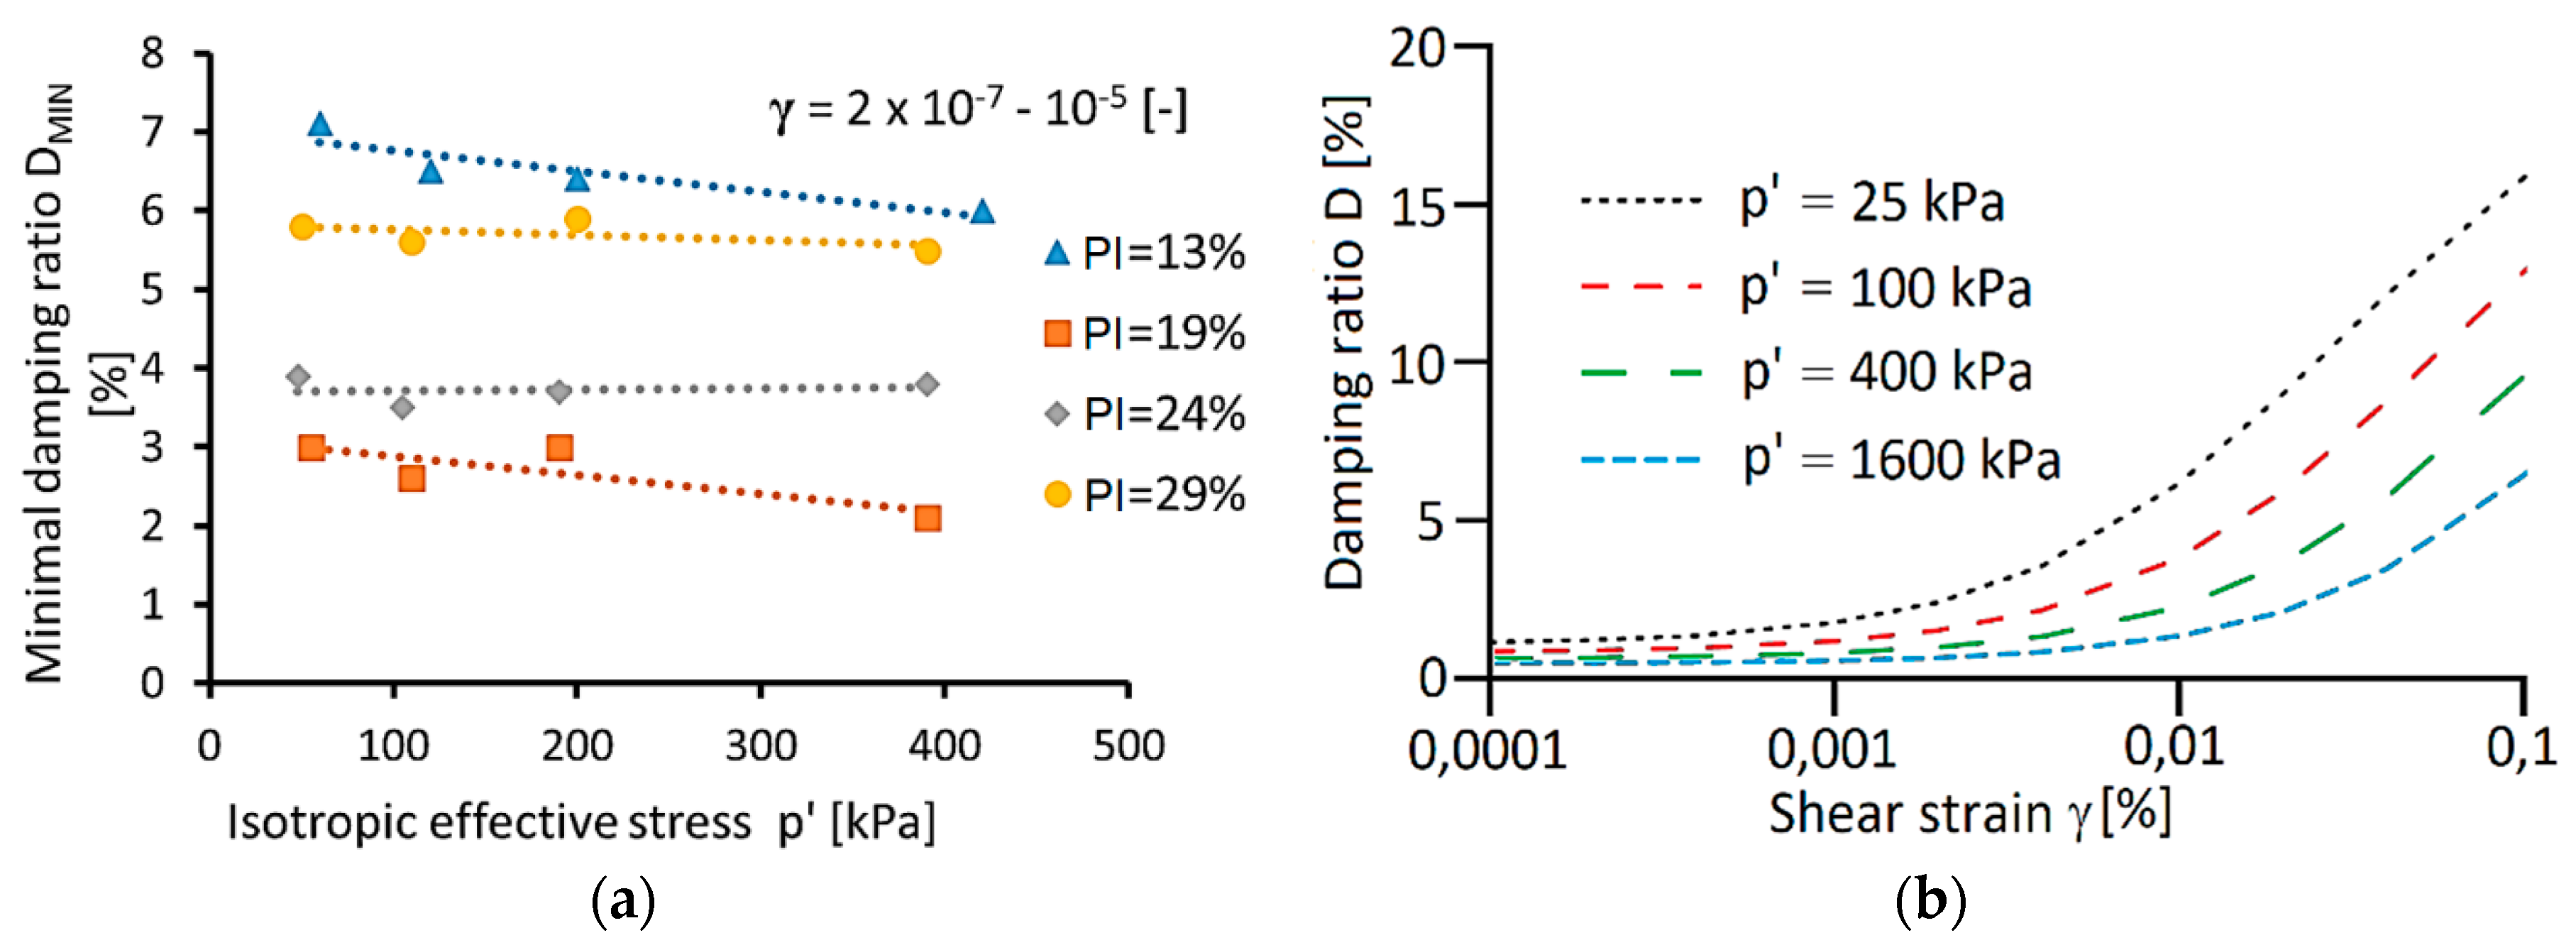
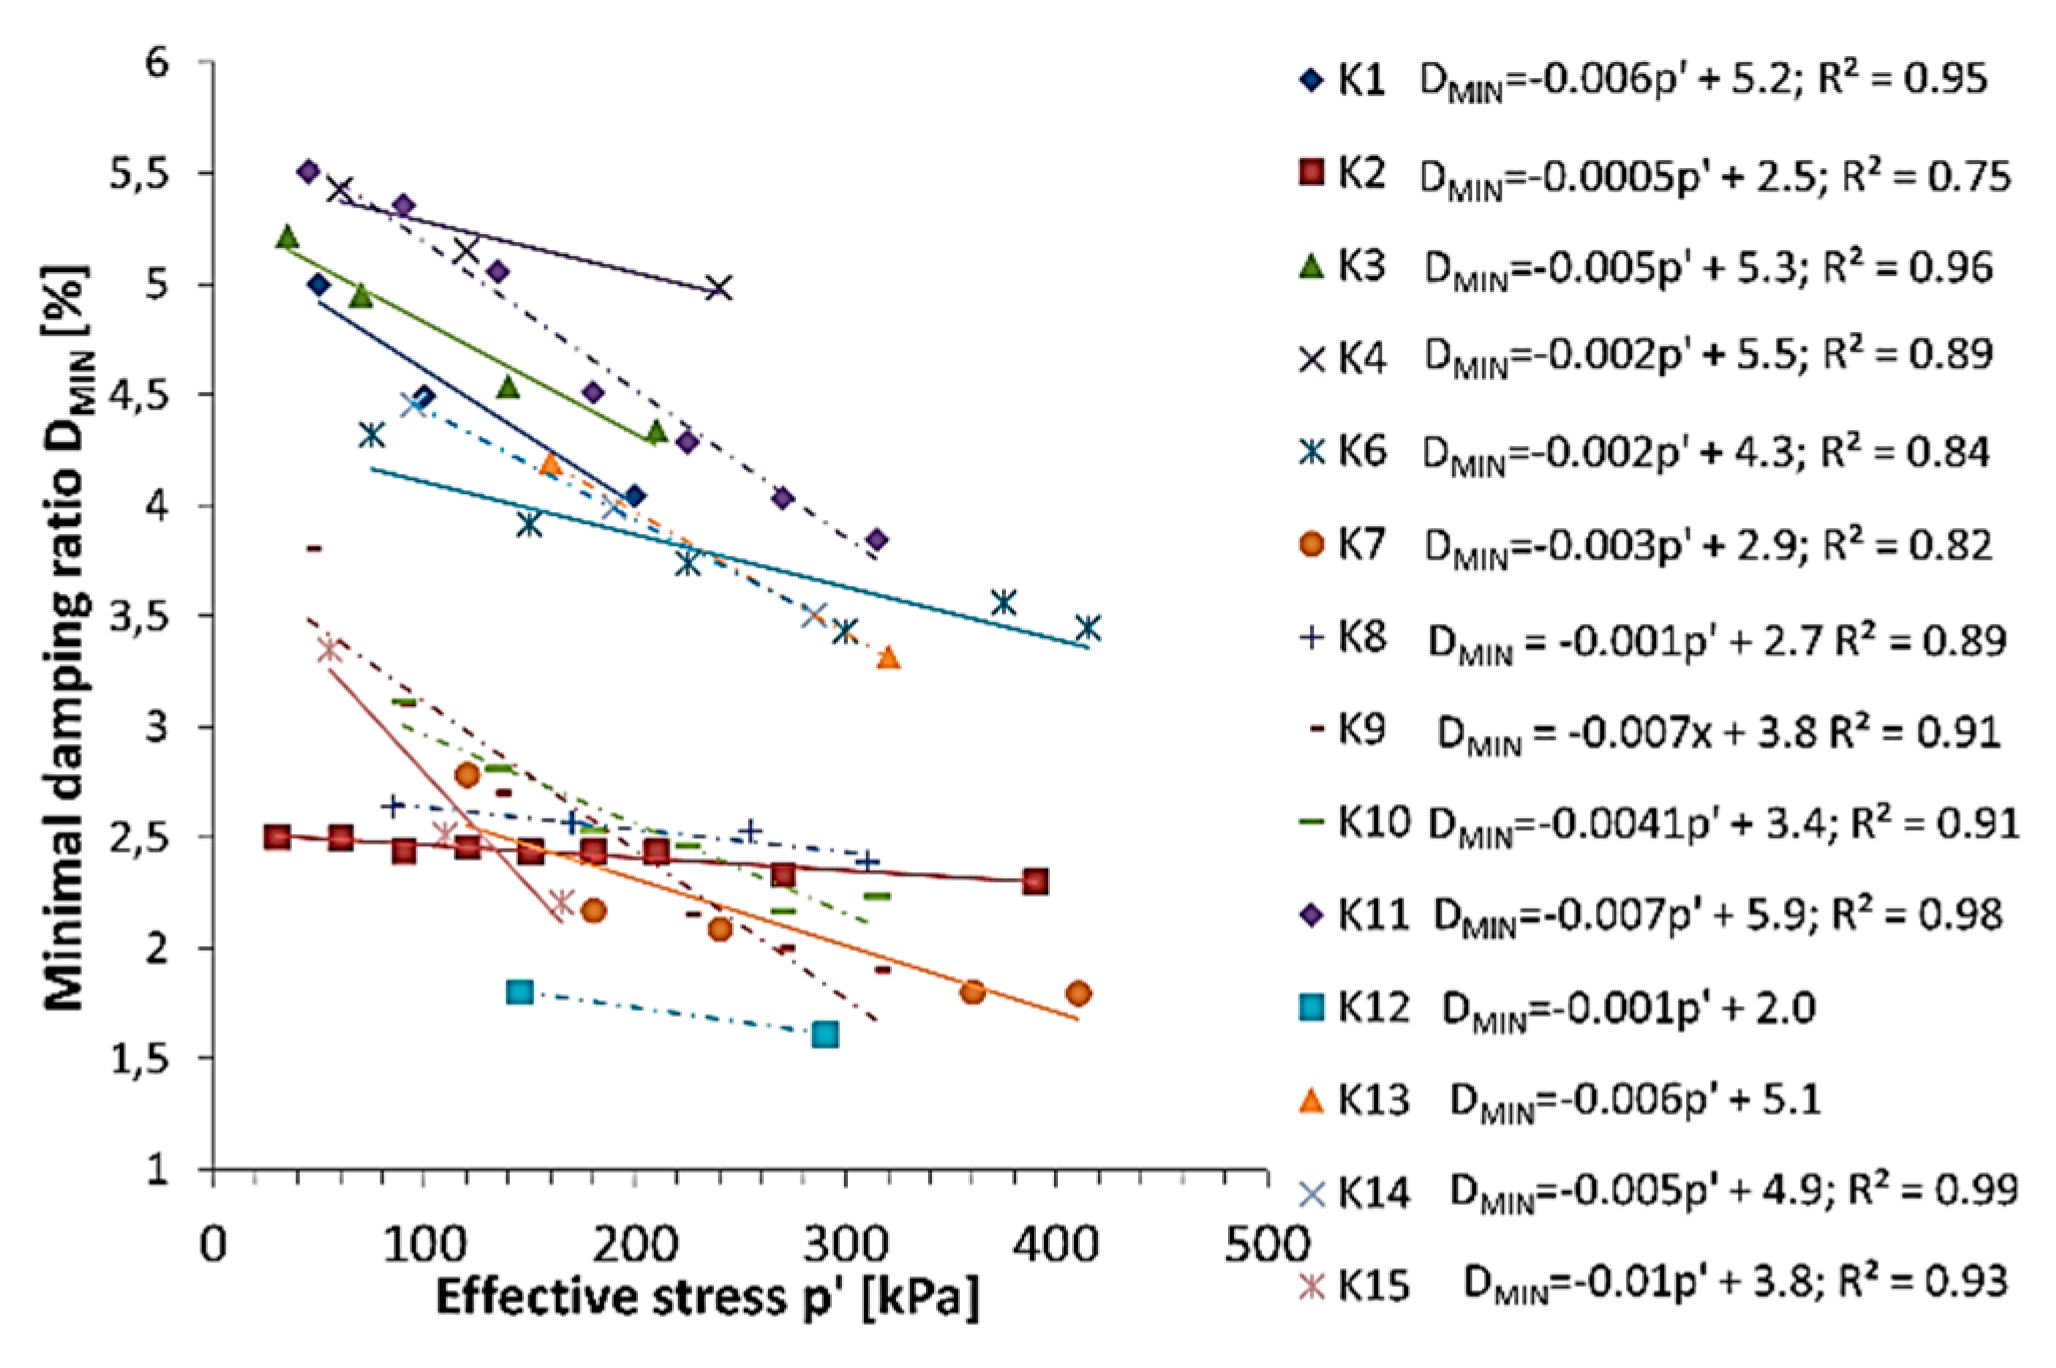
Typical minimal damping ratio behavior depended on effective stress is presented in Figure 2a [25], i.e., DMIN values decrease linearly with the increase of effective stress [22]. However, the DMIN decrease is not as significant as the GMAX increase with effective stress. Thus, the conclusion is that effective stress has a greater effect on the maximum shear modulus than on the minimal damping ratio [26].
Increasing the effective stress has a substantial impact on the damping ratio curves, as well. In Figure 2b, the influence of the confining pressure on the damping ratio curves is illustrated; it becomes increasingly linear as the confining pressure increases. Therefore, the nonlinearity threshold strain ( γ t e ) and degradation threshold strain γ t c move to the right on the x axis, to the larger shear strains, increasing, at the same time, the nonlinear elastic zone of response of the soil [27].

2.4. Soil Type—Plasticity Index (PI)

Soils are classified as cohesionless if the amount of sand and gravel exceeds 50% by weight or cohesive if the amount of silt- and clay-sized mineral exceeds 50% [28]. The engineering properties of granular soil are often established by applying confining pressure and looseness or denseness, as indicated by relation of the current void ratio to the lowest and highest value of this parameter [28]. The basic mechanical parameter of granular soil is the internal friction angle φ. The engineering properties of cohesive soil are characterized by stiffness and strength and by relating the current water content and past consolidation history to the compositional characterization provided by the plasticity index (PI) [28]. Thanks to the amount of silt- and clay-sized minerals (which correlates with PI), cohesive soil, besides internal friction angle φ, has another basic mechanical parameter, which is cohesion c.
PI is one of the most important physical parameters of cohesive soil, which distinguishes it from granular soils. Plasticity index affects both mechanical and dynamical parameters. PI has such influence on damping characteristic that, as the PI increases, the influence of the effective pressure on the damping ratio decreases. In soil with PI > 30%, effective stress influence on the discussed parameter can be omitted [9].
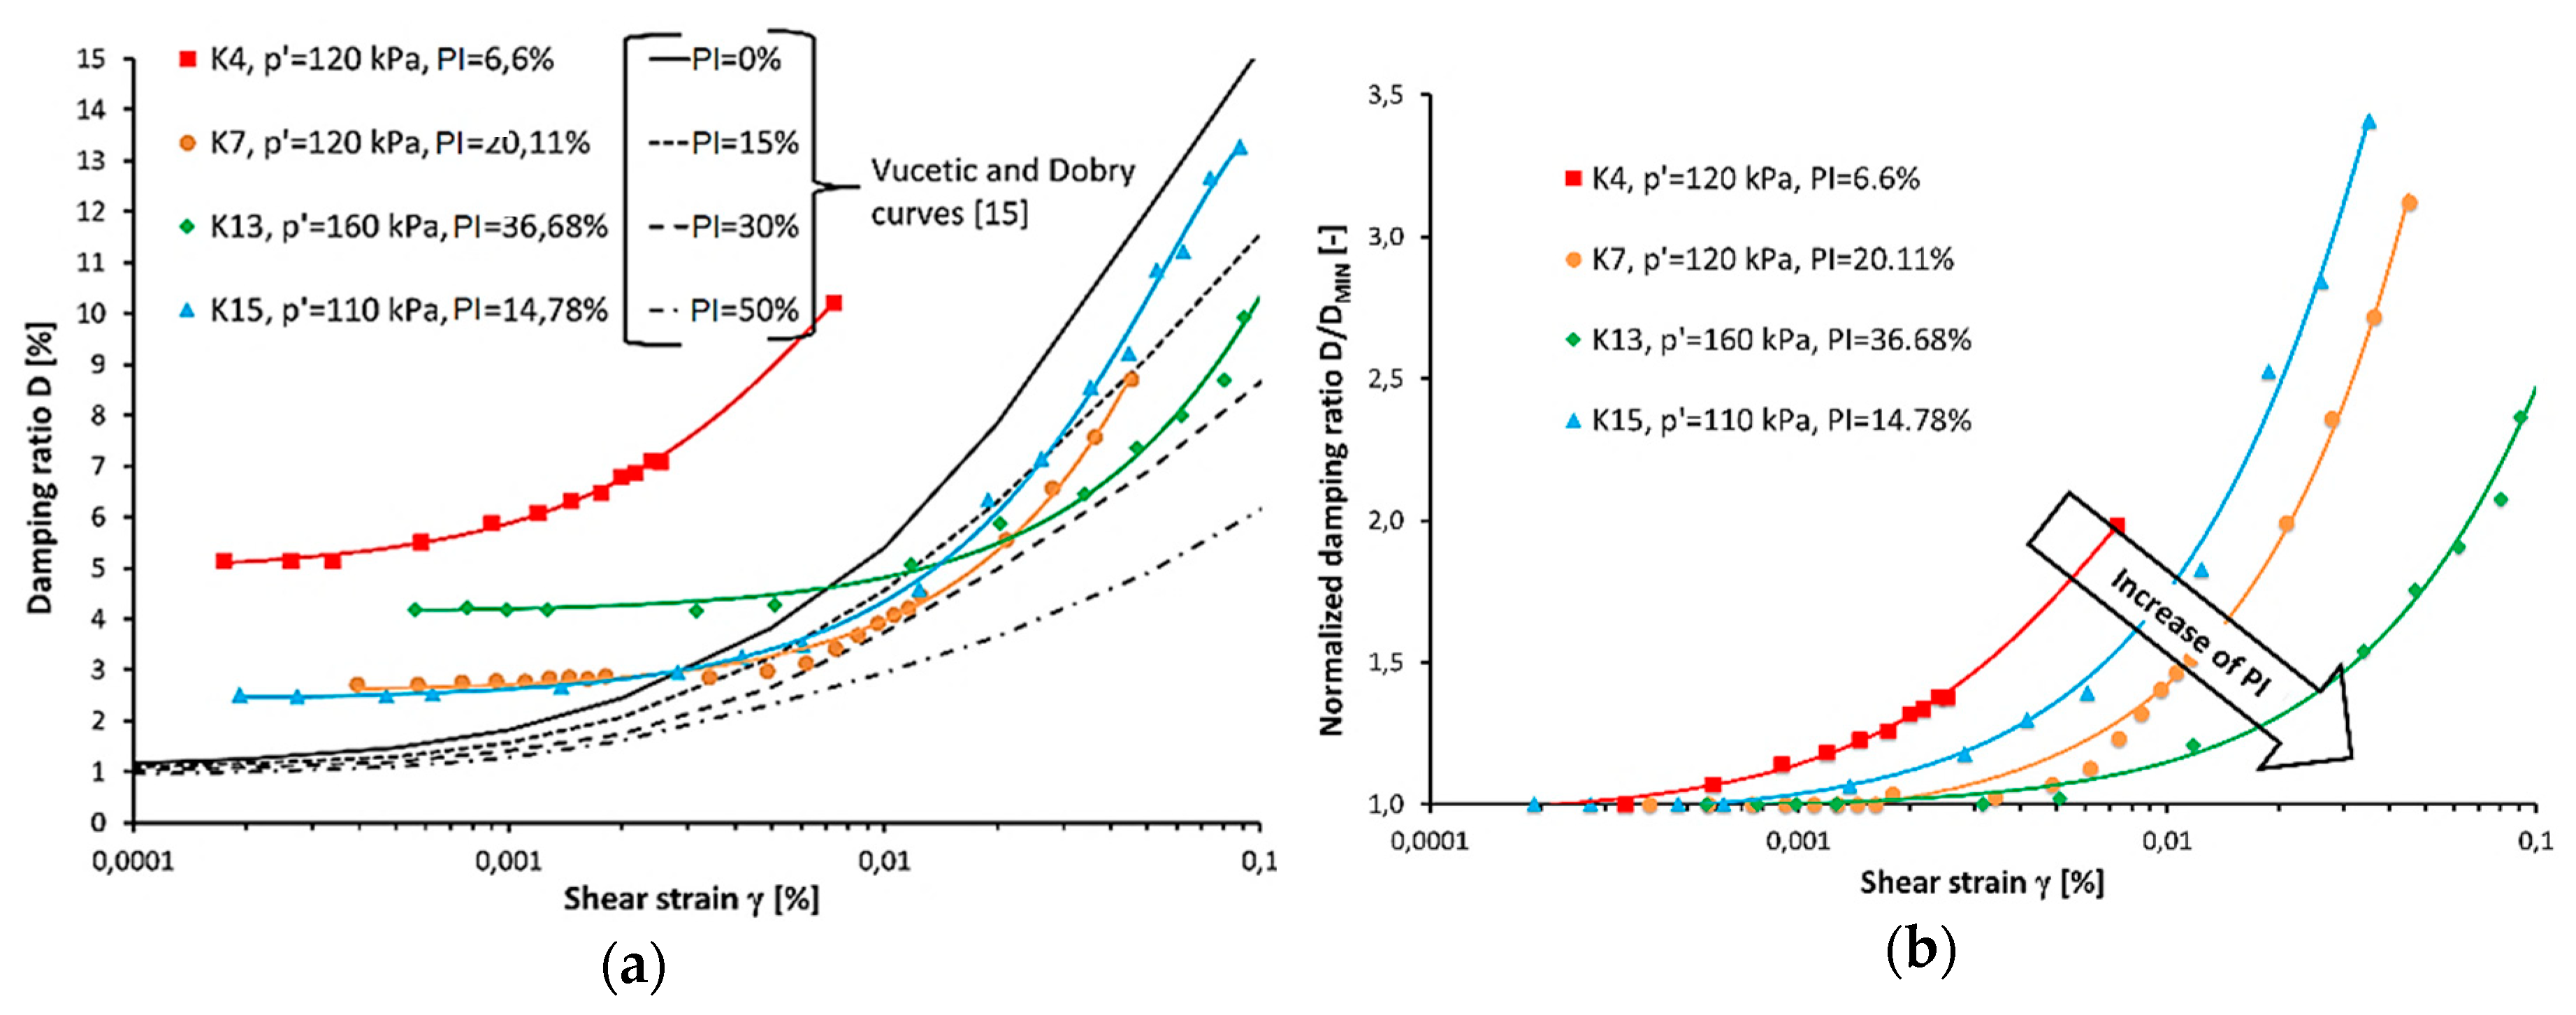
Damping ratio curves against shear strain for soils with different plasticity index are presented in Figure 3a [16,29]. It can be seen that damping ratio values decrease with PI increases. The curve for PI = 0 indicates noncohesive soil. Generally, sandy soils have a higher value of damping ratio than cohesive soil. Moreover, with increases in the plasticity index, the range of linear response of soil for loading is increased [30]. The same phenomenon can be observed for nonlinear elastic zone [30], as presented in Figure 3b. Furthermore, in Figure 3a, no influence of the overconsolidation ratio (OCR) on the damping ratio curves is confirmed.

2.5. Void Ratio (e)

As presented in Table 1, the influence of the void ratio on the damping ratio is not straightforward based on the literature review. In [14], Darendeli displayed a total lack of impact of e on the damping ratio D. Moreover, [31,32] confirmed that the void ratio had not affected both the minimal damping ratio and the damping ratio curve. However, Kim and Novak in [20] presented utterly different results. They investigated soils with void ratios from 0.4 to about 1.2. Their research indicated that the damping ratio decreases with the increase of the void ratio from 0.4 to about 0.65. That confirms the conclusion presented in Table 1 [13]. Nevertheless, a further increase in the void ratio leads to the opposite behavior of the damping ratio. That phenomenon was confirmed in [22]. The rise of the damping ratio with a void ratio above 0.65 is connected with soil structure, which is much more sensitive for strain and frequency range of loading, which leads to increased intermolecular interaction, and thus increased energy dissipation, hence the increases of the damping ratio value [22]. Therefore, the influence of the void ratio on the damping properties of cohesive soil is still not clarified.

3. Materials and Methods

3.1. Soils’ Properties and Sample Preparation

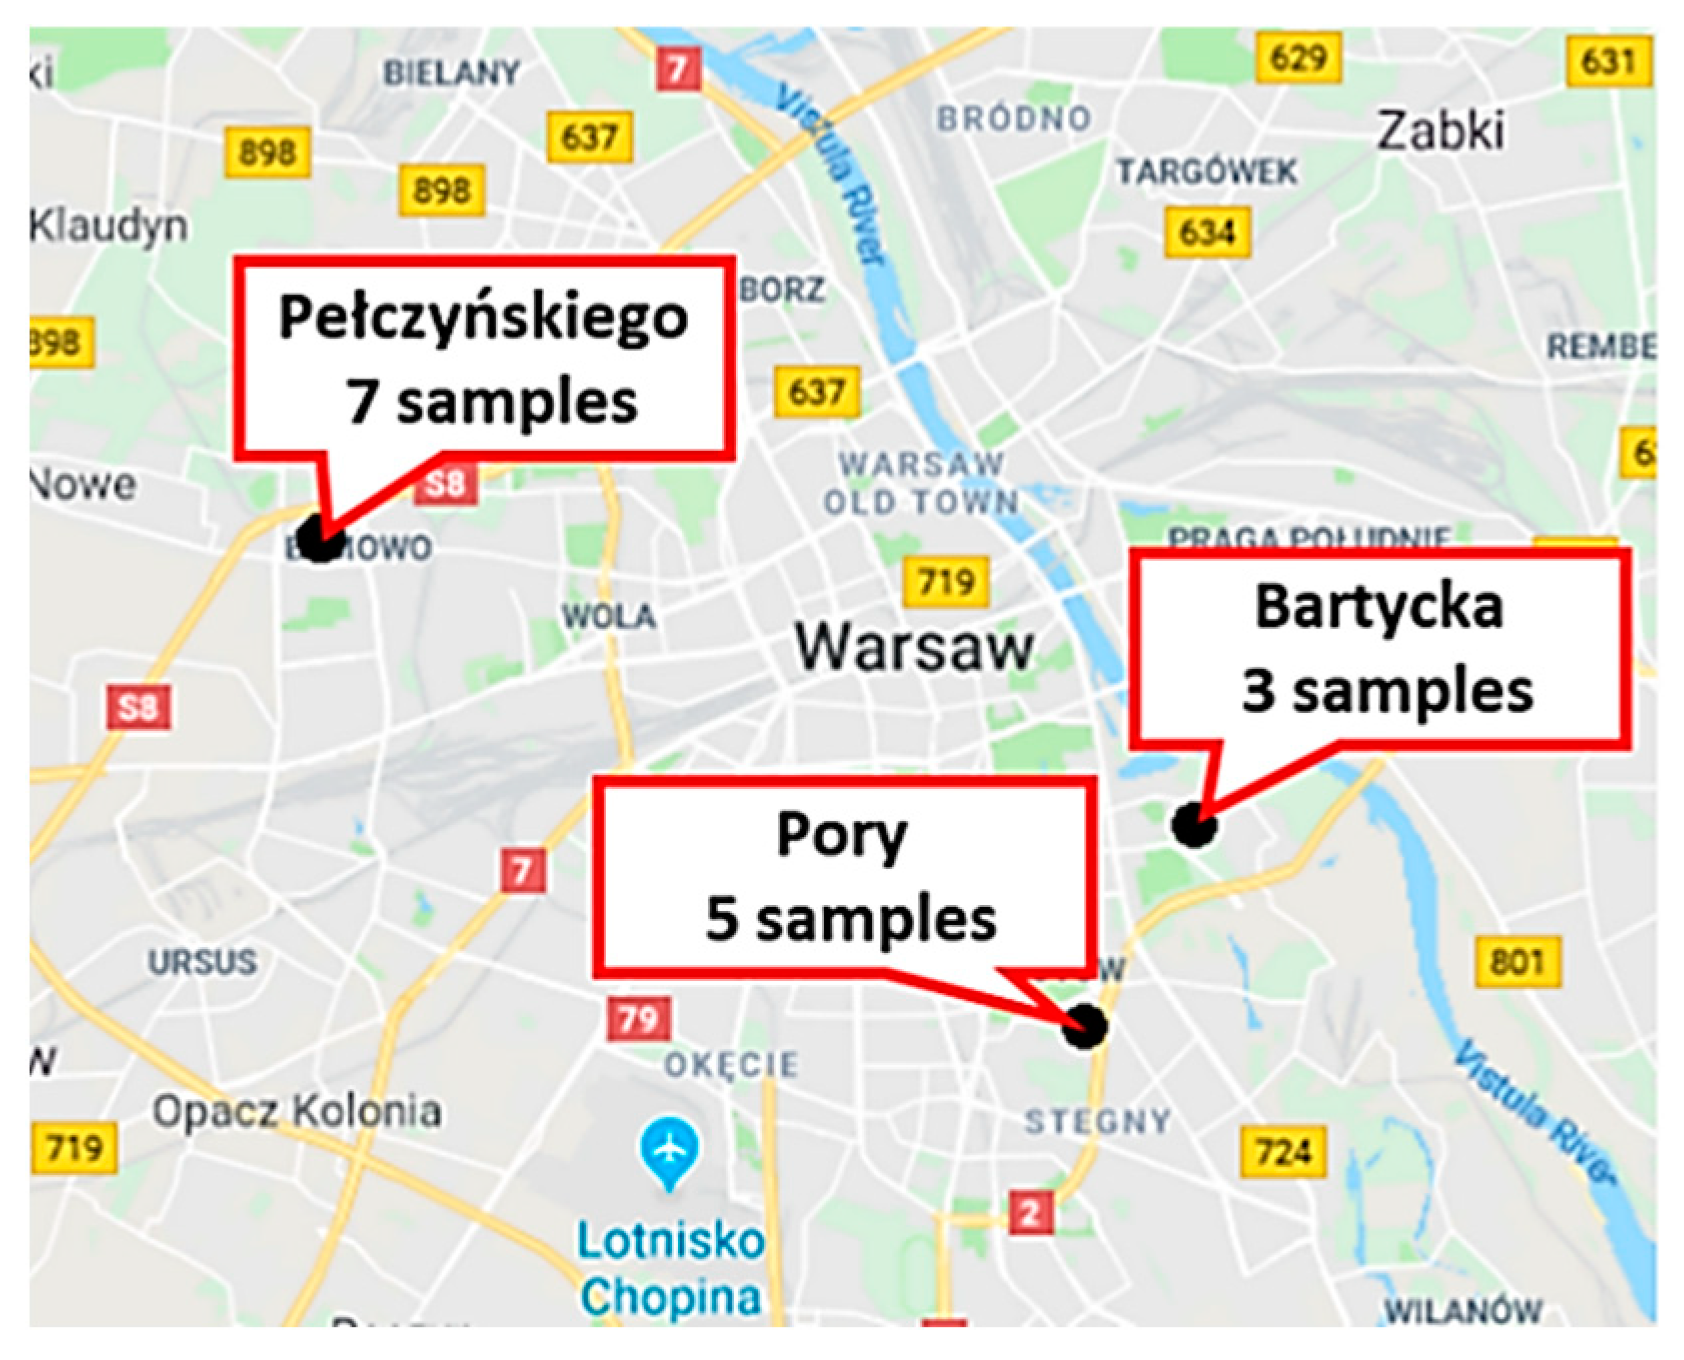
Soils for this research were collected from three test sites, i.e., Pełczyńskiego, Bartycka, and Pory. Every geotechnical site name comes from the street where the construction site is located. The Pełczyńskiego site is in the Bemowo district, which is located in the northeastern part of Warsaw. From this site, seven samples were collected from a depth of 2 to 7.5 m below the surface. The Pory and Bartycka sites are in the southwestern part of Warsaw, in the Mokotów district. Altogether, eight samples were collected there from a depth of 1.5 to 9.5 m below the surface. Every soil core was collected in undisturbed condition by Shelby tubes. The localization of the test sites is presented in Figure 4.
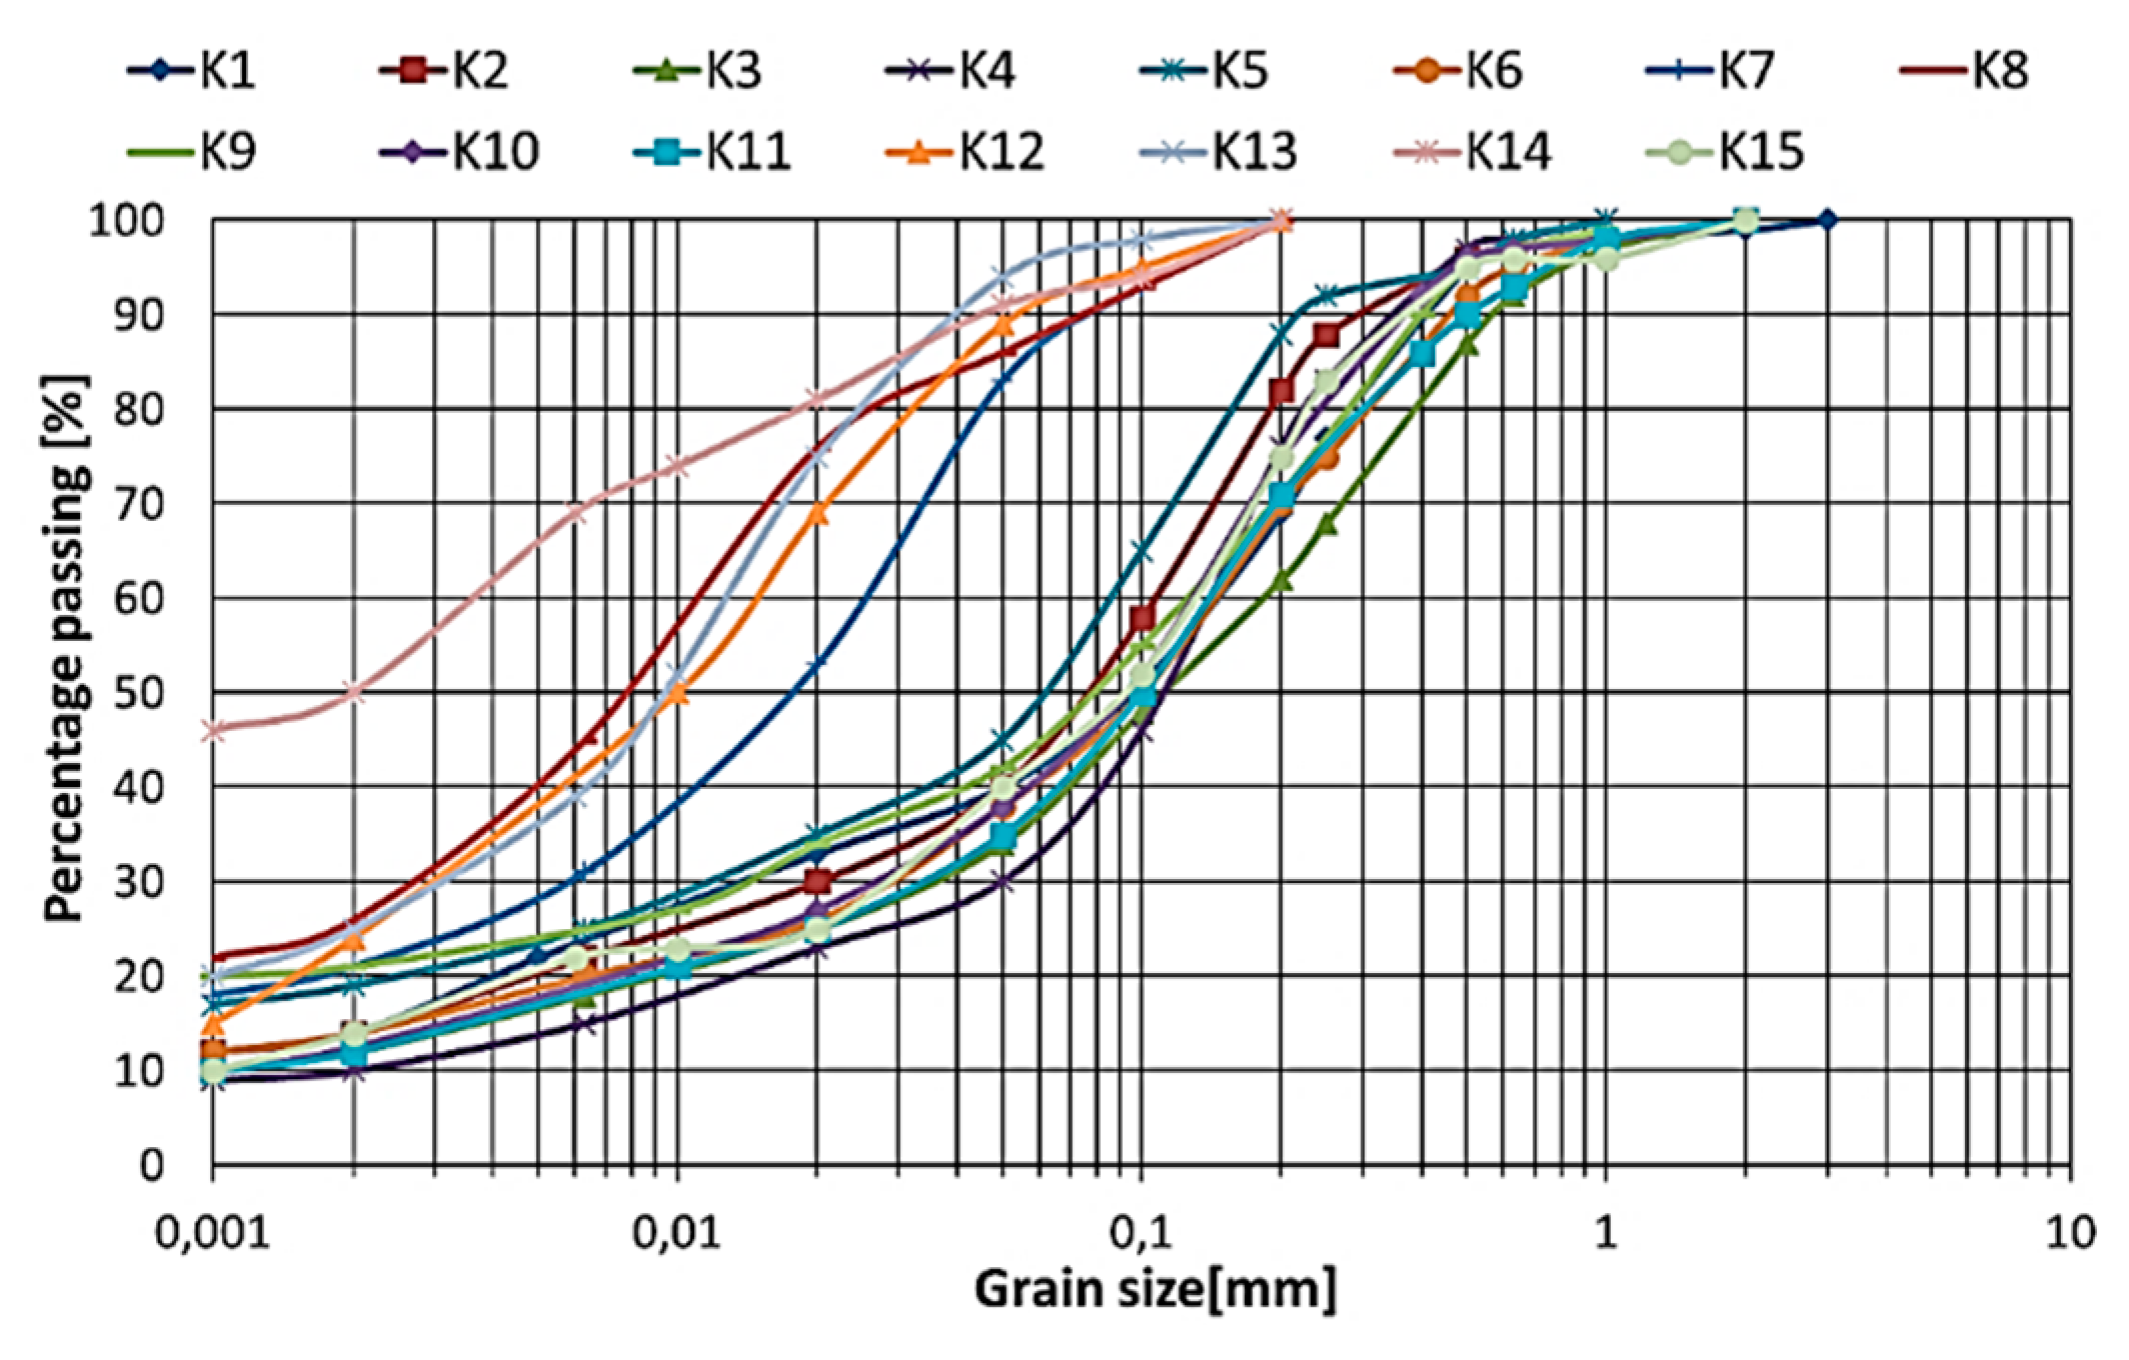
Before performing the damping tests, the soil grain distribution and basic physical properties were examined. Based on aerometric and sieve analysis, as well as on Eurocode 7 [33,34], every cohesive soil was recognized. Moreover, the soil parameters, moisture content according to [35], Atterberg limits according to [36], overconsolidation ratio according to [37], and initial void ratio were estimated. The soil parameters and range of mean effective stress (p’) at which damping tests were conducted are presented in Table 2. In Figure 5, grain-size distribution curves for tested cohesive soils are shown.
After the examination of the basic properties of the soil, the core sample was pushed out from the Shelby tube by a hydraulic press. Next, from the undisturbed core, a cylindrical specimen at 70 mm diameter and 140 mm high was cut out. Later, the prepared sample was placed on resonant column pedestal, and the proper test was started after closing the chamber.

3.2. Test Apparatus and Test Procedure

In this research, the fixed free resonant column manufactured by GDS Instruments Ltd. was employed as the most reliable tool for the determination of the damping ratio of soil specimens in the shear strain range of 10−4%–10−2%. A more detailed description with technical features and the blueprint of the devices can be found in [38,39].
After closing the resonant column chamber, every specimen was saturated to Skempton parameter B at least 0.95. After that, the consolidation process took place. At every stage of consolidation, dynamic tests were conducted. First, the resonant frequency at torsional mode excitation had to be found. Next, the sinusoidal wave at resonant frequency was applied on top of the soil sample by the drive system, consisting of four coils and magnets. After 2 seconds of excitation, the coils were switched off, and the specimen was left to vibrate freely. The damping of the soil sample movement was recorded by accelerometer and displayed on the screen as a free vibration decay curve. Subsequently, based on the free vibration decay curve, the scientist carefully chose the right number of damping cycles at which specimen motions were utterly damped. Knowing the number of cycles, software calculated the logarithmic decrement δ from the following equation:
δ = 1 n ln ( Z n + 1 Z n ) + ln ( Z n + 2 Z n + 1 ) + + ln ( Z n + i Z n + ( i 1 ) ) n
where: n—number of damping cycles and Zn+i—amplitude of the respective cycle. With the value of logarithmic decrement δ, damping ratio D was calculated by the program from Equation (4).
D = δ 2 4 π 2 + δ 2
In order to obtain a damping ratio curve dependent on shear strain (γ), the researcher increased the amplitude of applied voltage on the drive system and repeated all processes described above. Damping tests were conducted according to [40]. Moreover, every damping test was repeated ten times at each shear strain. Next, from ten results of the damping ratio, the average value was calculated and used in further interpretation.

4. Results

4.1. Shear Strain

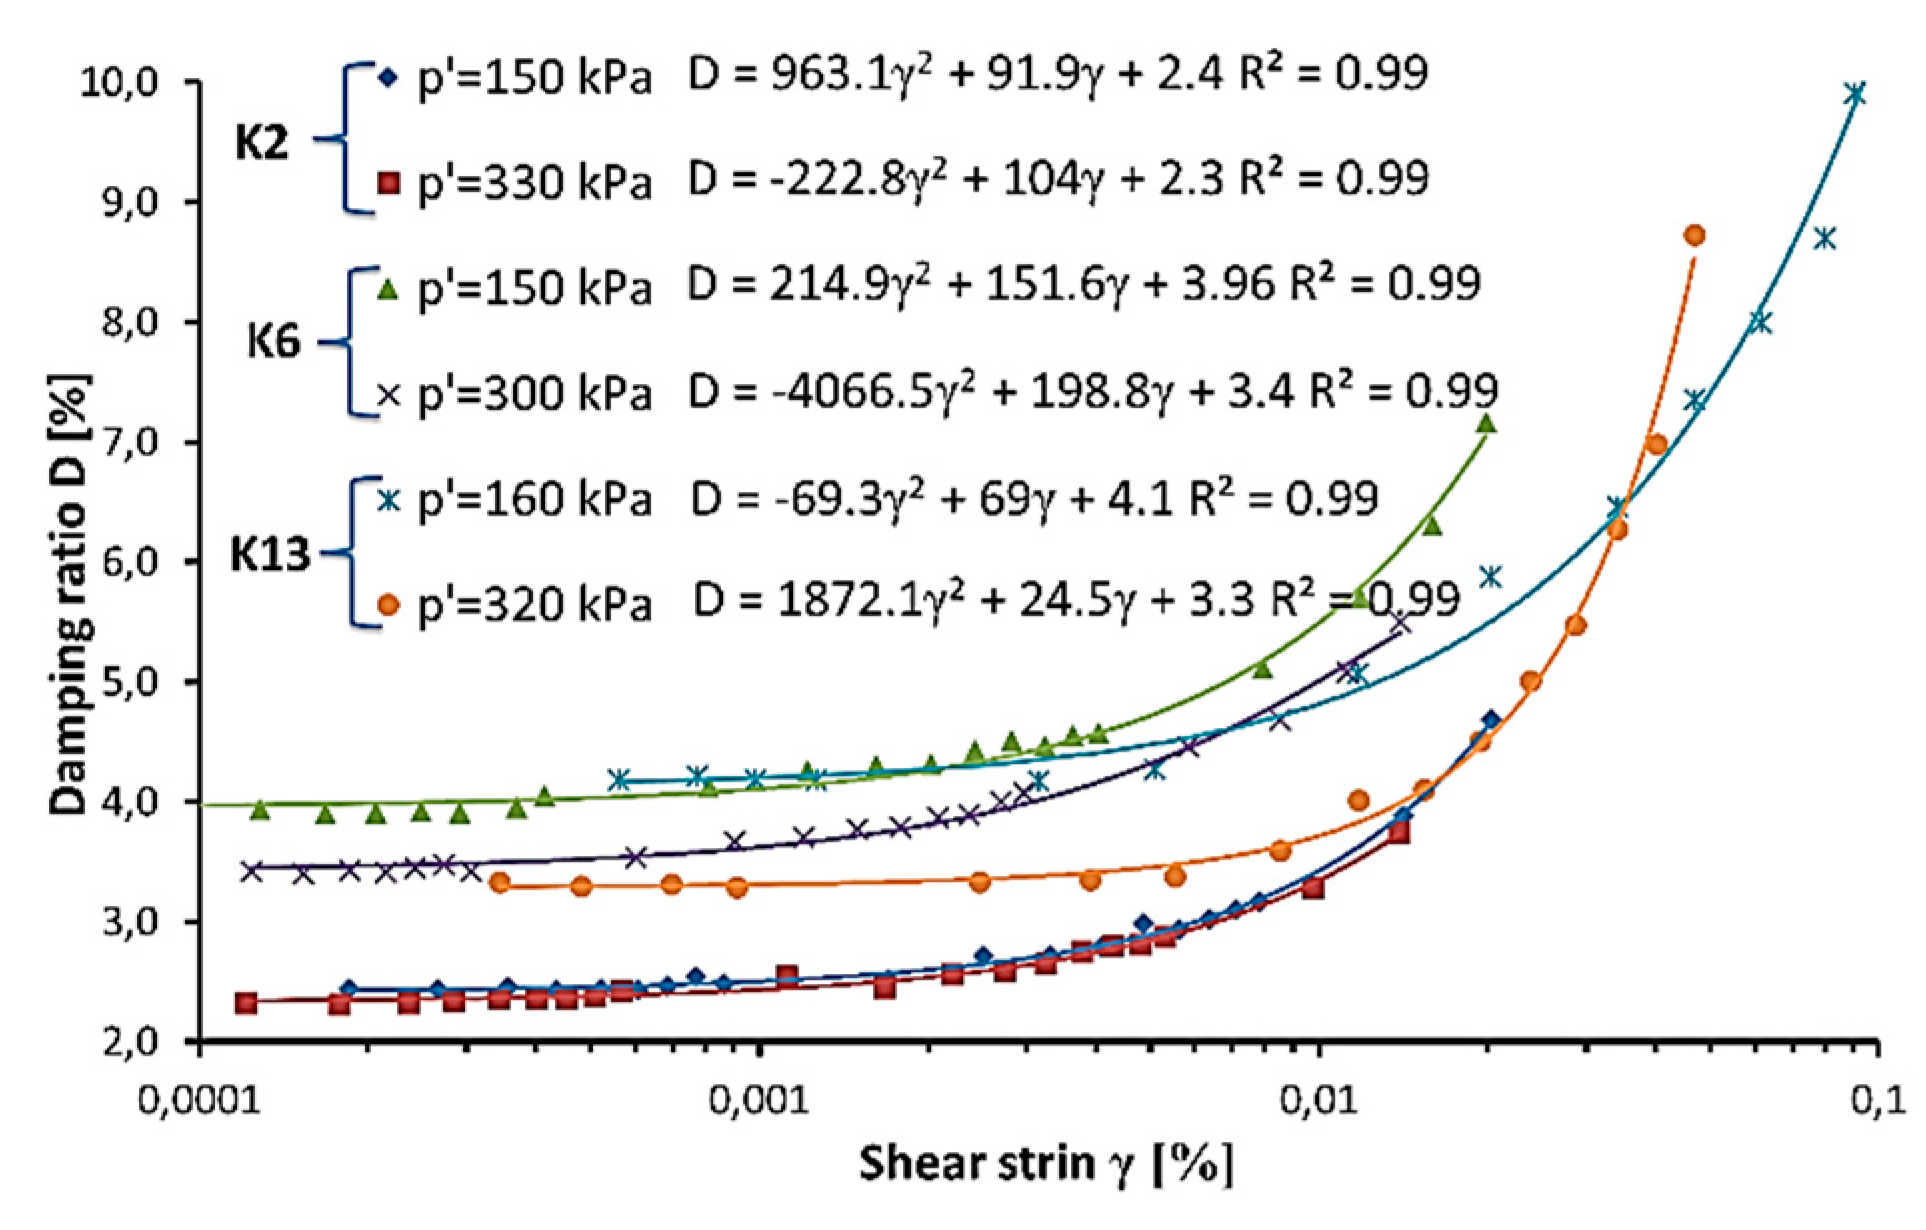
In Figure 6, typical examples of the damping ratio curve dependant on shear strain for three specimens, K2, K6, and K13, from different test sites, tested in two similar mean effective stress are presented. The influence of shear stress on the damping ratio is clearly visible. The variability of the damping ratio dependant on shear strain is best described by the quadratic function, with the lowest coefficient of determination equal 0.92 for the K14 sample.
As was said in Section 2.2, based on the damping ratio curve, we can identify three zones of soil response for loading: linear elastic, nonlinear elastic, and plastic. Over the decades, researchers reported different threshold strains between soli response zones, for example, γ t e = 0.0025% [12], 0.001% [41,42], and 0.002% [42] and γ t c around 0.04% [43] for cohesive soils. According to Figure 1, we estimated threshold strains for every tested soil. The results are presented in Table 3. It can be seen that both threshold strains are dependent on plasticity index (PI) and they are moving into the larger strains with PI increasing. The exception is sample K14, which, despite much plasticity, obtained γ t c = 0.007% at p’ = 95 kPa. However, the general trend confirmed research presented in [30]. Moreover, degradation threshold strain is strongly dependant on effective stress, which is described in next section.

4.2. Effective Stress

Another significant factor influencing the damping ratio is effective stress. In Figure 7, the minimal damping ratio DMIN, designated at the linear elastic range of soil response, dependant on effective stress (p’) is presented. Conducted research confirmed the linear relationship between these two parameters. The minimal damping ratio decreases with an increase in effective stress. Except for the K2 sample, every tested soil obtained the coefficient of determination for linear function R2 > 0.8. The small value of R2 for the K2 sample may be due to the low variability of the DMIN with the increase of p’.
Effective stress also influences the shape of a damping ratio curve. In Figure 8, the damping ratio curve obtained at different effective stress levels for sample K8 is shown. A red arrow indicates an increase in effective stress (p’). It can be seen that, with an increase of p’, the damping ratio curves move down. Moreover, the zone of nonlinear elastic response of soil also increases. Therefore, the degradation threshold strain ( γ t c ) moves to the larger shear deformation. This phenomenon is presented in Table 3 in the γ t c columns.

4.3. Soil Type—Plasticity Index (PI)

Plasticity index (PI) is the fundamental physical property of cohesive soil and, by many researchers, is considered one of the most important factors affecting the dynamic properties of cohesive soil [14,16]. Therefore, in Figure 9, minimal damping ratios depending on the plasticity index are shown. Every tested soil (except K5) has a few different DMINs. It is connected with the next steps of the consolidation process at which damping tests were conducted (see Figure 7). Based on this figure, the following can be observed: the DMIN decreases with the rise of the PI from 0% to about 20%, and then the trend changes and an increase in the plasticity index causes an increase in the minimal damping ratio. This phenomenon is related to the soil structure. Namely, below PI = 20% soil has a lot of sandy fraction, and these grains dominate in soil structure. Thus, when the PI is small, the friction between the grains is significant, and much of the motion energy is dissipated and changes into thermal energy, so the minimal damping ratio is high. When the plasticity index increases, water and clay friction act as a lubricant and reduces friction, and, therefore, the DMIN decreases. However, above PI = 20%, the situation changes. Clayey and silty fractions start to dominant in soil structure, and connections between these grains are the most important. The contact area is very small compared to sandy grains, so a lot of motion energy is lost on those connections; as a result, energy dissipation increases, and therefore the minimal damping ratio also rises. Similar conclusions can be found in [42], however, in that work, PI value, above which the minimal damping ratio characteristic was changed, was equal to 50%.
Soil cohesion also has influence over the shape of the damping ratio curve. Figure 10a shows examples of damping ratio curves for soils with a different plasticity index, namely, K4, K7, K13, and K15, compared to Vucetic and Dobry curves [16]. The presented damping ratio curves are obtained at similar effective stress levels from 110 to 160 kPa, and the PI range is from 6.6% for the K4 sample to 36.68% for the K13 sample. The curves provided by Vucetic and Dobry are correct for soils with a plasticity index from 0% to 50% and an OCR from 1 to 8. However, it can be seen that Warsaw cohesive soils have a completely different shape and do not fit with the range proposed by Vucetic and Dobry [16]. Figure 10a is evidence that we cannot compare soils from Europe to soils from the US, because of differences in origins and genesis, which influence not only the values of the damping ratio but also the shape of the damping ratio curves.
The real influence of the plasticity index on the damping ratio curves is presented in Figure 10b. On the y axis, the normalized damping ratio (D/DMIN (-)) is shown. In this configuration, elastic range of soil response is denoted as D/DMIN = 1. The x axis shows the standard shear strain (γ) (%) of a soil sample. The curve for the K4 sample increases the fastest and crosses the nonlinearity threshold strain as the first soil. This is due to a very small PI value, namely, 6.6%. Every curve is located beneath another in line with the increase of the plasticity index, so the first is for K4, the second is for K15, the third is for K7, and the fourth is for K13. Based on purposed normalization, you can say that an increase of PI value causes an increase in the elastic range of soil responses for dynamic loading. Therefore, the plasticity index has a significant impact on the shape of a damping ratio curve.

4.4. Void Ratio (e)

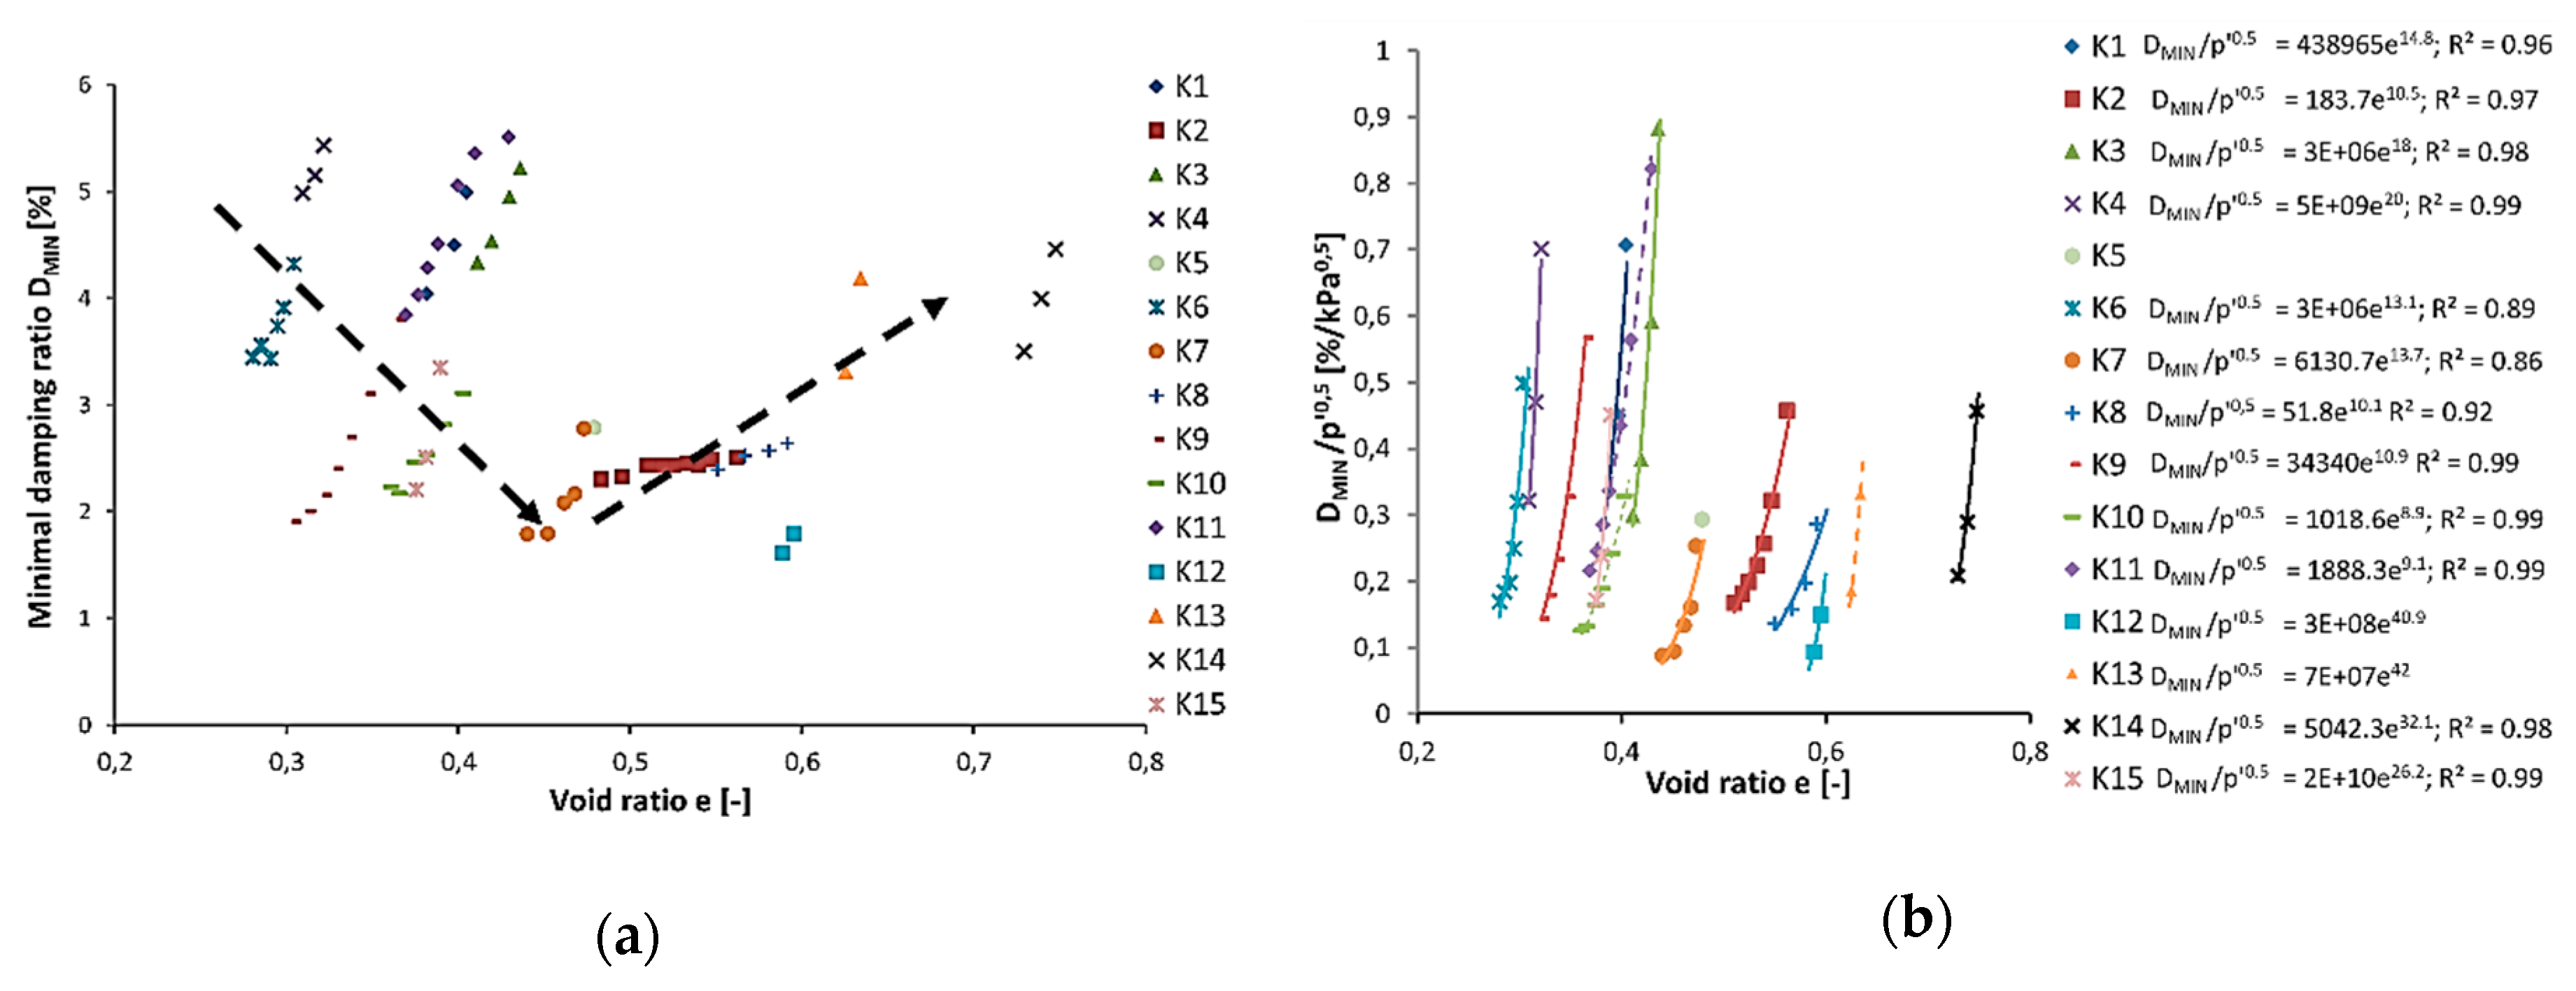
As presented in Section 2.5, the impact of the void ratio on the damping properties of the cohesive soil is not straightforward. Therefore, in Figure 11a,b, a different approach for the presentation of that influence is presented. In picture 11a, the minimal damping ratio versus the void ratio is shown. In this figure, some global dependency can be seen; namely, from the void ratio 0.3 to about 0.5, the DMIN decreases. When the void ratio rises, the minimal damping ratio increases. That phenomenon is marked in Figure 11a by the black arrows. Moreover, the same observations can be found in [20,22]. However, it is well-known that the void ratio depends on the effective stress (p’), so it is hard to determine the impact of the void ratio on the minimal damping ratio for individual samples. Thus, the authors of this article propose dividing minimal damping ratio by the square root of effective stress (p’), in order to emphasize the influence of the void ratio on the damping ratio. This procedure is presented in Figure 11b. The relationship between these parameters is best described by a power function with the minimal coefficient of determination in sample K7 0.86. Therefore, in the case of cohesive soil from Warsaw, the void ratio has a noticeable impact on the minimal damping ratio (DMIN). However, the authors did not find any influence of e on the shape of the damping ratio curve of the studied soils.

4.5. Summary

In the above section, the influence of the most crucial factor affecting the damping properties of cohesive soil from Warsaw was presented. Definitively, the most significant impact on the damping ratio is shear strain. However, it is worth noting that shear strain can be replaced in the model by the much more common normalized shear modulus (G/GMAX) [44,45]. The authors confirmed the high impact of effective stress and plasticity index on both the minimal damping ratio and the shape of the damping ratio curve. Additionally, the authors presented the relationship between the minimal damping ratio and void ratio, which is not so obvious, according to the literature [14]. Based on that knowledge, the empirical model described damping properties of cohesive soil from Warsaw is presented below.

5. Empirical Model

5.1. The Statistical Reliability of the Results

Each measurement in laboratory conditions is burdened with a certain error, mainly because of apparatus and researchers’ imperfections. Furthermore, in the case of soil laboratory tests, there is also a significant heterogeneity of the material, which further reduces the quality of the results. This phenomenon is clearly visible in damping tests in a resonant column apparatus. Despite the same torsional frequency excitation, the same shear strain and the same effective stress obtained damping ratio values may differ by a few tenths.
To confirm the reliability of the obtained damping ratio values, the standard statistical operations were carried out. Every damping test was repeated ten times at each shear strain so the database of over 12,000 damping ratio values was gathered. For ten repetitions at each shear strain, authors determined a minimum, maximum, and average value. The average value of the damping ratio was the reference result on the basis of which statistical parameters like standard deviation, interval, median, variation, standard error of the mean value, and absolute and relative measurement error were determined. Afterward, the calculated parameters were averaged over the entire consolidation stage and, in the subsequent move, overall consolidation stages for one sample. The results of these calculations for individual samples and for all conducted research are summarized in Table 4. It is worth noting that the standard deviations for all presented data are rather low, not exceeding the value of 0.2, except for the K1 and K4 samples. Hence, variations for these specimens are also the highest. Moreover, the same soils have the highest value of standard error of the mean value. However, this does not result in the biggest relative measurement error. This parameter is the highest for sample K2 and K8. Nevertheless, calculated average statistical volatility parameters and errors for the whole study are still very low, which shows high accuracy and correctness of the damping ratio recorded during the laboratory tests.

5.2. Experimental Model Describing the Damping Properties of Soil in the Range of Small and Medium Strains.

One of the main aims of the following study was to find the factors affecting the dynamic properties of selected clayey soils from Warsaw. These properties are represented in the article by damping ratio, i.e., minimal damping ratio (DMIN) in the elastic range of shear strain and damping ratio (D) in the elastoplastic and plastic range of shear strain. In order to find the relationship between the damping ratio and the factors described in Section 4, the correlation analysis was carried out. This method, utilizing a linear correlation model, checks the relationship between two variables. That allows the expected outcome of the variable based on another variable that is correlated with the first variable to be calculated. The main parameter describing strength of the correlation is the Pearson correlation coefficient, otherwise known as the correlation coefficient (R). It takes values from –1 to 1. The closer to 0 the correlation coefficient is, the weaker the correlation is. The R equals −1 or 1 indicates a perfect linear relationship. Moreover, the sign at R value indicates the direction of a correlation.
The analysis of the impact of the plasticity index on the damping ratio allowed to determine the threshold value of PI = 20%, which indicates the change of the DMIN trend from decreasing to increasing value (Section 4.3. and Figure 9). Therefore, the tested soils were divided into two groups, namely, low and medium cohesive soil with a PI below 20% and very cohesive soil with a PI above 20%. In Table 5, the correlation matrix for tested specimens from both groups and the values of the Pearson correlation coefficient are shown. It can be seen that the most significant influence on the damping ratio in both groups of soil has normalized the shear modulus (G/GMAX) and shear strain (γ). As was recognized in Section 2.2, G/GMAX is strictly related to shear strain and can replace γ in an empirical damping model, which is rather hard to determine in situ. In the group of low and medium cohesive soil, another parameter with a high value of R is the plasticity index. It is worth noting that the sign of the correlation coefficient for the PI is different for both groups. That means, as mentioned above, a change in the dependence of the plasticity index on the damping ratio. Additionally, significant influence on D has effective stress (p’). However, R for p’ is higher for very cohesive soils than for low and medium cohesive soils. Moreover, p’ in soils with PI > 20% has an absolute value of R higher by 0.11 than PI. Besides the mentioned parameters, the void ratio in soils with PI < 20% has enough of a high correlation coefficient to be used in an empirical model. Nevertheless, the authors specially selected the three same parameters to build a universal model core for both groups.
To create a correct and reliable empirical model, the authors analyzed every important factor affecting damping properties. Due to the nonlinear characteristic of the damping ratio, the authors eliminated from the analysis linear regression. Moreover, the investigation of Figure 6 and Figure 8 provided the basic function regarding the dependence of damping on deformation (or G/GMAX), i.e., quadratic function. Subsequently, after investigating Table 5, PI was selected as a parameter which describes physical soil properties in the created model. The examination of Figure 9 provided two opposite trends, increasing and decreasing DMIN with the increase of PI; thus, two linear functions had to describe this phenomenon. First for soils with a PI below 20%, and second for soils with PI above 20%. The last part of the empirical model should describe test conditions, such as effective stress. The power function of effective stress with reference to atmospheric pressure was proposed based on [45]. Finally, based on articles [44,45,46,47,48] and acquired knowledge, the main core of the empirical model was created:
D = [ a ( G G M A X ) 2 b ( G G M A X ) + c ] + d I p + e ( p P a ) f
where: a, b, c, d, e, and f—constants, different for both analyzed soil groups, and Pa—atmospheric pressure equal to 100 kPa.
Next, the authors employed the software STATISTCIA 13 with the nonlinear regression module. Thanks to least squares method and the Gauss–Newton estimation, two groups of constants were found: for low and medium cohesive soils PI < 20%: a = 14.8, b = 34.3, c = 26, d = -0.31, e = 1.36, and f = −0.32; and for very cohesive soil PI > 20%: a = 6.32, b = 20.36, c = 14.43, d = 0.062, e = 0.75, and f = −1.49.
The proposed equation allows for the calculation of the damping ratio in every range of shear strain. To obtain a minimal damping ratio in the elastic shear strain zone, one should insert 1 in place of G/GMAX. For the damping ratio in elastoplastic strain zone, G/GMAX from 0.98 to 0.8, and for damping ratio in plastic strain range, G/GMAX below 0.8. Thus, the lower the normalized shear modulus value, the greater the shear strain.

5.3. The Statistical Reliability of the Proposed Model

A comparison of the results from the present work with those previously reported for cohesive soils was conducted to present the statistical reliability of the proposed model. The authors chose four well-known equations for damping ratio in wide shear strain range, suggested by the following:
Ishibashi and Zhang [44]:
D = ( 0.333 ( 1 + e 0.0145 I P 1.3 ) 2 ) [ 0.586 ( G G M A X ) 2 1.547 ( G G M A X ) + 1 ] ;
Park and Stewart [48]:
D = 17.83 [ 0.56 ( G G M A X ) 2 1.39 ( G G M A X ) + 1 ] ;
Michaelides et al. [47]:
D = 2 + [ 18 0.08 ( I P 15 ) ] [ 1 ( G G M A X ) ] ;
Zhang et al. [45]:
D = 10.6 ( G G M A X ) 2 31.6 ( G G M A X ) + 21 + [ ( 0.008 I P + 0.82 ) ( σ 0 P a ) 0.5 k .
The equation proposed by Ishibashi and Zhang [44] was calibrated for cohesive soil with PI below 50% and effective stress below 1000 kPa. Park and Stewart [48] created an equation for the average damping ratio curve based on nine publications and considered different types of clay, for example, offshore clayey silt, Taganuma and Hommoku clay, Edger plastic kaolin, Mexico City clay, San Old Bay clay, et cetera. Michaelides et al. [47] found an empirical model for cohesive soil with a PI from 0% to 100%. The equation created by Zhang et al. [45] was appropriated for Quaternary, Tertiary, and older soils with a PI from 0% to 132%, collected from a dept of 0 to 326 m. Thus, every considered literature models was suitable for the studied soils.
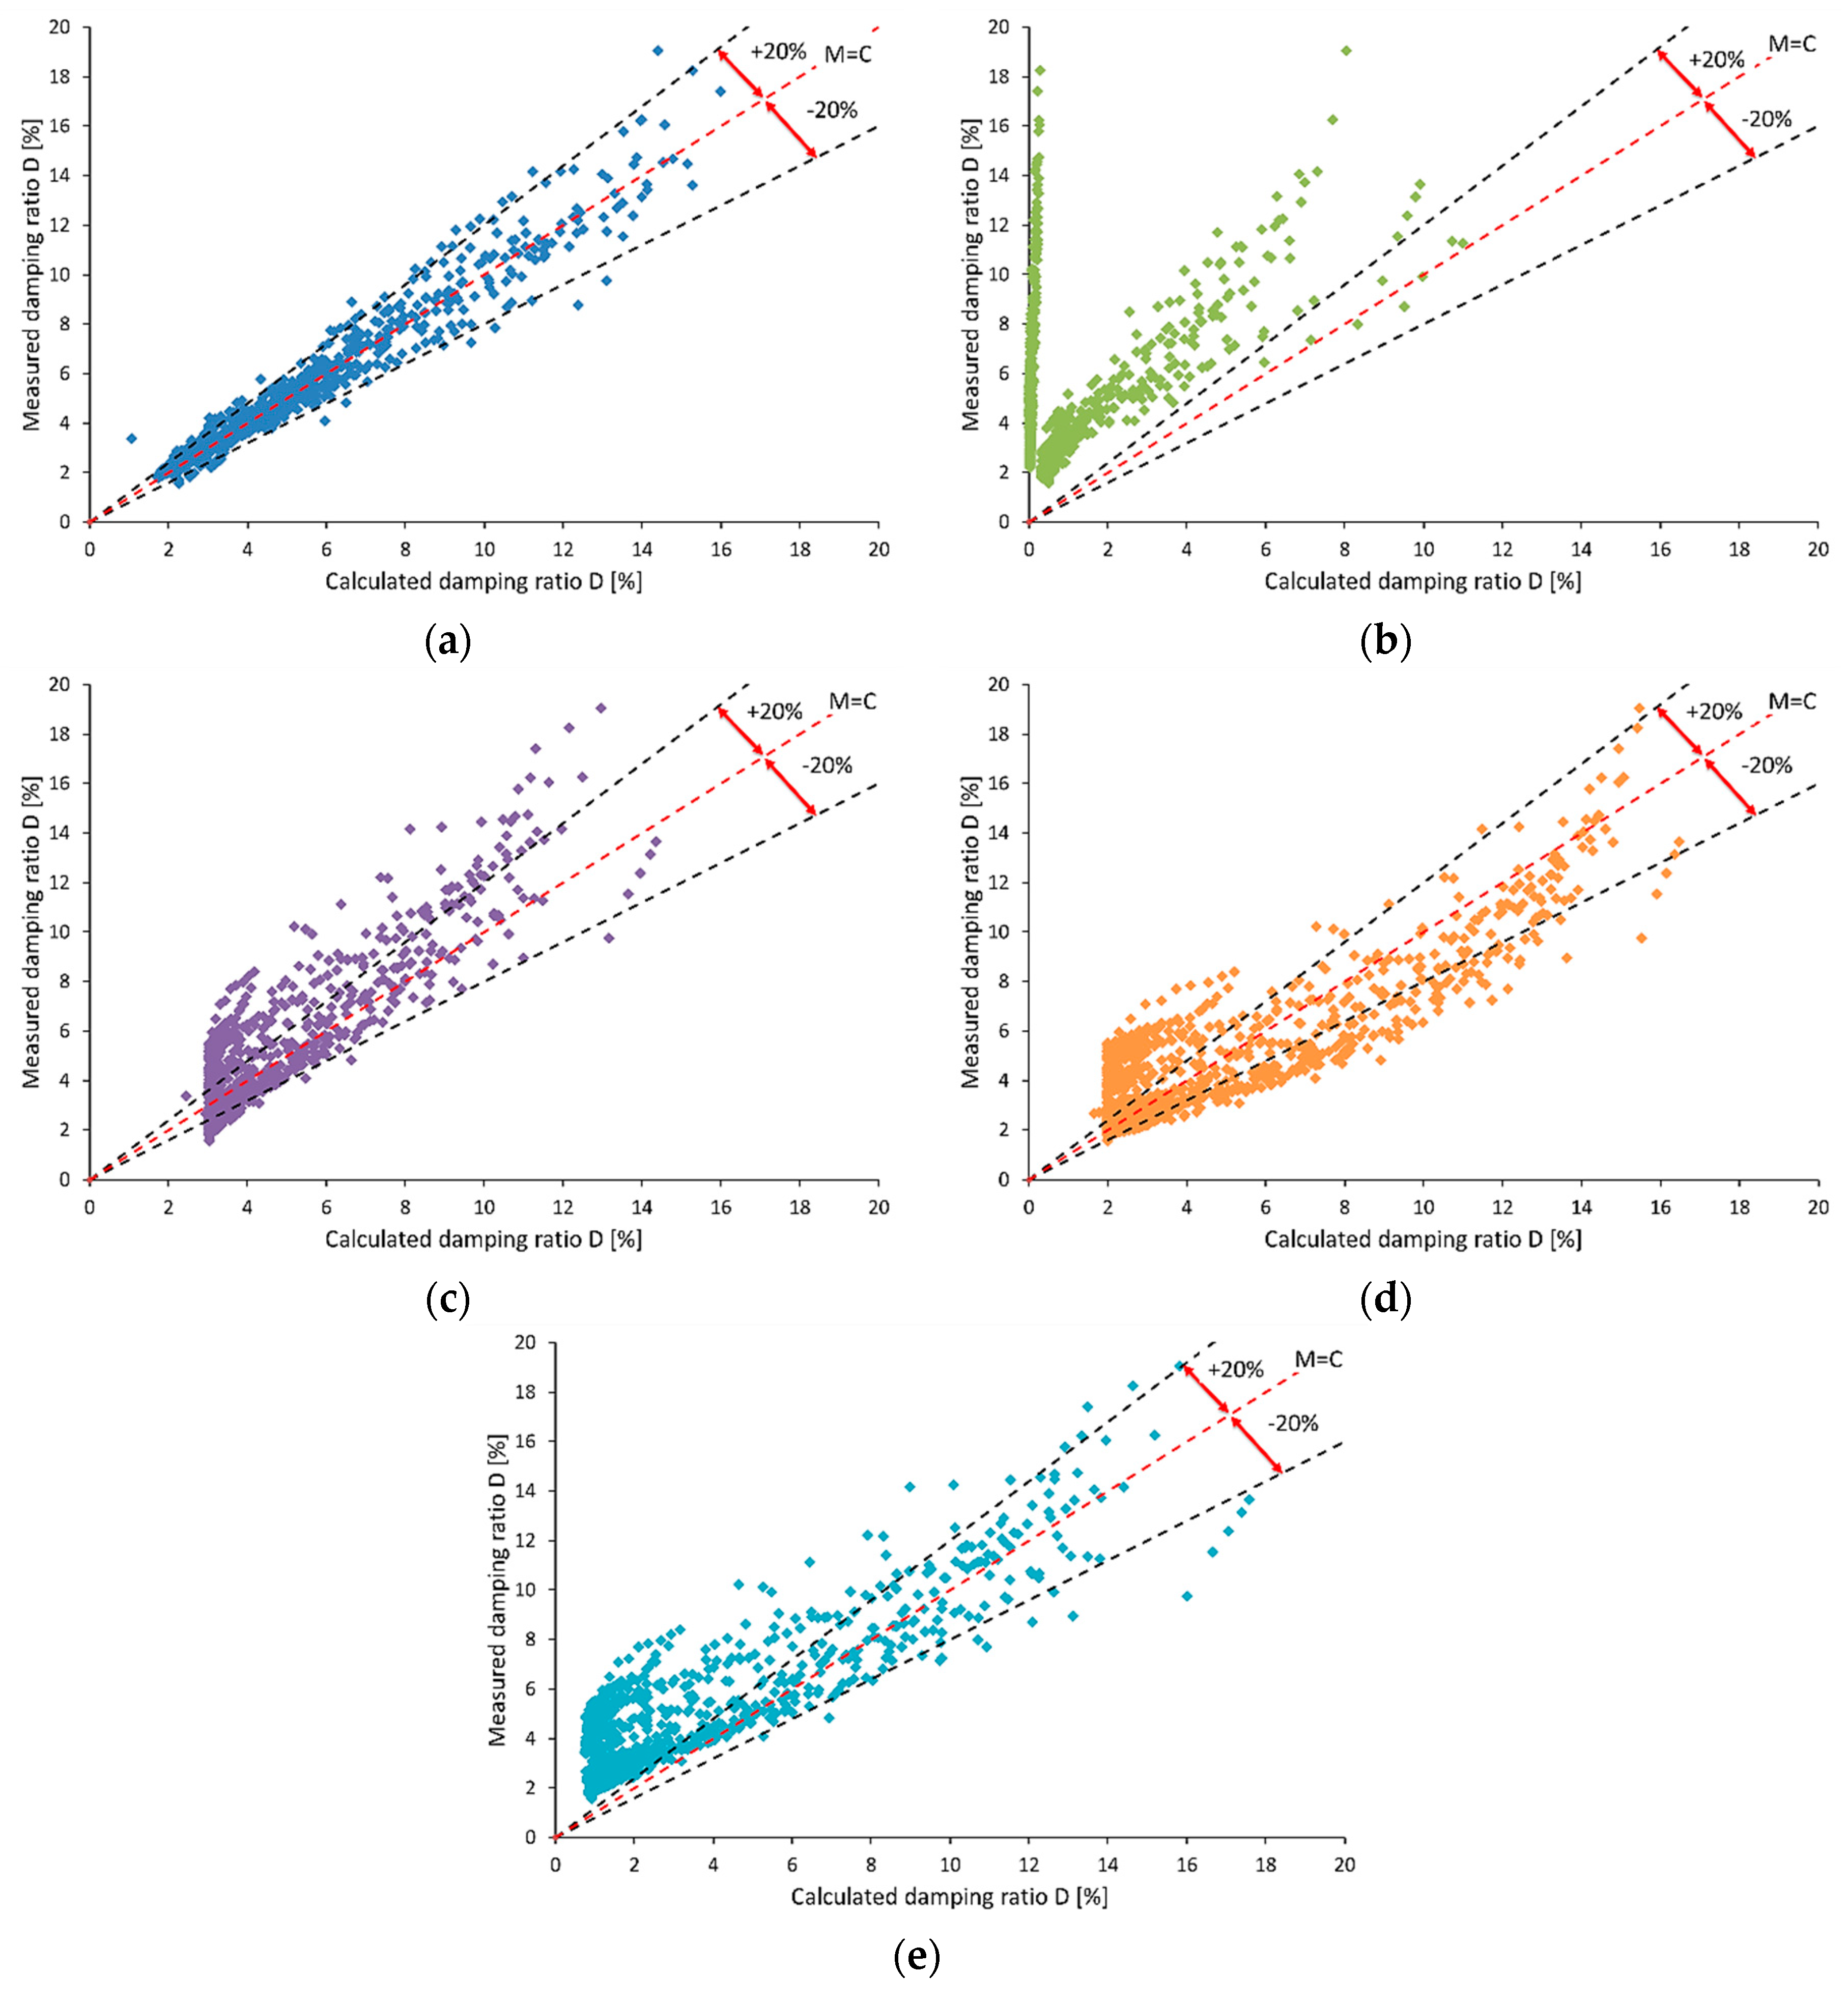
In Figure 12a–e, the measured versus calculated damping ratio is shown for the five analyzed models. The red dashed line indicates equal points between measured and calculated values, while black dashed lines mean ±20% error. In Figure 12a, the results for the model created by the authors of this article are presented. It can be seen that most of the calculated damping ratio fits in the ±20% error range. Moreover, points are located more or less equally on both sides of the line M = C, which means that the equation neither understates nor overstates the results. The worst match of measured and calculated results can be seen in Figure 12b, for the equation suggested by Ishibashi and Zhang [44]. That model significantly underestimates the results, because almost all calculated values are above the +20% error line. In Figure 12c,d, a quite similar distribution of points is presented. However, the Park and Stewart [48] equation slightly underestimates, while the Michaelides et al. [47] model rather overestimates the damping ratio. In Figure 12e, results for the equation constructed by Zhang et al. [45] are shown. This proposition has a problem with estimations of the small value of damping ratio because nearly every measured parameter from 2% to about 6% is above the +20% error line. In Figure 12a–e, it is clear that the best model for Quaternary cohesive soil from Warsaw is the equation proposed by the authors.
In Table 6, more statistical information about the empirical model and other compered in this article is provided. Table 6 consists of values of the absolute and the relative error for studied equations, and average values of this error referred to the entire study and the coefficient of determination for all five models. Based on Table 6, it can be concluded that the smallest absolute and relative error for individual samples has Equation (5) proposed in this article. Moreover, the average relative error is over three times smaller than the second-best equation suggested by Park and Stewart [48]. The highest value of absolute (0.77) and relative (18.4%) error for Equation (5) was recognized in sample K12. However, it is still a very small value compared to the highest errors from other analyzed models. The coefficient of determination is the closest to 1 in the author’s proposition (0.96). Equations (6)–(9) have an R2 equal to 0.21, 0.79, 0.78, and 0.77, respectively, but the average relative error is on a high level from 28.2% for the Park and Stewart [48] model to extreme, 77.3%, for Ishibashi and Zhang [44], Equation (6). Thus, regard to estimation errors, Equation (5) caused the smallest, so it is best suited for the studied soils.
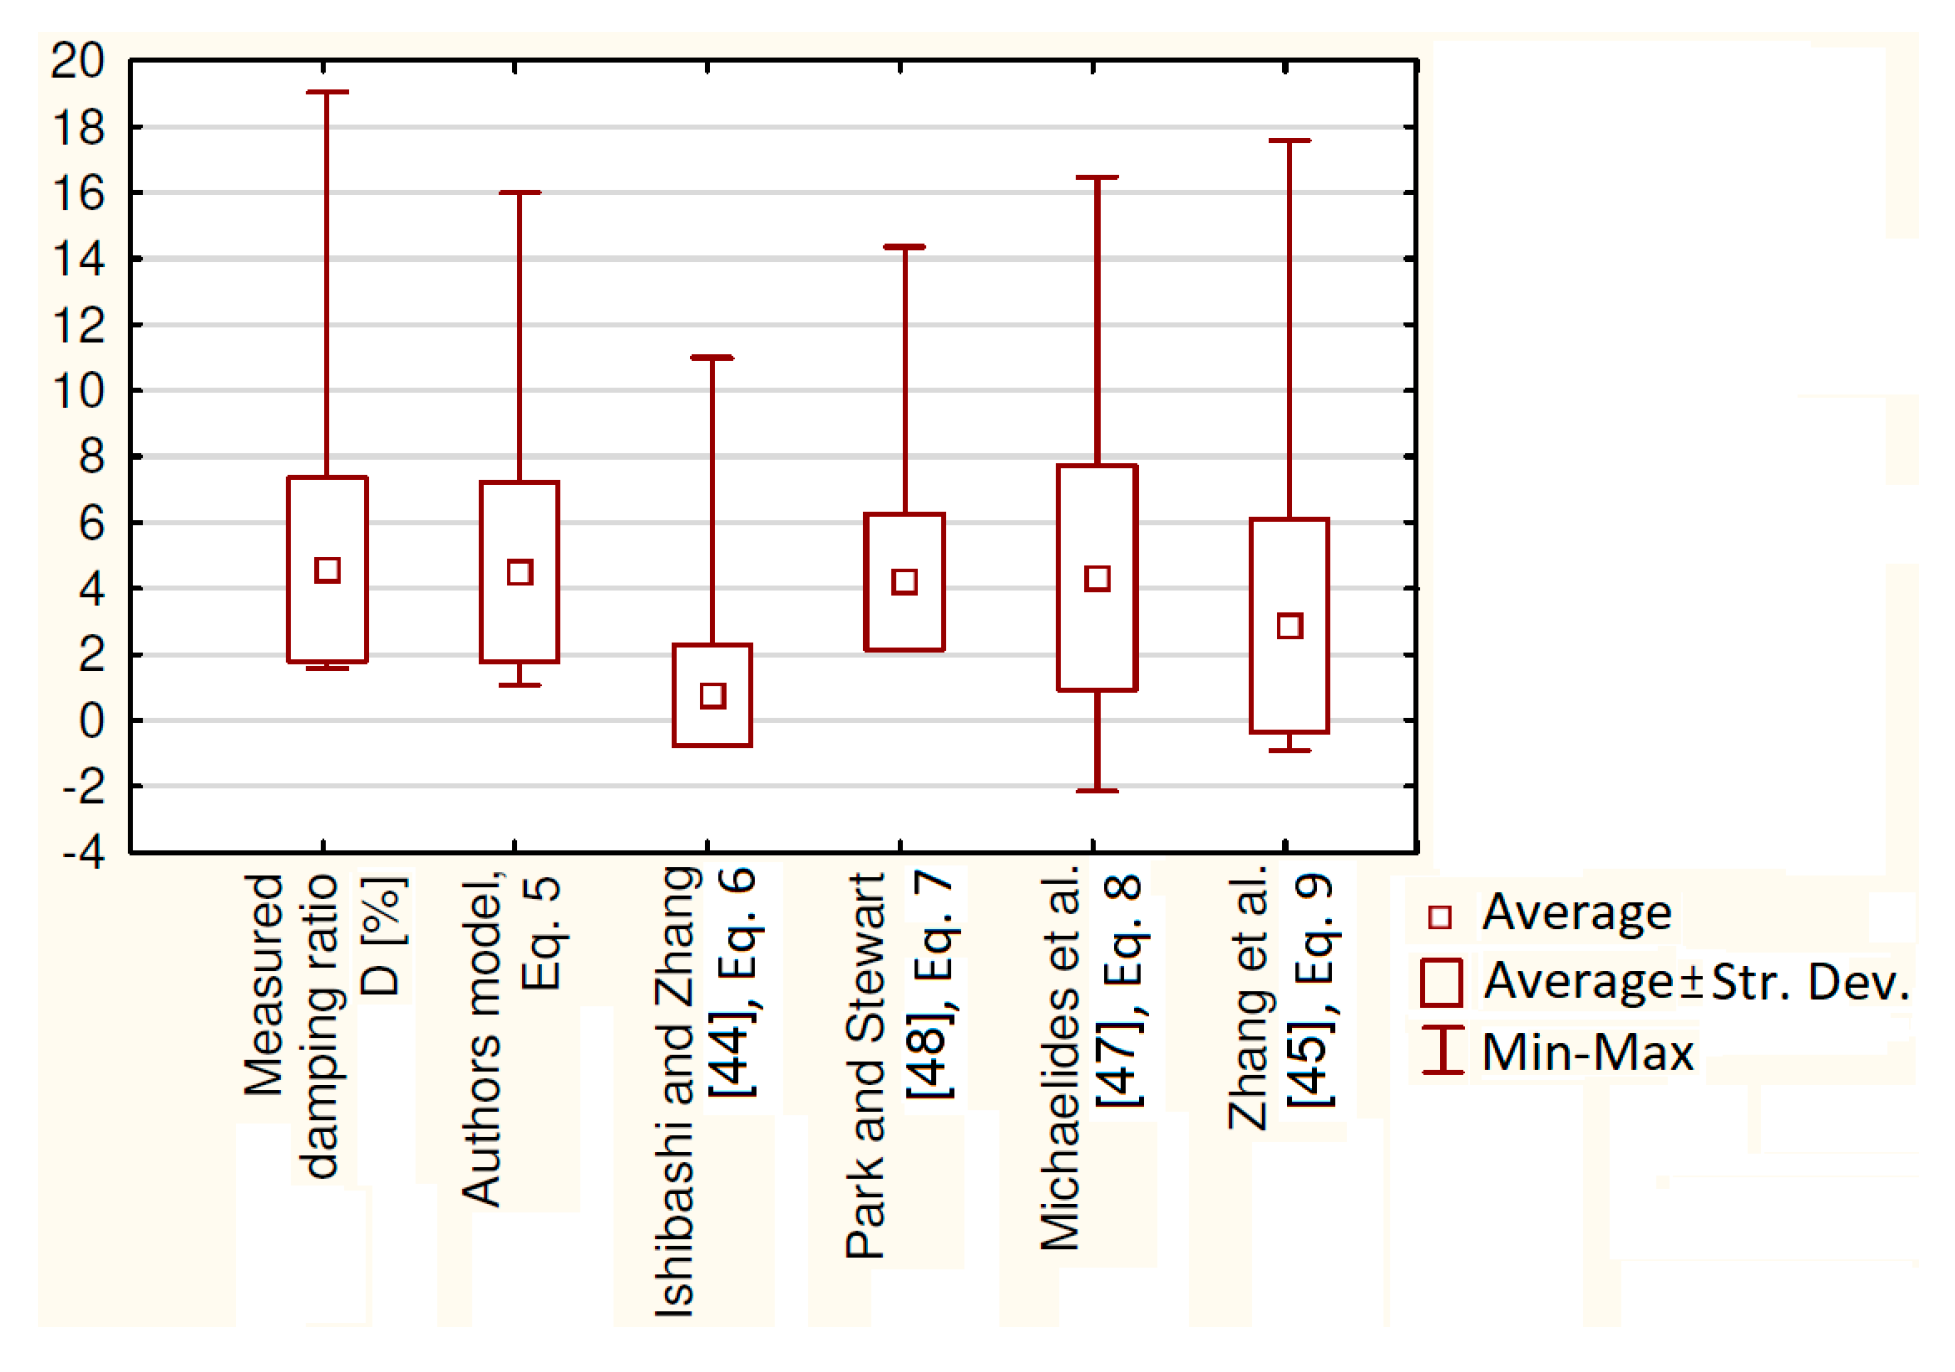
The last statistical comparison of the analyzed models is presented in Figure 13. The picture shows the so-called box–plot chart. The smallest squares indicate the average value for the measured and calculated damping ratio. It can be seen that the mean measured damping ratio is similar to the calculated by Equations (5), (7), and (8). The mean damping ratio estimated by Equation (9) is slightly below the measured result. However, the most divergent from reality is the one from the Ishibashi and Zhang [44] model. The next quantity presented in Figure 13 is average value of damping ratio plus and minus standard deviation. In this case, only the authors’ model has a similar size box to the measured damping ratio. The last statistical value presented in Figure 13 is spread of results, marked with whiskers. The slightest difference between measured and calculated minimal and maximal values of damping ratio is presented by the authors’ model. However, it did not reach the same maximum value as the measured results. Nevertheless, it is worth noting that, from Equations (8) and (9), the damping ratio is estimated with a minus sign, which is incorrect according to the definition.
The conducted comparison clearly indicates that the best model for cohesive soil from Warsaw is Equation (5), which was proposed by the authors of this article. Damping ratios calculated by Equation (5) were the closest to the measured = calculated line (Figure 12a). Thus, the absolute and relative error was the smallest, and the coefficient of determination was the closest to 1. Moreover, the set of coefficient values calculated with the authors’ model was very similar to the measured damping ratios (Figure 13). On that basis, it can be concluded that Equation (5) describes the best damping properties of the tested soils.

6. Conclusions

In this article, the damping phenomenon of normally and lightly overconsolidated Quaternary cohesive soil from Warsaw was examined using the resonant column device. Different types of clayey Quaternary soils from three various test sites were collected in an undisturbed state. The damping tests in the resonant column apparatus by free vibration method were performed on each specimen. The authors created an empirical model describing the soil damping characteristic in the wide shear strain range. The main conclusions achieved in this research are summarized below, as follows:
1. As expected, the shear strain had an evident influence on the tested soil damping. The damping ratio was constant and had minimum value in the elastic range of shear strain. Above the nonlinearity threshold strain, the damping ratio started to increase, at first slowly, and after exceeding the plastic strain, it became more noticeable.
2. The effective stress and the plasticity index also have a significant influence on the damping properties of studied soil. As both parameters increased, the linear damping ratio range (DMIN) increased. The minimal damping ratio decreased linearly with increasing effective stress. The study of the impact of PI on DMIN allowed for the setting of a plasticity threshold on 20%, which indicates a change in the DMIN trend from a decrease to an increase.
3. The authors reported the influence of the void ratio on the minimal damping ratio, which is best described by the power function.
4. The laboratory technique with repeated damping testing significantly improved the reliability of the obtained results. Moreover, thanks to that method, measurement errors are at a low level.
5. Based on the laboratory tests, empirical Equation (5), describing damping properties, was created. Thanks to the connections between the quadratic function of G/GMAX, the linear function of PI, and the power function of p’, the resulting empirical model precisely describes the damping ratio in a wide range of shear strain, with the determination coefficient (R2) at 0.96 and average relative error at 9.6%.
6. Using commonly known empirical equations, it is not possible to reliably calculate the damping ratio for the studied cohesive soil. A comparison of the measured and calculated value by the equations from the literature resulted in the very large spread of damping ratio, as well as high values of errors. Therefore, it can be concluded that an empirical model should be applied to the soil, with a similar genesis and mineral composition as the soil for which they were created.
The proposed formula is still preliminary and needs to be upgraded and confirmed by being applied at different clayey sites.

Author Contributions

A.S. and W.S. conceived of and designed the experiments; E.S. and A.G. performed the experiments; E.S. and A.G. analyzed the data and wrote the paper; W.S. and A.S. edited and audited the content.

Funding

This research received no external funding.

Conflicts of Interest

The authors declare no conflicts of interest.

References

  1. Araei, A.A.; Ghodrati, A. The Effect of Stress Induced Anisotropy on Shear Modulus and Damping Ratio of Mixed Sandy Soils. Indian Geotech. J. 2018, 48, 153–175. [Google Scholar] [CrossRef]
  2. Pennington, D.S.; Nash, D.F.T.; Lings, M.L. Anisotropy of G0 shear stiffness in Gault Clay. Géotechnique 1997, 47, 391–398. [Google Scholar] [CrossRef]
  3. Gabrys, K.; Sas, W.; Sobol, E.; Gluchowski, A. Application of Bender Elements Technique in Testing of Anthropogenic Soil—Recycled Concrete Aggregate and Its Mixture with Rubber Chips. Appl. Sci. 2017, 7, 741. [Google Scholar] [CrossRef]
  4. Payan, M.; Khoshghalb, A.; Senetakis, K.; Khalili, N. Small-strain stiffness of sand subjected to stress anisotropy. Soil Dyn. Earthq. Eng. 2016, 88, 143–151. [Google Scholar] [CrossRef]
  5. Beards, C. Structural Vibration: Analysis and Damping; Elsevier: Oxford, UK, 1996. [Google Scholar]
  6. Gabrys, K.; Sobol, E.; Sas, W.; Szymanski, A. Material damping ratio from free-vibration method. Ann. Wars. Univ. Life Sci. SGGW Land Reclam. 2018, 50, 83–97. [Google Scholar] [CrossRef]
  7. Bachmann, H.; Ammann, W.J.; Deischl, F.; Eisenmann, J.; Floegl, I.; Hirsch, G.H.; Klein, G.K.; Lande, G.J.; Mahrenholtz, O.; Natke, H.G.; et al. Vibration Problems in Structures: Practical Guidelines; Birkhauser Verlag: Basel, Switzerland, 1995. [Google Scholar]
  8. Gabrys, K.; Sas, W.; Sobol, E.; Gluchowski, A. Torsional shear device for testing the dynamic properties of recycled material. Stud. Geotech. Mech. 2016, 38, 15–24. [Google Scholar] [CrossRef]
  9. Yoshida, N. Seismic Ground Response Analysis; Springer: Dordrecht, The Netherlands, 2015. [Google Scholar] [CrossRef]
  10. Kramer, S.L. Geotechnical Earthquake Engineering; Prentice Hall: New York, NY, USA, 1996. [Google Scholar]
  11. Hardin, B.O.; Black, W.L. Vibration modulus of normally consolidated clays. J. Soil Mech. Found. Div. 1968, 92, 353–369. [Google Scholar]
  12. Hardin, B.O.; Drnevich, V.P. Shear modulus and damping in soils: Measurement and parameter effects. J. Soil Mech. Found. Div. 1972, 98, 603–624. [Google Scholar]
  13. Dobry, R.; Vucetic, M. Dynamic properties and seismic response of soft clay deposits. Proc. Int. Symp. Geotech. Eng. Soft Soils 1987, 2, 51–87. [Google Scholar]
  14. Darendeli, M. Development of a New Family of Normalized Moduli Reduction and Material Damping Curves. Ph.D. Thesis, University of Texas at Austin, Austin, TX, USA, 2001. [Google Scholar]
  15. Hardin, B.O.; Drnevich, V.P. Shear modulus and damping in soils: Design equations and curves. J. Soil Mech. Found. Div. 1972, 98, 667–692. [Google Scholar]
  16. Vucetic, M.; Dobry, R. Effect of soil plasticity on cyclic response. J. Geotech. Eng. 1991, 117, 89–107. [Google Scholar] [CrossRef]
  17. Ishihara, K. Soil Behaviour in Earthquake Geotechnics; Oxford University Press: Oxford, UK, 1996. [Google Scholar]
  18. Stokoe, K.H., II; Darendeli, M.B.; Andrus, R.D.; Brown, L.T. Dynamic soil properties: Laboratory, field and correlation studies. In Proceedings of the Second International Conference on Earthquake Geotechnical Engineering, Lisbon, Portugal, 21–25 June 1999; Balkema: Rotterdam, The Netherlands, 1999; pp. 811–845. [Google Scholar]
  19. Afifi, S.S.; Richart, F.E. Stress-history effects on shear modulus of soils. Soils Found. 1973, 13, 77–95. [Google Scholar] [CrossRef]
  20. Kim, T.C.; Novak, M. Dynamic properties of some cohesive soils of Ontario. Can. Geotech. J. 1981, 18, 371–389. [Google Scholar] [CrossRef]
  21. Stokoe, K.H., II; Hwang, S.K.; Lee, J.K.; Andrus, R.D. Effects of various parameters on the stiffness and damping of soils at small to medium strains. In Pre-Failure Deformation of Geomaterials, Proceedings of the International Symposium, Sapporo, Japan, 12–14 September 1994; A.A. Balkema: Rotterdam, The Netherlands; Volume 2.
  22. Kallioglou, P.; Tika, T.H.; Pitilakis, K. Shear modulus and damping ratio of cohesive soils. J. Earthq. Eng. 2008, 12, 879–913. [Google Scholar] [CrossRef]
  23. Gabrys, K.; Sas, W.; Sobol, E. Small-strain dynamic characterization of clayey soil. Acta Sci. Pol. Archit. 2015, 14, 55–65. [Google Scholar]
  24. Mayoral, J.M.; Castanon, E.; Alcantara, L.; Tepalcapa, S. Seismic response characterization of high plasticity clays. Soil Dyn. Earthq. Eng. 2016, 84, 174–189. [Google Scholar] [CrossRef]
  25. Darendeli, M.B.; Stokoe, K.H.; Rathje, E.M.; Roblee, C.J. Importance of Confining Pressure on Nonlinear Soil Behavior and its Impact on Earthquake Response Predictions of Deep Sites, Proceedings of the International Conference on Soil Mechanics and Geotechnical Engineering; Aa Balkema Publishers: Lisse, The Netherlands, 2002; Volume 4, pp. 2811–2814. [Google Scholar]
  26. Towhata, I. Geotechnical Earthquake Engineering; Springer: Berlin, Germany, 2008. [Google Scholar]
  27. Ni, S.H. Dynamic Properties of Sand under True Triaxial Stress States from Resonant Column/Torsional Shear Tests. Ph.D. Thesis, The University of Texas at Austin, Austin, TX, USA, 1987. [Google Scholar]
  28. Mitchell, J.K.; Soga, K. Fundamentals of Soil Behavior; John Wiley & Sons: Hoboken, NJ, USA, 2005; Volume 3. [Google Scholar]
  29. Vucetic, M. Soil properties and seismic response. In Proceedings of the 10th World Conference on Earthquake Engineering, Madrid, Spain, 19–24 July 1992; Balkema: Rotterdam, The Netherlands, 1992; pp. 1199–1204, ISBN 9054100605. [Google Scholar]
  30. Vucetic, M. Cyclic threshold shear strains in soils. J. Geotech. Eng. 1994, 120, 2208–2228. [Google Scholar] [CrossRef]
  31. Taborda, D.M. Development of Constitutive Models for Application in Soil Dynamics. Ph.D. Thesis, Department of Civil and Environmental Engineering, Imperial College London, London, UK, 2011. [Google Scholar]
  32. Sun, T.; Chen, G.X.; Zhou, E.Q. The dynamic shear modulus and the damping ratio of deep-seabed marine silty clay. In Proceedings of the 15th World Conference on Earthquake Engineering (15WCEE), Lisbon, Portugal, 24–28 September 2012. [Google Scholar]
  33. PN-EN 1997-2:2007 Geotechnical Design—Part 2: Ground Investigation and Testing. Available online: http://sklep.pkn.pl/pn-en-1997-2-2007e.html (accessed on 14 March 2007).
  34. ISO 17892-4:2016 Geotechnical Investigation and Testing—Laboratory Testing of Soil—Part 4: Determination of Particle Size Distribution. Available online: http://sklep.pkn.pl/pn-en-iso-17892-4-2017-01e.html (accessed on 18 January 2017).
  35. ISO 17892-1:2014 Geotechnical Investigation and Testing—Laboratory Testing of Soil—Part 1: Determination of Water Content. Available online: https://www.iso.org/standard/55243.html (accessed on 24 October 2019).
  36. ISO 17892-12:2018 Geotechnical Investigation and Testing—Laboratory Testing of Soil—Part 12: Determination of Liquid and Plastic Limits. Available online: https://www.iso.org/standard/72017.html (accessed on 24 October 2019).
  37. ISO 17892-5:2017 Geotechnical Investigation and Testing—Laboratory Testing of Soil—Part 5: Incremental Loading Oedometer Test. Available online: https://www.iso.org/standard/55247.html (accessed on 24 October 2019).
  38. Sas, W.; Gabrys, K.; Szymanski, A. Experimental studies of dynamic properties of Quaternary clayey soils. Soil Dyn. Earthq. Eng. 2017, 95, 29–39. [Google Scholar] [CrossRef]
  39. Gabrys, K.; Sobol, E.; Markowska-Lech, K.; Szymanski, A. Shear Modulus of Compacted Sandy Clay from Various Laboratory Methods. In IOP Conference Series: Materials Science and Engineering; IOP Publishing: Prague, Czech Republic, 2019; Volume 471, p. 042022. [Google Scholar]
  40. ASTM. Standard Test Methods for Modulus and Damping of Soils by Resonant-Column Method; D4015-07; ASTM International: West Conshohocken, PA, USA, 2007. [Google Scholar]
  41. Anderson, D.G.; Richart, F.E. Effects of straining on shear modulus of clays. ASCE J. Geotech. Eng. Div. 1976, 102, 975–987. [Google Scholar]
  42. Kokusho, T.; Yoshida, Y.; Esashi, Y. Dynamic properties of soft clay for wide strain range. Soils Found. 1982, 22, 1–18. [Google Scholar] [CrossRef]
  43. Jardine, R.J. Some observations on the kinematic nature of soil stiffness. Soils Found. 1992, 32, 111–124. [Google Scholar] [CrossRef]
  44. Ishibashi, I.; Zhang, X. Unified dynamic shear moduli and damping ratios of sand and clay. Soils Found. 1993, 33, 182–191. [Google Scholar] [CrossRef]
  45. Zhang, J.; Andrus, R.D.; Juang, C.H. Normalized shear modulus and material damping ratio relationships. J. Geotech. Geoenviron. Eng. 2005, 131, 453–464. [Google Scholar] [CrossRef]
  46. Saxena, S.K.; Reddy, K.R. Dynamic Moduli and Damping Ratios for Monterey No. 0 Sand by Resonant Column Tests. Soils Found. 1989, 29, 38–51. [Google Scholar] [CrossRef]
  47. Michaelides, O.; Gazetas, G.; Bouckovalas, G.; Chrysikou, E. Approximate non-linear dynamic axial response of piles. Geotechnique 1998, 48, 33–53. [Google Scholar] [CrossRef] [Green Version]
  48. Park, D.; Stewart, H.E. Suggestion of Empirical Equations for Damping Ratio of Plastic and Non-Plastic Soils Based on the Previous Studies. In Proceedings of the International Conferences on Recent Advances in Geotechnical Earthquake Engineering and Soil Dynamics, San Diego, CA, USA, 26–31 March 2001. [Google Scholar]
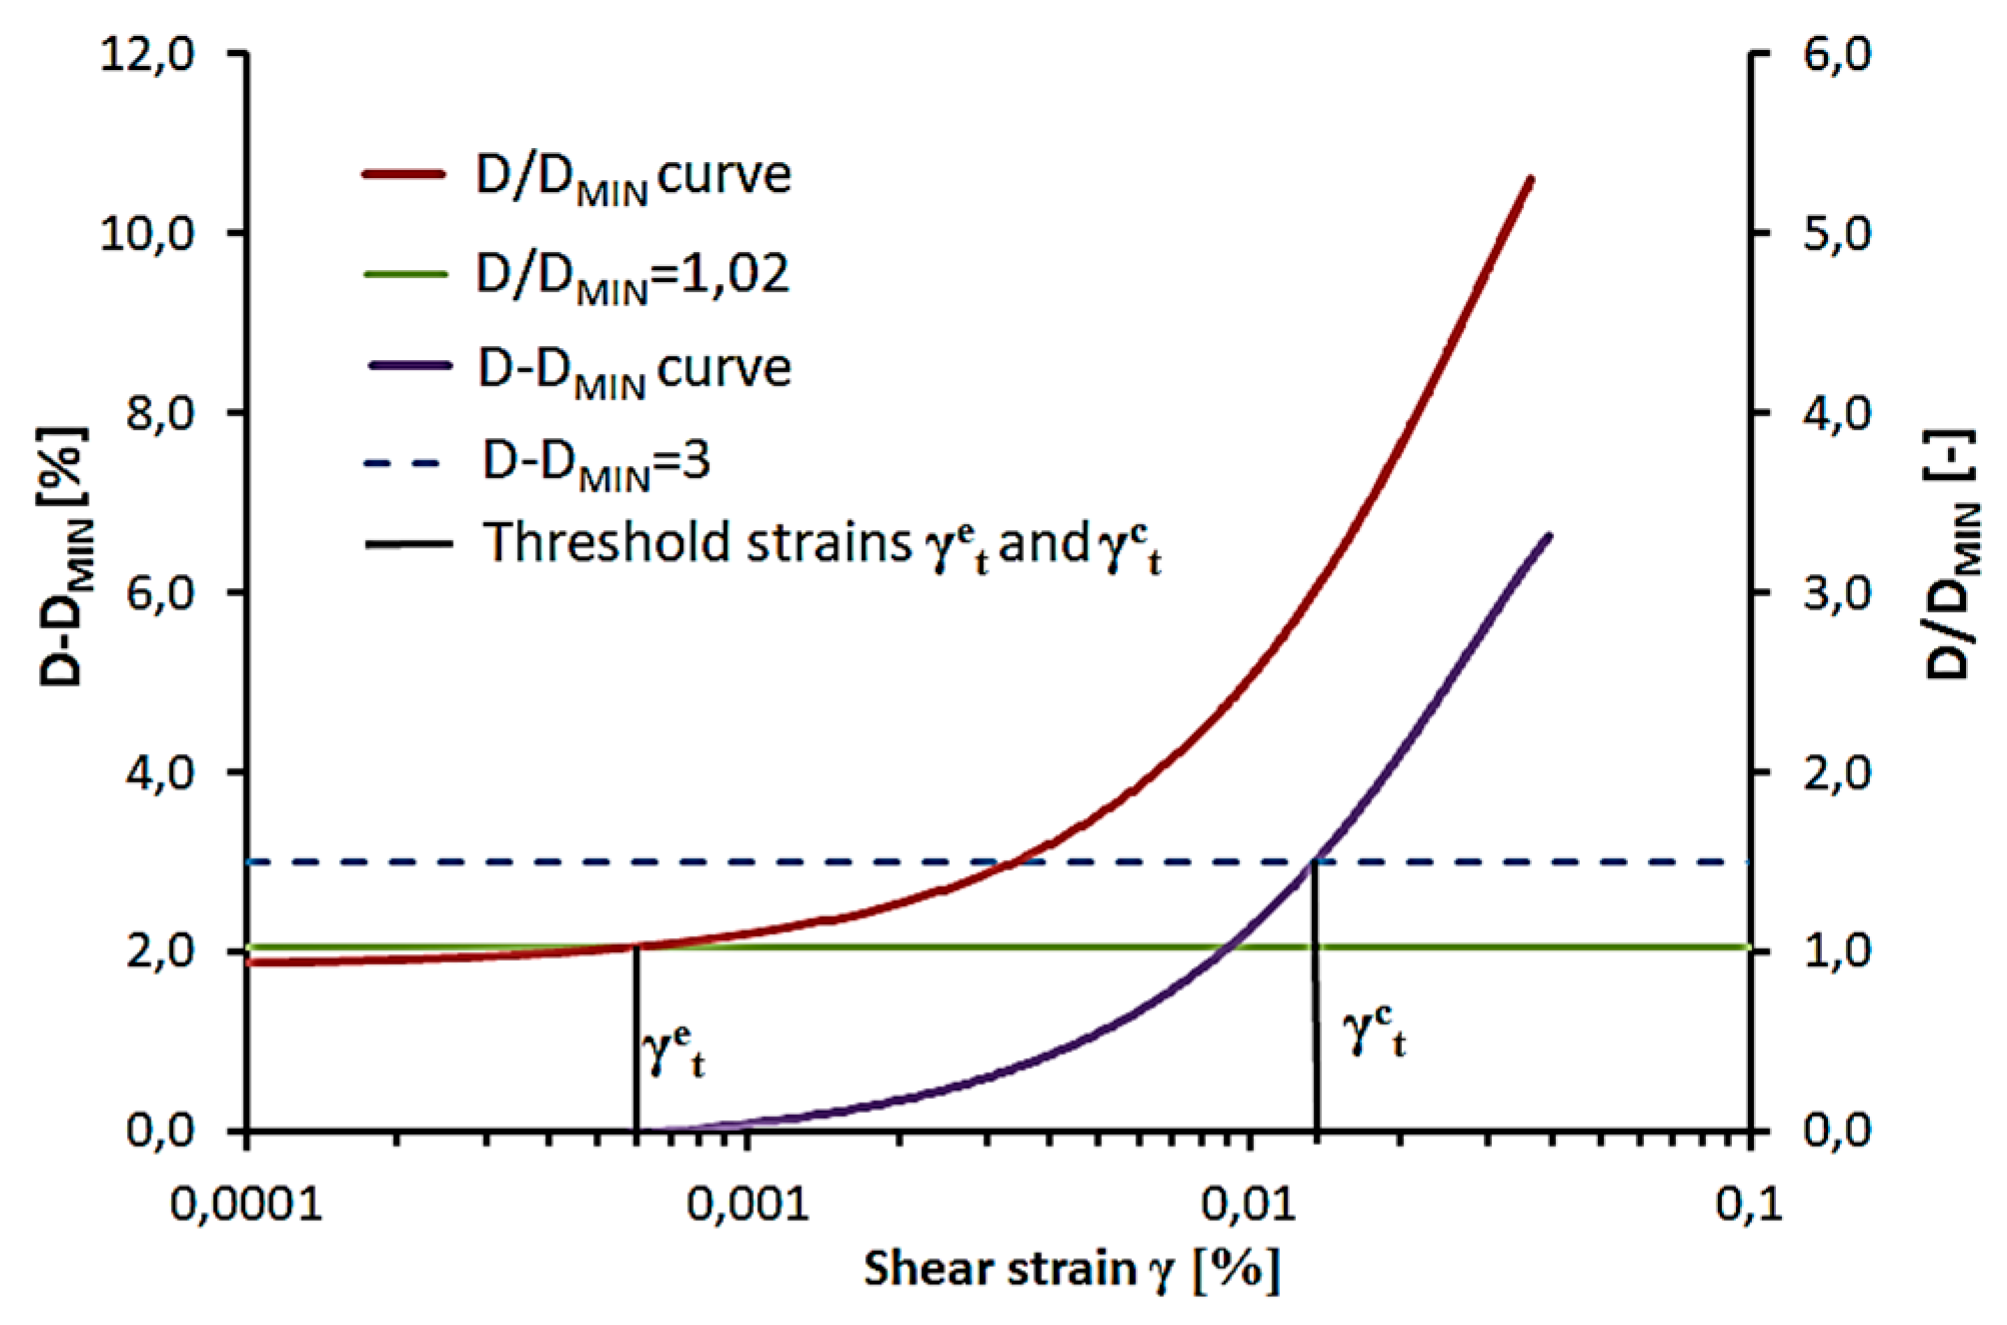
Figure 1. Definition of threshold strains based on D-DMIN and normalized D/DMIN curves.
Applsci 09 04518 g001
Figure 2. The effect of isotropic effective stress on (a) minimal damping ratio (DMIN) [22] and (b) damping ratio (D) curves [25].
Applsci 09 04518 g002
Figure 3. Effect of plasticity index (PI) (%) on (a) damping ratio curve [16] and (b) threshold strains γet and γct [30].
Applsci 09 04518 g003
Figure 4. The localization of geotechnical sites in Warsaw (https://www.google.pl/maps).
Applsci 09 04518 g004
Figure 5. Grain-size distribution curves for tested cohesive soils.
Applsci 09 04518 g005
Figure 6. Examples of damping ratio curves dependant on shear strain for three tested soils: K2, K6, and K13.
Applsci 09 04518 g006
Figure 7. Minimal damping ratio (DMIN) dependant on effective stress (p’) for tested soils.
Applsci 09 04518 g007
Figure 8. Damping ratio (D) dependant on shear strain (γ) for sample K8.
Applsci 09 04518 g008
Figure 9. Minimal damping ratio (DMIN) depending on plasticity index (PI) for tested soils.
Applsci 09 04518 g009
Figure 10. Examples of damping ratio curves compared to Vucetic and Dobry curves [16] (a) and examples of normalized damping ratio curves (b) for soils (K4, K7, K13, and K15) with a different plasticity index (PI).
Applsci 09 04518 g010
Figure 11. Minimal damping ratio (DMIN) against void ratio (e) (a), and minimal damping ratio (DMIN) divided by the square root of effective stress (p’) (b).
Applsci 09 04518 g011
Figure 12. Measured versus calculated damping ratio with model purposed by (a) authors of this article, (b) Ishibashi and Zhang [44], (c) Park and Stewart [48], (d) Michaelides et al. [47], and (e) Zhang et al. [45], with Measured = Calculated (red dashed line) and ±20% error lines (black dashed lines).
Applsci 09 04518 g012
Figure 13. Box–plot chart with the average value of damping ratio for the entire result set (the smallest square), average value ± standard deviation (box), and minimum and maximum value of damping ratio (whiskers) for measured and calculated damping ratio.
Applsci 09 04518 g013
Table 1. Importance of various parameters to damping ratio [12,14] and the effect of the increase of various parameters on damping ratio [13] of cohesive soils.
ParametersImportance to Damping Ratio, According toIncreasing ParametersEffect on Damping Ratio, According to [13]
[12][14]
Strain amplitude******Confining pressure (σ0)Stays constant or decreases with σ0
Effective stress******Void ratio (e)Decreases with e
Void ratio****Geologic age (tg)Decreases with tg
Number of loading cycles******+Cementation (c)May decrease with c
Degree of saturation-*Overconsolidation ratioNot affected
Overconsolidation ratio ***Plasticity index (PI)Decreases with PI
Frequency of loading****Cyclic strain (γc)Increases with γc
Time effect**-Frequency of loading (f)Stays constant or may increase with f
Grain characteristic**Number of loading cycles (N)Not significant for moderate γc and N
Soil structure*-
Soil type and plasticity-***
*** very important, ** important, * less important, + soil type-dependent, - not studied.
Table 2. Basic properties and mean effective stress range for tested cohesive soils.
Test SiteTest
No.
Depth (m)Soil Type
[33,34]
WC (%)LL (%)PL (%)PI (%)p’ (kPa)e0 (-)OCR (-)
BartyckaK12.5saCl11.7522.1011.5010.6050–2000.4052.8–1
K21.5sasiCl18.8532.7515.9616.8030–3900.5621.00
K31.7clSa14.4321.2012.248.9635–2100.4361.00
PełczyńskiegoK46.0clSa11.0617.7011.106.6060–2400.3223.33–1
K54.5sasiCl17.4136.5014.1022.40900.4781.00
K67.5sasiCl10.7624.5012.4712.0375–4150.3042.13–1
PoryK76.0siCl17.5337.2517.1420.10120-410–1200.4731–3.42
K88.5siCl19.8444.6019.4925.1085–3100.5912–1
PełczyńskiegoK92.2saCl12.2337.0011.4525.6045–3150.3651.00
K102.2clSa15.5741.7014.2627.4090–3150.4031.00
K112.2clSa10.5018.209.109.1045–3150.4291.00
PoryK127.2siCl21.9851.2723.6527.60145–2900.5951.38–1
K138.0siCl22.9563.5026.8236.70160–3200.6341.25–1
K149.5Cl26.0470.9533.1137.8095–2850.7476.32–2.11
PełczyńskiegoK152.7sasiCl12.6827.1012.3214.8055–165–550.3891–3
Notes: WC—initial water content, LL—liquid limit, PL—plasticity limit, PI—plasticity index, p’—mean effective stress, e0—initial void ratio, and OCR—overconsolidation ratio.
Table 3. Results of threshold strains γ t e and γ t c investigation of tested soils.
Test
No.
p’
(kPa)
PI
(%)
γ t e   ( % ) γ t c
(%)
Test
No.
p’
(kPa)
PI (%) γ t e   ( % ) γ t c
(%)
K150–20010.600.0012n.e.*K945–31525.550.00180.014
K230–39016.790.00090.015–0.023K1090–31527.440.00080.0041–0.011
K335–2108.960.00080.007–0.014K1145–3159.100.00120.011–0.016
K460–2406.600.00050.0045K12145–29027.620.00190.022
K59022.40.00120.03K13160–32036.680.00240.04
K675–41512.030.00100.012–0.02K1495–28537.840.00110.007–0.02
K7120–41020.110.00190.021–0.034K1555–16514.780.00130.013–0.022
K885–31025.110.00160.04
Notes: p’—mean effective stress, PI—plasticity index, γ t e —the nonlinearity threshold strain, and γ t c —degradation threshold strain. * Not examined.
Table 4. Averaged statistical parameters calculated for measurements of the damping ratio (D) of all tested samples.
No.K1K2K3K4K5K6K7K8K9K10K11K12K13K14K15Avr.
S0.210.160.190.210.080.140.060.090.110.090.130.100.100.080.100.12
I0.640.480.590.640.240.420.190.230.340.260.370.290.290.240.280.37
W0.070.030.050.080.010.030.010.010.010.010.040.010.010.010.010.03
M4.902.705.305.943.394.032.332.725.142.856.484.114.34.435.24-
SE0.070.050.060.070.030.040.020.030.040.030.040.030.030.030.030.04
AE0.170.120.150.110.070.110.050.070.090.070.10.090.080.070.080.09
RE3.554.412.612.641.532.661.423.671.942.001.312.231.461.461.442.29
Notes: S—standard deviation, I—interval, W—variation, M—median, SE—standard error of the mean value, AE—absolute measurement error, RE—relative measurement error [%], and Avr.—average value of each statistical parameter referred to all specimens.
Table 5. Correlation matrix for low, medium, and very cohesive soils.
Low and Medium Cohesive Soil PI < 20%Very Cohesive Soil PI > 20%
PI
(%)
p’
(kPa)
e
(-)
γ
(%)
G/GMAX
(-)
D
(%)
PI
(%)
p’
(kPa)
e
(-)
γ
(%)
G/GMAX
(-)
D
(%)
PI (%)1.000.060.650.000.07−0.441.00−0.130.580.07−0.160.27
p’ (kPa)0.061.00−0.27−0.200.20−0.28−0.131.00−0.02−0.220.26−0.38
e (-)0.65−0.271.00−0.040.04−0.280.58−0.021.00−0.070.13−0.07
γ (%)0.00−0.20−0.041.00−0.880.850.07−0.22−0.071.00−0.830.88
G/GMAX (-)0.070.200.04−0.881.00−0.88−0.160.260.13−0.831.00−0.93
D (%)−0.44−0.28−0.280.85−0.881.000.27−0.38−0.070.88−0.931.00
Table 6. The comparison of absolute error (AE), relative error (RE (%)), average values of these errors (Avr.), and coefficient of determination (R2) for the analyzed models.
No.Authors model,
Equation (5)
Ishibashi and Zhang [44], Equation (6)Park and Stewart [48], Equation (7)Michaelides et al. [47], Equation (8)Zhang et al. [45], Equation (9)
AEREAEREAEREAEREAERE
K10.224.74.5193.31.5431.42.0342.93.3970.8
K20.267.72.4585.00.5620.40.2518.61.1948.7
K30.467.35.5396.72.3439.82.6948.74.1574.2
K40.6810.55.9697.12.4239.82.3343.24.0368.3
K50.174.63.0776.40.003.80.2520.81.1542.3
K60.235.04.0993.91.0021.81.4336.42.9169.2
K70.217.42.1877.90.8036.00.6321.40.8340.6
K80.3311.81.2466.81.4278.80.8738.80.3934.6
K90.497.73.2060.60.0222.51.0525.80.3825.4
K100.5711.12.0064.40.8621.40.8331.50.1058.5
K110.526.77.1893.22.3530.91.1428.33.0549.7
K120.7718.42.7859.10.0431.90.8819.00.6122.1
K130.7013.31.9346.90.1810.90.3830.70.7839.8
K140.6114.22.8364.40.8318.30.9232.02.1651.5
K150.468.95.4684.20.9615.50.1820.31.4235.2
Avr.0.459.33.6377.31.0228.21.0630.61.7748.7
R20.960.210.790.780.77