Abstract
To optimize the rigidity and dynamic mechanical properties of a sawing machine and improve its processing quality and stability, a design method for the sawing machine’s gearbox was proposed. First, a lightweight design of the gearbox was realized by topology optimization. Second, the sensitivity of different design variables of the new gearbox was determined via sensitivity analysis of the objective function. Finally, multi-objective optimization was used to obtain the optimal solution for the gearbox. Considering the complexity of the internal structure of the gearbox assembly and the accuracy of the numerical calculation process, a modeling method with mass points was proposed. A comparison between the numerical calculation results and the operation mode analysis revealed that the former was accurate and can be applied to the verification of the optimized gearbox. By optimizing the vibration signals before and after, and the analysis of the end face quality of the workpiece, the results revealed that the optimized gearbox has a significantly reduced amplitude under various operating conditions. In addition, the vibration stability was improved, and the end face quality of the workpiece was significantly enhanced compared to that before optimization. This study serves as a theoretical reference for multi-body dynamics modeling and optimization of machine tools, and also outlines technical solutions for high-speed stable cutting with sawing machines.
1. Introduction
Circular sawing machine cutting is an important operation in the processing of mechanical parts. Sawing is achieved by combining the feed motion of a gearbox with the rotary motion of a circular saw blade, as shown in Figure 1. A circular sawing machine cutting has the characteristics of a small incision, high efficiency, and the absence of heat-affected zones. Moreover, it has significant advantages in reducing the consumption of metallic raw materials and minimizing environmental impact. Therefore, it is suitable for use with hard-cutting materials. This equipment is widely used in steel processing, machinery fabrication, automobile design, shipbuilding, the aerospace industry, and other fields. With the improvement of production efficiency, high-speed sawing machines have gradually become an indispensable tool in metal processing [1,2,3,4,5]. The gearbox is an important component of a high-speed sawing machine. Moreover, its vibration performance directly affects the dynamic characteristics of the sawing machine, which in turn affects the sawing accuracy and service life of the saw blade. Given the critical importance of the effect of vibrations in these instruments, research in this field has attracted increasing attention from scholars [6,7,8].
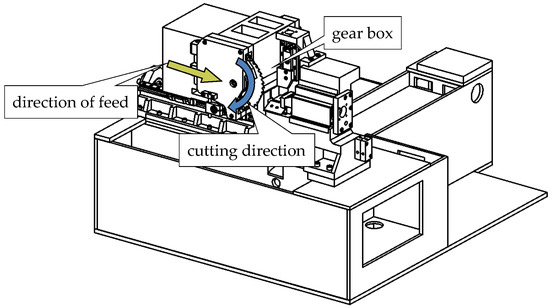
Figure 1.
Structural layout of horizontal circular sawing machine.
The gearbox is mainly composed of shafts, bearings, gear pairs, and a box body. When a pair of gears engage, meshing impact occurs in the process of operation. This results in vibration noise that corresponds to the meshing frequency of the gears. The origin of this problem is errors in the pitch and tooth profile. In addition, a range of friction noise is also generated due to the relative sliding between tooth surfaces [9,10,11]. If the design of the gearbox is defective, unpredictable results may occur when the gearbox is in operation. If the vibration frequency of the gear train is close to the natural frequency of the box, the possibility of resonance increases, resulting in the creation of small ripples on workpieces and a reduction of the production quality. Violent vibration of the gearbox has an important impact on the machine tool itself, and the operating environment [12,13,14]. Therefore, the minimization of the vibrations and noise of the gearbox under working conditions is a critical unresolved problem.
In the motion transmission system of the gearbox, the transmission route of vibration energy follows a particular path. Specifically, the vibrations of the gear meshing are transmitted to the shaft, then along the shaft to the bearing, and finally from the bearing to the box. Related studies on this process suggest that 90–95% of radiated sound energy is transmitted along this pathway [15,16,17,18]. Therefore, structural optimization design of the gearbox is an important factor in the reduction of vibration and noise.
At present, extensive research has been conducted on the optimization design of the gearbox. Gu et al. [19] used topology optimization to optimize the target structure, and built a new structure model based on the original structure. Jiang et al. [20] proposed several robust optimization design methods. Compared to traditional optimization schemes, robust optimization design improves the performance of a system at the expense of mass and maximum vibration amplitude. Li et al. [21] introduced a physical programming method to the robust design method, and focused on optimizing gearbox design according to demand, based on sensitivity analysis. Wang et al. [22] introduced the food chain conduction response algorithm for gearbox optimization, and improved the comprehensive optimization performance of the algorithm based on the transmission mechanism of the middle layer of the food chain. Liu et al. [23] proposed a hybrid user-defined element method (HUELM) to analyze the coupling dynamic characteristics of the gear transmission process. They developed the dynamic vibration model and obtained modal parameters of the gear transmission system under different working conditions. Belingardi et al. [24] proposed a multi-body dynamic modeling and analysis method for gearbox power transfer, which can obtain the dynamic frequency response function and transmission error of the system.
Based on a review of the literature in the field, it can be determined that the introduction of sensitivity into the optimization of the gearbox can improve the efficiency of this process. Using different optimization algorithms for multi-objective design variables, this technique is useful in the determination of an optimal solution [25,26,27,28]. According to the aforementioned literature, it is evident that an effective method for the optimized design of the gearbox, which facilitates lightweight design with high stiffness while improving design efficiency, is not currently available. In addition, when an optimization algorithm is used to obtain a solution, many working conditions are often ignored, resulting in a deviation between the final optimization result and actual performance.
Considering these problems, an optimization design method that combines topology optimization, sensitivity analysis, and response surface optimization is hereby proposed. First, a topology design is used to realize a lightweight gearbox structure. Through the calculation of sensitivity, the sensitivity of each size design variable to the natural frequency of the box is determined. Based on the calculation results, the first five design variables with the greatest influence on the gearbox are selected. A response surface model is then established for these five design variables, and they are optimized using the response surface optimization algorithm. Using operational modal analysis, the frequency range for which resonance of the gearbox is likely to occur during the actual working process is determined. The running modal analysis provides data support for the modal simulation of introducing the quality point and provides a basis for modal simulation verification of the optimized gearbox.
This report is divided into multiple sections. Section 2 introduces the theoretical basis of topology optimization, sensitivity analysis, and multi-objective optimization. Section 3, explains how structural optimization of the gearbox is performed using the approaches described in Section 2. In Section 4, a comparative experiment was conducted and the optimization results are discussed. The main conclusions are summarized in Section 5.
2. Theoretical Basis
2.1. Topology Optimization Based on Variable Density Method
The variable density method is proposed based on the uniform method. The main idea of the variable density method is that the density of a hypothetical material is variable, and the relationship between the macroscopic properties of the material (such as the allowable stress) and the density of the material is assumed. The topology optimization problem is transformed into the material distribution optimal problem. In the variable density method, the material interpolation method is used to solve the problem of topology optimization discrete variable discontinuity. The mathematical expression of the material interpolation formula is given as follows:
In Equation (1), i represents each unit number; x represents the density of the unit (design variable); p represents the material penalty index; Ei represents the unit elastic modulus corresponding to the design variable x; and E0 and Emin represent the elastic moduli of the unit density as a solid material and void material, respectively. Under the boundary condition and volume constraint, the mathematical model for topology optimization based on the variable density method for structural flexibility is shown in Equation (2).
In Equation (2), C is the average flexibility of the overall structure; K is the overall stiffness matrix; U is the displacement vector of the structure; n is the number of global elements; u is the element displacement vector; k0 is the stiffness matrix with a cell density of 1; F is Node load vector; V(x) is the optimized volume; V* is the volume constraint; and xmin is the minimum of the cell density. Considering the structural characteristics of the gearbox and the reliability of the calculation of the solution, topology optimization based on the variable density method was selected in this investigation.
2.2. Sensitivity Analysis Theory
Sensitivity analysis refers to the degree to which a change of structural design parameters affects the objective performance function. The expression for sensitivity analysis is as follows:
In Equation (3), the former is the differential sensitivity of a continuous system and the latter is the differential sensitivity of a discrete system. Sensitivity quantifies the influence of a parameter change on the change of the objective function [29,30,31,32]. In the process of sensitivity analysis optimization, the designer selects effective design parameters quickly and purposefully according to actual needs to improve the optimization efficiency [33,34,35,36].
In the sensitivity analysis of the gearbox structure, the objective function is the modal frequency, and the variable parameters are the thickness of the panels and stiffeners. The mathematical models for the modal frequencies and the dimension parameters of the structures can be expressed as follows:
In Equation (4), f is the modal frequency, g represents the function of the modal frequency to the dimension thickness, and x1, x2, ..., xn is a dimension variable of the structure. By calculating the partial derivative of the modal frequency to the variables, the corresponding sensitivity can be obtained. The mathematical expression is as follows:
In Equation (5), Sfi is the sensitivity of the structure size to the modal frequency. The larger the absolute value of the sensitivity, the greater the influence of the size variable on the objective function. It is also evident from the formula that the value of the sensitivity can have a positive or a negative sign. Therefore, the influence of the size variable on the objective function may decrease with the increase of the size variable, while the sensitivity response represents the speed of the change.
In structural modal analysis, the low-order mode has a great influence on the dynamic characteristics of the structure. Therefore, the weighted average F of the first five modal frequencies is extracted as the objective function, as follows:
In Equation (6), f1, f2, f3, f4, and f5 correspond to frequencies 1 to 5 respectively, and 0.3, 0.25, 0.2, 0.15, and 0.1 are the respective weighting factors that correspond to the first to the 5th modal frequencies.
If the first five order modal frequencies of the gearbox have a linear relationship with respect to the change of the size parameters, the fitting equation is given as follows:
In Equation (7), represents the regression value; αk, βk represents the regression coefficient; xi represents the amount of change in the design variable; and k represents the k-th design variable.
The residual is defined as the difference between the regression and experimental values. To achieve a convenient solution, the difference between the regression and experimental values is squared. If the result satisfies the minimum value, the fitting effect is optimal. The expression used to perform this calculation is as follows:
In Equation (8), fi represents the experimental value. To achieve the best fitting effect, the least square method is applied. The partial derivatives of Equation (8) are calculated for αk and βk respectively, and the result of these equations is 0. The expressions for the partial derivative are as follows:
Further analysis yields the following results:
The binary expressions of Equation (10) can be solved as follows:
In the Equation (11), and represent the arithmetic mean of the size change and that of the modal frequency, respectively. Based on this method, the sensitivity of the first five natural frequencies to all the dimensional variables is calculated as follows:
Thus, the calculated βk value is the sensitivity value.
2.3. Multi-Objective Optimization Based on the Response Surface
The response surface method (RSM) is a response surface model that uses experimental design theory to test a set of designated design points to obtain the objective function and constraint function. It is widely used in complex mechanical structure optimization problems, such as the transmission gearbox. RSM is derived from the design of the experiment and the response surface assessment, which has the advantage of low resource utilization. Based on the complexity of the structure of the saw machine gearbox response surface optimization is an optimization method of the multi-objective genetic algorithm (MOGA) based on the Kriging model. The Kriging model is based on sample points and response values, and uses the method of fitting response surface to predict the response values of non-sample points [37,38,39,40].
In this report, the Kriging model was used to fit the response surface function, and the functional relationship between the response value and independent variable [41,42] can be described as follows:
where x is the m-dimensional input variable and y(x) is the l-dimensional output response. The value F(β,x) is the regression model; β is the coefficient of the regression model; f(x) is the p-order linear polynomial regression model set; and Z(x) is a random process. In the process of optimum design of the gearbox, the dimension variables calculated based on the sensitivity are taken as sample points, and the modals of each order are taken as the response values.
MOGA is often used to solve multi-objective optimization problems, and ultimately, a set of optimal solutions is obtained. Considering the insufficient stiffness of the gearbox and the requirement of lightweight design, the mathematical model can be expressed as follows:
In Equation (14), y1(x), y2(x), and y3(x) are the first, the second, and n-modes of the gearbox, respectively; m(x) is the total mass of the gearbox; m0(x) is the upper limit value of the gearbox; xU and xL are the upper and lower limits of the design variable vectors, respectively; and x is the design variable vector (decision vector). By combining the Kriging model with the MOGA algorithm, the multi-objective function can be solved, and the response surface model of the design variables and the objective function of the gearbox can be determined.
3. Gearbox Structure Optimization
3.1. The Composition of the Gearbox
The sawing gearbox investigated in this report contains five transmission shafts, including the input shaft, first differential shaft, second differential shaft, output shaft, and brake shaft. The input shaft is connected to the power source via a belt, and the output shaft is mounted to the circular saw blade. The input shaft transfers the motion to the output shaft after reducing the speed, and increases the output torque to facilitate the sawing of metal samples. The gearbox housing and side plates are made of gray cast iron with a density of 7200 kg/m3, a Young’s modulus of 75 Gpa, and a Poisson’s ratio of 0.28. The side plates are connected to the gearbox housing by bolts and pins. Considering the need for numerical calculations, the features with less impact are simplified [43,44,45], and the resulting gearbox physical model is shown in Figure 2.

Figure 2.
Schematic diagram of gearbox structure: 1-lateral plate, 2-bearing, 3-gear, 4-output shaft, 5-gearbox, 6-input shaft, 7-differential shaft.
3.2. Topology Optimization
In this report, ANSYS numerical simulation software was used to numerically simulate the box, and to quantify the problems involved in the structure optimization process. Based on the acquired data, the potential problems can be identified and data support can be provided for the optimization direction of the box. Modal analysis of the numerical calculations of multi-body dynamics of mechanical structures is a relatively basic linear dynamic analysis method used to describe the frequency characteristics of structures, including the natural frequencies and modes of participation.
Considering the aforementioned challenges, a numerical model for the sawing gearbox was established, as shown in Figure 3. The geometrical dimensions and material parameters were initially set according to the specifications of the manufacturing process of the gearbox. For the holes and parts near the model boundary, stress concentration can easily occur, and local refinement was performed. The numerical model grid has a total of 99,774 nodes and 61,174 solid elements, and is verified by grid independence.
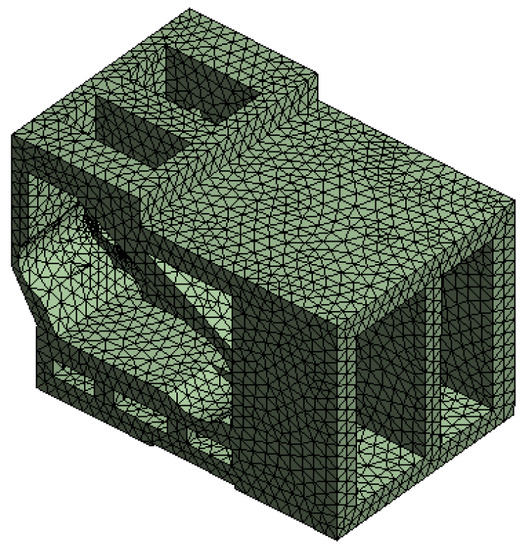
Figure 3.
Gearbox numerical model.
The contact position between the gearbox and slider is imposed as a completely fixed constraint, which limits the model base to six degrees of freedom in the X, Y, and Z directions, and satisfies the initial structural optimization requirements [46,47]. Considering the significant reduction in the computational burden due to the meshing of various parts in the assembly, the conservation of computing resources, and accuracy of the solution, the calculation model is solved using this approach by adding point mass [48,49]. The mass and centroid coordinates of the transmission shaft (including bearings, gears and other components) are determined by the physical model of the gearbox. The mass and centroid coordinates are added to the gearbox as point masses, as shown in Figure 4.

Figure 4.
Mass point distribution of gearbox.
Based on this method, the original ten-order modes of the gearbox before optimization can be obtained, as shown in Table 1.

Table 1.
Original box body modal before structure optimization.
When the frequency of the external excitation is close to the value in the table, the possibility of large vibration deformation of the structure is relatively high. In this instance, resonance may occur, which causes extreme damage to the structure. Therefore, frequency values close to that listed in the table should be avoided in engineering design.
According to the calculation formula of saw cutting force, the maximum saw cutting force can be obtained when circular saw blade saws circular bar. Considering the safety factor, the sawing force is 1500 N, and the direction is the negative direction of the feed. The saw blade is mounted on the output shaft, and the shaft and box are installed using bearings. The force diagram of the output shaft can be established. Based on calculations, the reaction forces of the two bearings are obtained as 334.69 N and 1030.64 N, respectively. Considering the sawing force as resistance, the direction of the force acting on the gearbox can be determined according to the relationship between the force and reaction force. By adding force according to the actual working conditions, the bearing load and unilateral force are selected, i.e., the left semicircular surface bears the bearing load, and the force is shown in Figure 5.
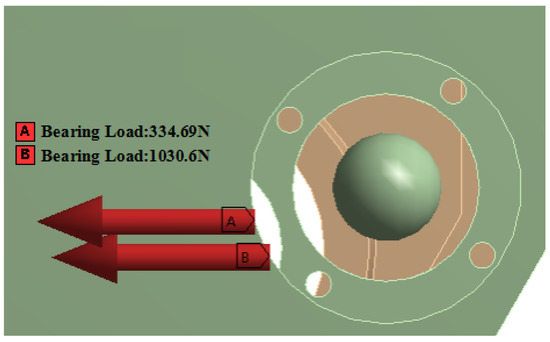
Figure 5.
Gearbox stress situation.
The percentage of materials is the key parameter for topology optimization, which is related to the availability of the optimized topology model and whether structural convergence can be obtained. Based on multiple experiments of topology optimization and according to the actual demand, when the percentage of material reduction is more than 20%, the convergence performance is improved and the actual demand is met. Therefore, this report sets the percentage reduction of the target of the material to 20%. After these settings are implemented, the topology optimization calculation is performed. Figure 6 shows the results of topology optimization after calculation in which orange is a removable material and gray is a retained material.
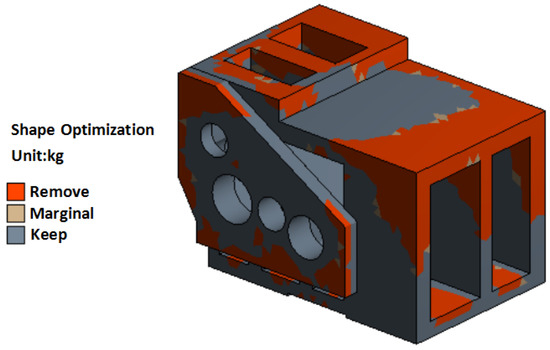
Figure 6.
Optimization results of gearbox topology.
According to Figure 7, considering the impact of the stiffness of the box body and excessive space of the internal cavity on the vibration noise, the largest part of the vibration deformation of the gearbox at the first frequency is concentrated at one end. In addition, using the shape optimization method (SOM) based on the variable density method, it can be determined that the region with the large deformation is the removable part, as shown in Figure 6. According to the results of topology optimization, a lightweight design of the box can be guaranteed without affecting the high stiffness [50,51]. Therefore, a corner of the box is cut as a result of the above consideration. The initially optimized cabinet structure is obtained, as shown in Figure 8.
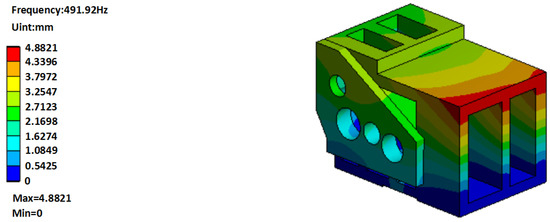
Figure 7.
First-order modal cloud diagram before optimization.
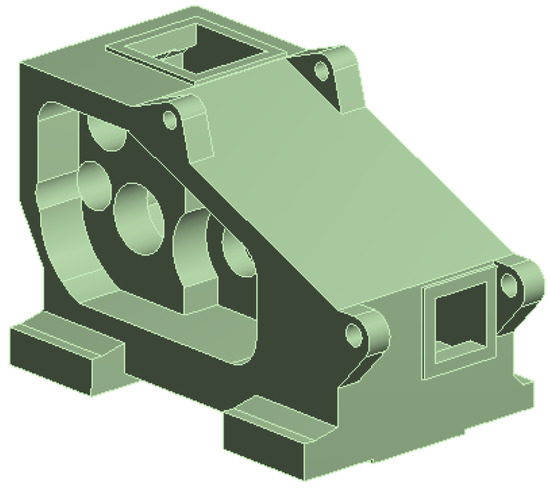
Figure 8.
Gearbox lightweight design results.
3.3. Sensitivity Calculation
In the structural design of the gearbox, the transmission ratio and the number of teeth of each gear should be determined according to the working conditions. The shaft, gear, bearing, and other transmission components should be examined to determine if they meet the service life requirements. The internal structural dimension of the gearbox body is determined by considering the strength, stiffness, and installation requirements of the bearings and gears.
Considering the vibration characteristics of the gearbox housing, the natural frequency is the objective function, the wall thickness and length are the design variables, and the sensitivity of the design variable to the objective function can be determined. In the sensitivity analysis process, 8 design variables, such as the wall thickness, length, and span of the gearbox are selected, as shown in Figure 9, where 1–8 represents P1, P2, P3, P4, P5, P6, P7, and P8 respectively, corresponding to 8 design variables.
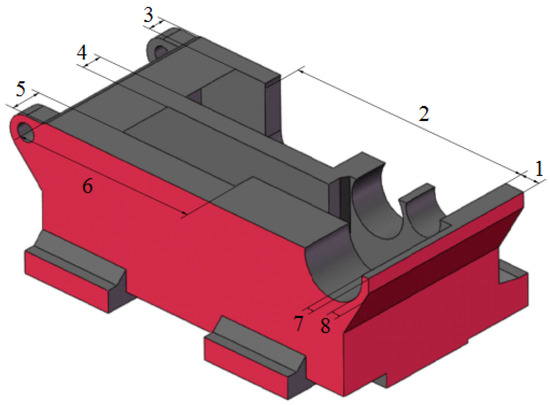
Figure 9.
Sensitivity analysis of the size and variable distribution.
Based on the modal calculation, the relationship between the dimensional change and modality is shown in Figure 10. It is evident from the figure that the modal frequency of the first five steps of the gearbox changes with the size parameter in an approximately linear relationship, which is in accordance with the earlier assumptions.

Figure 10.
Relationship between the size variations and modals.
By substituting the values obtained from the above modal calculation into the Equation (11), the parameters could be calculated, and the results are shown in Table 2.
Table 2.
Regression coefficient values for structure optimization.
When the sensitivity is positive, this indicates that the design variable is positively correlated to the objective function. When the sensitivity is negative, this means that the design variable is negatively correlated to the objective function. It is evident that the natural frequencies of the box decrease with the decrease of the size variable of P1, P2, P6, and P7. The natural frequencies of the box increase with the decrease of the dimensional variables of P3, P4, P5, and P8. The order of the sensitivity of each size variable with respect to the modal frequency of the box is as follows: P4 > P8 > P5 > P7 > P3 > P2 > P6 > P1. Therefore, P4, P8, P5, P7, and P3 were selected as the main design variables for the optimization calculation.
3.4. Multi-Objective Optimization
According to the structural characteristics of the sawing gearbox, the multi-objective genetic algorithm was selected based on the Kriging model to fit the response surface function to the multi-objective optimization of the five main design variables. Taking the design variable as the input and the modal frequency as the output, the sample space was generated, the response surface model was constructed, the input value range was set, the multi-objective optimization of the design variables was completed, and the optimal solution of the design variables of the gearbox was obtained. A comparative analysis of the main design parameters before and after optimization is shown in Table 3.
Table 3.
Comparative results of gearbox design variables before and after optimization.
Modal numerical simulation was performed on the optimized gearbox. This was followed by the application of a fixed constraint at the contact position between the gearbox and slider, and the addition of a mass unit at the bearing installation position. The calculation model was then solved, and the first ten steps modal of the optimized gearbox were obtained. The modal frequency is shown in Table 4.
Table 4.
Gearbox modal frequency after structural optimization.
By comparing the relevant data in Table 1 and Table 4, it can be determined that the optimization of the gearbox at the natural frequency was significantly enhanced. Moreover, the first-order natural frequency increased by approximately 82%, which is far from the possible excitation frequency range in the cutting process.
According to the numerical results shown in Figure 11, the maximum principal stress of the gearbox is 164.74 kPa and the maximum deformation is 0.27454 μm, which is lower than the ultimate compressive strength and tensile strength, and satisfies the design requirements.

Figure 11.
Cloud map of gearbox after optimization. (a) Maximum principal stress and (b) total deformation.
4. Comparative Analysis of Experimental and Optimization Results
4.1. Experimental Data Acquisition
The SD-70R circular saw machine was adopted, and carbide saw blades with a diameter of 285 mm were selected. Gearboxes were installed before and after optimization, and saw cutting comparison experiments were conducted under spray cooling conditions. The main motor of the sawing machine was a 7.5 kW three-phase asynchronous motor, and the workpiece was 45 steel material with a diameter of 70 mm.
The vibration test and analysis platform were built by Leuven Measurement Systems (LMS) of Belgium, and the operational modal analysis of the sawing machine gearbox was conducted to identify the modal parameters of the gearbox. The system composition and test site are shown in Figure 12 and Figure 13, respectively. There are 12 measurement points on the surface of the gearbox. Taking the lower-left corner of the box as the coordinate origin, the X-direction is the saw blade feed direction, the Y-direction is the round steel feed direction, and the Z-direction is the cylinder up and down clamping direction.

Figure 12.
Schematic diagram of test system: 1-mobile workstation, 2-data acquisition front end, 3-coaxial cable, 4-accelerometer, 5-gearbox, 6-sawing machine bed, 7-twisted pair.
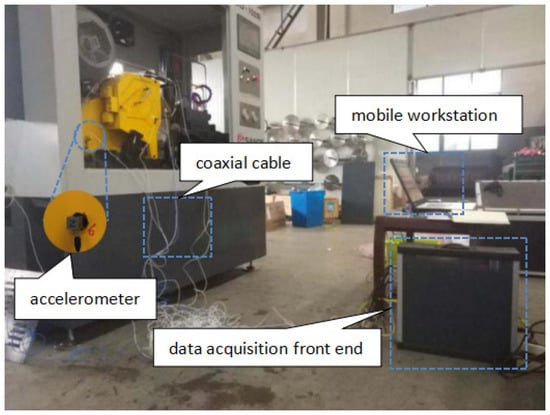
Figure 13.
Physical drawing of the test system.
An integrated piezoelectric sensor was used to acquire the acceleration signal of each component of the gearbox during the sawing process. Based on the layout of the shaft system inside the gearbox, the sensor was arranged closer to the bearing [52,53,54], as shown in Figure 14. The sensor signal was transmitted to the LMS data acquisition front end via a coaxial cable, and the vibration signal was monitored and recorded in real-time. The frequency bandwidth of the vibration signal to be acquired was set to 2560 Hz, the number of lines was set to 8192, the sampling frequency was 25 kHz, and the acquisition time for a set of data was 3.2 s.
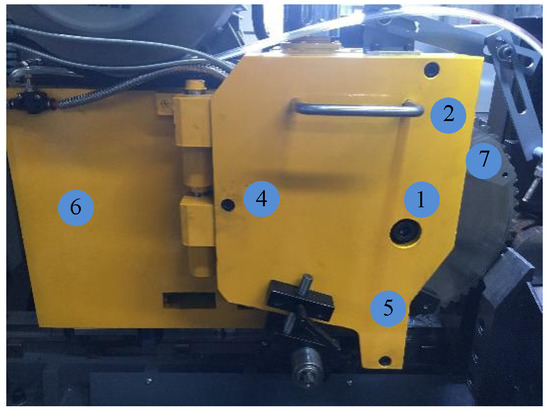
Figure 14.
Location of the measurement points on the gearbox.
In the process of multi-body mechanical structure optimization, a steady-state diagram of the system can be obtained by utilizing the modal analysis method, which can greatly simplify the workload associated with pole selection. Figure 15 shows the steady-state diagram for 70 r/min. In the figure, “s” indicates that the frequency, damping ratio, and vibration mode are stable; “d” indicates that the frequency and the damping ratio are stable; “v” indicates that the frequency and the vibration type are stable; “f” indicates that the frequency is stable, and “o“ represents a new frequency [55,56].
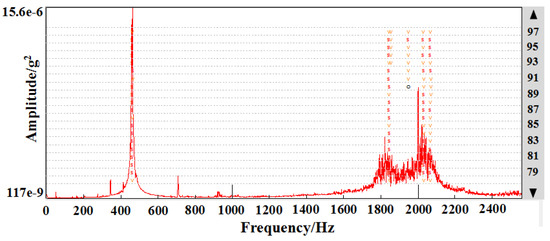
Figure 15.
Steady-state system diagram prior to structure optimization.
In the steady-state diagram, the frequency at which a peak occurs on the cross-spectrum and a stable pole is observed at the peak is considered to be a modal value. Considering that the modal parameters in the steady-state graph have incomplete excitation resonance, these parameters can be obtained for the box under different working conditions. These false modes must be removed because the associated computational errors and signal interference produce spurious modalities. According to the MAC matrix value of the gearbox system, the correlation of each order frequency is determined, and false modes are eliminated [57,58]. The resulting modal frequencies are 460 Hz, 708 Hz, 1653 Hz, 1832 Hz, and 2029 Hz.
As shown in Table 5, comparing the simulation results of the gearbox for modal analysis and finite element calculation before optimization, the frequencies of the first order, third order, tenth order, twelfth order, and fourteenth order are close to each other. This indicates that the mode of the gearbox assembly is calculated by adding the mass point, which has a certain accuracy. Finite element simulation was performed using the same constraint addition method as the technical verification for pre-production, after the optimization of the gearbox.
Table 5.
Comparison between modal analysis and finite element calculation results.
According to the modal frequency obtained from the steady-state diagram, it is easy to induce part of the natural frequency of the box under various working conditions. To improve the gearbox, its natural frequency should be maximized so that resonance does not occur under operating conditions. Therefore, the optimal design of the gearbox should avoid these modal parameters to reduce the probability of resonance in the target system.
An optimized gearbox of the first ten-order modal frequencies is shown in Table 4. By comparing the relevant data in Table 1 and Table 4, it was determined that the gearbox body frequencies are improved after optimization. In addition, the frequency of the gearbox away from 450 Hz, 700–800 Hz, and 1800–2000 Hz, reduces the likelihood of causing resonance, thereby complying with the design requirements.
4.2. Comparison of Experimental Data Before and After Optimization
Based on the requirements for operation of the sawing machine, this study mainly considers a comparison of the experimental data under the three working conditions of idling, 70 r/min, and 90 r/min.
Figure 16 shows the vibration signal waterfall diagram before and after the gearbox improvement under idle conditions. It is evident from the figure that under these conditions, the maximum amplitude of each measurement point for the improved front gearbox in the frequency range of 0–1000 Hz was 0.07 g. Moreover, the maximum amplitude was concentrated in the frequency range of 700–800 Hz. This may be caused by the excitation of the third-order mode of the box under idle conditions. The improved gearbox has a measurement point between 0 Hz and 1000 Hz, and the maximum amplitude is 0.03 g. In addition, there is not a dense peak between the 700 Hz and 800 Hz bands. Therefore, it is evident that the improved gearbox is optimized under idle conditions.

Figure 16.
Gearbox vibration signal waterfall map (Idle): (a) Before optimization, (b) After optimization.
Figure 17 shows the vibration signal waterfall diagram at 70 r/min before and after improvement of the gearbox. The improvement of the high-frequency band is evident, and the amplitude of the vibration was significantly decreased in the high-frequency region of 1600 Hz to 2200 Hz. Although the vibration in the low-frequency band is more apparent, the analysis based on the overall working condition reveals an improvement from the highest amplitude of 0.25 g, before the improvement to 0.16 g.

Figure 17.
Gearbox vibration signal waterfall map (70 r/min): (a) Before optimization, (b) After optimization.
Figure 18 shows the vibration signal waterfall diagram at 90 r/min before and after the gearbox improvement. The improvement of the high-frequency band and the low-frequency band is evident. In the high-frequency region of 1600 Hz to 2200 Hz, the amplitude of the vibration is significantly reduced. There is no regular vibration before 450–500 Hz, and the amplitude of the vibration is reduced by nearly 50%. It is evident that the amplitudes have different degrees of decline under different working conditions, and the 90 r/min working conditions exhibit the most significant decline.
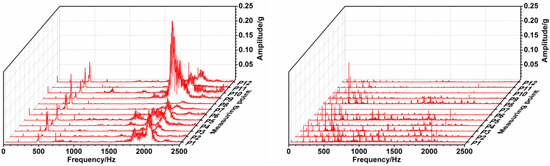
Figure 18.
Gearbox vibration signal waterfall map (90 r/min): (a) Before optimization, (b) After optimization.
The root mean square (RMS) of each measurement point between 0 Hz and 2048 Hz was calculated using LMS, and the vibration under common working conditions was selected, as shown in Figure 18 and Figure 19.
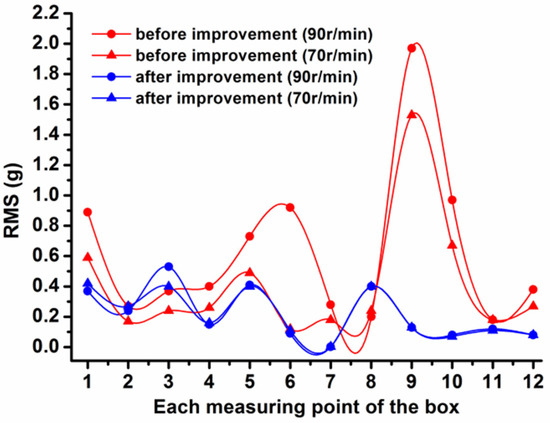
Figure 19.
RMS value of each measurement point before and after optimization (70 r/min).
It is evident from Figure 19 that under the condition of 70 r/min, before optimization, the difference between the maximum value and the minimum value is large, whereas the amplitude difference of each measurement point is small after optimization.
Under the 90 r/min working condition, there were some measurement points with relatively high amplitudes before optimization. However, after optimization, the RMS values of each measurement point were relatively close, and no measurement points with relatively high amplitudes were present.
Comparing the 70 r/min before optimization with the 90 r/min before optimization, the amplitude difference of each measurement point is large, and the fitting degree of the two curves is relatively low. This indicates that the stiffness of the gearbox is relatively low under the condition of 70 r/min. Thus, it is easy for resonance to occur in the gearbox, leading to higher amplitudes.
By comparing the optimized 70 r/min with the optimized 90 r/min, it was determined that the RMS value of each measurement point was relatively close under the two working conditions, and the fitting degree of the curve is relatively high. This indicates that the stiffness of the gearbox is improved under different working conditions, which also improves the running stability of the machine tool.
Figure 20 shows the vibration of each of the No. 10 measurement points before and after optimization. It is evident from the RMS value that the vibration of the 10th measurement point before optimization is most significant under the condition of 70 r/min. Comparing the two curves, under each working condition, the vibration amplitude of the 10th point was greatly reduced before the improvement. From the analysis of the fluctuation of the curve, the improved curve does not have any obvious fluctuations. This indicates that the performance of the gearbox can satisfy the working conditions from 50 r/min to 100 r/min under different cutting conditions.

Figure 20.
RMS values of each measurement point before and after optimization.
Roughness is an indicator of surface quality and quantifies this parameter. In this test, the surface roughness of the workpiece was measured before and after optimization using an optical 3D surface profiler (Ra), and the test results are shown in Table 6. It is evident from the data in the table that the roughness (Ra) of the end face of the workpiece after optimization is improved to a different extent compared to pre-optimization.
Table 6.
Roughness comparison analysis.
Figure 21 and Figure 22 show the 3D surface topography of the workpiece sawing end face. Compared to other working conditions, the quality of the end face was the worst under 70 r/min conditions. Compared to the vibration data in a previous report (Figure 20), the amplitude was the largest under the condition of 70 r/min, which is consistent with the surface topography test results. It is evident from the figure that the optimized surface corrugations are more regular, whereas the surface corrugations before optimization are haphazard with irregular deep pits in some areas. This phenomenon may be due to insufficient rigidity of the circular sawing machine, which leads to the occurrence of flutter during the sawing process. Comparing the surface topography before and after optimization, the cutting quality of the optimized circular sawing machine was obviously improved compared to pre-optimization.

Figure 21.
3D surface topography before and after optimization (70 r/min): (a) Before optimization, (b) After optimization.
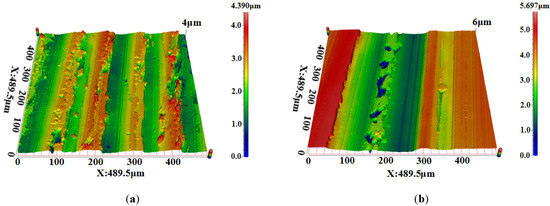
Figure 22.
3D surface topography before and after optimization (90 r/min): (a) Before optimization, (b) After optimization.
5. Conclusions
To optimize the rigidity and dynamic mechanical properties of the sawing machine, and to improve its processing quality and stability, an optimization design method that combined topology optimization, sensitivity analysis, and response surface optimization was proposed. The main conclusions are as follows:
- (1)
- Simulating the modal parameters of the gearbox via the addition of mass points, it was determined that the calculated modality has a good correlation with the operational modal analysis.
- (2)
- By optimizing the design of the gearbox via topology optimization, sensitivity analysis, and response surface optimization, the quality of this component was reduced by 19% compared to the pre-optimized gearbox, and the natural frequencies of each step were significantly increased, thereby reducing the possibility of resonance.
- (3)
- The results for the sawing comparison experiments revealed that, under the same working conditions, the amplitude of the optimized gearbox was significantly reduced, the sawing process was more stable, and the dynamic performance of the gearbox was significantly improved.
In summary, the main scientific contribution of this investigation is the application of the combined techniques of topology optimization, structural sensitivity, and response surface optimization to a complex structural design, as an effective lightweight design method. Subsequent research work will focus on multi-component reconstruction optimization and multi-factor information fusion algorithms.
Author Contributions
Methodology, D.T.; formal analysis, Y.W., D.W. (Donghui Wen), C.M. and D.T.; investigation, P.N., Q.L., Y.R. and H.W.; resources, D.W. (Dejie Wang) and C.M.; data curation, D.W. (Donghui Wen) and D.W. (Dejie Wang); writing—original draft preparation, Y.W., P.N., Y.R. and H.W.; funding acquisition, Q.L.
Funding
The authors are grateful for financial support from the following research grants: (1) the Natural Science Foundation of China (grant nos. 51405440, 51775501); (2) the Zhejiang Provincial Science Foundation (grant no. LR16E050001); (3) the Commonweal Technology Project of Science and Technology Department of Zhejiang Province (grant no. 2016C31039); (4) the Growth Plan of Young Teachers in Shandong.
Conflicts of Interest
The authors declare no conflict of interest.
References
- Ogura, I.; Kotake, M.; Ata, S. Quantitative evaluation of carbon nanomaterial releases during electric heating wire cutting and sawing machine cutting of expanded polystyrene-based composites using thermal carbon analysis. J. Occup. Environ. Hyg. 2018. [Google Scholar] [CrossRef]
- Aryafar, A.; Mikaeil, R.; Haghshenas, S.S.; Haghshenas, S.S. Application of metaheuristic algori1thms to optimal clustering of sawing machine vibration. Measurement 2018, 124, 20–31. [Google Scholar] [CrossRef]
- Zeng, X.; Ji, S.M.; Tan, D.P.; Jin, M.S.; Wen, D.H.; Zhang, L. Softness consolidation abrasives material removal characteristic oriented to laser hardening surface. Int. J. Adv. Manuf. Technol. 2013, 69, 2323–2332. [Google Scholar] [CrossRef]
- Tan, D.P.; Ji, S.M.; Jin, M.S. Intelligent computer-aided instruction modeling and a method to optimize study strategies for parallel robot instruction. IEEE Trans. Educ. 2013, 56, 268–273. [Google Scholar] [CrossRef]
- Li, C.; Ji, S.M.; Tan, D.P. Softness abrasive flow method oriented to tiny scale mold structural surface. Int. J. Adv. Manuf. Technol. 2012, 61, 975–987. [Google Scholar] [CrossRef]
- Han, D.; Zhao, N.; Shi, P. Gear fault feature extraction and diagnosis method under different load excitation based on EMD, PSO-SVM and fractal box dimension. J. Mech. Sci. Technol. 2019, 33, 487–494. [Google Scholar] [CrossRef]
- Zhang, L.B.; Lv, H.P.; Tan, D.P.; Xu, F.; Chen, J.L.; Bao, G.J.; Cai, S.B. An adaptive quantum genetic algorithm for task sequence planning of complex assembly systems. Electron. Lett. 2018, 54, 870–871. [Google Scholar] [CrossRef]
- Tan, D.P.; Chen, S.T.; Bao, G.J.; Zhang, L.B. An embedded lightweight GUI component library and the ergonomics optimization method for industry process monitoring. Front. Inf. Technol. Electron. Eng. 2018, 19, 604–625. [Google Scholar] [CrossRef]
- He, C.R.; Qin, W.B.B.; Ozay, N.; Orosz, G. Optimal gear shift schedule design for automated vehicles: Hybrid system based analytical approach. IEEE Trans. Control Syst. Technol. 2018, 26, 2078–2090. [Google Scholar] [CrossRef]
- Ge, J.Q.; Tan, D.P.; Ji, S.M. A gas-liquid-solid three-phase abrasive flow processing method based on bubble collapsing. Int. J. Adv. Manuf. Technol. 2018, 95, 1069–1085. [Google Scholar] [CrossRef]
- Zhang, L.; Yuan, Z.; Tan, D.; Huang, Y. An Improved abrasive flow processing method for complex geometric surfaces of titanium alloy artificial joints. Appl. Sci. 2018, 28, 1037. [Google Scholar] [CrossRef]
- Tan, D.P.; Zhang, L.B. A WP-based nonlinear vibration sensing method for invisible liquid steel slag detection. Sens. Actuators B Chem. 2014, 202, 1257–1269. [Google Scholar] [CrossRef]
- Zeng, X.; Ji, S.M.; Jin, M.S.; Tan, D.P.; Ge, J.Q. Research on dynamic characteristic of softness consolidation abrasives in machining process. Int. J. Adv. Manuf. Technol. 2016, 82, 1115–1125. [Google Scholar] [CrossRef]
- Tan, D.P.; Ji, S.M.; Fu, Y.Z. An improved soft abrasive flow finishing method based on fluid collision theory. Int. J. Adv. Manuf. Technol. 2016, 85, 1261–1274. [Google Scholar] [CrossRef]
- Xu, Z.F.; Shao, R.P. Forecast of sound pressure level of gear systems and fault diagnosis based on acoustics. Comput. Meas. Control 2009, 17, 1688–1691. [Google Scholar]
- Ji, S.M.; Weng, X.X.; Tan, D.P. Analytical method of softness abrasive two-phase flow field based on 2D model of LSM. Acta Phys. Sin. 2012, 61, 188–198. [Google Scholar]
- Zeng, X.; Ji, S.M.; Jin, M.S.; Tan, D.P.; Li, J.H.; Zeng, W.T. Investigation on machining characteristic of pneumatic wheel based on softness consolidation abrasives. Int. J. Precis. Eng. Manuf. 2014, 15, 2031–2039. [Google Scholar] [CrossRef]
- Tan, D.P.; Ji, S.M.; Li, P.Y.; Pan, X.H. Development of vibration style ladle slag detection method and the key technologies. Sci. China Technol. Sci. 2010, 53, 2378–2387. [Google Scholar] [CrossRef]
- Gu, Y.Z.; Zuo, D.W.; Xu, W.M. A modal analysis and optimization of physiotherapy appliance bed structure. Mach. Build. Autom. 2009, 1, 36–39. [Google Scholar]
- Jiang, L.; Xiang, D.; Mou, P.; Shen, Y.H. Study of gearbox’s robust optimization design. Mach. Des. Manuf. 2018, 1, 14–16. [Google Scholar]
- Li, Y.H.; Zang, Q.; Zhang, J. Robust and optimal design of gear box for high speed train. J. Dalian Jiaotong Univ. 2015, 6, 29–33. [Google Scholar]
- Wang, J.T.; Lu, J.G.; Wang, B.X.; Zhao, D.B. Application of the food chain conduction response algorithm in the gearbox optimization. Comput. Integr. Manuf. Syst. 2019, 25, 201–211. [Google Scholar]
- Liu, C.; Fang, Z.D.; Zhang, X.J.; Wang, F.; Jiang, J.K.; Du, J.F. An efficient modeling method for coupled vibration analysis of double-helical gear reduction. Noise Control Eng. J. 2017, 65, 121–137. [Google Scholar] [CrossRef]
- Belingardi, G.; Cuffaro, V.; Cura, F. Multibody approach for the dynamic analysis of gears transmission for an electric vehicle. Proc. Inst. Mech. Eng. C J. Mech. Eng. Sci. 2018, 232, 57–65. [Google Scholar] [CrossRef]
- Xu, H.; Wang, Y.Y.; Wen, D.H. New operational modal analysis method of spindle system based on multiple pulse excitation. J. Mech. Eng. 2014, 50, 175–181. [Google Scholar] [CrossRef]
- Tan, D.P.; Li, L.; Zhu, Y.L.; Zheng, S.; Ruan, H.J.; Jiang, X.Y. An embedded cloud database service method for distributed industry monitoring. IEEE Trans. Ind. Inf. 2018, 14, 2881–2893. [Google Scholar] [CrossRef]
- Li, J.; Ji, S.M.; Tan, D.P. Improved soft abrasive flow finishing method based on turbulent kinetic energy enhancing. Chin. J. Mech. Eng. 2017, 30, 301–309. [Google Scholar] [CrossRef]
- Li, C.; Ji, S.M.; Tan, D.P. Multiple-loop digital control method for 400 Hz inverter system based on phase feedback. IEEE Trans. Power Electron. 2013, 28, 408–417. [Google Scholar] [CrossRef]
- Zhang, L.; Ji, R.Q.; Fu, Y.F.; Qi, H.; Li, H.N.; Tangwarodomnukun, V. Investigation on particle motions and resultant impact erosion on quartz crystals by the micro-particle laden waterjet and airjet. Powder Technol. 2019. In Press. [Google Scholar] [CrossRef]
- Zhang, J.; Zhang, X.L.; Fang, J. Research on modal sensitivity and optimization design for car body of the EMU. J. Mech. Eng. 2018, 54, 93–101. [Google Scholar] [CrossRef]
- Tan, D.; Li, P.; Pan, X. Intelligent industry monitoring network architecture UPnP based. Chin. J. Electron. 2008, 17, 607–610. [Google Scholar]
- Wu, M.G.; Lu, C.D.; Tan, D.P.; Hong, T.; Chen, G.H.; Wen, D.H. Effects of metal buffer layer for amorphous carbon film of 304 stainless steel bipolar plate. Thin Solid Films 2016, 616, 507–514. [Google Scholar]
- Zhao, J.; Jiang, E.Y.; Qi, H.; Ji, S.M.; Chen, Z.Z. A novel polishing method for single-crystal silicon using the cavitation rotary abrasive flow. Precis. Eng. 2019. In Press. [Google Scholar] [CrossRef]
- Li, L.; Tan, D.P.; Yin, Z.C.; Li, D.F.; Zhu, Y.L.; Zheng, S. Ekman boundary layer mass transfer mechanism of free sink vortex. Int. J. Heat Mass Transfer. 2019. In Press. [Google Scholar] [CrossRef]
- Ji, S.M.; Ge, J.Q.; Tan, D.P. Wall contact effects of particle-wall collision process in two-phase particle fluid. J. Zhejiang Univ. Sci. A 2017, 18, 958–973. [Google Scholar] [CrossRef]
- Tan, D.; Li, L.; Zhu, Y.; Zheng, S.; Yin, Z.; Li, D. Critical penetration condition and Ekman suction-extraction mechanism of sink vortex. J. Zhejiang Univ. Sci. A 2019, 20, 61–72. [Google Scholar] [CrossRef]
- Ryu, S.P.; Park, J.Y.; Han, S.Y. Optimum design of an active micro-mixer using successive kriging method. Int. J. Precis. Eng. Manuf. 2011, 12, 849–855. [Google Scholar] [CrossRef]
- Fossati, G.G.; Miguel, L.F.F.; Casas, W.J.P. Multi-objective optimization of the suspension system parameters of a full vehicle model. Optim. Eng. 2019, 20, 151–177. [Google Scholar] [CrossRef]
- Chen, J.L.; Xu, F.; Tan, D.P.; Shen, Z.; Zhang, L.B.; Ai, Q.L. A control method for agricultural greenhouses heating based on computational fluid dynamics and energy prediction model. Appl. Energy 2015, 141, 106–118. [Google Scholar] [CrossRef]
- Tan, D.P.; Li, P.Y.; Pan, X.H. Application of improved HMM algorithm in slag detection system. J. Iron Steel Res. Int. 2009, 16, 1–6. [Google Scholar] [CrossRef]
- Chakraborty, S.; Goswami, S.; Rabczuk, T. A surrogate assisted adaptive framework for robust topology optimization. Comput. Meth. Appl. Mech. Eng. 2019, 346, 63–84. [Google Scholar] [CrossRef]
- Tan, D.P.; Yang, T.; Zhao, J.; Ji, S.M. Free sink vortex Ekman suction-extraction evolution mechanism. Acta Phys. Sin. 2016, 65, 54701. [Google Scholar]
- Zhang, X.Q.; Xiang, C.l.; Liu, H. Topology optimization design of gearbox housing under multiple loading cases. China Mech. Eng. 2011, 22, 1779–1783. [Google Scholar]
- Pelat, A.; Gallot, T.; Gautier, F. On the control of the first Bragg band gap in periodic continuously corrugated beam for flexural vibration. J. Sound Vib. 2019, 446, 249–262. [Google Scholar] [CrossRef]
- Tan, D.P.; Li, P.Y.; Ji, Y.X.; Wen, D.H.; Li, C. SA-ANN-based slag carry-over detection method and the embedded WME platform. IEEE Trans. Ind. Electron. 2013, 60, 4702–4713. [Google Scholar] [CrossRef]
- Kumar, A.; Jaiswal, H.; Jain, R.; Patil, P.P. Free vibration and material mechanical properties influence based frequency and mode shape analysis of transmission gearbox casing. Procedia Eng. 2014, 97, 1097–1106. [Google Scholar] [CrossRef][Green Version]
- Li, Y.B.; Tan, D.P.; Wen, D.H.; Ji, S.M.; Cai, D.H. Parameters optimization of a novel 5-DOF gasbag polishing machine tool. Chin. J. Mech. Eng. 2013, 26, 680–688. [Google Scholar] [CrossRef]
- Zhang, Z.F.; Xu, Z.M.; He, Y.S. Analysis on structure dynamic characteristic of motorcycle frame with engine. Acta Armamentarii 2010, 31, 547–552. [Google Scholar]
- Zhang, L.; Wang, J.S.; Tan, D.P.; Yuan, Z.M. Gas compensation-based abrasive flow processing method for complex titanium alloy surfaces. Int. J. Adv. Manuf. Technol. 2017, 92, 3385–3397. [Google Scholar] [CrossRef]
- Xu, D.K.; Chen, J.; Tang, Y.C.; Can, J. Topology optimization of die weight reduction for high-strength sheet. Int. J. Mech. Sci. 2012, 59, 73–82. [Google Scholar] [CrossRef]
- Pan, Y.; Ji, S.; Tan, D.; Cao, H. Cavitation based soft abrasive flow processing method. Int. J. Adv. Manuf. Technol 2019. In Press. [Google Scholar] [CrossRef]
- Wei, X.Y.; Pan, H.X.; Huang, J.Y. Study on sensor optimal layout for gearbox. Acta Armamentarii 2010, 31, 1508–1513. [Google Scholar]
- Liu, Y.; Dong, G.H.; Yin, G.F. Vibration analysis and structural optimization of non-contact seal. J. Zhejiang Univ. Eng. Sci. 2018, 52, 1390–1397. [Google Scholar]
- Li, L.; Qi, H.; Yin, Z.; Li, D.; Zhu, Z.; Tangwarodomnukun, V.; Tan, D. Investigation on the multiphase sink vortex Ekman pumping effects by CFD-DEM coupling method. Powder Technol. 2019. In Press. [Google Scholar] [CrossRef]
- Lei, X.H. Dynamic simulation analysis of a central swing device. In Proceedings of the 2019 International Conference on Robots & Intelligent System (ICRIS), Haikou, China, 15–16 June 2019; pp. 505–508. [Google Scholar]
- Aouini, R.; Marinescu, B.; Kilani, K.B.; Elleuch, M. Synchronverter-based emulation and control of HVDC transmission. IEEE Trans. Power Syst. 2015, 31, 278–286. [Google Scholar] [CrossRef]
- Imani, M.; Ghoreishi, S.F.; Braga-Neto, U.M. Bayesian control of large MDPs with unknown dynamics in data-poor environments. Adv. Neural Inf. Process. Syst. 2018, 31, 8146–8156. [Google Scholar]
- Imani, M.; Ghoreishi, S.F.; Allaire, D.; Braga-Neto, U.M. MFBO-SSM: Multi-fidelity bayesian optimization for fast inference in state-space models. Proc. AAAI Conf. Artif. Intell. 2019, 33, 7858–7865. [Google Scholar] [CrossRef]
© 2019 by the authors. Licensee MDPI, Basel, Switzerland. This article is an open access article distributed under the terms and conditions of the Creative Commons Attribution (CC BY) license (http://creativecommons.org/licenses/by/4.0/).