Article

Hyperspectral Super-Resolution Technique Using Histogram Matching and Endmember Optimization

Department of Civil Engineering, University of Seoul, Seoul 02504, Korea
*
Author to whom correspondence should be addressed.
Appl. Sci. 2019, 9(20), 4444; https://doi.org/10.3390/app9204444
Submission received: 24 September 2019 / Revised: 15 October 2019 / Accepted: 17 October 2019 / Published: 19 October 2019

Abstract

:
In most hyperspectral super-resolution (HSR) methods, which are techniques used to improve the resolution of hyperspectral images (HSIs), the HSI and the target RGB image are assumed to have identical fields of view. However, because implementing these identical fields of view is difficult in practical applications, in this paper, we propose a HSR method that is applicable when an HSI and a target RGB image have different spatial information. The proposed HSR method first creates a low-resolution RGB image from a given HSI. Next, a histogram matching is performed on a high-resolution RGB image and a low-resolution RGB image obtained from an HSI. Finally, the proposed method optimizes endmember abundance of the high-resolution HSI towards the histogram-matched high-resolution RGB image. The entire procedure is evaluated using an open HSI dataset, the Harvard dataset, by adding spatial mismatch to the dataset. The spatial mismatch is implemented by shear transformation and cutting off the upper and left sides of the target RGB image. The proposed method achieved a lower error rate across the entire dataset, confirming its capability for super-resolution using images that have different fields of view.

1. Introduction

Hyperspectral images (HSIs) are widely used in many scientific and engineering fields, because they are capable of collecting the light spectrum from a broad wavelength and saving the spectral data with high spectral resolution. Most HSI applications in scientific and engineering fields aim to identify materials in an image on the basis of the spectral characteristic of each chemical reflecting the light. HSIs have been used as a powerful tool for detecting certain materials in an object, or measuring quantitative chemical content in the fields of agriculture [1,2], environment [3,4], surveillance [5,6], biomedical imaging [7,8], and geosciences [9,10].
Low-resolution is, however, one of the shortcomings of HSIs in practice. The low-resolution results from the way in which hyperspectral cameras acquire the spectrum from light. Currently, two types of hyperspectral cameras are available—push-broom and snapshot. Push-broom cameras scan a line in an image and put the reflected light through optical spectroscopic sensors [11], while snapshot cameras use a focal-plane array to generate a two-dimensional image with a single shot [12]. Regardless of the hyperspectral camera type, all hyperspectral cameras slice the light input into small units of spectral bands to obtain fine spectral resolution, and this process inevitably leads to a low amount of energy collected by a pixel on the sensor. Therefore, pixel size of hyperspectral cameras should be larger than that of general cameras, to avoid high signal-to-noise ratios in the collected spectrum.
To overcome this innate limitation of hyperspectral cameras, much research has been conducted to increase the resolution of HSIs, by integrating other types of images. The techniques are variously referred to as hyperspectral image fusion [13,14,15], hyperspectral super-resolution (HSR) [16,17], or hyperspectral image upsampling [18]; HSR is the term used to refer to the technique in this paper. Most common HSR techniques are based on pan-sharpening, which can also be applied to RGB images. Pan-sharpening merges a low-resolution multispectral image with a high-resolution panchromatic image to create a single multispectral image with higher resolution features [19]. One of the most common types of pan-sharpening algorithms, component substitution [20], is comprised of six steps: up-sampling, alignment, forward transformation, intensity matching, component substitution, and reverse transformation. However, because HSR is an ill-posed problem, assumptions of the previous pan-sharpening techniques to resolve the ill-posedness are imperfect, which leads to the need for new assumptions, based on new perspectives [21]. HSR techniques based on deep learning have been developed in recent years, as deep learning techniques are rapidly emerging for image processing. Li et al. [22] proposed an HSR model combining a deep convolutional neural network with an extreme learning machine for HSI classification. Yuan et al. [23] trained the nonlinear relationship between low- and high-resolution images using a convolutional neural network, and proposed a collaborative non-negative matrix factorization, to enforce collaborations between the observed low-resolution HSI and the transferred high-resolution HSI.
Among various HSR techniques, those based on the linear mixing model (LMM) are widely studied by many researchers. The LMM represents an HSI as a matrix factorization of linear spectral bases, so-called endmembers, and it can solve difficult HSI fusion problems with multispectral images, including RGB images. Wycoff et al. [24] formulated an HSR problem in the form of a sparse non-negative matrix factorization, and applied alternating optimization and convex optimization solvers. Huang et al. [25] obtained a spectral dictionary using K-singular value decomposition, and computed sparse fractional abundances with a sparse coding technique of orthogonal matching pursuit. Simoes et al. [26] defined an HSR model as the standard linear inverse problem model, using a form of regularization based on vector total variation, by considering spatial and spectral characteristics of the given data. Kwon and Tai [18] proposed a two-step RGB-guided HSI upsampling scheme that consists of spatial upsampling and spectrum substitution stages. One aspect of note in this work is that the spectrum substitution stage learns a local spectral dictionary, from the superpixel neighborhood. Fang et al. [27] developed a sparse representation model based on superpixels, that learns a spectral dictionary via online dictionary learning. This method adopts joint sparse regularization to simultaneously decompose the superpixel on the transformed dictionary, to obtain the corresponding coefficient matrix.
However, in most HSR techniques, it is implicitly assumed that the mismatch between low-resolution and high-resolution images is negligible. When a hyperspectral camera is used together with an RGB camera, it is rarely possible, in practice, to match the fields of view (FOVs) of the two cameras exactly. In remote sensing, such as for satellite photography and aerial photography, the mismatch of FOVs resulting from different camera angles or lens distortion can be adjusted and made negligible because the imaged objects are far enough from the cameras. However, if imaged objects are close to the cameras, it is difficult to avoid these mismatches between images. Furthermore, the two cameras have different sensitivities, even in the same light bandwidths, owing to differences in imaging sensors and filming mechanisms.
HSR techniques based on the LMM potentially diverge in the process of finding the coefficient if there is a significant mismatch between images. This divergence problem occurs when an HSI and other RGB or multispectral images do not perfectly fit each other at the pixel level, because most of the linear-mixing-model-based HSR techniques simultaneously optimize the coefficient towards the pixel location of both the HSI and RGB or multispectral image. Lanaras et al. [28] formulated the super-resolution problem as a searching procedure for an image that has both high-spatial and high-spectral resolution. The high-resolution HSI is defined as a factorization of a matrix of endmembers and a matrix of per-pixel abundances. A low-resolution HSI is reconstructed by multiplying a spatial downsampling matrix, and a high-resolution RGB image is reconstructed by multiplying a spectral downsampling matrix. Then, the differences between reconstructed images and original images are minimized using a gradient descent optimization algorithm. However, if the input HSI and the RGB image are mismatched, the high-resolution HSI diverges, because it is impossible for the per-pixel abundance matrix to satisfy pixel locations of both images.
The divergence problem has to be overcome to develop an HSI–RGB image integrated system that can be used to take an image of a close object. We faced this problem while developing an HSI–RGB image integrated system detecting chemical leaching on the surface of a concrete structure. The features of chemical leaching on the concrete surface were too obscure to be detected, because of the low resolution of the HSI. One of the methods used to increase the resolution is to gain access closer to the concrete surface, but most concrete structures are too far away to be accessed. Therefore, it is necessary to develop an HSI–RGB image integrated system that can reconstruct a high-resolution HSI from an RGB image taken with different camera sensitivities and from different FOVs.
In this paper, we propose an HSR method that uses an HSI and an RGB image taken from a different FOV. This method mainly uses histogram matching and the endmember abundance optimization process proposed in [28]. First, a low-resolution RGB image is obtained, by applying spectral sensitivity of an RGB camera to a low-resolution HSI. The acquired low-resolution RGB image contains the color distribution of the low-resolution HSI. Next, histogram equalization is used to match the color distribution of the low-resolution RGB image and the high-resolution RGB image, taken from a slightly different viewing angle with the low-resolution HSI. Finally, the spatial endmember abundance of the high-resolution HSI is matched to the spatial information obtained from the high-resolution RGB image.
The proposed method can be described as a rearranging of the endmember of the HSI to fit into the pixel location of the high-resolution RGB image. Because there is no constraint on the pixel location of the low-resolution HSI, the proposed method can build a high-resolution HSI only if the endmember combination of both images is similar. The performance of the proposed method is evaluated by field experiments comparing the spectrum of the same material in the low- and high-resolution HSIs using a spectral angle mapper.

2. Problem Formulation

The goal of the HSR technique is to search for an image that has both high spectral and high spatial resolution. The image is formulated as Z R B × W × H with B, W, and H representing the number of spectral bands, width and height of the image, respectively. The HSR task of this research takes two inputs, an HSI H R B × w × h with high spectral resolution and low spatial resolution (w < W and h < H) and an RGB image I R b × W × H with low spectral resolution and high spatial resolution (b < B). According to the LMM of Lanaras et al. [28], the intensities z R B at a given pixel of Z are described by an additive mixture:
z = j = 1 p e j a j ,   Z = E A
with a matrix E R B × p of endmembers and a matrix A R p × W × H of per-pixel abundances. By this definition, most p endmembers (materials) are present in the image. The endmembers E act as non-orthogonal bases to represent Z in a lower dimensional space R p with rank {Z} ≤ p.
The actual high-resolution RGB image I is a spectrally downsampled version of Z:
I = R Z = R E A
where R R b × B is the spectral response function of the sensor. The spatial response function S of the hyperspectral camera and the spectral response function R of the conventional camera form part of the camera specifications and are assumed to be known. The spectral response function of the Nikon D700 offered in the work of Jun et al. [29] is used as R for this research.
The low-resolution HSI, H, is defined as:
H   =   EA
where A R p × w × h is a low-resolution matrix of per-pixel abundances. The reason the per-pixel abundances of H are defined not as a factorization of EA and spatial downsampling operator, but as another form of matrix, is that the pixel location of the super-resolution result is not the same as that of H.
The low-resolution RGB image L is defined as:
L   =   REA
which represents the factorization of the spectral response function R and the low-resolution HSI, H. The constraint condition of this paper follows that of Lanaras et al. [28]. The main assumption of the constraint is that the endmembers are reflectance spectra of individual materials, and the abundances are proportions of those endmembers. As a consequence, the factorization is subject to the following constraints:
a i j 0     i ,   j   ( non - negative   abundance )
1 A = 1   ( abundances   sum   to   1 )
with a i j the elements of A. Here 1 denotes a vector of 1s compatible with the dimensions of A.

3. Proposed Solution

3.1. Overall Scheme

In this paper, we propose a solution to the problem formulated in Section 2, using histogram matching and the endmember abundance optimization process proposed in Lanaras et al. [28]. As briefly explained in Section 1, [28] defined a high-resolution HSI as a factorization of spectral endmembers and its per-pixel abundance. The authors of [28] find a high-resolution HSI by optimizing the spectral endmembers to a low-resolution HSI, and the per-pixel endmember abundances to a high-resolution RGB, image. The optimization step for endmember abundance is adopted in this method to find the per-pixel endmember abundance. The overall framework of the proposed solution is displayed in Figure 1. The HSR procedure proposed in this paper consists of three steps:
Step 1. Creating an RGB image from a low-resolution HSI, using a spectral response function of a commercial RGB camera.
Step 2. Matching the histogram of a high-resolution RGB image with that of a low-resolution RGB image, obtained in Step 1.
Step 3. Optimizing endmember abundance of a high-resolution HSI toward the histogram-matched high-resolution RGB image obtained in Step 2.
In Step 1, a low-resolution RGB image is reconstructed from a low-resolution HSI by factorizing a spectral response function of a commercial RGB camera. The reconstructed low-resolution RGB image is used as a color distribution standard point for both the low-resolution HSI and high-resolution RGB image. In Step 2, the histogram of the high-resolution RGB image is matched with the low-resolution RGB image obtained in Step 1. Since the high-resolution RGB image has the same color distribution as the low-resolution RGB image, it is less necessary to match the color distribution using an optimization process. In Step 3, the per-pixel endmember abundance optimization process of [28] is adopted, to match the spatial distribution of endmember abundance between the high-resolution HSI and the high-resolution RGB image. The per-pixel endmember abundance optimization is performed by reducing the subtraction between the target high-resolution RGB image and the high-resolution RGB image obtained from the high-resolution HSI. Because this optimization process disregards the objective function, representing the difference between low- and high-resolution HSIs, the endmember abundance freely converges to the pixel location of the high-resolution RGB image.
Each part of the proposed method is formulated as explained below. Step 1 factorizes the spectral response function of a RGB camera with a low-resolution HSI to reconstruct a low-resolution RGB image. An RGB image is reconstructed the equation formulated in [29]:
I c h = 400 n m 720 n m S c h ( λ ) L ( λ ) R x ( λ ) d λ
where S c h ( λ )   ( c h = R , G , B ) is the spectral response function of an camera for each channel of RGB, L ( λ ) is spectral power distribution of an illuminant and R x ( λ ) is a spectral reflectance of a point in an image. Equation (5) can also be written in a matrix form, for a discrete summation along the spectral range of a hyperspectral camera with a given bandwidth. Step 2 matches the histogram of an RGB image to that of a low-resolution RGB image L, obtained from an HSI. The histogram-matching process is a minimization of grayscale transformation T in the following equation:
min T | c 1 ( T ( g ) ) c 0 ( k ) |
where g is a specific index on a gray scale, c 0 is the cumulative distribution function of L’s histogram and c 1 is the cumulative distribution function of I’s histogram for all intensities k on a gray scale. Since the histogram equalization is defined on a gray scale, it has to be iteratively performed on each channel of a RGB image. T is a function that finds the index on c 0 that has the value most similar to the value of c 1 at a particular index g on grayscale. After the function T is defined for g on all intensities on a gray scale, histogram equalization is performed by finding and mapping a value corresponding to L in the input image I, using T. In Step 3 of the proposed algorithm, an estimate of Z, or equivalently E and A, is needed. From the given super-resolution problem, the following constrained least-squares problem is formulated as:
arg   min A I     REA F 2
subject   to   a i j 0     i ,   j
with · F denoting the Frobenius norm, and a i j is elements of A and constrained to non-negative values.

3.2. Overall Algorithm and Implementation

The method proposed in Section 3.1 proceeds with the following procedure, as described in Table 1. The algorithm requires H and I, which are low-resolution HSI and high-resolution RGB images, respectively. Because Z will be reconstructed using endmember abundance with the same resolution as I, the resolution of I has to be an integer multiple of the resolution of H with upsampling rate S. Additionally, RGB camera sensitivity C is required to reconstruct an RGB image from H.
The proposed method begins by constructing a low-resolution RGB image L from H, using C. The camera sensitivity for each RGB channel is multiplied by the spectral information of H of each pixel, and normalized into an 8-bit-precision RGB image L, for further histogram equalization with I. Then, the histogram of I is matched with that of L, so that I has the same color distribution as L. The histogram equalization is performed using a MATLAB built-in function [30]. The next step is to find the initial values, E ( 0 ) and A ( 0 ) , to optimize Z, which consists of the endmember vector E and the per-pixel abundance vector A. Simplex identification via split augmented Lagrangian (SISAL) [31] initializes endmember E and sparse unmixing by variable splitting and augmented Lagrangian (SUnSAL) [32] initializes A’, respectively. SISAL is an algorithm for unsupervised hyperspectral linear unmixing and finds the minimum volume simplex containing the hyperspectral vectors, by augmented Lagrangian optimizations. SUnSAL is an eigen decomposition-based hyperspectral unmixing algorithm. The MATLAB code for SISAL and SUnSAL is available at the author’s webpage [33]. The low-resolution per-pixel abundance A’ is upsampled with S and will be used as the initial point of the low-resolution step. The optimization is performed with a projected gradient method for 7a. The equation for the projected gradient method is:
U q   =   E q 1 1 c ( E q 1 A H ) A
E q = prox E ( U q )  
where c = γ 2 A A F is a nonzero constant and prox E is a proximal operator that is constrained to 7b. The optimization procedure is repeated for q = 1 ,   2 ,   until convergence, or until the pre-determined error rate, calculated by an error metric, is reached.

4. Experiment

4.1. Baseline Study for Spatial Information Mismatch

To confirm the limitation of current methods under color space difference and pixel mismatch, we applied the method of Lanaras et al. [28] to the cases where pixel mismatch exists, and color spectral functions are not identical for H and I. The method of Lanaras et al. implicitly assumes that there is no pixel mismatch or color difference between high resolution RGB image and low resolution HSI, and the effects of this assumption are investigated using images with pixel mismatch and color difference. A public hyperspectral database, called the Harvard dataset [34], was used for the evaluation of the proposed algorithm. Because the purpose of the Harvard dataset [34] is to establish the basic statistical structure of HSIs of real-world scenes, the dataset is in accord with the condition in which the proposed algorithm will be used. The Harvard dataset [34] has 50 indoor and outdoor images recorded under daylight illumination, and 27 images recorded under artificial or mixed illumination. The spatial resolution of the images is 1392 × 1040 pixels, with 31 spectral bands of width 10 nm, from 420 to 720 nm. The original HSIs are used as ground truth for the evaluation.
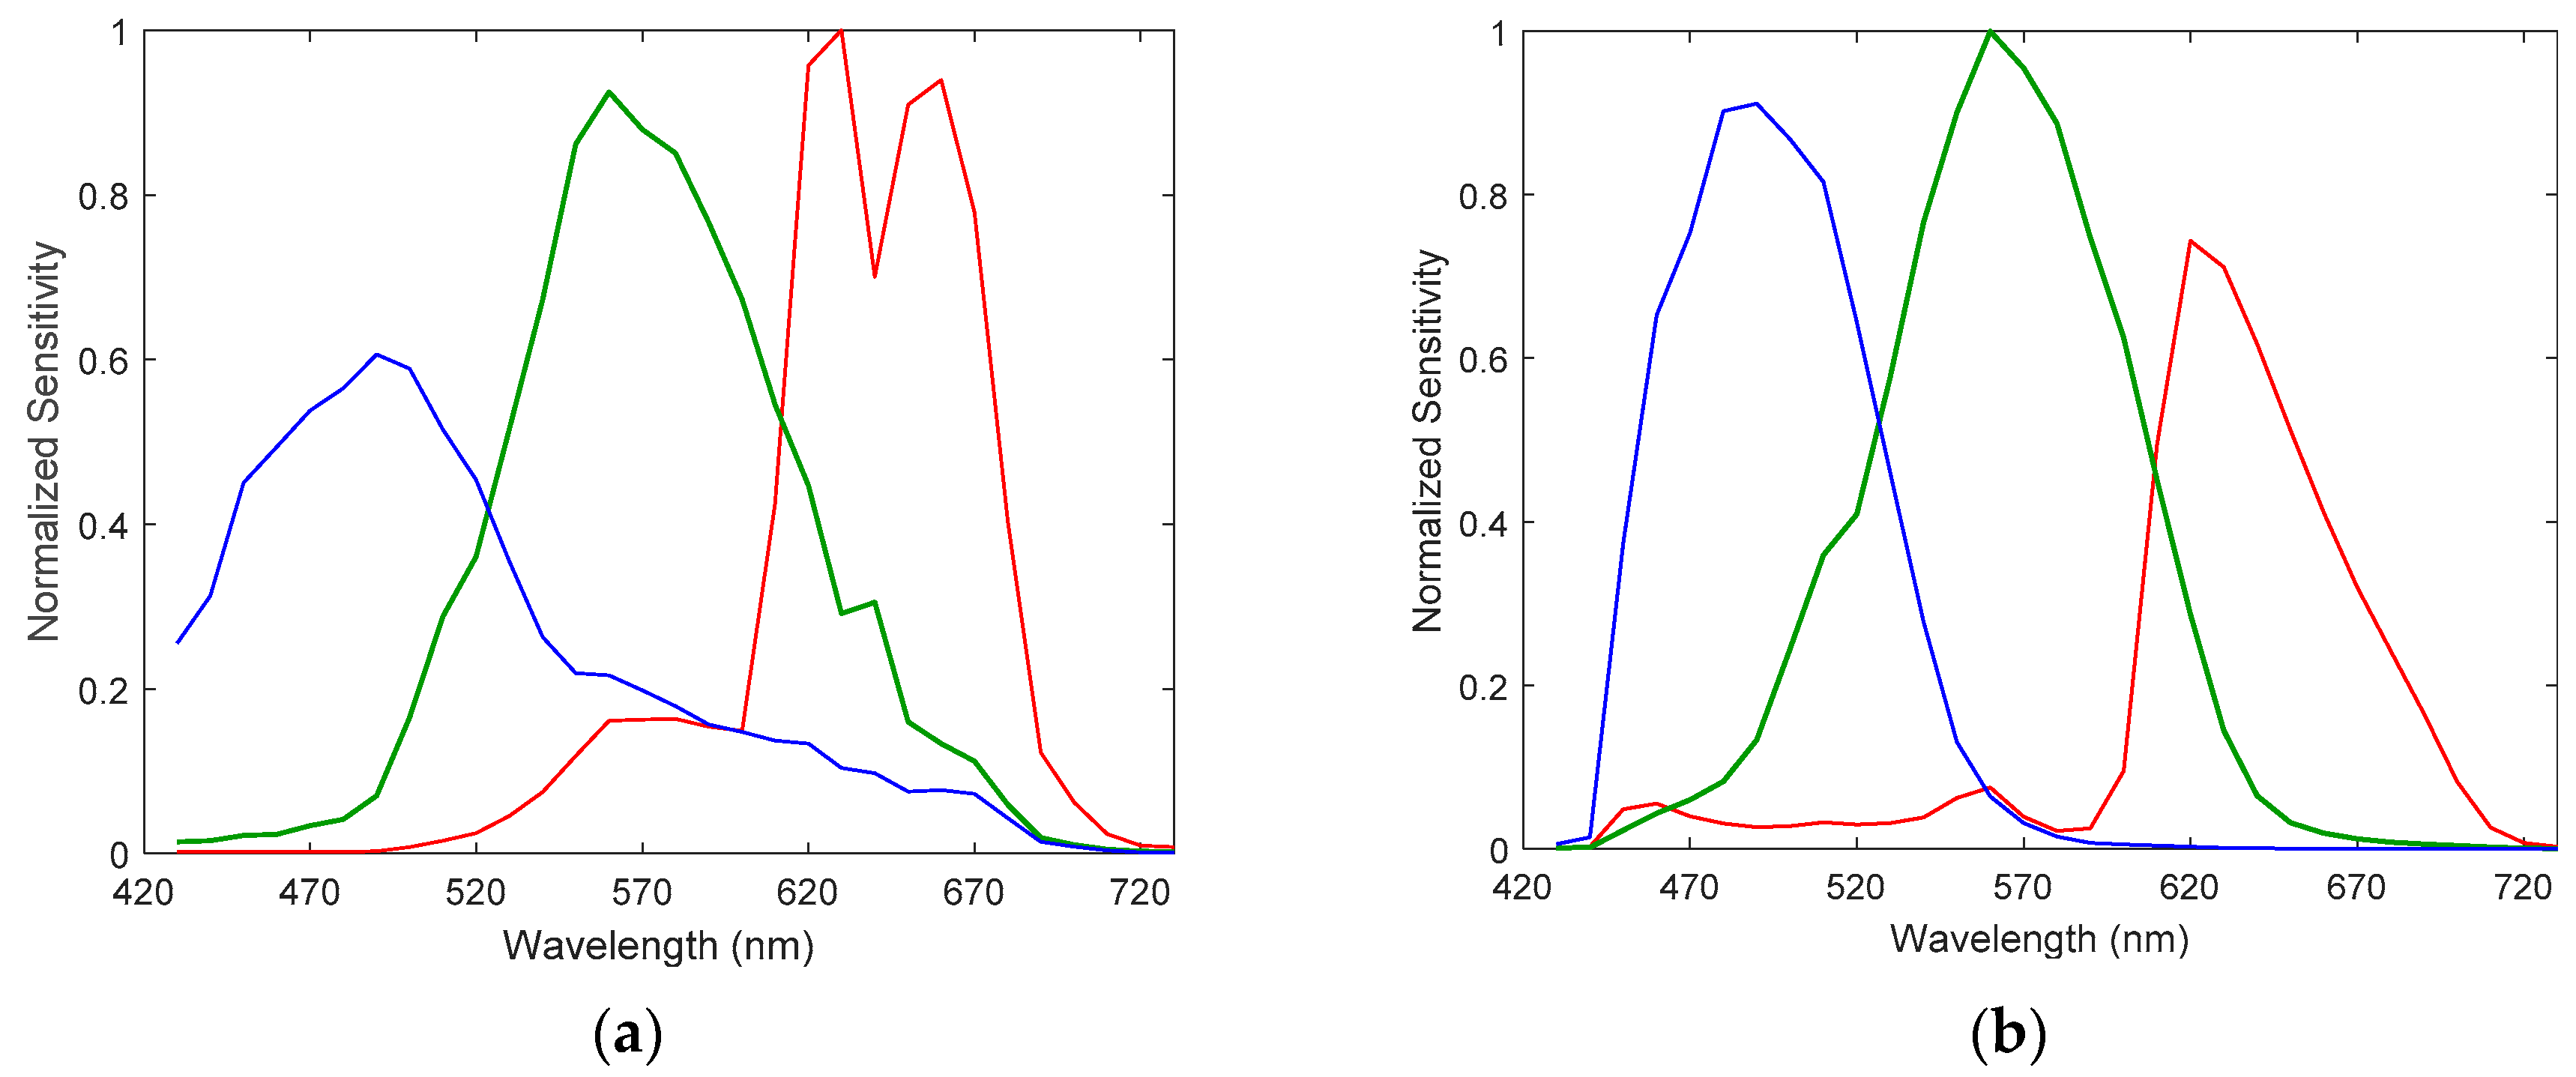
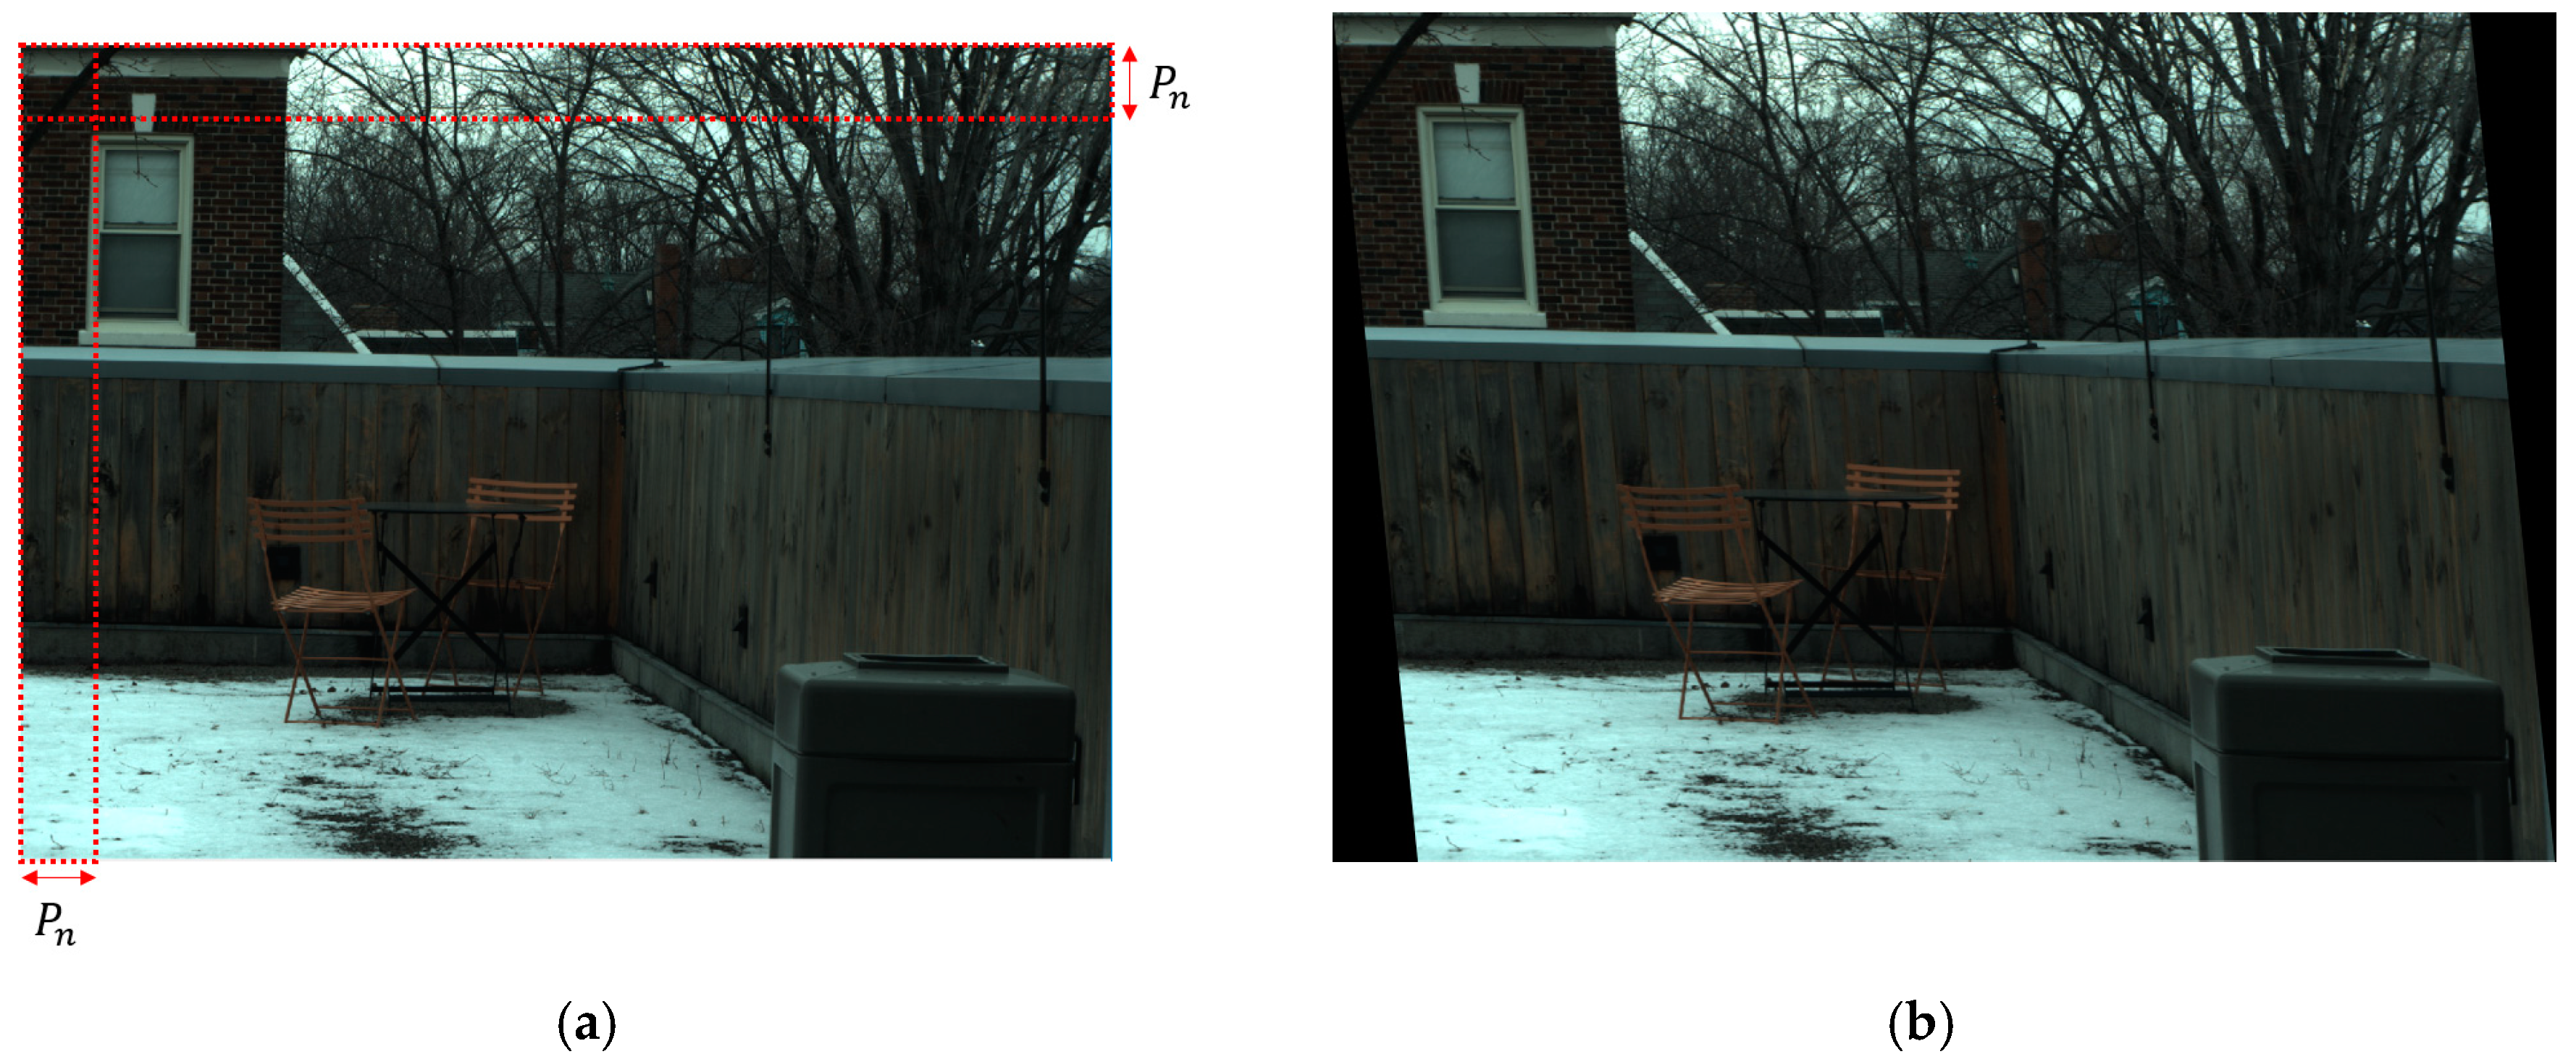
First, the upper and left sides of the original HSIs (Figure 2a) were cut off by 50 pixels in both horizontal and vertical directions to form the pixel mismatch dataset (Figure 2b). Comparing Figure 2a,b, it can be observed that the location of the window on the left side is slightly translated, potentially due to the lower per-pixel performance of the super-resolution process. Second, RGB images were reconstructed as displayed in Figure 2c, using a color spectral function, Nokia N900, which was different from the one used in optimization. The camera sensitivities of the Nokia N900 and Nikon D700 are displayed in Figure 3. Figure 2c has relatively brighter color space compared to Figure 2a, which causes low spectral accuracy of a super-resolution result. The maximum RGB value of the test was normalized to 1, which is a common image processing technique for enhancing the visibility of a reconstructed image. The experiments were conducted with the same implementation details as in [28] for both datasets, but the operation was forced to run 1500 iteration for the 11 selected images. For a fair comparison between the proposed algorithm and other methods, the same error rate method was used as the primary metric. The datasets were tested using the root–mean–square error (RMSE) of the estimated high-resolution HSI Z, with respect to the ground truth image Z ^ :
RMSE =   1 B N m ( z ^ i j z i j ) 2 =   Z ^ Z F 2 B N m
A spectral angle mapper (SAM) [35] was also adopted; it is defined as the angle in R B between the estimated pixel z ^ i j and the ground truth pixel z i j , averaged over the entire image and given in degrees:
SAM =   1 N m arccos z ^ i j z i j z ^ i j 2 z i j 2
where 2 is the l 2 vector norm.
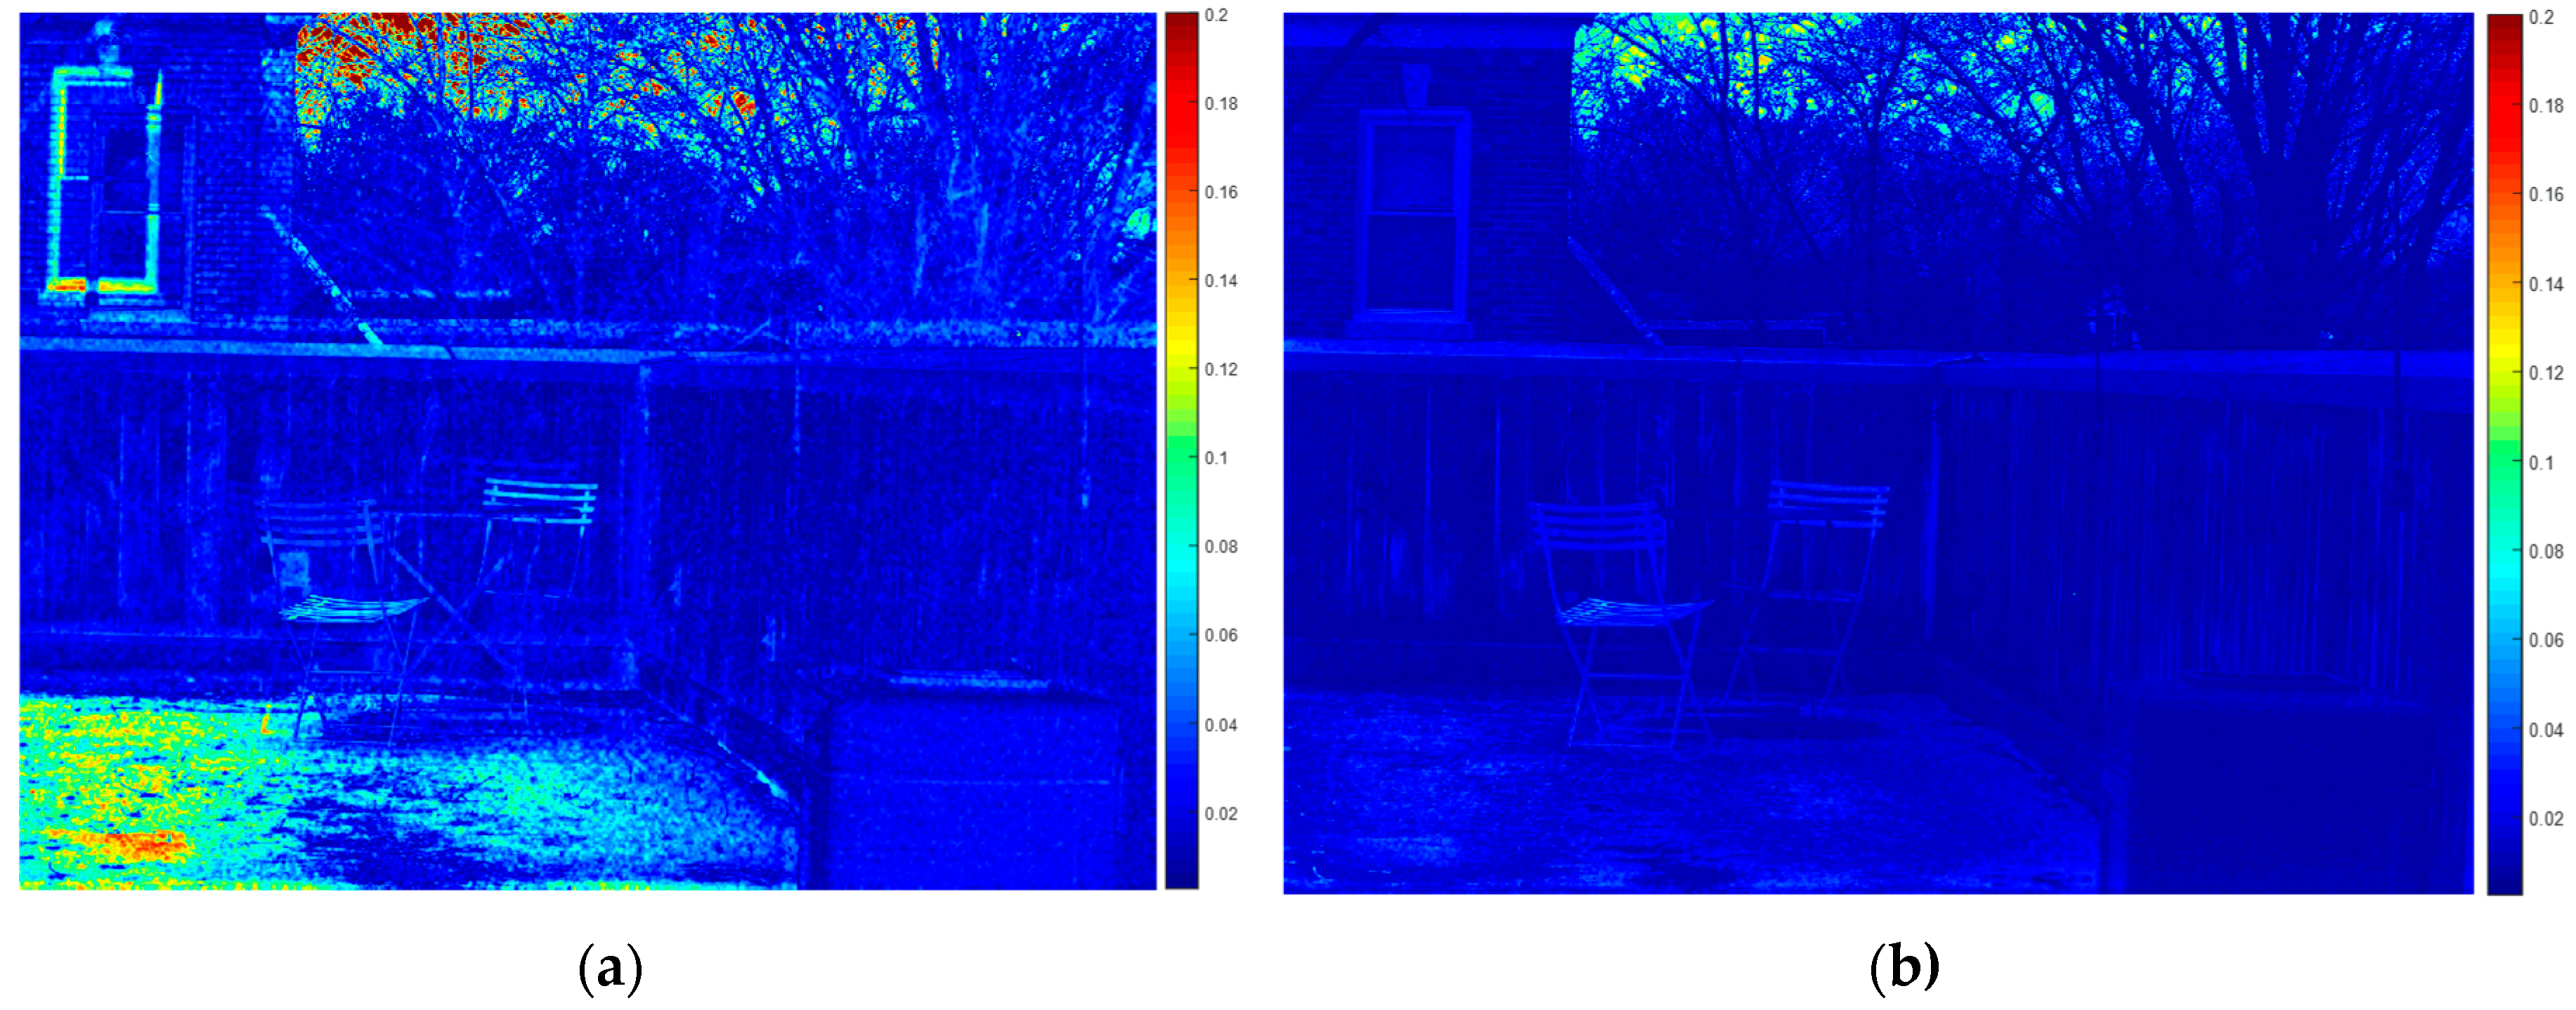
The test results were tabulated in Table 2 for comparison with the results of [28]. The algorithm of [28] showed accurate results compared to other methods, such as those in [24,26,36,37], and [38], but the experimental results indicate that a small pixel mismatch and color difference would lead to a higher error rate. This phenomenon is theoretically inevitable for algorithms that optimize the high-resolution HSI for both the RGB image and low-resolution HSI. For instance, the low-resolution step of [28], minimizing the objective function of endmembers in the image, is highly governed by the abundance of the high-resolution HSI. Therefore, inputting two images with pixel mismatch, as displayed in Figure 2a,b, means optimization toward two different points, and inevitably results in poor accuracy. This phenomenon appears in Figure 4a, which shows an error rate of > 10% where the spatial mismatch is significant. Color difference is another factor that should be considered in super-resolution problems. The high-resolution step requires an accurate spectral sensitivity function to recover an RGB image close to the input RGB image. However, the sensitivity of the hyperspectral camera usually differs from that of the RGB camera, as displayed in Figure 2a,c, complicating the initialization of the color space between the RGB image and HSI. As displayed in Figure 4b, the color distribution difference caused significant errors in parts of the HSI. The method is also inefficient in finding the spectral function of the RGB camera every time the input RGB image is changed. Therefore, poor results in both the pixel mismatch and color difference dataset indicate the need for the algorithm to account for these issues in the super-resolution problem.

4.2. Proposed Method Evaluation

To test the performance of the proposed algorithm under a condition in which a mismatch between a low-resolution image and a high-resolution image is significant, the original HSIs were edited in two ways. To construct the first dataset, the upper left corner of the original HSIs was cut off for the specific number of pixels, increasing in 20-unit increments from 20 to 100 pixels, as represented in Figure 5a. For the second dataset, an affine transformation was applied, as displayed in Figure 5b, to make horizontally sheared images from the pixels not cut off from the original images. The affine matrix for the shear transformation used in this research was:
[ 1 C x 0 0 1 0 0 0 0 ]
The numbers used for the constants C x in the shear transformation matrix are listed in Table 3.
We ran our method with the maximum number of endmembers set to p = 10, which is sufficient for both datasets. The inner loops of optimization steps (8a) and (8b) were run for 5000 iterations. Operation times depended on the image size and the number of iterations. For a 1392 × 1040 pixel image with 31 channels, it took ~660 s on a single Intel i7-7700, operating at 3.60 GHz with GPU computation on a GTX 1080Ti (11 GB). The ratio between low-resolution image and high-resolution image is set to 1:8.
Table 3 compares the average and median RMSE and SAM values by the method of Lanaras et al. [28], with those by the proposed method for the eight cases, using images with and without geometric transformation. For all of the experimental cases, the color difference is applied. For the ideal images without any transformation, the method of Lanaras et al. [28] shows slightly lower RMSE and SAM values than the proposed method. If any transformation is applied to the images, however, the method of Lanaras et al. [28] results in significantly increased errors. With the small shear deformation ( C x =   0.1), the average RMSE and SAM values increase from 2.68 to 9.79, and 5.58 to 7.16, respectively. With the small cut-off of images ( P n =   20), the average RMSE and SAM values increase from 2.68 to 9.12, and 5.58 to 6.71, respectively. On the other hand, the proposed method results in slightly increased errors with the transformation. With the small shear deformation ( C x =   0.1), the average RMSE and SAM values increase from 2.68 to 3.64, and 6.69 to 6.73, respectively. With the small cut-off of images ( P n =   20), the average RMSE values increase from 2.68 to 3.56, and the average SAM values change negligibly, from 6.69 to 6.65. Even with larger transformations, the proposed method results in significantly smaller RMSE and SAM values than the method by Lanaras et al. [28]. The results quantitatively confirm that the proposed algorithm can solve the super-resolution problem of an HSI, where an HSI and a target RGB image have different fields of view.
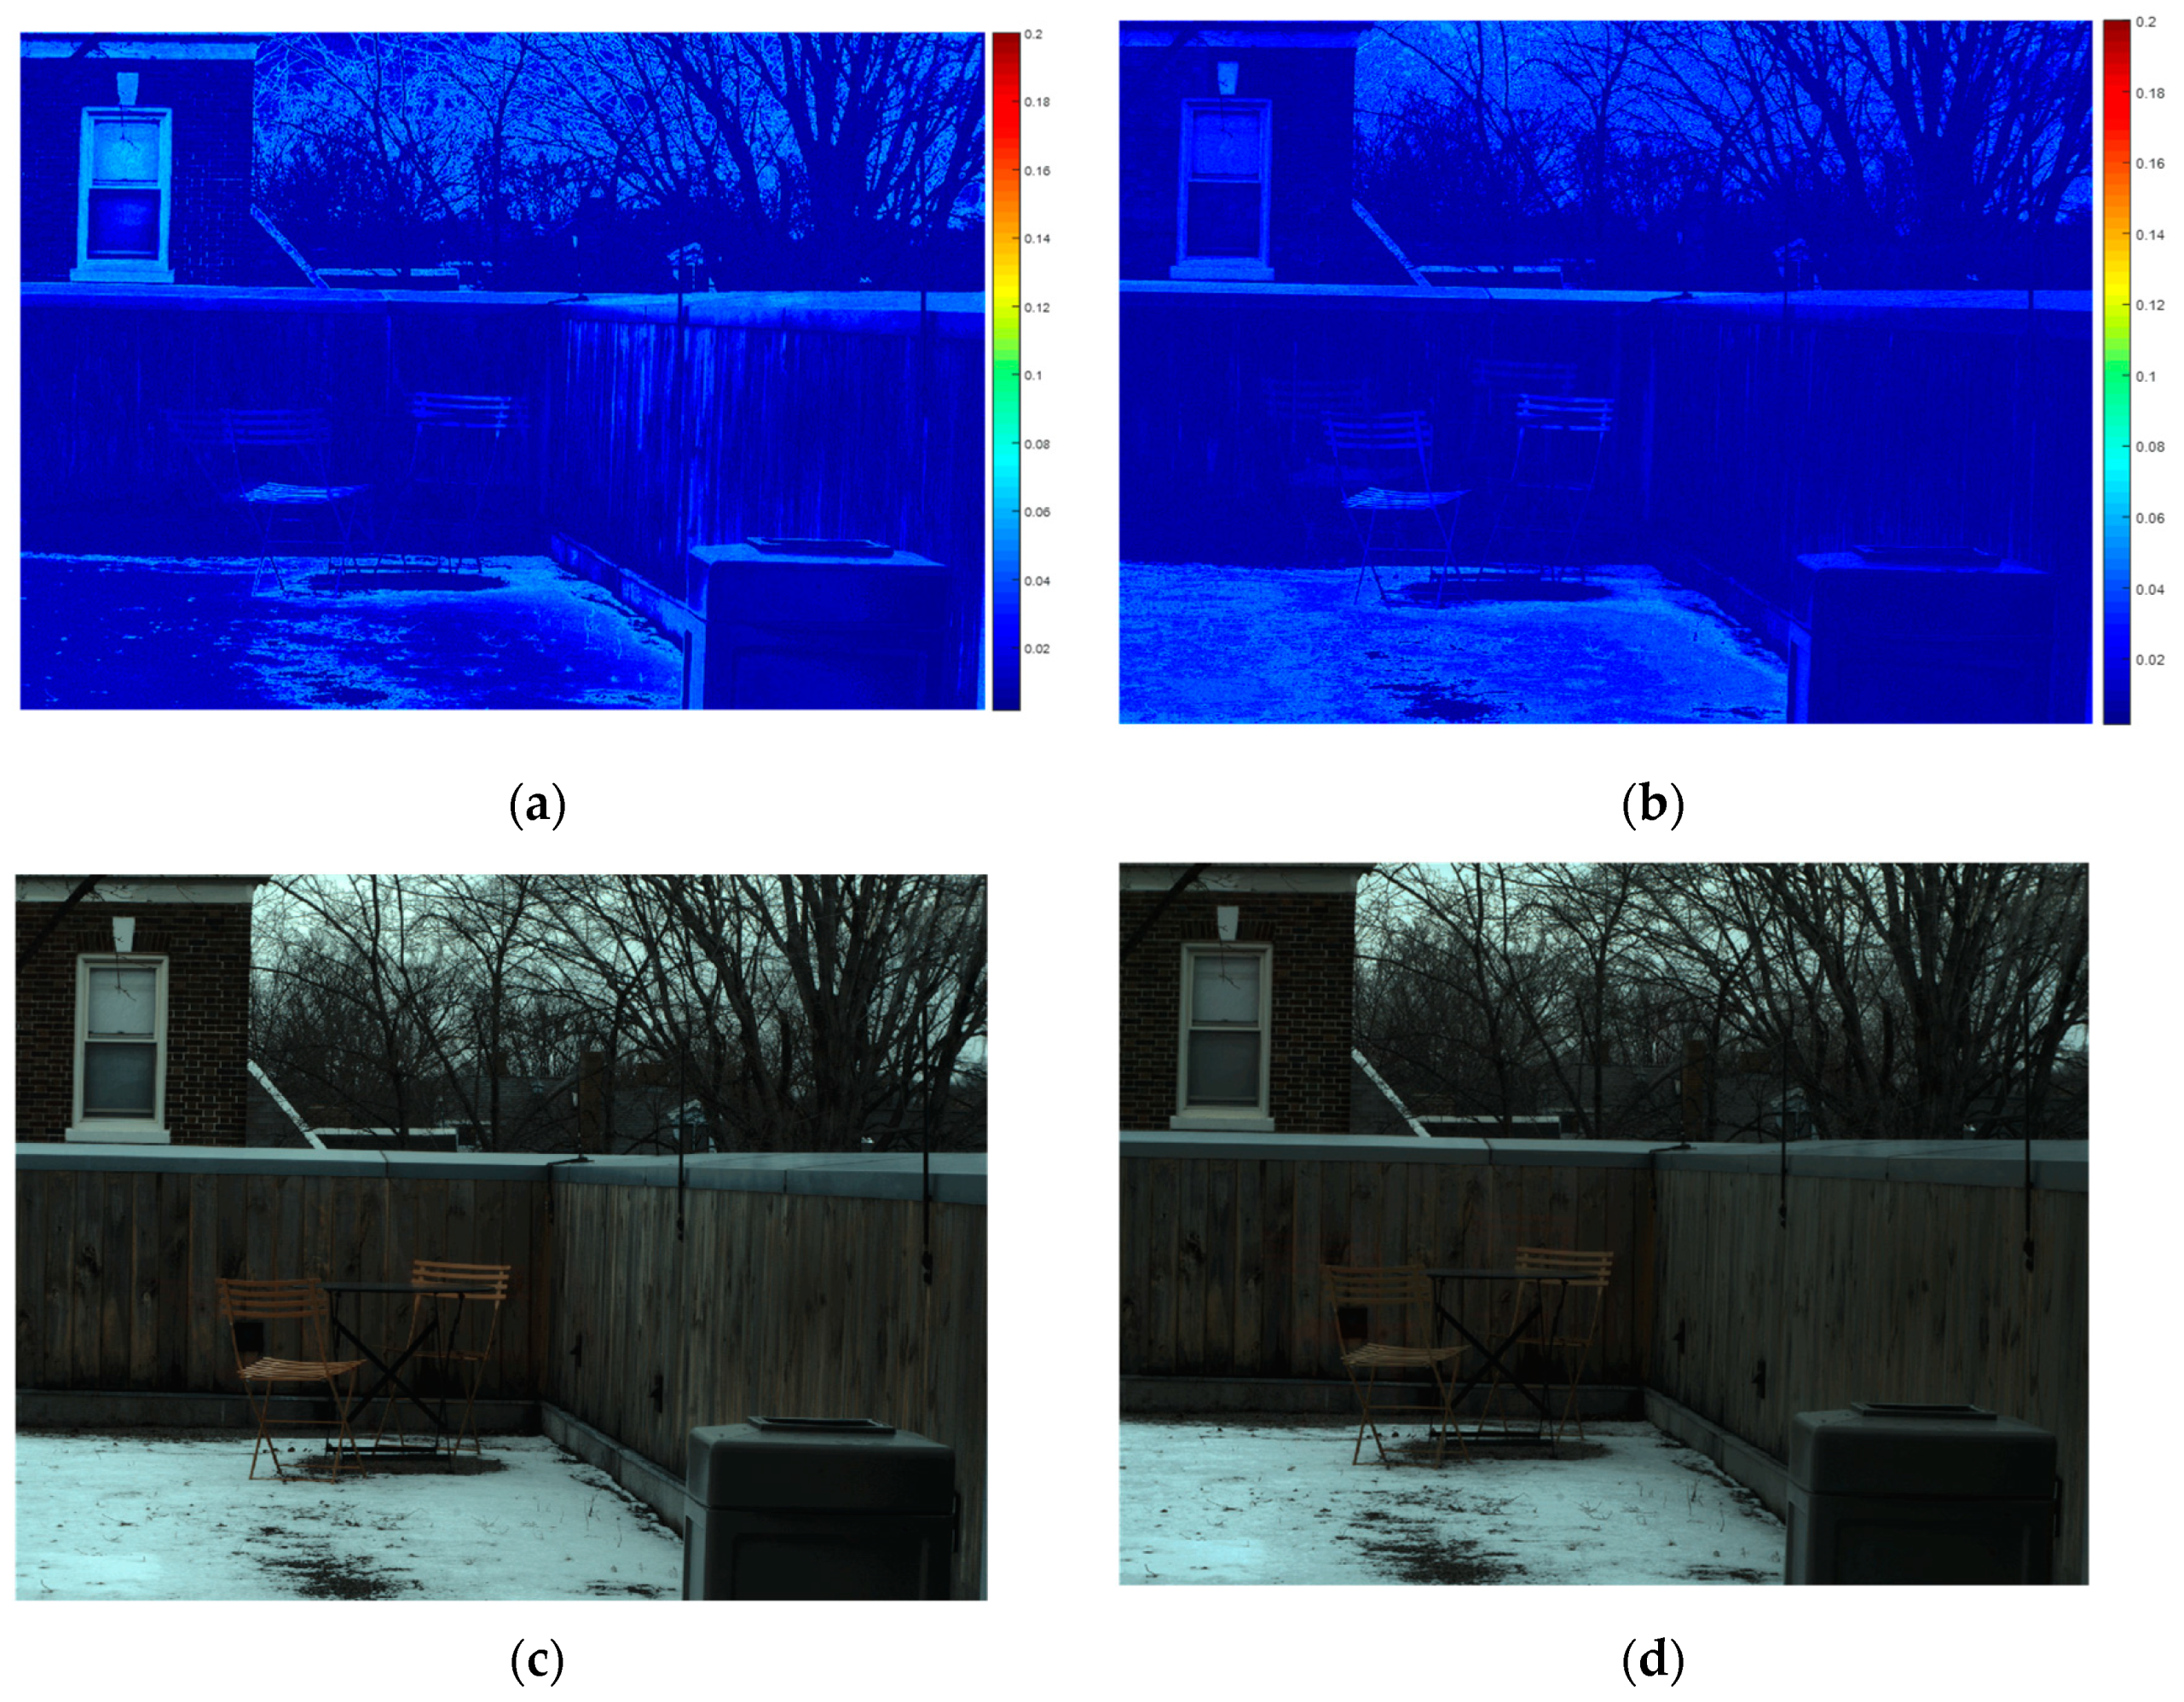
To qualitatively evaluate the performance of the proposed method, we verified the performance of the per-pixel error rate image and the RGB image reconstructed from the high-resolution HSI, as shown in Figure 6. Figure 6a,c show the per-pixel RMSE and reconstructed RGB images of the high-resolution HSI of super-resolution in an environment where the shear transformation for C x was 0.3. Figure 6b,d show the per-pixel RMSE and reconstructed RGB images of high-resolution HSI of super-resolution, in an environment where P n was 80. Comparing Figure 6a,b with the per-pixel error image in Figure 4, we can observe that the error rate for the overall image has been significantly reduced. In particular, the phenomenon where two images are not merged into one image by the pixel mismatch in Figure 4a is significantly reduced in Figure 6a,b. Also, this phenomenon is hardly observed in the reconstructed RGB images of Figure 6c,d, which confirms that removing the high-resolution step in [28] gives a better performance in pixel-mismatch environments, by relaxing the spatial constraint on two images with different FOVs. Also, we showed that the color distribution difference that can be caused by removing the high-resolution step in [28] can be reduced by using histogram equalization. However, further research might be needed to study how to update the endmembers, even in an environment of pixel mismatch, using additional optimization techniques.

5. Conclusions

A new approach for hyperspectral super-resolution for an HSI and an RGB image taken with different camera sensitivities and fields of view is proposed. Matching different camera sensitivities and fields of view is a challenging task, that must be overcome to develop an HSI–RGB image integrated system for environments where this issue is inevitable. The proposed method employs a modification of the work of [28] to solve the super-resolution problem in an environment where an HSI and a target RGB image have slightly different fields of view. The basic principle of the proposed method is to obtain endmembers from the given his, and to optimize the per-pixel abundance with RGB images, for which the histogram is matched to that of the RGB image reconstructed from the HSI. The endmember optimization term between the low-resolution HSI and the high-resolution HSI is removed, to prevent divergence caused by different per-pixel abundances of the low-resolution HSI and the high-resolution RGB. A histogram-matching step between the given RGB image and the RGB image reconstructed from the HSI is added, to reduce the color difference caused by different camera sensitivities and the potential accuracy decrease caused by removal of the endmember optimization term.
We first conducted two experiments to confirm the effect of different camera sensitivities and fields of view. The datasets for the experiments were constructed by editing 11 selected images from the Harvard dataset, which is comprised of basic statistical structures of HSIs of real-world scenes. To confirm the effect of the color difference, the input high-resolution RGB image is reconstructed using camera spectral functions different from the one used for the optimization process. To confirm the effect of the different fields of view, the upper and left sides of the input high-resolution RGB image are cut off by 50 pixels. The experimental results demonstrate that these differences may lead to a high error rate in the super-resolution problem. The performance of the proposed method was also tested on the Harvard dataset. The experimental dataset was constructed by adding two types of geometric transformation, warping and transition, to the reconstructed RGB image, using camera spectral functions different from the one used for the optimization process. The low error rate of the experimental results in RMSE and SAM demonstrates that the proposed algorithm is applicable in environments with pixel mismatching and color differences.

Author Contributions

B.K. and S.C. conceived and designed the methods; B.K. developed the software; B.K. performed the validation and visualization of results; B.K. and S.C. wrote the paper; S.C. supervised the research. S.C. acquired the research funding.

Funding

This research was funded by Ministry of Land, Infrastructure, and Transport of the Korean government.

Acknowledgments

This research was supported by a grant (19SCIP-C116873-04) from the Construction Technology Research Program funded by the Ministry of Land, Infrastructure, and Transport of the Korean government.

Conflicts of Interest

The authors declare no conflict of interest.

References

  1. Adão, T.; Hruška, J.; Pádua, L.; Bessa, J.; Peres, E.; Morais, R.; Sousa, J. Hyperspectral Imaging: A Review on UAV-Based Sensors, Data Processing and Applications for Agriculture and Forestry. Remote Sens. 2017, 9, 1110. [Google Scholar] [CrossRef]
  2. Mahesh, S.; Jayas, D.S.; Paliwal, J.; White, N.D.G. Hyperspectral imaging to classify and monitor quality of agricultural materials. J. Stored Prod. Res. 2015, 61, 17–26. [Google Scholar] [CrossRef]
  3. Brackx, M.; Van Wittenberghe, S.; Verhelst, J.; Scheunders, P.; Samson, R. Hyperspectral leaf reflectance of Carpinus betulus L. saplings for urban air quality estimation. Environ. Pollut. 2017, 220, 159–167. [Google Scholar] [CrossRef] [PubMed]
  4. Balzarolo, M.; Peñuelas, J.; Filella, I.; Portillo-Estrada, M.; Ceulemans, R. Assessing Ecosystem Isoprene Emissions by Hyperspectral Remote Sensing. Remote Sens. 2018, 10, 1086. [Google Scholar] [CrossRef]
  5. Fossi, A.P.; Ferrec, Y.; Roux, N.; D’almeida, O.; Guerineau, N.; Sauer, H. Miniature and cooled hyperspectral camera for outdoor surveillance applications in the mid-infrared. Opt. Lett. 2016, 41, 1901. [Google Scholar] [CrossRef] [PubMed]
  6. Vanegas, F.; Bratanov, D.; Powell, K.; Weiss, J.; Gonzalez, F. A Novel Methodology for Improving Plant Pest Surveillance in Vineyards and Crops Using UAV-Based Hyperspectral and Spatial Data. Sensors 2018, 18, 260. [Google Scholar] [CrossRef] [PubMed]
  7. Ray, A.; Kopelman, R.; Chon, B.; Briggman, K.; Hwang, J. Scattering based hyperspectral imaging of plasmonic nanoplate clusters towards biomedical applications. J. Biophotonics 2016, 9, 721–729. [Google Scholar] [CrossRef]
  8. Weijtmans, P.J.C.; Shan, C.; Tan, T.; Brouwer de Koning, S.G.; Ruers, T.J.M. A Dual Stream Network for Tumor Detection in Hyperspectral Images. In Proceedings of the 2019 IEEE 16th International Symposium on Biomedical Imaging (ISBI 2019), Venice, Italy, 8–11 April 2019; pp. 1256–1259. [Google Scholar]
  9. Mielke, C.; Rogass, C.; Boesche, N.; Segl, K.; Altenberger, U. EnGeoMAP 2.0—Automated Hyperspectral Mineral Identification for the German EnMAP Space Mission. Remote Sens. 2016, 8, 127. [Google Scholar] [CrossRef]
  10. Scafutto, R.D.M.; de Souza Filho, C.R.; Rivard, B. Characterization of mineral substrates impregnated with crude oils using proximal infrared hyperspectral imaging. Remote Sens. Environ. 2016, 179, 116–130. [Google Scholar] [CrossRef]
  11. Wang, J.; Hu, P.; Lu, Q.; Shu, R. An airborne pushbroom hyperspectral imager with wide field of view. Chin. Opt. Lett. 2005, 3, 689–691. [Google Scholar]
  12. Johnson, W.R.; Wilson, D.W.; Fink, W.; Humayun, M.; Bearman, G. Snapshot hyperspectral imaging in ophthalmology. J. Biomed. Opt. 2007, 12, 014036. [Google Scholar] [CrossRef] [PubMed]
  13. Wei, Q.; Bioucas-Dias, J.; Dobigeon, N.; Tourneret, J.Y. Hyperspectral and Multispectral Image Fusion Based on a Sparse Representation. IEEE Trans. Geosci. Remote Sens. 2015, 53, 3658–3668. [Google Scholar] [CrossRef] [Green Version]
  14. Wang, Q.; Shen, Y.; Zhang, Y.; Zhang, J.Q. A quantitative method for evaluating the performances of hyperspectral image fusion. IEEE Trans. Instrum. Meas. 2003, 52, 1041–1047. [Google Scholar] [CrossRef]
  15. Wilson, T.A. Perceptual-based hyperspectral image fusion using multiresolution analysis. Opt. Eng. 1995, 34, 3154. [Google Scholar] [CrossRef]
  16. Akgun, T.; Altunbasak, Y.; Mersereau, R.M. Super-resolution reconstruction of hyperspectral images. IEEE Trans. Image Process. 2005, 14, 1860–1875. [Google Scholar] [CrossRef]
  17. Zhao, Y.; Yang, J.; Zhang, Q.; Song, L.; Cheng, Y.; Pan, Q. Hyperspectral imagery super-resolution by sparse representation and spectral regularization. EURASIP J. Adv. Signal Process. 2011, 2011. [Google Scholar] [CrossRef]
  18. Kwon, H.; Tai, Y.W. RGB-guided hyperspectral image upsampling. In Proceedings of the the IEEE International Conference on Computer Vision, Santiago, Chile, 7–13 December 2015; pp. 307–315. [Google Scholar]
  19. Mitani, Y.; Hamamoto, Y. A Consideration of Pan-Sharpen Images by HSI Transformation Approach. In Proceedings of the SICE Annual Conference 2010, Taipei, Taiwan, 8–21 August 2010; pp. 1283–1284. [Google Scholar]
  20. Aiazzi, B.; Baronti, S.; Selva, M. Improving component substitution pansharpening through multivariate regression of MS+Pan data. IEEE Trans. Geosci. Remote Sens. 2007, 45, 3230–3239. [Google Scholar] [CrossRef]
  21. Chen, Y.; Zhang, G. A Pan-Sharpening Method Based on Evolutionary Optimization and IHS Transformation. Math. Probl. Eng. 2017, 2017, 1–8. [Google Scholar] [CrossRef] [Green Version]
  22. Li, Y.; Xie, W.; Li, H. Hyperspectral image reconstruction by deep convolutional neural network for classification. Pattern Recognit. 2017, 63, 371–383. [Google Scholar] [CrossRef]
  23. Yuan, Y.; Zheng, X.; Lu, X. Hyperspectral Image Superresolution by Transfer Learning. IEEE J. Sel. Top. Appl. Earth Obs. Remote Sens. 2017, 10, 1963–1974. [Google Scholar] [CrossRef]
  24. Wycoff, E.; Chan, T.H.; Jia, K.; Ma, W.K.; Ma, Y. A non-negative sparse promoting algorithm for high resolution hyperspectral imaging. In Proceedings of the 2013 IEEE International Conference on Acoustics, Speech and Signal Processing, Vancouver, BC, Canada, 26–31 May 2013; pp. 1409–1413. [Google Scholar]
  25. Huang, B.; Member, A.; Song, H.; Cui, H.; Peng, J.; Xu, Z. Spatial and Spectral Image Fusion Using Sparse Matrix Factorization. IEEE Trans. Geosci. Remote Sens. 2013, 52, 1693–1703. [Google Scholar] [CrossRef]
  26. Simoes, M.; Bioucas-Dias, J.; Almeida, L.B.; Chanussot, J. A convex formulation for hyperspectral image superresolution via subspace-based regularization. IEEE Trans. Geosci. Remote Sens. 2015, 53, 3373–3388. [Google Scholar] [CrossRef]
  27. Fang, L.; Zhuo, H.; Li, S. Neurocomputing Super-resolution of hyperspectral image via superpixel-based sparse representation. Neurocomputing 2018, 273, 171–177. [Google Scholar] [CrossRef]
  28. Lanaras, C.; Baltsavias, E.; Schindler, K. Hyperspectral super-resolution by coupled spectral unmixing. In Proceedings of the IEEE International Conference on Computer Vision, Santiago, Chile, 7–13 December 2015; pp. 3586–3594. [Google Scholar]
  29. Jiang, J.; Liu, D.; Gu, J.; Susstrunk, S. What is the space of spectral sensitivity functions for digital color cameras? In Proceedings of the IEEE Workshop on Applications of Computer Vision, Tampa, FL, USA, 5–17 January 2013; pp. 168–179. [Google Scholar]
  30. Enhance Contrast Using Histogram Equalization - MATLAB Histeq. Available online: https://www.mathworks.com/help/images/ref/histeq.html (accessed on 4 September 2019).
  31. Bioucas-Dias, J.M. A variable splitting augmented Lagrangian approach to linear spectral unmixing. In Proceedings of the 2009 First Workshop on Hyperspectral Image and Signal Processing: Evolution in Remote Sensing, Grenoble, France, 26–28 August 2009; pp. 1–4. [Google Scholar]
  32. Iordache, M.; Bioucas-dias, J.M.; Plaza, A.; Member, S. Sparse Unmixing of Hyperspectral Data. IEEE Trans. Geosci. Remote Sens. 2011, 49, 2014–2039. [Google Scholar] [CrossRef] [Green Version]
  33. Jose, M. Bioucas Dias Welcome to the Home Page of Jose. Available online: http://www.lx.it.pt/~bioucas/ (accessed on 4 September 2019).
  34. Chakrabarti, A.; Zickler, T. Statistics of Real-World Hyperspectral Images. In Proceedings of the CVPR 2011, Colorado Springs, CO, USA, 20–25 June 2011; pp. 193–200. [Google Scholar]
  35. Kruse, F.A.; Lefkoff, A.B.; Boardman, J.W.; Heidebrecht, K.B.; Shapiro, A.T.; Barloon, P.J.; Goetz, A.F.H. The spectral image processing system (SIPS)-interactive visualization and analysis of imaging spectrometer data. Remote Sens. Environ. 1993, 44, 145–163. [Google Scholar] [CrossRef]
  36. Akhtar, N.; Shafait, F.; Mian, A. Bayesian sparse representation for hyperspectral image super resolution. In Proceedings of the 2015 IEEE Conference on Computer Vision and Pattern Recognition (CVPR), Boston, MA, USA, 7–12 June 2015; pp. 3631–3640. [Google Scholar]
  37. Akhtar, N.; Shafait, F.; Mian, A. Sparse Spatio-spectral Representation for Hyperspectral Image Super-resolution. In European Conference on Computer Vision; Springer: Cham, Switzerland, 2014; pp. 63–78. [Google Scholar] [Green Version]
  38. Yokoya, N.; Yairi, T.; Iwasaki, A. Coupled nonnegative matrix factorization unmixing for hyperspectral and multispectral data fusion. IEEE Trans. Geosci. Remote Sens. 2012, 50, 528–537. [Google Scholar] [CrossRef]
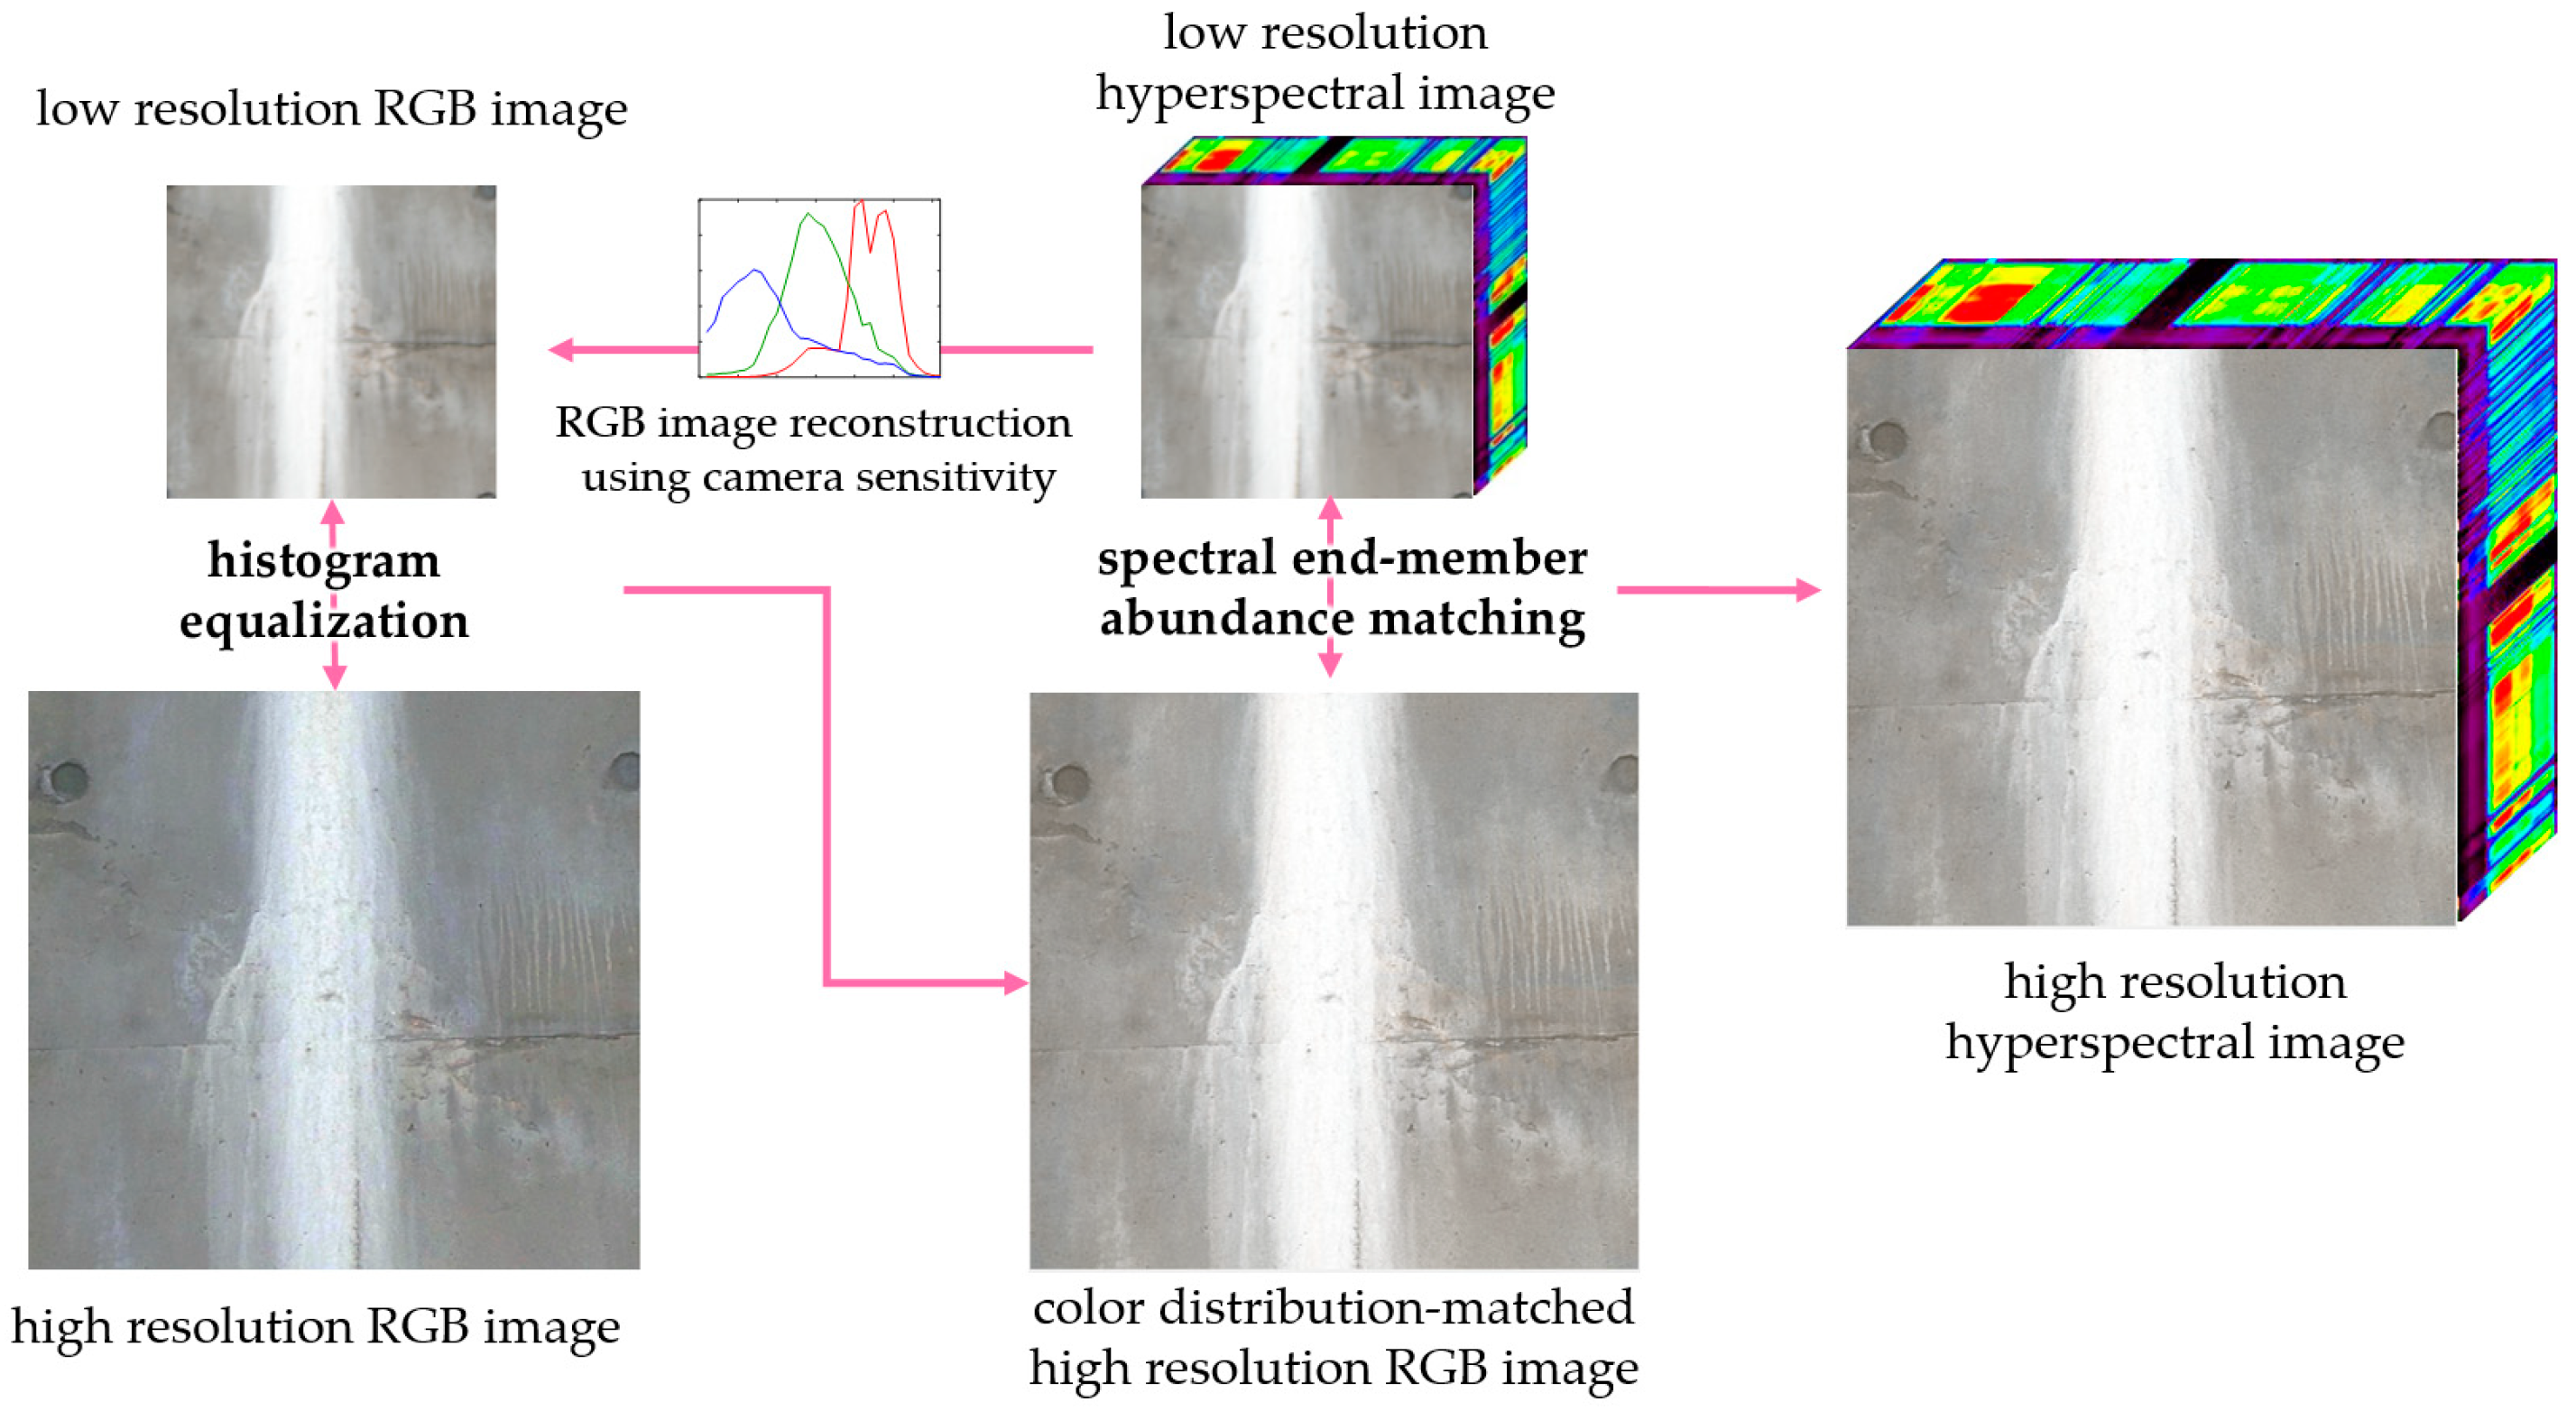
Figure 1. Overall framework of the proposed solution for hyperspectral super-resolution when spatial information of an Red-Green-Blue (RGB) image and a hyperspectral image (HSI) is mismatched.
Applsci 09 04444 g001
Figure 2. Example of pixel mismatch environment created by image processing: (a) Original RGB image reconstructed from an HSI from the Harvard dataset [34] with camera sensitivity for a Nikon D700, (b) mismatched image where 50 pixels on the upper and left sides are cut off; (c) color mismatched RGB image reconstructed using a Nokia N900.
Applsci 09 04444 g002
Figure 3. RGB camera sensitivity for RGB image reconstruction: camera sensitivity for (a) a Nokia N900 and (b) a Nikon D700.
Applsci 09 04444 g003
Figure 4. Example of a per-pixel RMSE (root–mean–square error) image from the Harvard dataset [34]: (a) Image where translation is applied by cutting off and (b) an image in which the histogram is not matched with that of an RGB image.
Applsci 09 04444 g004
Figure 5. Example of pixel mismatch representation using (a) cutting off ( P n indicates the number of pixels cut off from the left and upper sides) and (b) shear transformation.
Applsci 09 04444 g005
Figure 6. Example of per-pixel RMSE images and reconstructed RGB images of high-resolution HSIs: (a) Per-pixel RMSE image where a shear transformation with C x = 0.3 is applied, (b) a per-pixel RMSE image where translation with P n = 80 is applied, (c) RGB image an where shear transformation with C x = 0.3 is applied, and (d) RGB image where translation with P n =   80 is applied.
Applsci 09 04444 g006
Table 1. Overall algorithm for the proposed solution.
Requires:
H (low-resolution hyperspectral image)
I (high-resolution RGB image)
C (RGB camera sensitivity)
S (upsampling rate)
Reconstruct L by applying C to H
Match histogram of I to that of L
Initialize E ( 0 ) with SISAL and A ( 0 ) with SUnSAL from H
Initialize A ( 0 ) by upsampling A ( 0 ) with S
k ← 0
while not converged do
  kk + 1
   A ( k ) A ( k 1 ) S ; Estimate E ( k ) with (8a) and (8b)
end while
return Z = E ( k ) A ( k )
Table 2. Results for the Harvard database.
MethodRMSESAM
AverageMedianAverageMedian
Original results for the entire dataset1.71.52.92.7
Translation by cutting off11.610.367.728.11
Histogram not matched8.888.558.067.15
Table 3. Results for the Harvard database.
Method of Field of View MismatchLanaras et al. [28]Proposed Method
RMSESAMRMSESAM
AverageMedianAverageMedianAverageMedianAverageMedian
Without Transformation2.682.115.585.472.682.576.695.32
Shear Transformation Using Affine Matrix C x =   0.19.797.707.167.353.642.966.736.03
C x =   0.211.769.337.888.004.43.566.96.26
C x =   0.312.8910.628.378.685.194.307.26.18
Translation by Cutting off Upper and Left Sides P n =   20 9.126.936.716.833.562.876.655.65
P n =   40 10.958.177.317.404.253.276.865.80
P n =   60 12.029.277.808.034.933.687.085.98
P n =   80 12.819.998.248.525.604.137.246.20