Article

Numerical Study on Scale Effect of Repetitive Plate-Loading Test

1
Department of Railroad Construction & Safety, Engineering, Dongyang University, 145 Dongyangdae-ro Punggi-eup, Yeongju-si 36040, Korea
2
Department of Civil & Railroad Engineering, Daewon University College, 316 Daehak-ro, Jecheon-si 27135, Korea
3
SungPoong Construction Co., Ltd., 76, Chilseong-ro, Jecheon-si 27165, Korea
*
Author to whom correspondence should be addressed.
Appl. Sci. 2019, 9(20), 4442; https://doi.org/10.3390/app9204442
Submission received: 10 June 2019 / Revised: 11 October 2019 / Accepted: 17 October 2019 / Published: 19 October 2019
(This article belongs to the Section Civil Engineering)

Abstract

:
Repetitive plate-loading test is intended to identify the elastic modulus of a target structure subjected to dynamic loading; such tests are mainly applied to railway roadbeds. The repetitive plate-loading test uses the same equipment as the plate-loading test but different loading methods. The plate-loading test derives the subgrade reaction modulus (k30), while the repetitive plate-loading test derives the strain modulus (Ev2). The former considers the scale effect of the loading-plate size, whereas the latter does not, thereby reducing the reliability of the results. Therefore, numerical analysis was conducted to propose a scale effect that can applied to field tests. First, to verify the 50-mm loading plate, a previous study comparing the results of the 300-mm loading plate in a field test was simulated by a numerical analysis, and the results were compared and analyzed. Next, the strain modulus was investigated according to the loading-plate size under subgrade conditions. An equation to estimate the scale effect applicable to loading plates with diameters of less than 762 mm was derived. The relationship between the calculated strain and elastic moduli was additionally analyzed.

1. Introduction

To control the quality of earthworks in the field, a plate-loading test for roads (KS F 2310, Korea) and a plate-loading test for railways (DIN 18134, Germany) are conducted in Korea. These tests are mainly conducted because they are simpler and less time-intensive than the field-density test with respect to compaction quality-control criteria based on support stiffness [1]. Both tests calculate the elastic modulus (E) required to assess the stiffness of a material using the bearing-capacity factor whose concept is similar to that of elastic modulus. The tests require considerable cost and time because they are conducted in the field using heavy machinery, and loading plates with diameters larger than 300 mm are specified as a standard [2]. In addition, as the names of the two methods are the same, this study uses the terms “plate-loading test” for the plate-loading test for roads (KS F 2310, Korea) and “repetitive plate-loading test” for the plate-loading test for railways (DIN 18134, Germany). The plate-loading test uses the subgrade reaction modulus (k30), and the repetitive plate-loading test uses the strain modulus (Ev2) as the bearing-capacity factor. In the plate-loading test, the scale effect is applied according to the size of the loading plate. In the repetitive plate-loading test, however, the scale effect of the loading plate is not considered.
Meanwhile, in the case of the roadbed of a concrete track, whose domestic construction has increased, settlement frequently occurs because of defective natural ground treatment and drainage as well as insufficient embankment construction, causing problems that relate directly to railway safety [3]. In general, to reinforce the soft ground during the construction of underground structures and tunnels, various injection methods have been researched and applied, including consolidation grouting for sand and weathered soil, and permeation grouting for weathered rocks with developed joints. Their reinforcement effects are assessed in terms of the strength, bearing capacity, and stiffness [4]. For railway roadbeds, however, re-settlement continuously occurs because the roadbed itself cannot be reinforced, although track-restoration methods are being implemented. Cases of direct reinforcement of the railway roadbed and studies on the reinforcement method to prevent re-settlement are also insufficient [5].
To develop reinforcement materials and methods, several small-scale laboratory tests are required to correct numerous errors that may occur in the initial verification stage. In a concrete track roadbed that is sensitive to settlement, assessing the reinforcement effect in terms of the bearing capacity and stiffness, instead of the strength, is reasonable. In current laboratory tests, however, only uniaxial compressive strength tests can be conducted on reinforced subgrade samples. In addition, many difficulties are encountered in assessing the stiffness through laboratory tests because a reaction system that can replace heavy machinery and a large soil tank that considers the influence range of a loading plate with a diameter larger than 300 mm are required.
Jung et al. [6] mentioned the necessity for a loading plate with a diameter of less than 300 mm, smaller than those generally used in the laboratory repetitive plate-loading test. To verify the results of the use of a 50-mm-diameter loading plate, the results were compared with those of a 300-mm-diameter loading plate in a field test. The results of the two loading plates showed distinct differences, thereby confirming the need for the loading-plate scale effect. A regression equation was proposed for the scale effect of the loading plate. The study results, however, suffered from limited number of data because of the limitations of field testing, and materials with large particle sizes in the field-embankment roadbed have a greater effect on the 50-mm diameter loading plate than on the 300-mm-diameter one. In addition, although the repetitive plate-loading test was conducted in the same zone, the compaction and status of the subgrade were not exactly the same, which indicated that further studies are required as supplementary validation.
Therefore, in the present study, a numerical analysis was conducted, and a correction factor for the scale effect of the loading plate of the repetitive plate-loading test was proposed through a parameter study on the diameter of the loading plate to mitigate the limitations of the aforementioned field-verification test. The results were compared with those of the existing field-verification test, and the correction factor was investigated according to the subgrade condition by classifying the soils based on the cohesion and friction angle.

2. Theoretical Background

2.1. Plate Loading and Repetitive Plate-Loading Tests

The plate-loading test is a representative field-testing method that determines the bearing-capacity factor considering the deformation characteristics of the subgrade. The average vertical stress and settlement amount are measured by applying a load to the surface of the roadbed after completion of the construction using a circular rigid plate with a thickness of 22 mm or more. The subgrade reaction modulus can be obtained using Equation (1).
k = σ s
where k is the subgrade reaction modulus (MN/m3), s is the significant settlement amount (asphalt concrete: 2.5 mm; cement concrete: 1.25 mm), and σ is the vertical stress corresponding to the significant settlement amount (kPa).
This subgrade reaction modulus represents the subgrade reaction of the foundation, i.e., the gradient in the relationship between the resistance of the subgrade and displacement per unit area. It is the solution of the boundary-value problem, instead of a property of the subgrade, and is affected by the size of the loading plate and loading conditions [2]. For this scale effect, many experimental studies have been conducted on the relationship between the width of the foundation and settlement amount. When the stress–settlement curve is assumed to be linear, the scale effect of the subgrade reaction modulus can be expressed using its reciprocal [7]. Equation (2) is the empirical formula proposed using the results of the loading test conducted by Terzaghi and Peck [8], which is most widely used. The scale effect proposed by other studies is summarized by Equation (3).
S S o = B B o                                                                                   ( C o h e s i v e   s o i l ) S S o = ( 2 B B + B o ) 2                                                               ( S a n d y   s o i l )
where S is the settlement amount of the foundation with width B, and So is the settlement amount measured using the loading plate with width Bo.
k k o = ( B B o ) n
where:
  • n = −0.2 to −0.4 (loose–medium dense sand, Bond [9])
  • n = −0.4 to −0.5 (dense sand, Bond [9])
  • n = −0.495 (pure sand, Chung and Kim [10])
  • n = −0.965 (pure clay, Chung and Kim [10])
  • n = −0.750 (Korean Standard Association [11])
The repetitive plate-loading test is commonly used in Europe, especially in Germany. The average vertical stress and settlement amount are measured by applying loading, unloading, and reloading on a circular rigid plate. The subgrade strain modulus (Ev) can be obtained using the measured stress–settlement curve and Equation (4). The strain modulus of the first loading curve is referred to as the primary strain modulus (Ev1), and that of the second loading curve is referred to as the secondary strain modulus (Ev2). Quality control of the subgrade is performed using the secondary strain modulus, and this value represents the strain modulus of the roadbed [12].
E v = 1.5 · r · Δ σ Δ s
where r is the radius of the loading plate (mm), ∆s is the difference in the settlement amount between the points with 30% and 70% of the maximum stress, and ∆σ is the difference in the stress.
Equation (4) is a theoretical equation that derives the vertical displacement due to the load applied to the rigid circular plate placed on a homogeneous, isotropic, elastic, and semi-infinite mass based on the elastic theory [13]. It does not consider the scale effect of the loading plate because the radius of the loading plate is considered a variable. However, because it is based on the elastic theory derived under the assumption of homogeneous subgrade, caution must be exercised when it is actually applied to the field subgrade in which sand and clay with various particle sizes are mixed. Examining the use of the scale effect in lieu of the radius of the loading plate is also necessary [6].

2.2. Previous Study Cases on the Scale Effect of the Loading Plate

Choi et al. [2] proposed a method of estimating the elastic modulus from the bearing-capacity factor derived from the plate-loading test based on the existing elastic theory and empirical correlations. In particular, they explained that the difference between the subgrade reaction and elastic moduli is caused by the nonlinear behavior of the plate-loading test in the region generally treated as having elastic behavior and that the measured properties approach the actual properties as the size of the loading plate increases. They also identified the deformation-level dependence, load duration, and loading-width dependence as the three major factors that cause such nonlinearity. Among them, the loading-width dependence refers to the characteristic in which the subgrade reaction modulus decreases as the loading width increases in the same subgrade. This result suggested the need for the scale effect. Further, the subgrade reaction and the elastic moduli have a suggested estimated ratio of 2:1, while the subgrade strain and elastic moduli have that of 1:1.
Jung et al. [6] suggested the need for a loading plate that is smaller than 300 mm for the laboratory repetitive plate-loading test. For this, they examined the previous study cases and compared the repetitive plate-loading test results of the 50- and 300-mm loading plates through a field test. They found that the test results using the two loading plates were similar (correlation coefficient: 0.987), but there was an average difference of 6%. Therefore, they mentioned that caution must be exercised when the results using the 50-mm loading plate are used. The results had a limited number of data because of the limitations in the field test, and the 50-mm loading plate could have been more affected by the particle sizes of the embankment roadbed because they were irregular in the field.
Chung and Kim [10] mentioned that the scale effect applied to the plate-loading test can be applied to pure sand or clay and that such an application suffers from problems for mixed sand and clay in the field. As such, they proposed an estimation equation for the reasonable application of the scale effect according to the mixing ratios of sand and clay when the bearing capacity and settlement amount of the actual foundation are estimated. Their proposal suggested that different scale effects must be applied depending on the subgrade condition.
Zhu et al. [14] conducted numerical analyses and model tests on band and circular bases and drew the following conclusions. In dry sand, when the base size increased from 0.1 m to 10 m, the bearing capacity increased from 0.62 MPa to 12.3 MPa in the band base and from 0.29 MPa to 6.73 MPa in the circular base. When the base increased by approximately 10 times, the bearing-capacity factor decreased by 55%. Similar results were obtained in the centrifugal model test.
To use unbonded granulated material mixed with the rubber particles of scrap tires as raw material for roads and railways, Hidargo et al. [15] performed laboratory and field tests to assess the bearing capacity of the mixture. In the laboratory, a repetitive plate-loading test was performed using a 75-mm loading plate, while in the field test, a repetitive plate-loading test was performed using a 300-mm loading plate. A linear regression analysis was performed for the stiffness values measured in the laboratory and field tests. The results of the two tests had a similar correlation. However, the number of samples used for statistical analysis was small (four data points), and the subjects evaluated were the same. This study has limitations as it was conducted under different conditions for the laboratory and field tests.

2.3. Study Overview

In the current study, a numerical analysis that can ensure more data through various parameter studies and that can simulate a homogeneous subgrade was conducted to mitigate the limitations of the existing field-verification test. To propose the scale effect of the repetitive plate-loading test according to the subgrade condition, the soils were classified according to the cohesion and friction angle, and the measurement results were analyzed according to the size of the loading plate. Figure 1 shows a flowchart that briefly illustrates the process and contents of this study.

3. Numerical Analysis

3.1. Analysis Software and Modeling

In this study, PLAXIS 3D, a universal finite-element analysis software program, was used for the numerical simulation of the repetitive plate-loading test. For the subgrade modeling, the Mohr–Coulomb elasto–plastic model, which can most accurately express the behavior of soil, was used. The elastic modulus (E) and Poisson’s ratio (ν) were used to express the elastic characteristics, whereas the internal friction angle (φ), cohesion (c), and dilatancy angle (ψ) were used as the input properties to express the plastic characteristics. This is a homogeneous and isotropic continuum model that excludes the effect of particle size on the soil material. Meanwhile, for the modeling of the loading plate, the plate element, which can simulate a thin two-dimensional structure with flexural rigidity, was used, and very high stiffness was set as the input property so that the displacement generated in the modeled loading plate itself by the applied load could not affect the analysis results.
Regarding the soil models to numerically analyze the loading plate scale effect of the repetitive plate-loading test, we used a total of six models based on the loading plate diameter. Among them, Figure 2a shows the representative model, with a diameter of 762 mm. As shown in Figure 2b,c, all conditions, excluding the diameter of the loading plate and the surrounding mesh size, are the same in each model. The size of the numerical model was determined by considering the range of influence of the 762-mm loading plate. A range of influence of five times the diameter was considered for the x- and y-axis directions, and twice the diameter for the z-axis direction. Based on this, we selected a numerical model size of 8 m × 8 m × 2 m. PLAXIS 3D automatically generated meshes, and the size of the mesh varied depending on the size of the relative element size. A modulus of 1.0, which was the default value, was used for mesh generation, and the subgrade was set as a single layer with one property. Moreover, for the boundary conditions of the numerical analysis, the displacement was constrained in the horizontal direction at each side boundary (x and y directions) and in the vertical direction at the bottom boundary (z direction), and the upper surface represents the earth surface with a free-surface-boundary condition.

3.2. Analysis Condition

To determine the input properties of the numerical analysis, laboratory tests were conducted by directly collecting samples from the site where the repetitive plate-loading test was conducted. We performed a density measurement test (KS F 2308-06), water content test (KS F 2306-00), liquid limit test (KS F 2303-15), and direct shear test; the test results are summarized in Table 1.
In addition to the conditions of the embankment roadbed on which the field verification test was conducted, four types of embankment roadbeds were additionally used as soil conditions. To determine the input properties, we referred to the Road Design Manual [16] published by the Korea Ministry of Land, Transport and Maritime Affairs. Each subgrade was analyzed by varying the size of the loading plate. Table 2 lists the summary of the analysis cases and applied properties. For the dilatancy angle of the embankment roadbed, the value ψ = φ − 30° proposed by Bolton [17] was used. For the Poisson’s ratio, the value assumed in the induction process of the strain-modulus assessment equation of the repetitive plate-loading test (ν = 0.21) was used. Areas with various strain moduli were simulated similar to those in the field test by varying the value of the elastic modulus.
In the area of the loading plate modeled at the center of the analysis model, the load in the vertical direction to the subgrade with the same magnitude as the repetitive plate-loading test was simulated in a stepwise manner. The node located on the earth surface at the center of the loading plate was selected as the measurement point, and the displacement generated by the load applied in a stepwise manner was measured. Regression curves were drawn for each loading, unloading, and reloading step. The settlement amounts at points with 30% and 70% of the maximum stress were determined using a regression equation. The primary strain modulus of the loading step and secondary strain modulus of the reloading step were calculated using Equation (4).

4. Analysis of the Results

4.1. Comparison with the Results of the Existing Field-Verification Test

In a previous study mentioned earlier, Jung et al. [
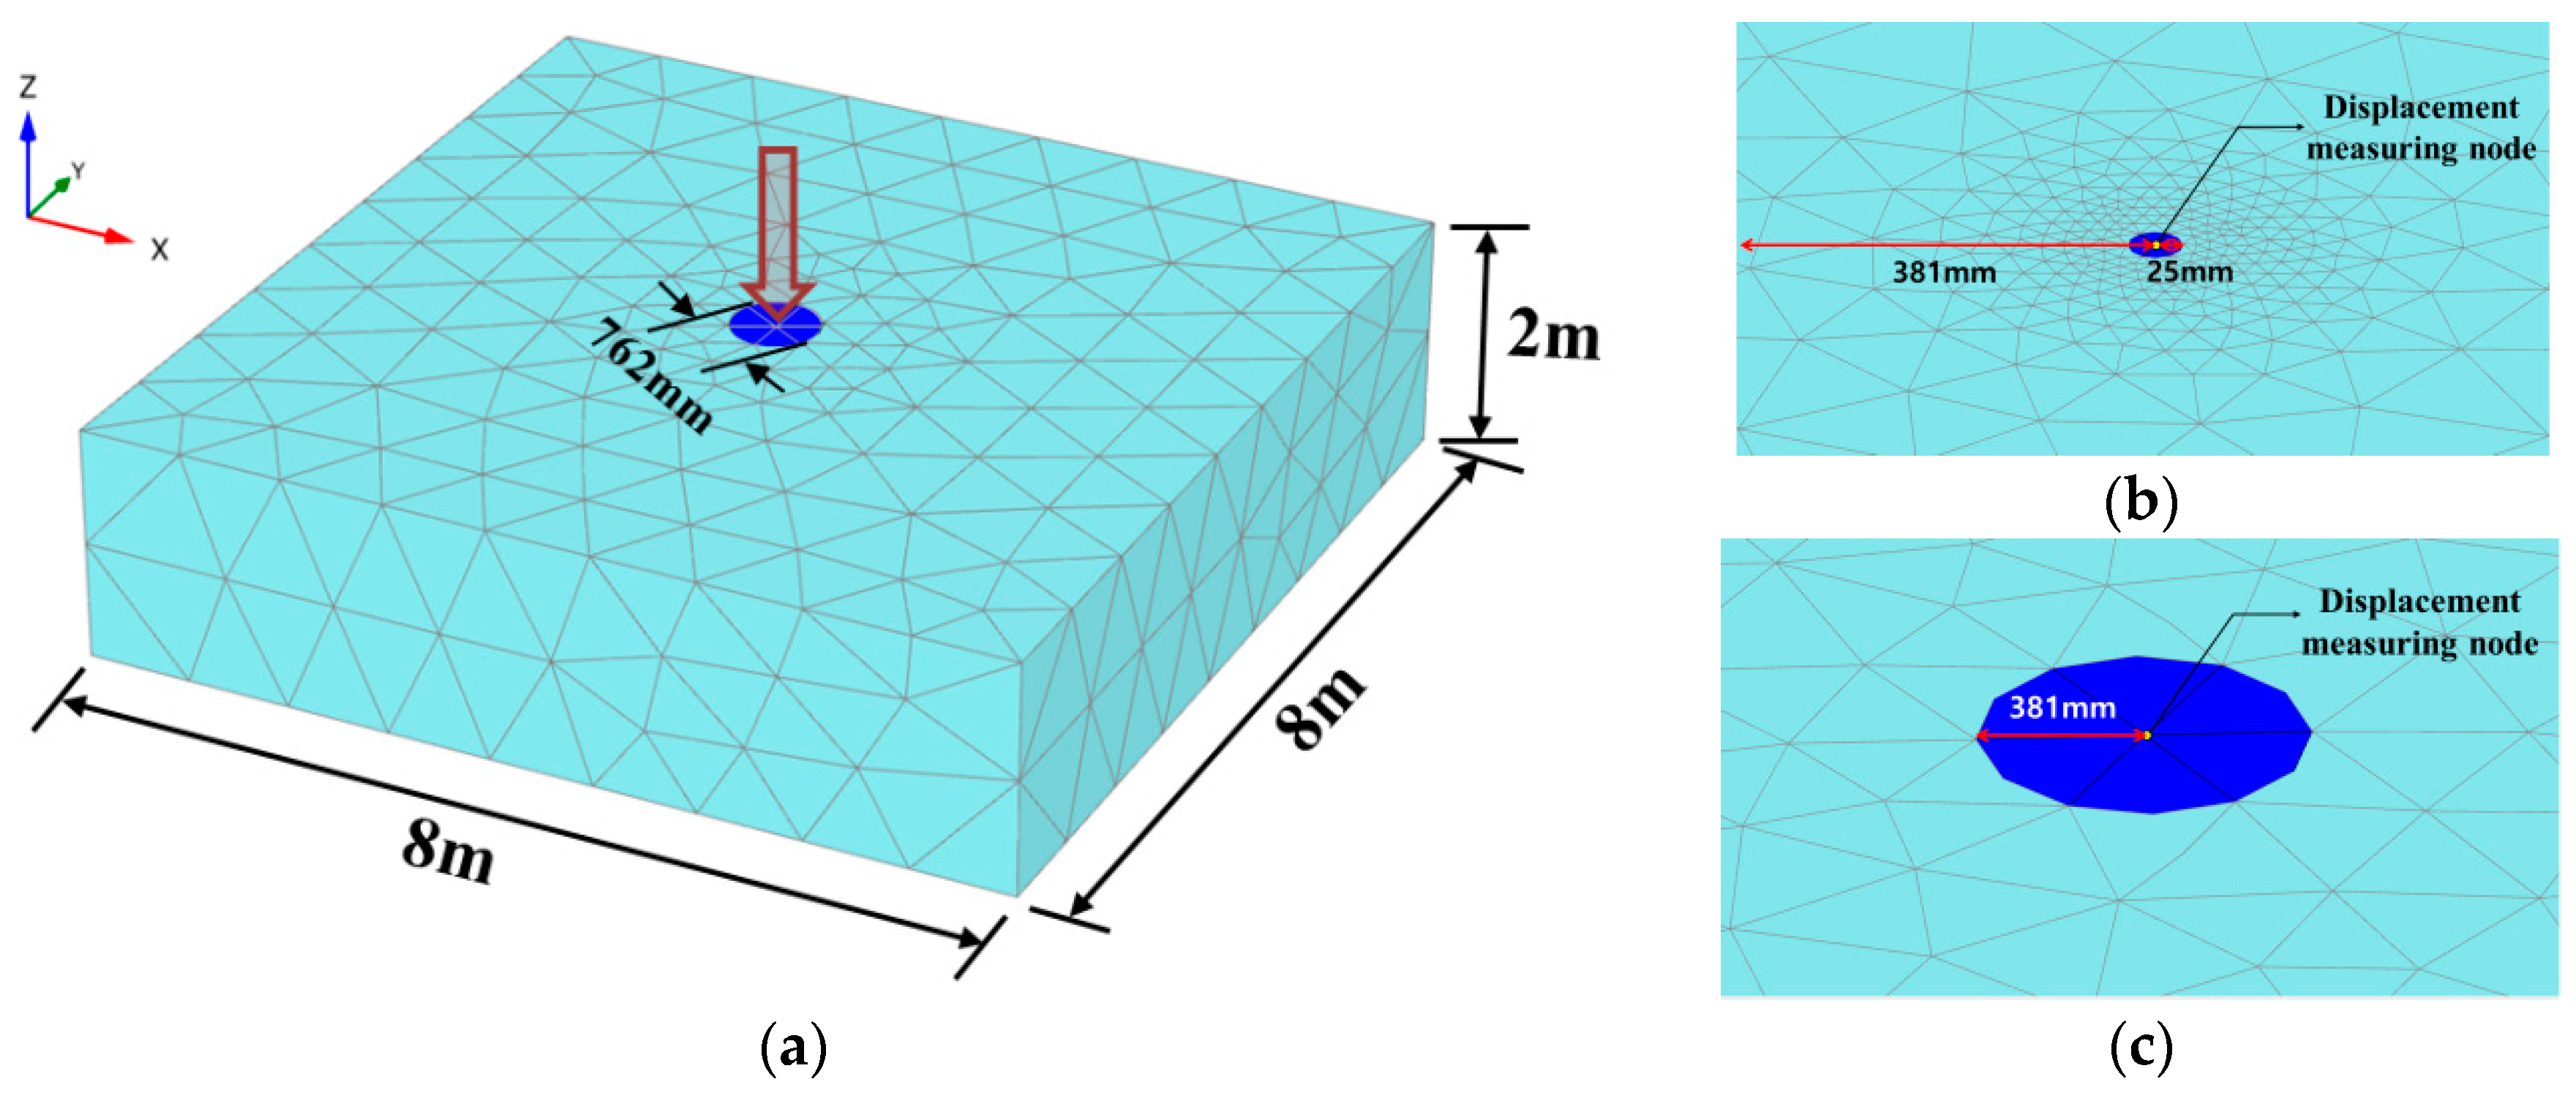
6] conducted a field test to verify the small loading plate with of 50 mm in diameter and compared the results with those of the 300-mm loading plate. In this section, the repetitive plate-loading tests of the 50-mm and 300-mm loading plates were numerically analyzed by modeling the embankment roadbed where the existing field test was conducted. The results were compared with those of the existing field-verification test. Areas with various strain moduli were simulated similar to those in the field-verification test by varying the value of the elastic modulus among the input properties. All conditions except for the size of the loading plate were the same. Table 3 and Table 4 list the results of the field test and numerical analysis, respectively. The primary strain modulus (Ev1), secondary strain modulus (Ev2), and ratio of the secondary to the primary strain moduli (Ev2/Ev1) were summarized. In particular, the difference in E
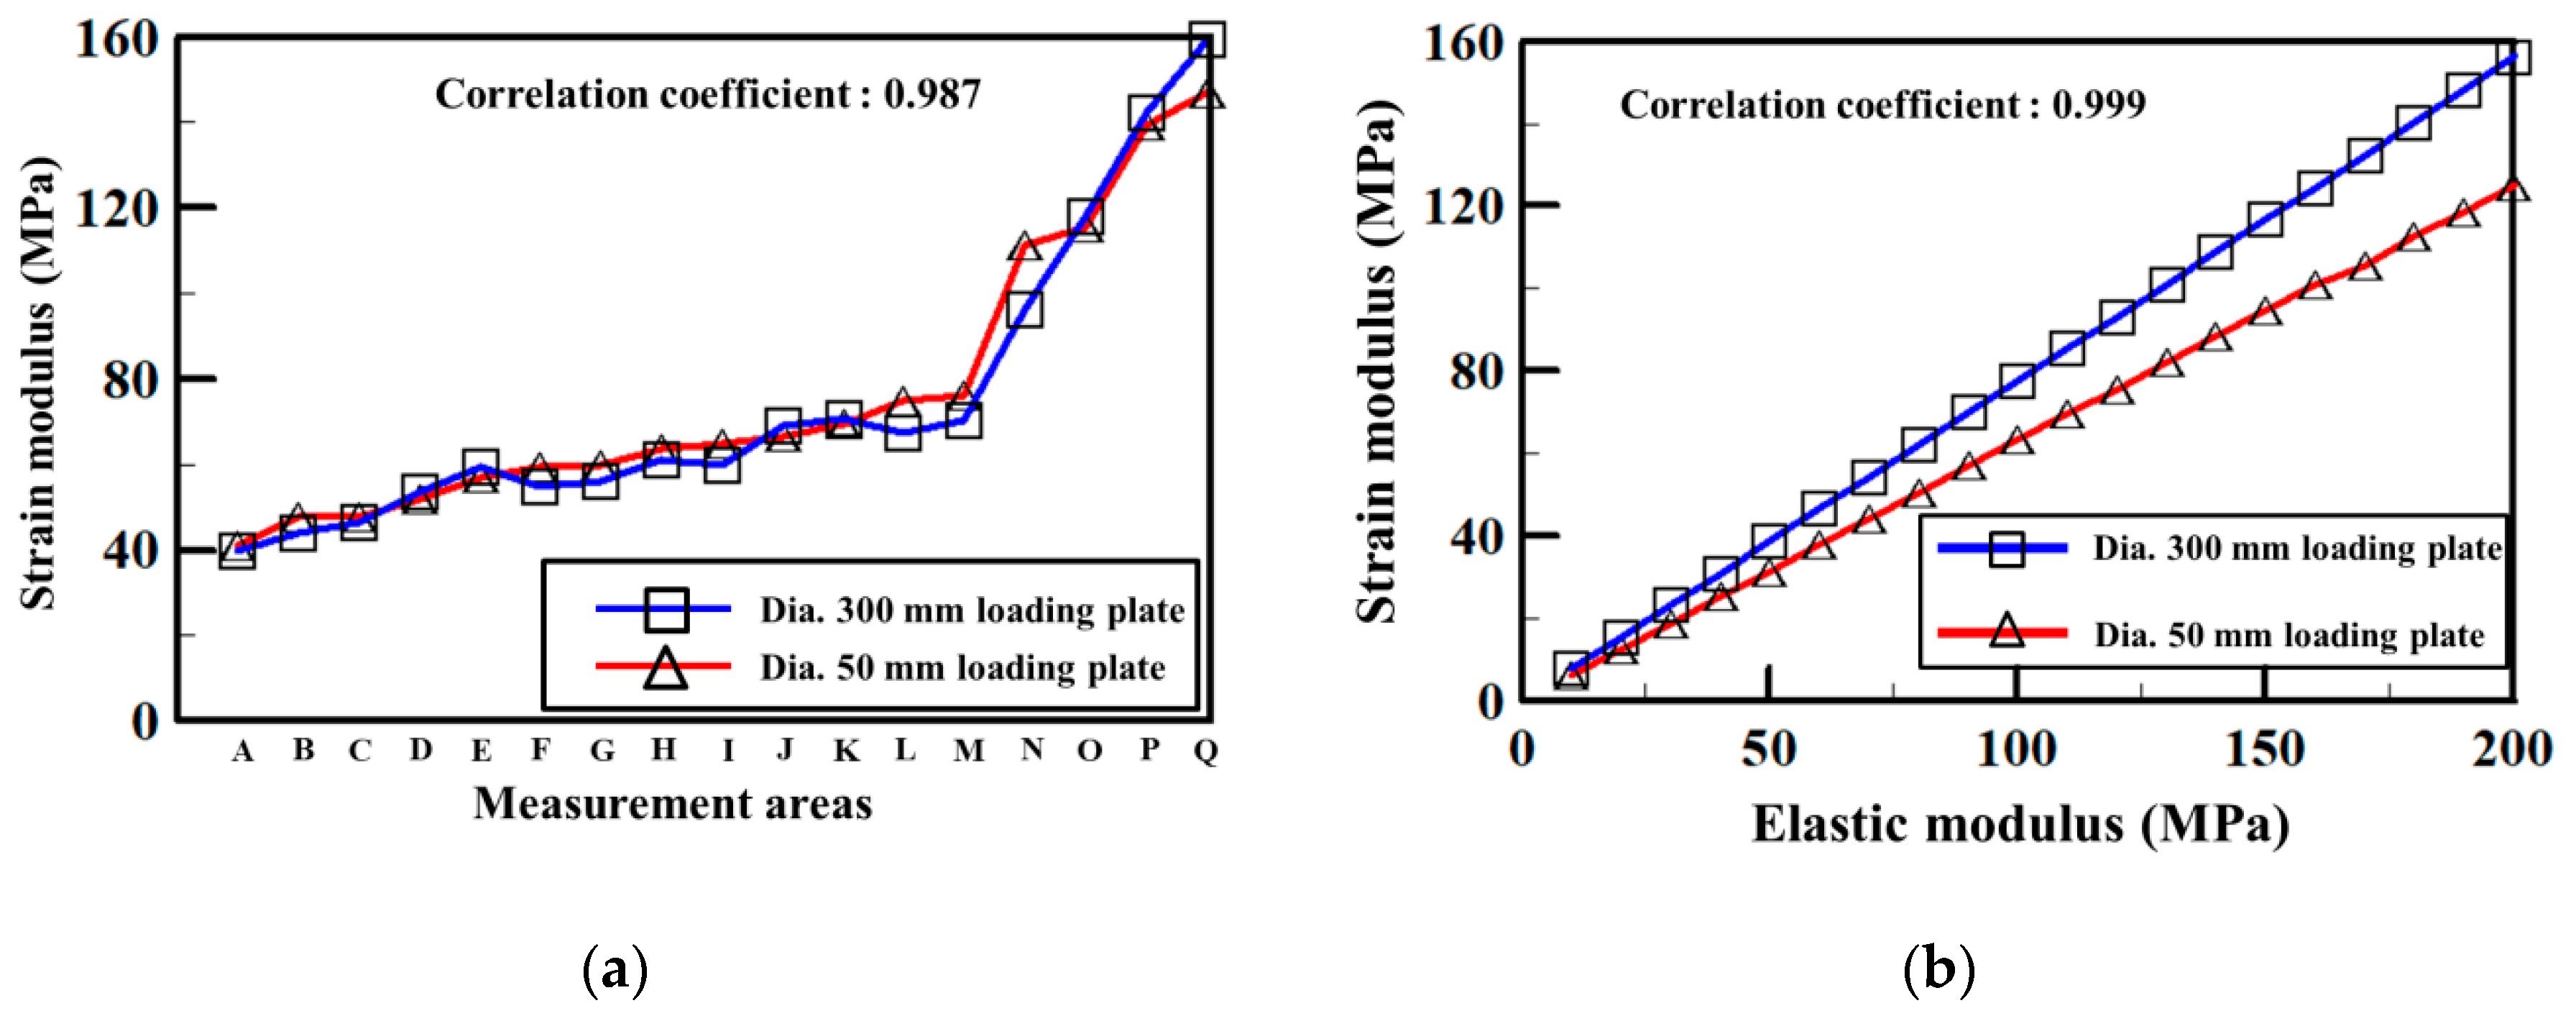
v2 applied as the subgrade strain modulus is shown as graphs in Figure 3, and the correlation between the two results was analyzed.
When the degree of compaction was lower, the roadbed exhibited a large plastic strain at the initial load and gradually exhibited an elastic behavior at repetitive loads. In other words, Ev1 is a strain modulus expressing the initial settlement, and Ev2 is a strain modulus expressing the subsequent elastic settlement. Accordingly, Ev1 is more affected by the degree of compaction. In South Korea, among the measurements of a repetitive plate-loading test, Ev2 is conventionally used as the strain modulus to manage the quality of the roadbed, whereas Ev1 is not adopted for roadbed management. However, the ratio between Ev2 and Ev1 (Ev2/Ev1) is used to manage the degree of compaction of the roadbed. Accordingly, Ev2 is the strain modulus of the roadbed, and Ev2/Ev1 indicates the compaction degree of the roadbed.
In the field test, the difference in the measurements between Ev1 and Ev2 was irregular both for the 50 mm and 300 mm loading plates. The results of either loading plate did not show a tendency to be smaller or larger. In every area, both the 50 mm and 300 mm loading plates exhibited a variety of distribution in the values of Ev2/Ev1, and the difference between Ev1 and Ev2 was also irregular. On the other hand, in the numerical analysis, the results of the 50 mm loading plate were smaller than those of the 300 mm loading plate, and the deviation was not large for both Ev1 and Ev2. The value of Ev2/Ev1 was also 2.0 for both the loading plates in every range, and the difference between Ev2 and Ev1 tended to be constant.
As for the result of the field test, Jung et al. (2018) found that the 50-mm loading plate was more affected by solid materials with large particle sizes, which are often included in rough embankment roadbeds, than the 300-mm loading plate, and thus, the strain modulus was excessively measured. As the elasto-plastic model used in this numerical analysis assumed homogeneous areas and excluded the effect of roadbed materials with large particle sizes, the strain modulus for the 50 mm loading plate was not excessively measured and the values of Ev2/Ev1 were constant. Consequently, the numerical analysis could improve the limitations of the field test, and the sole effect of the loading plates could be identified.
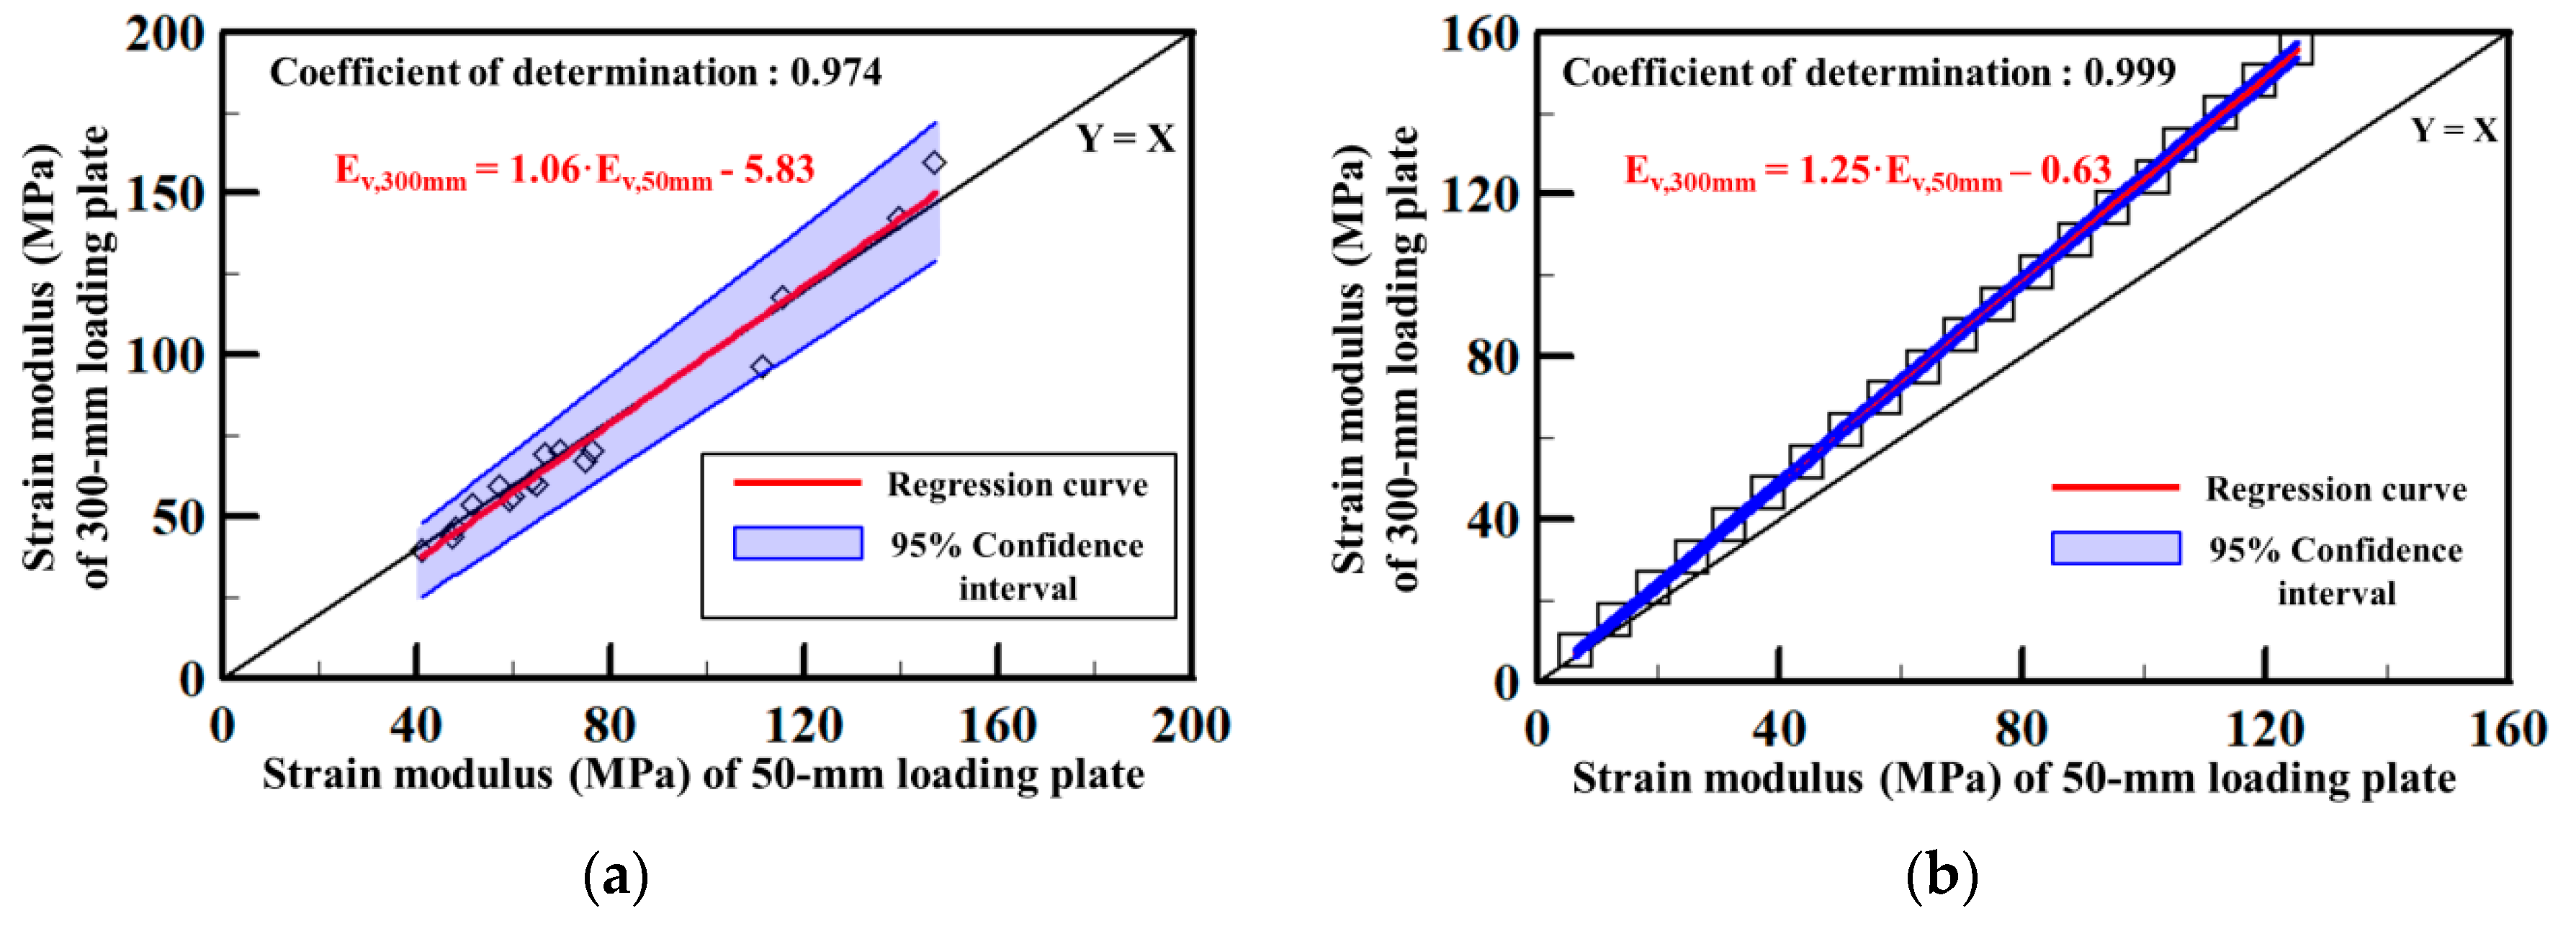
Figure 4 shows the linear regression analysis of the field test and numerical analysis results of the 50-mm and 300-mm loading plates. Equation (5) represents the regression equation of the field test, and Equation (6) represents the regression equation of the numerical analysis results derived from the analysis. The coefficient of determination of the field-test regression equation was 0.974, and the standard error was approximately 3.7. The average difference from the actual data was approximately 5.5%. For the regression equation of the numerical analysis results, the coefficient of determination was 0.999, and the standard error was approximately 0.7. The average difference from the actual data was approximately 1.8%. Therefore, the reliability of the regression equation was higher than that of the field test. These results indicated that the regression equation derived from the numerical analysis results could estimate the results of the 300-mm loading plate with a higher reliability than those measured using the 50-mm loading plate.
E v 2 , 300 m m = 1.06 · E v 2 , 50 m m 5.83 ( E v 2 , 50 m m > 7 )
E v 2 , 300 m m = 1.25 · E v 2 , 50 m m 0.63 ( E v 2 , 50 m m > 0.5 )
where Ev2,300mm is the strain modulus measured using the 300-mm loading plate, and Ev2,50mm is that measured using the 50-mm loading plate.

4.2. Loading-Plate Scale Effect of the Repetitive Plate-Loading Test under Field-Test Roadbed Condition

Because the subgrade reaction modulus of the plate-loading test is the solution to the boundary-value problem in which the loading plate contacts the subgrade, the original properties of the subgrade were approached, and the modulus decreased when the size of the loading plate increased. Therefore, the subgrade reaction modulus was used considering the effect of the loading plate size, as expressed in Equation (3). Because the repetitive plate-loading test is also the solution of the boundary-value problem in the same manner, the scale effect must be considered and corrected when the original properties of the subgrade were approached when the loading-plate size increased. The calculated value of the strain modulus also varied depending on the loading-plate size in the same subgrade.
Under the condition of the field-test embankment roadbed, we confirmed that the results of the 50-mm loading plate were approximately 19% lower than those of the 300-mm loading plate. Therefore, further research was conducted using 150-mm, 400-mm, 600-mm, and 762-mm loading plates under the same subgrade condition, and the results were compared with those of the 762-mm loading plate, which had the largest diameter among the employed loading plates, as listed in Table 5. The analysis results showed that the calculated strain-modulus value decreased as the loading-plate diameter decreased under the same subgrade condition. The ratios of the result of the 762-mm loading plate to each of the loading plates were 1.44, 1.22, 1.17, 1.09, and 1.08 for the 50-mm, 150-mm, 300-mm, 400-mm, and 600-mm loading plates, respectively. The deviation was close to zero under all subgrade conditions with different elastic moduli.
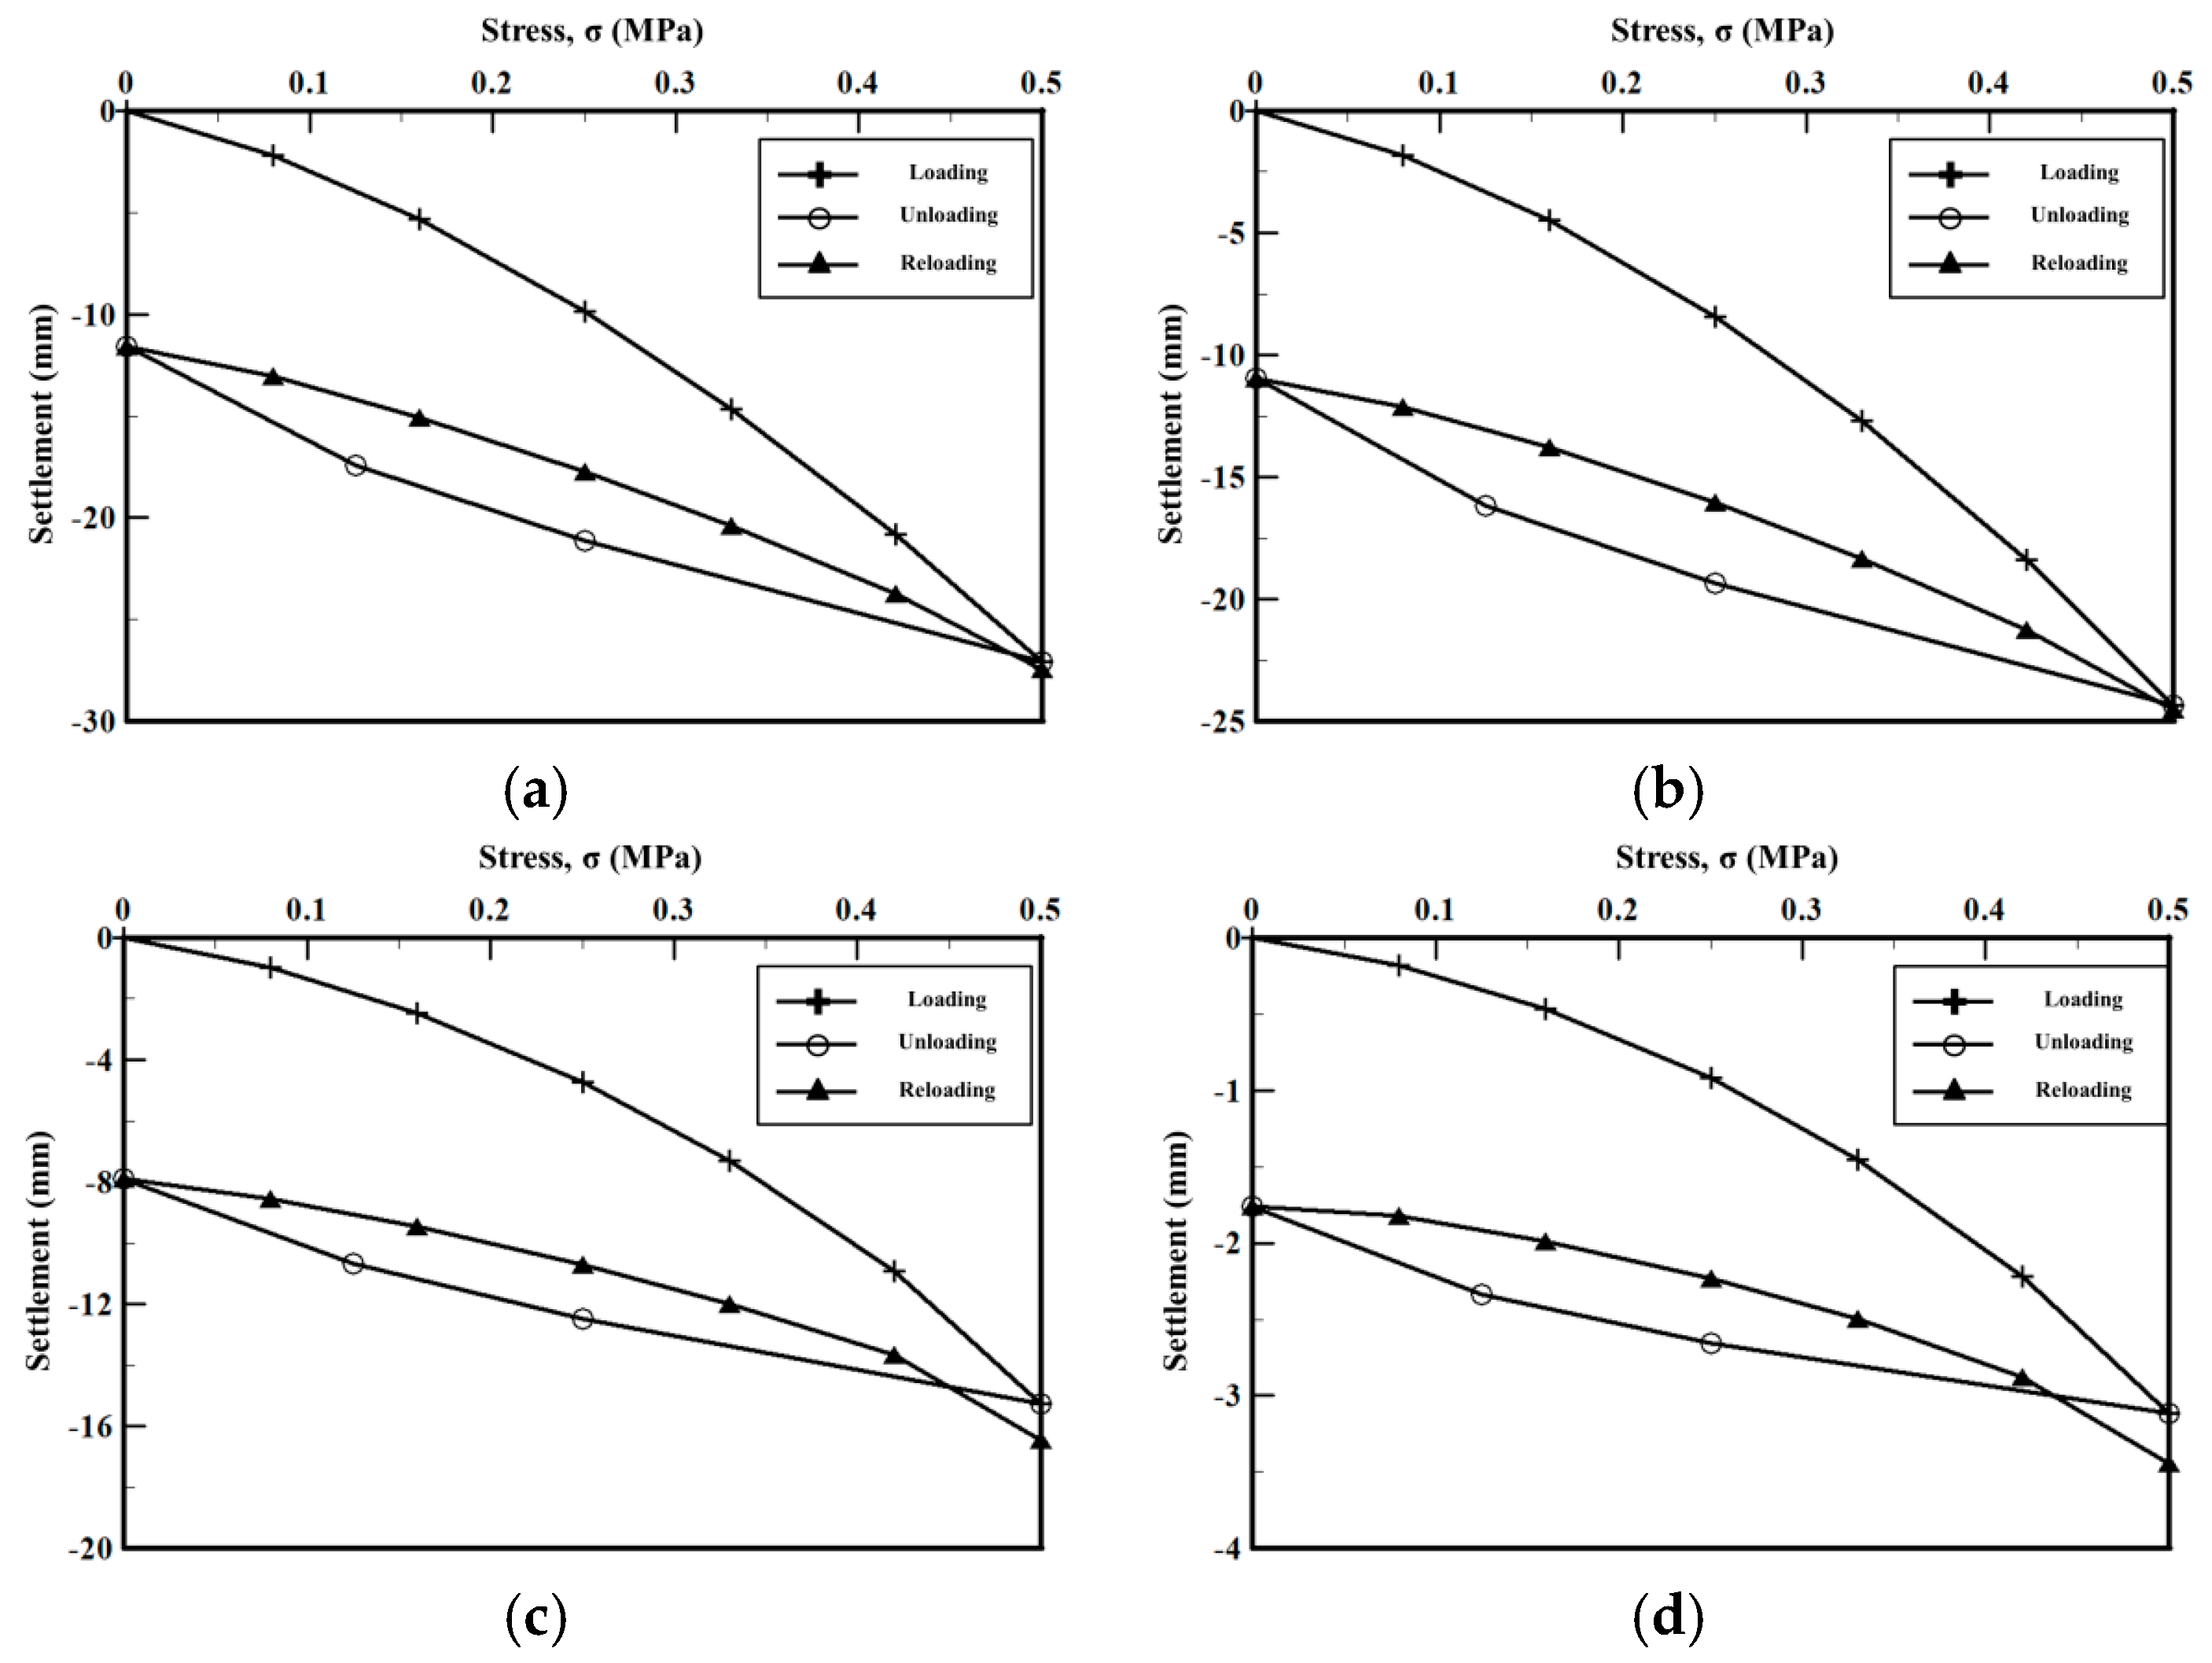
Figure 5 shows the stress–settlement curves of the 762-mm, 600-mm, 300-mm, and 50-mm loading plates in the subgrade with an elastic modulus of 20 MPa. Figure 5 shows that the nonlinearity of the stress–settlement curve increased as the loading-plate diameter decreased. In other words, nonlinear behavior was observed as the loading-plate size decreased in the subgrade area with the same elastic behavior. Because the strain-modulus estimation equation of the repetitive plate-loading test is a theoretical equation derived based on the elastic theory, the error increased as the nonlinear behavior increased, which was determined to cause the decrease in the calculated strain-modulus value as the loading-plate size decreased. Apparently, therefore, the scale effect must be considered, as expressed in Equation (7), when a loading plate with a diameter of 762 mm or less is used.
E v 2 , 762 m m = 1.08 · E v 2 , 600 m m = 1.09 · E v 2 , 400 m m = 1.17 · E v 2 , 300 m m = 1.22 · E v 2 , 150 m m = 1.44 · E v 2 , 50 m m

4.3. Loading-Plate Scale Effect of the Repetitive Plate-Loading Test under Subgrade Condition

In a previous study mentioned earlier, Chung and Kim [10] suggested that the scale effect applied to the plate-loading test be differently applied depending on the subgrade condition. In other words, the scale effect of the repetitive plate-loading test expressed by Equation (7) represents the value under the field-test subgrade condition, and it can be changed if the subgrade condition changes. Thus, in this section, the subgrade was classified into four types by referring to the embankment roadbeds classified in the Road Design Manual [
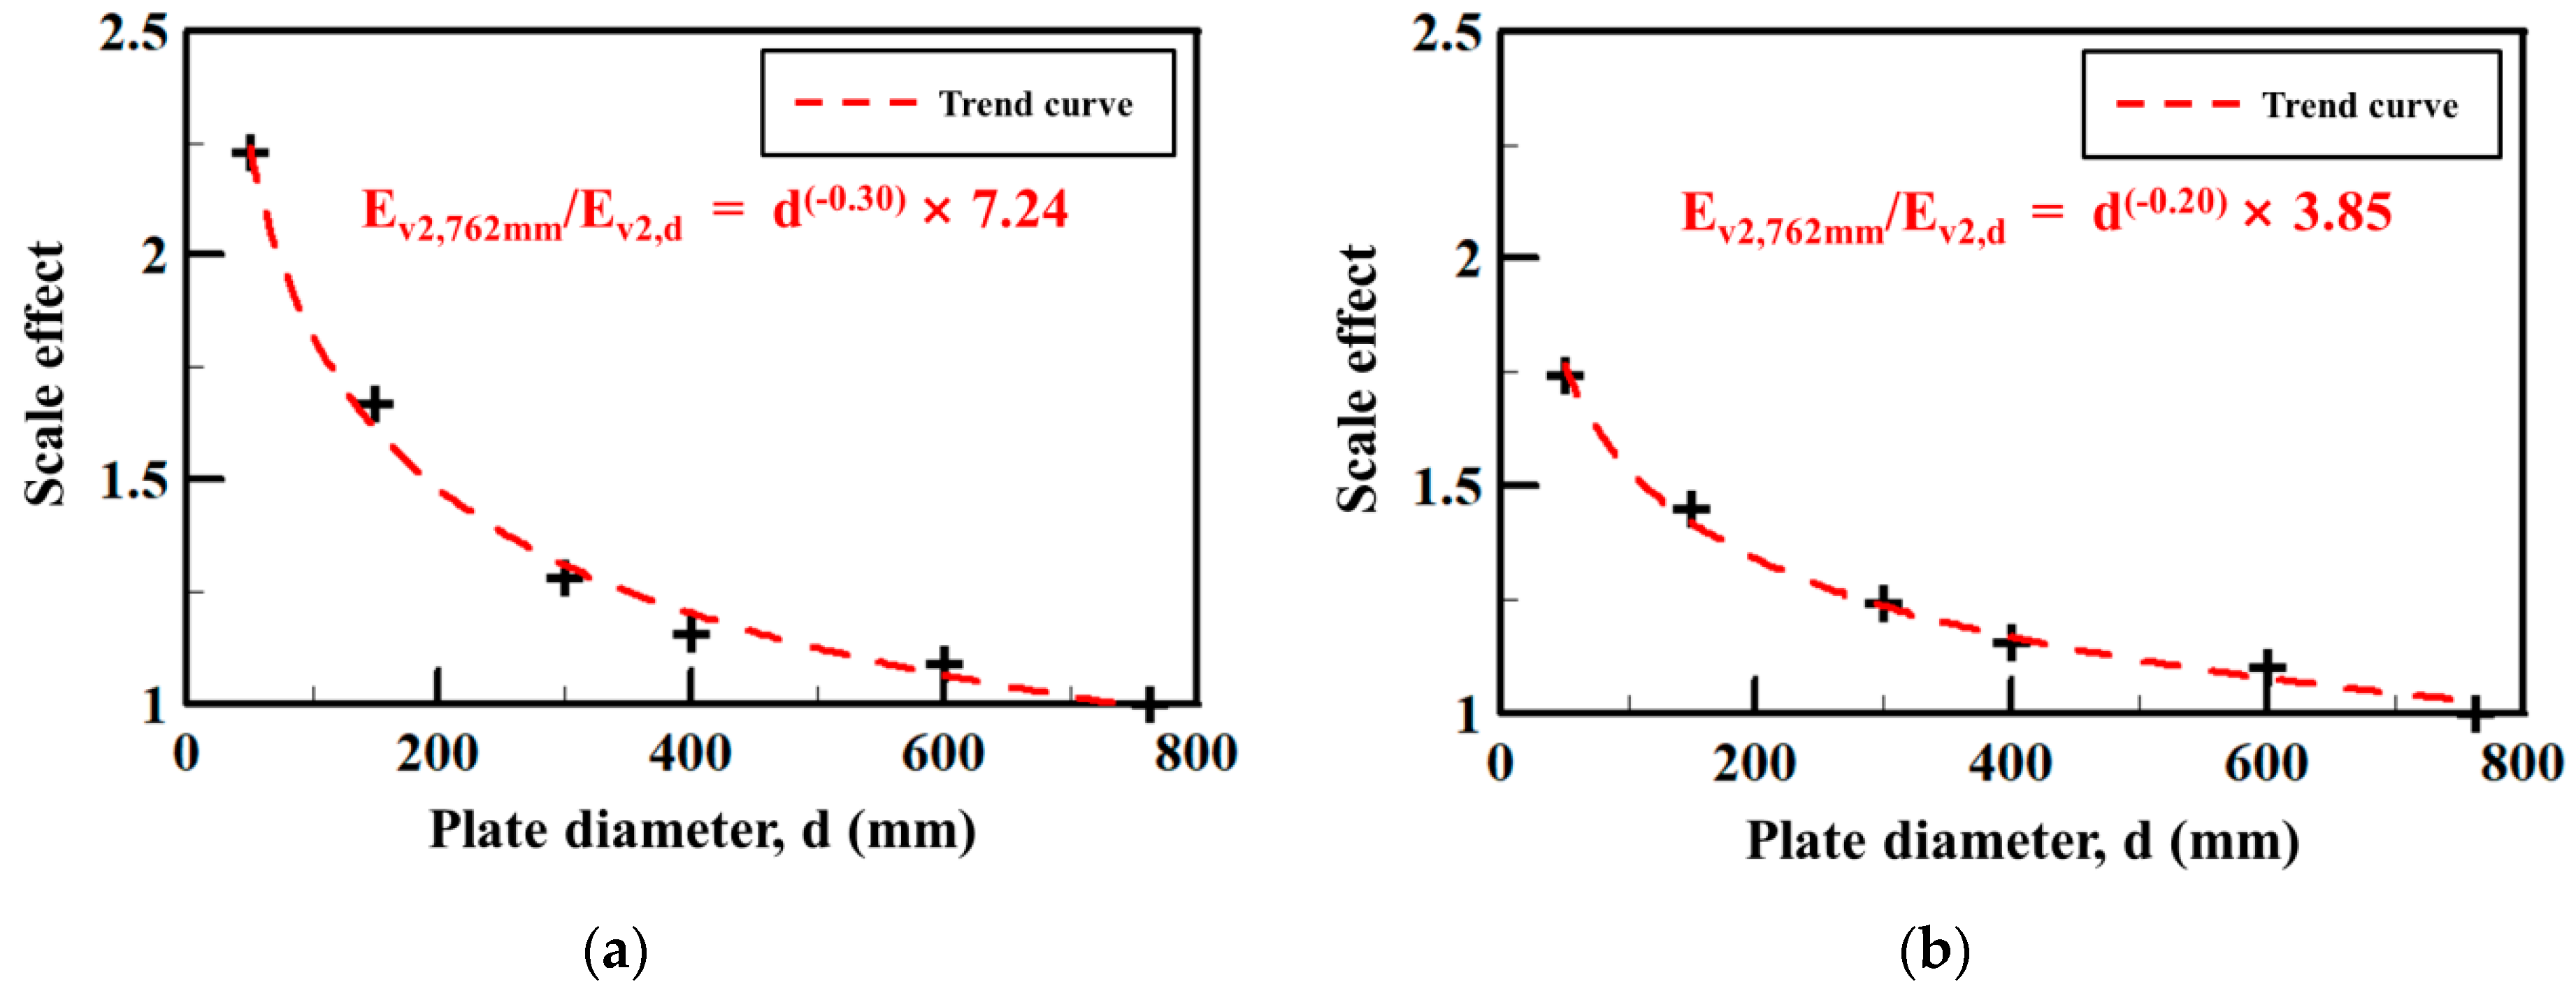
16], and numerical analysis was conducted under each subgrade condition using the loading-plate diameters applied earlier. In the same manner, areas with various strain moduli were simulated by varying the value of the elastic modulus among the input properties. As a result, the scale effect of the loading plate varied depending on the subgrade condition. Therefore, the scale effect apparently must be considered for strain-modulus measurement results of a loading plate that is smaller than 762 mm according to the subgrade condition of the repetitive plate-loading test, as listed in Table 6. Figure 6 shows the trend curves of the scale-effect results of the six loading plate diameters used in this study, and the trend equations (Equations (8)–(11)) were derived from the curves. These results can be used to roughly estimate the scale effect to be considered when a loading plate with a diameter that is not considered in this study is used.
( G r a v e l   a n d   f i n e   g r a v e l )           E v 2 , 762 m m E v 2 , d = d 0.30 · 7.24
( S a n d )           E v 2 , 762 m m E v 2 , d = d 0.20 · 3.85
( S a n d y   s o i l )           E v 2 , 762 m m E v 2 , d = d 0.12 · 2.21
( C o h e s i v e   s o i l )           E v 2 , 762 m m E v 2 , d = d 0.11 · 2.16
where Ev2,d is the secondary strain modulus when the loading plate diameter is d.

4.4. Examination through Comparison with the Scale Effect of the Existing Plate-Loading Test

For the examination and reliability verification of the scale-effect results of the repetitive plate-loading test obtained through the numerical analysis in this study, the results were compared with the scale-effect results of the existing plate-loading test.
Thus, the scale effect of the repetitive plate-loading test proposed in this study was converted into a form similar to Equation (3), which was the scale effect of the plate-loading test as expressed by Equations (12) and (13). In Equation (12), Ek is the ratio of the amount of stress change to that of the settlement change and had a form similar to the subgrade reaction modulus of the plate-loading test, i.e., k. Therefore, if the two moduli are assumed to be the same, an equation on the scale effect of the repetitive plate-loading test is derived with the same form as Equation (3), as expressed in Equation (13). Here, B, which is the diameter of the foundation in the plate-loading test, was changed to the reference loading plate. Thus, in this study, the 762-mm loading plate selected as the reference loading plate was applied.
E v E v o = 1.5 B 2 · Δ σ Δ s 1.5 B o 2 · Δ σ Δ s = B B o · E k E k o
E v E v o = B B o · ( B B o ) n = ( B B o ) n + 1 = ( B B o ) a                               ( k = E k )
where B is the diameter of the reference loading plate (mm), Bo is the diameter of the used loading plate (mm), Ek is the ratio of the amount of stress change to that of the settlement change at points with 30% and 70% of the maximum stress (△σ/△s), N is the scale-effect calculation factor of the plate-loading test, a is the scale-effect calculation factor of the repetitive plate-loading test (n + 1), and k is the subgrade reaction modulus of the plate-loading test (σ/s).
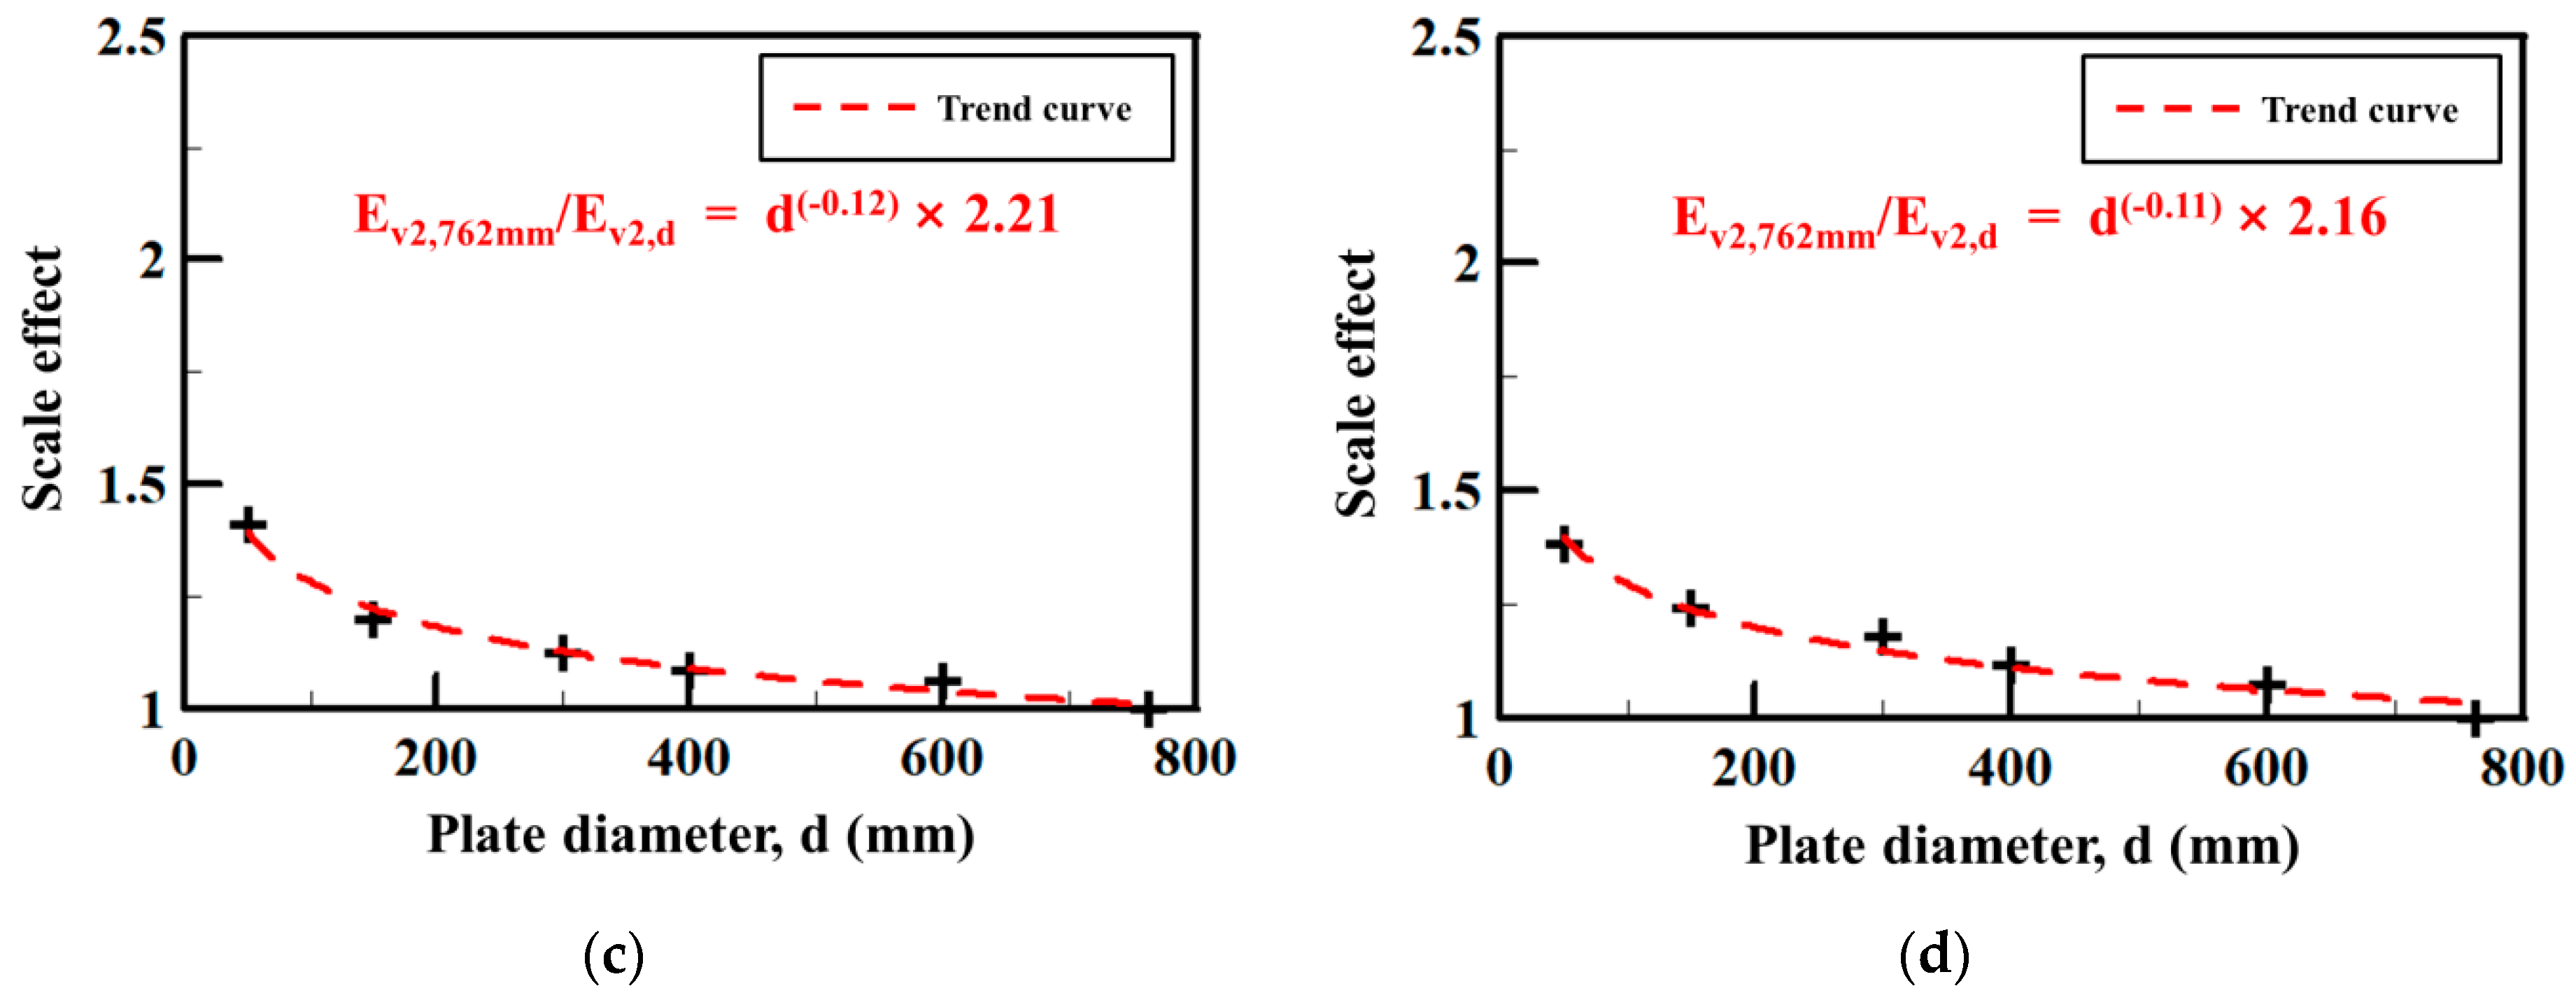
To determine the scale-effect calculation factor of the repetitive plate-loading test, i.e., a, the loading-plate diameter, which is the x axis shown in Figure 6, was normalized to the diameter of the reference loading plate (762 mm), as shown in Figure 7. Regression equations were derived through regression analysis, and the value of the x-intercept was close to one under all subgrade conditions. Therefore, when this value was ignored, the scale-effect calculation factor of the strain modulus, namely, a, was found to be 0.3 for the gravel and fine gravel, 0.2 for sand, 0.12 for sandy soil, and 0.11 for cohesive soil. Table 7 summarizes these results and the results obtained by replacing the scale-effect calculation factor of the existing plate-loading test, i.e., n, with a.
The list in Table 7 indicates that the scale-effect calculation factor of the plate-loading test was approximately 0.5, on average, for the subgrade condition of sand and zero for cohesive soil, and a median value appeared to have been used in Korean Standard Assocation [11]. On the other hand, the scale-effect calculation factor of the repetitive plate-loading test obtained through the numerical analysis in this study was approximately 0.25, on average, for the subgrade condition of sand and approximately 0.1 for cohesive soil, which were somewhat different from those of the plate-loading test. However, the tendency that the scale-effect calculation factor of sand was higher than that of cohesive soil was the same.
The difference in the scale-effect calculation factor between the two tests can be attributed to various causes. First, it could be caused by the assumed or changed conditions in the course of derived Equation (13). The factors were the slope of the stress and amount of settlement under a single loading in the plate-loading test and the slope under the repetitive loading in the repetitive plate-loading test, which may have also caused the difference. Moreover, the results were from the laboratory test and numerical analysis, respectively, and the subgrade condition was not identical despite the condition of the same sand or cohesive soil. The difference appeared to have been caused by these, and further studies by laboratory tests are required for more accurate comparison and analysis.

4.5. Analysis of the Relationship between the Subgrade Strain Modulus (Ev2) of the Repetitive Plate-Loading Test and Elastic Modulus (E)

As aforementioned, the subgrade strain modulus of the repetitive plate-loading test is currently used in the field as a quality-control method. However, it represents the solution of the boundary-value problem, and its value varies depending on the condition. Therefore, it cannot be considered as a property of the subgrade material and is different from the elastic modulus, which is a property of the subgrade. Choi et al. [2] proposed a method of estimating the elastic modulus using the subgrade reaction and strain moduli and indirectly estimated the relationship between the strain and elastic moduli using the relationship between the subgrade reaction and strain moduli. In the field or roadbed cases designed for laboratory tests, assessing an accurate elastic modulus of the corresponding subgrade is difficult. On the other hand, in the numerical analysis, the elastic modulus of the subgrade clearly exists as an input property. Therefore, directly analyzing the relationship between the strain modulus, measured from the repetitive plate-loading test simulated through the numerical analysis, and the elastic modulus is possible in the same subgrade.
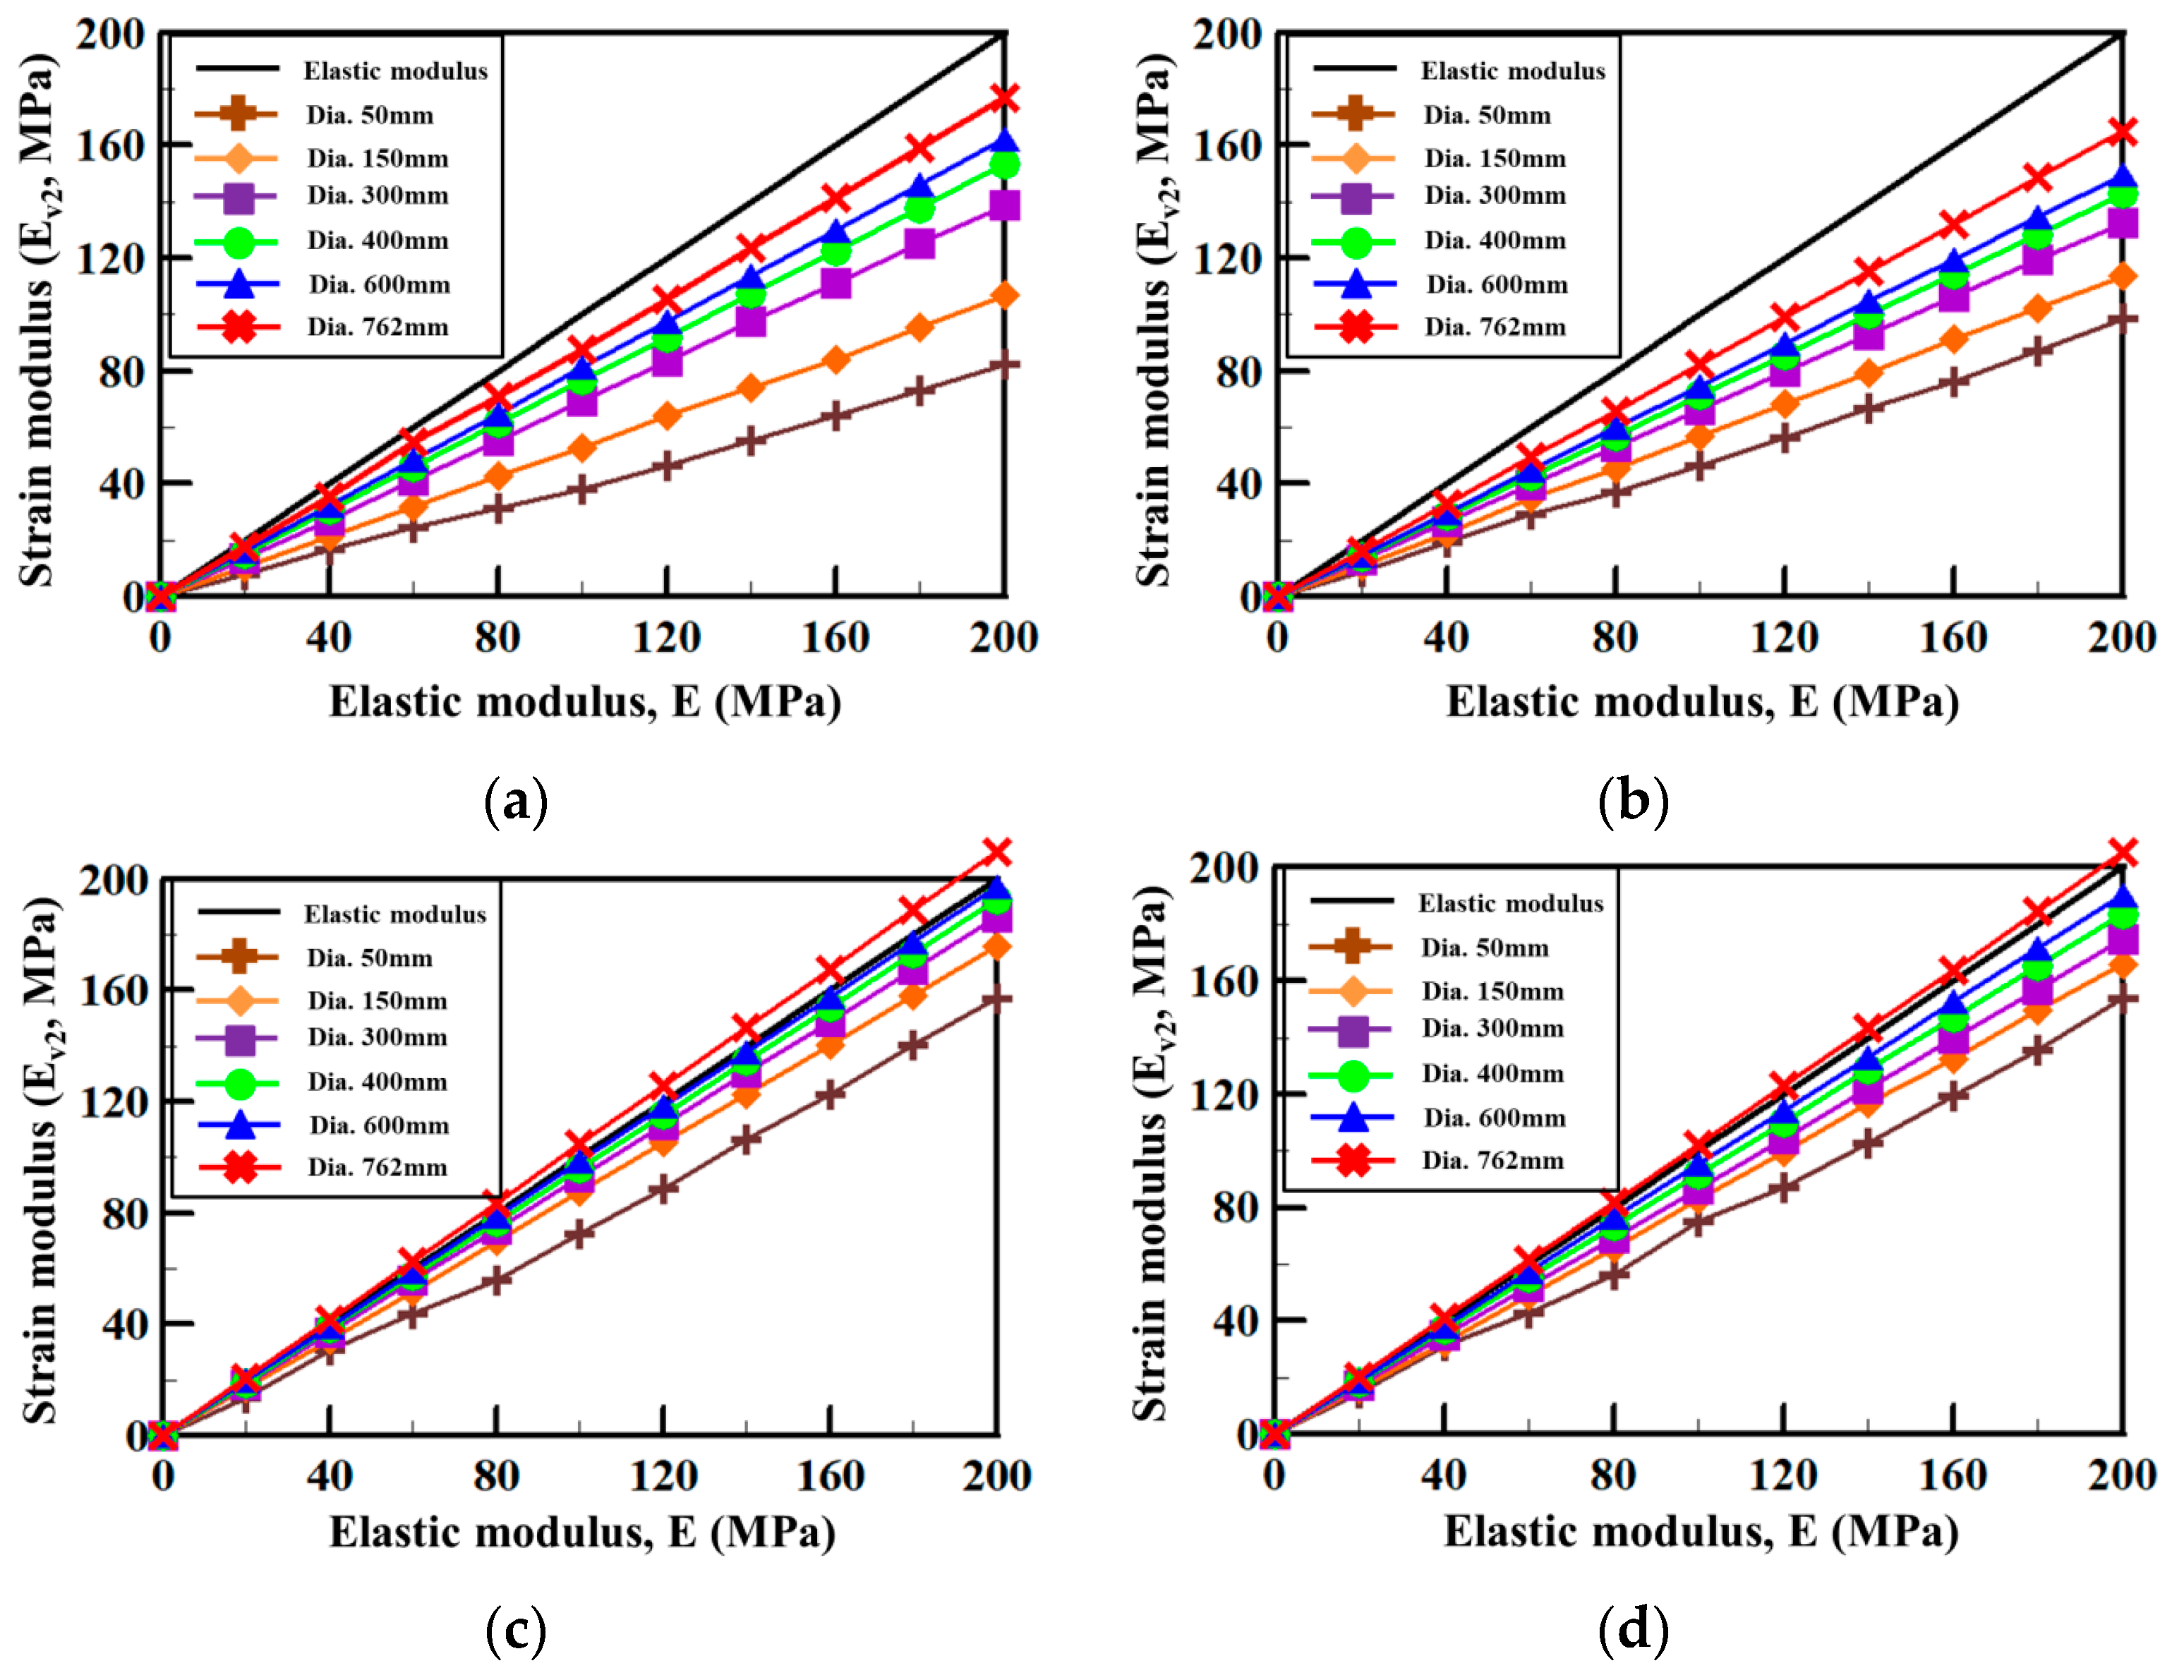
This section presents the comparison of the strain modulus results of the repetitive plate-loading test simulated using numerical analysis with the elastic modulus of the corresponding subgrade according to the subgrade conditions classified in this study. The results are shown in Figure 8. The red solid lines represent the elastic modulus, and the results of the strain modulus according to the loading-plate size are displayed. As shown in Figure 8, the 50-mm loading plate with the smallest diameter exhibited the largest difference in the elastic modulus, and the difference gradually decreased as the loading-plate diameter increased. This phenomenon was also explained by the increase in the nonlinear behavior due to the decrease in the loading-plate size, and we confirmed that the strain modulus was generally assessed to be somewhat smaller than the elastic modulus.
The strain and elastic moduli were compared using the 762-mm loading plate, which was the reference loading plate, and the summary of the results is listed in Table 8. The standard deviation of the ratio of the elastic modulus to the strain modulus was zero in most of the subgrade conditions, and the elastic modulus of the subgrade appeared to be estimated from the result of the strain modulus. We found that the strain modulus was higher than the elastic modulus in the sandy and cohesive soil. Apparently, this was because the estimation equation of the strain modulus was calculated as an approximate value by the regression equation of the repetitive loading curve, and errors occurred in the process. In other words, the ratio of the elastic modulus to the strain modulus was determined to be 1:1 for the sandy and cohesive soil, which was the same as the relationship between the strain and elastic moduli proposed by Choi et al. [2]. By summarizing these results, Table 9 lists the relationship between the strain modulus of the repetitive plate-loading test and the elastic modulus according to the subgrade condition. From these results, we expect that the elastic modulus of the corresponding subgrade can be assessed using the repetitive plate-loading test.

5. Conclusions

In this study, the limitations of the field-verification test conducted for the verification of small loading plates in the laboratory repetitive plate-loading test were mitigated, and a numerical analysis was conducted to propose the scale effect of the loading plate. The results are summarized as follows.
  • From the comparison of the field verification tests of the 50-mm and 300-mm loading plates using numerical analysis, first, in the field-test results, Ev2 did not show any trend with irregular differences with an average of 6.0% and a standard deviation of 10.0. On the other hand, in the numerical-analysis results, the results of the 50-mm loading plate exhibited a smaller trend in all areas with differences at an average of 19.0% and a standard deviation of 0.6.
  • The strain modulus was analyzed according to the loading-plate diameter under the condition of field-test embankment roadbed. The result showed that the strain modulus decreased as the loading-plate size decreased. From this result, scale effects of 1.44 (50 mm), 1.22 (150 mm), 1.17 (300 mm), 1.09 (400 mm), and 1.08 (600 mm) were proposed according to the diameter of the used loading plate.
  • The subgrade was classified into four types, and a numerical analysis was conducted using the abovementioned applied six loading-plate diameters. The result confirmed that the scale effect varied depending on the subgrade condition. Thus, scale effects applicable to each subgrade condition were proposed. We expect that the trend equation derived using the trend curves can be used to roughly estimate the scale effect that can be applied when a loading plate with a diameter that is not used in this study is used.
  • The result of the comparison of the scale effect obtained through the numerical analysis in this study with that of the existing plate-loading test revealed that the values were somewhat different, but the same trend in which the subgrade condition of sand exhibited a higher scale-effect calculation factor than that of cohesive soil was confirmed.
  • The strain modulus of the repetitive plate-loading test obtained through the numerical analysis was compared with the elastic modulus of the corresponding subgrade according to the subgrade condition. The result showed that the calculated strain modulus approached closer to the elastic modulus as the loading-plate size increased. Depending on the subgrade condition, the ratio of the elastic modulus to the strain modulus was 1.13 for gravel and fine gravel, 1.21 for sand, and 1.00 for sandy and cohesive soil.
  • Because the properties of the subgrade conditions classified in this study represented the results of applying one representative value, the scale effect and estimated elastic modulus value varied when the properties of the roadbed of the same type were different from those applied in this study. Therefore, caution must be exercised in using the scale effect and estimated elastic modulus. Further studies are needed in the future to verify the results of this study through laboratory tests.

Author Contributions

Conceptualization, M.S. and H.S.J.; methodology, H.S.J. and D.S.; software, M.S.; formal analysis, M.S., H.H.Y. and J.S.K.; investigation, H.H.Y. and J.S.K.; writing-original draft, M.S.; writing-review & editing, H.S.J. and D.S.; supervision, H.S.J.

Funding

This research was funded by [Development of a Track Condition Assessment System and Maintenance Technology for Preemptive Failure Prevention and Efficient Management] grant number [19RTRP-B113566-04].

Acknowledgments

This study was supported by the Railway Technology Research Project of the Ministry of Land, Infrastructure and Transport through the assignment of the “Development of a Track Condition Assessment System and Maintenance Technology for Preemptive Failure Prevention and Efficient Management (19RTRP-B113566-04).”

Conflicts of Interest

The authors declare no conflict of interest.

References

  1. Kim, D.S.; Choi, C.Y.; Kim, S.J.; Yu, J.Y.; Yang, S.C. Study on The Subgrade Reaction Modulus(K30) and Strain Modulus(Ev). J. Korean Soc. Railw. 2007, 10, 264–270. [Google Scholar]
  2. Choi, C.Y.; Lee, S.H.; Eum, G.Y. The Estimation Method of Elastic Modulus on Plate Load Test. J. Korean Soc. Railw. 2011, 14, 41–45. [Google Scholar]
  3. Eom, J.W.; Lee, M.S.; Kwon, J.S.; Kim, S.J. Research Directions for Maintenance Criteria in Slab Track. In Proceedings of the 2011 Spring Conference of the Korean Society for Railway, Hoengseong, Korea, 26–28 May 2011; pp. 979–987. [Google Scholar]
  4. Lee, J.S.; Lee, I.M.; Chung, H.S.; Lee, D.S. Analysis of Ground Reinforcement Effect Using Fracturing Grouting. J. Korean Tunn. Undergr. Space Assoc. 2003, 5, 349–360. [Google Scholar]
  5. Jung, H.S.; Han, J.K.; Moon, J.S.; Yoon, H.H. Grouting Performance for the Reinforcement of Operating Railway Roadbed. J. Korean Geo-Environ. Soc. 2017, 18, 13–23. [Google Scholar]
  6. Jung, H.S.; Yoon, H.H.; Kim, J.S.; Son, M. Field Verification of Small Loading Plate for Laboratory Cyclic Plate Loading Test. J. Korean Soc. Railw. 2018, 21, 578–592. [Google Scholar] [CrossRef]
  7. Kim, K.S.; Lee, S.R.; Park, Y.H.; Kim, S.H. Evaluation of Size Effects of Shallow Foundation Settlement Using Large Scale Plate Load Test. J. Korean Geotech. Soc. 2012, 28, 67–75. [Google Scholar] [CrossRef] [Green Version]
  8. Terzaghi, K.; Peck, R.B. Soil Mechanics in Engineering Practice, 2nd ed.; John Wiley and Sons Inc.: New York, NY, USA, 1967. [Google Scholar]
  9. Bond, D. Influence of Foundation Size on Settlement. Geotechnique 1961, 11, 121–143. [Google Scholar] [CrossRef]
  10. Chung, H.S.; Kim, D.Y. Application of Scale Effect in Estimating Bearing Capacity and Settlement of Footing from Plate-Load Test. In Proceedings of the 2002 Fall Geotechnical Engineering Conference, Seoul, Korea, 25 October 2002; pp. 385–392. [Google Scholar]
  11. Korean Standard Association. Standard Test Method for Plate Bearing Test on Shallow Foundation; KS F 2444; Korean Standard Association: Seoul, Korea, 2018. [Google Scholar]
  12. Deutsches Institut fur Normung, E.V. Soil Testing Procedures and Testing Equipment-Plate Load Test; DIN 18134; Deutsches Institut fur Normung E.V.: Berlin, Germany, 2012. [Google Scholar]
  13. Kezdi, A.; Rethati, L. Soil Mechanics of Earthworks, Foundations and Highway Engineering, Handbook of Soil Mechanics; Elsevier: Amsterdam, The Netherlands, 1988; Volume 3. [Google Scholar]
  14. Zhu, F.; Clark, J.I.; Phillips, R. Ryan Phillips Scale Effect of Strip and Circular Footings Resting on Dense Sand. J. Geotech. Geoenviron. Eng. 2001, 127, 613–621. [Google Scholar] [CrossRef]
  15. Hidalgo Signes, C.; Martínez Fernández, P.; Garzón-Roca, J.; Insa Franco, R. Analysis of the bearing capacity of unbound granular mixtures with rubber particles from scrap tyres when used as sub-ballast. Mater. Constr. 2016, 66, 1–15. [Google Scholar] [CrossRef]
  16. Ministry of Land, Transport and Maritime Affairs. The Road Design Manual, Book Ⅲ, Earthwork and Drainage; Ministry of Land, Transport and Maritime Affairs: Seoul, Korea, 2012. [Google Scholar]
  17. Bolton, M.D. The strength and dilatancy of sands. Geotechnique 1986, 36, 65–78. [Google Scholar] [CrossRef] [Green Version]
Figure 1. Study summary and flowchart.
Applsci 09 04442 g001
Figure 2. Numerical model using PLAXIS 3D: (a) Model of 762-mm loading plate; (b) Mesh in 50-mm loading plate model; (c) Mesh in 762-mm loading plate model.
Applsci 09 04442 g002
Figure 3. Correlation analysis comparison between the field-test and numerical-analysis results: (a) field-test results (Jung et al. [6]); (b) numerical-analysis results.
Applsci 09 04442 g003
Figure 4. Regression analysis comparison between the field-test and numerical analysis results: (a) field-test results (Jung et al. [6]); (b) numerical analysis results.
Applsci 09 04442 g004
Figure 5. Stress–settlement curve according to the loading-plate size: (a) 762-mm loading plate; (b) 300-mm loading plate; (c) 150-mm loading plate; (d) 50-mm loading plate.
Applsci 09 04442 g005
Figure 6. Regression analysis of the scale-effect results according to the subgrade condition: (a) gravel and fine gravel; (b) sand; (c) sandy soil; (d) cohesive soil.
Applsci 09 04442 g006aApplsci 09 04442 g006b
Figure 7. Scale effect normalized to the reference loading plate of the repetitive plate-loading test (762 mm): (a) gravel and fine gravel; (b) sand; (c) sandy soil; (d) cohesive soil.
Applsci 09 04442 g007
Figure 8. Relationship between the subgrade strain and elastic moduli according to the loading-plate size: (a) gravel and fine gravel; (b) sand; (c) sandy soil; (d) cohesive soil.
Applsci 09 04442 g008
Table 1. Soil properties of field-test roadbed.
PropertiesUnit Weight (kN/m3)Water Content (%)Liquid Limit (%)Plastic Limit (%)Plastic NumberCohesion (kPa)Friction Angle (◦)
Field soil18.913.624.219.64.64.735.3
The test methodKS F 2308-06KS F 2306-00KS F 2303-15Direct shear test
Table 2. Values of the parameters used in the numerical analysis.
Subgrade TypeUnit Weight (kN/m3)Friction Angle (◦)Dilatancy Angle (◦)Cohesion (kPa)Elastic Modulus (MPa)Loading Plate Dia. (mm)
Embankment roadbed (MLTM [16])Gravel and fine gravel20.04010110~200 (Spacing: 10)50, 150, 300, 400, 600, 762
Sand (fine grain)20.03553
Sandy soil19.025015
Cohesive soil18.015025
Field-test embankment roadbed18.935.35.34.7
Table 3. Repetitive plate loading field-test results (Jung et al. [6]).
RegionStiffness Ev1 (MPa)Stiffness Ev2 (MPa)Ev2/Ev1Difference, Ev2 (%)
Loading Plate (50 mm)Loading Plate (300 mm)Loading Plate (50 mm)Loading Plate (300 mm)Loading Plate (50 mm)Loading Plate (300 mm)
A30.717.341.0 39.8 1.3 2.3 2.9
B31.512.947.6 43.9 1.5 3.4 8.3
C28.915.748.0 46.4 1.7 3.0 3.4
D44.129.051.7 53.7 1.2 1.9 3.6
E51.230.257.1 59.4 1.1 2.0 3.9
F43.631.159.4 55.1 1.4 1.8 7.7
G28.727.460.1 56.1 2.1 2.0 7.1
H47.032.163.8 61.2 1.4 1.9 4.2
I36.235.364.9 60.0 1.8 1.7 8.2
J52.025.266.7 69.1 1.3 2.7 3.5
K30.327.369.5 70.7 2.3 2.6 1.6
L34.531.274.9 67.4 2.2 2.2 11.2
M39.840.676.4 70.6 1.9 1.7 8.3
N68.347.1111.3 96.3 1.6 2.0 15.6
O54.252.3115.4 117.9 2.1 2.3 2.1
P106.870.1139.5 142.5 1.3 2.0 2.1
Q88.552.2146.9 159.6 1.7 3.1 7.9
Average difference6.0
Table 4. Numerical analysis results of the field-test embankment roadbed.
E (MPa)Stiffness Ev1 (MPa)Stiffness Ev2 (MPa)Ev2/Ev1Difference, Ev1(%)Difference, Ev2 (%)
Loading Plate (50 mm)Loading Plate (300 mm)Loading Plate (50 mm)Loading Plate (300 mm)Loading Plate (50 mm)Loading Plate (300 mm)
103.21 3.94 6.217.751.93 1.97 18.53 19.87
206.37 7.83 12.5515.591.97 1.99 18.65 19.50
309.52 11.69 18.9123.331.99 2.00 18.56 18.95
4012.67 15.54 25.3031.092.00 2.00 18.47 18.62
5015.88 19.42 31.4838.861.98 2.00 18.23 18.99
6019.03 23.24 37.9346.671.99 2.01 18.12 18.73
7022.17 27.11 44.2454.462.00 2.01 18.22 18.77
8025.33 30.93 50.7362.162.00 2.01 18.11 18.39
9028.47 34.77 57.0670.042.00 2.01 18.12 18.53
10031.61 38.61 63.4577.842.01 2.02 18.13 18.49
11034.74 42.45 69.7485.632.01 2.02 18.16 18.56
12038.10 46.55 75.6593.161.99 2.00 18.15 18.80
13041.24 50.37 82.14101.111.99 2.01 18.13 18.76
14044.39 54.22 88.60108.902.00 2.01 18.13 18.64
15047.53 58.07 94.78116.741.99 2.01 18.15 18.81
16050.69 61.97 101.19124.452.00 2.01 18.20 18.69
17054.55 66.60 105.80132.471.94 1.99 18.09 20.13
18057.71 70.47 112.59140.281.95 1.99 18.11 19.74
19060.82 74.31 118.73148.181.95 1.99 18.15 19.87
20063.97 78.29 124.89156.041.95 1.99 18.29 19.96
Average difference18.23 19.04
Table 5. Strain modulus according to the loading-plate size under the field-test roadbed condition.
E (MPa)Strain Modulus, Ev2 (MPa)
50-mm Loading PlateEv2,762mm/Ev2,50mm150-mm Loading PlateEv2,762mm/Ev2,150mm300-mm Loading PlateEv2,762m/Ev2,300mm
2012.551.45 14.79 1.23 15.591.16
4025.31.44 29.74 1.22 31.091.17
6037.931.44 44.49 1.23 46.671.17
8050.731.44 59.71 1.22 62.161.17
10063.451.43 74.77 1.22 77.841.17
12075.651.44 89.93 1.21 93.161.17
14088.61.44 104.86 1.21 108.91.17
160101.191.44 119.91 1.21 124.451.17
180112.591.46 134.91 1.21 140.281.17
200124.891.46 149.71 1.22 156.041.17
Mean (standard deviation)1.44 (0.01)Mean (standard deviation)1.22 (0.01)Mean (standard deviation)1.17 (0.00)
E (MPa)Strain Modulus, Ev2 (MPa)
400-mm Loading PlateEv2,762mm/Ev2,400mm600-mm Loading PlateEv2,762mm/Ev2,600mm762-mm Loading Plate
2016.57 1.10 16.841.08 18.15
4033.28 1.09 33.691.08 36.38
6049.96 1.09 50.681.08 54.56
8066.63 1.09 67.531.08 72.8
10083.32 1.09 84.521.08 91.01
120100.03 1.09 101.461.08 109.21
140116.71 1.09 118.311.08 127.4
160133.43 1.09 135.181.08 145.61
180150.11 1.09 152.111.08 163.85
200166.86 1.09 169.081.08 182.06
Mean (standard deviation)1.09 (0.00)Mean (standard deviation)1.08 (0.00)
Table 6. Scale effect of repetitive plate-loading test according to the subgrade condition.
Loading-Plate DiameterSubgrade Condition
Gravel and Fine GravelSandSandy SoilCohesive SoilField-Test Roadbed
50-mm loading plate2.231.741.411.381.44
150-mm loading plate1.671.451.201.241.22
300-mm loading plate1.281.241.131.181.17
400-mm loading plate1.161.161.091.121.09
600-mm loading plate1.091.101.061.081.08
Table 7. Scale-effect comparison between the plate loading and repetitive plate-loading tests.
Scale Effect of Plate-Loading TestScale Effect of Repetitive Plate-Loading Test
CategoryScale Effect Calculation Factor aCategoryScale Effect Calculation Factor a
SandLoose sand (Bond [9])0.8–0.6Gravel and fine gravel0.3
Dense sand (Bond [9])0.6–0.5
Pure sand (Chung and Kim [10])0.505Sand0.2
SoilCohesive soil (Terzaghi and Peck [8])0Sandy soil0.12
Cohesive soil (Chung and Kim [10])0.035Cohesive soil0.11
Korean standard of plate load test, KS F 2444 (KSA [11])0.25
Table 8. Relationship between the elastic and subgrade strain moduli (762-mm loading plate) according to the subgrade condition.
E (MPa)Subgrade Condition
Gravel and Fine GravelSandSandy Soil
Ev2 (MPa)E/Ev2,762mmEv2 (MPa)E/Ev2,762mmEv2 (MPa)E/Ev2,762mm
2017.56 1.14 16.32 1.23 20.77 0.96
4035.36 1.13 32.82 1.22 41.68 0.96
6054.55 1.10 49.40 1.21 62.79 0.96
8070.82 1.13 66.00 1.21 83.69 0.96
10087.85 1.14 82.41 1.21 104.78 0.95
120105.56 1.14 99.03 1.21 125.64 0.96
140123.69 1.13 115.53 1.21 146.74 0.95
160141.41 1.13 131.97 1.21 167.56 0.95
180159.18 1.13 148.44 1.21 188.90 0.95
200176.73 1.13 165.02 1.21 209.74 0.95
Mean (standard deviation)1.13 (0.00)Mean (standard deviation)1.21 (0.00)Mean (standard deviation)0.96 (0.01)
E (MPa)Subgrade Condition
Cohesive SOILField-Test Roadbed
Ev2 (MPa)E/Ev2,762mmEv2 (MPa)E/Ev2,762mm
2020.540.9718.151.10
4041.010.9836.381.10
6061.470.9854.561.10
8081.940.9872.801.10
100102.410.9891.011.10
120122.910.98109.211.10
140143.370.98127.401.10
160163.950.98145.611.10
180184.360.98163.851.10
200205.470.97182.061.10
Mean (standard deviation)0.98 (0.0)Mean (standard deviation)1.10 (0.0)
Table 9. Ratio of the elastic modulus to strain modulus according to the subgrade condition.
Subgrade Condition
Gravel and Fine GravelSandSandy SoilCohesive SoilField-Test Roadbed
E:Ev21.13:11.21:11:11:11.10:1

