Abstract
In this study, the sensitivity of MEMS gas bearing’ performance to the wear in different axial and circumferential positions is investigated in detail. Rarefaction effect is introduced into the transient and steady lubrication equation, and then the finite element method (FEM) is employed to solve the equations. The stochastic process is adopted to simulate wear distribution and view of probability is proposed to describe the change laws of the static and dynamic performance of the bearing. Then, the static and dynamic characteristics of the bearing in 50 wear conditions are calculated for each case. Furthermore, the standard deviations and correlation coefficients of the bearing performance sample points are analyzed to demonstrate the influence degree of wear in different positions.
1. Introduction
The smoothness of a bearing’s inner wall directly affects its static and dynamic characteristics, which results in a deviation of the actual working point from the designed operating state. It is of great importance to study the sensitivity of gas bearing performance to the smoothness of the wall to ensure its safe and stable operation. The manufacturing deviation and wear of a bearing in the manufacturing process will lead to a change in the surface morphology of the bearing’s inner wall. For micro gas bearing, because the designed size of the bearing is very small, the slight change of the surface structure leads to an obvious change of the gas film morphology. Further, this change may have an obvious influence on the characteristics of the bearing [1].
As a typical micro gas bearing, MEMS (Micro-Electro-Mechanical System) gas bearing is one of the core components of the micro power electromechanical system (power MEMS). Due to its small size, high precision, and fast speed, it is widely used in various precision applications. The study by Epstein A et al. [2,3] comprehensively analyzed the static and dynamic performance of MEMS gas bearing, however did not consider the influence of the rarefaction effect. Previous studies on bearings’ rarefaction effect mainly focused on slider bearings [4,5,6] and axial thrust bearings [7,8,9]. Direct simulation of Monte Carlo (DSMC) based on molecular dynamics was the mainstream method for studying slider bearings of a small size. This method was proposed by Bird [10] and has been verified and extended by many scholars. Some meaningful models for dealing with the rarefaction effect were proposed and applied in the solution of lubricated problems. S. Fukui and R. Kaneko [11,12] unified the continuous flow model with the molecular flow model by using the correlation formula and suggested that the lubrication equation is applicable to arbitrary Kn number. The approximate value of the Poiseuille flow rate at a high Kn number was given. Then, the comparison between the solution results of this method and the results of the DSMC method was carried out, and the accuracy of the FK (Fukui and R. Kaneko) model was verified. This method greatly simplified the calculation cost of the gas bearing performance with the rarefied flow model, which made the large-scale repeated calculation of the micro bearing easier and, furthermore, laid the foundation for the statistical analysis of MEMS gas bearings. Zhang C et al. [13] used the FK model to introduce the rarefaction effect and studied the transient characteristics of the bearing in the start-stop state, and then calculated the transient performance of the gas bearing considering the rarefaction effect. Lee Y-B et al. [14] compared the bearing load capacity between the continuous flow model and the rarefied model, and the conclusion indicated that the bearing capacity considering the rarefaction effect was only 90% of that without considering the rarefaction effect. Li WL [15] used the first-order slip-flow model with non-symmetric accommodation coefficients to simulate the rarefaction effect and coupled the surface roughness model with the dynamic analysis of the bearing. His research showed that the decrease of the Kn number enhanced the rarefaction effect. All the above previous studies have shown that the rarefaction effect has a great influence on bearing performance when the radius clearance is small.
Wear and roughness of the gas bearing’s inner wall directly affect the evenness of the film distribution, which furthermore influences the performance of the bearing, and investigation of wear and roughness properties holds great importance in understanding the change law of static and dynamic characteristics of gas bearings. White J [16] conducted numerical studies on wedge bearings with transverse sinusoidal roughness and explored the effect of bearing surface roughness on fluid film. Bhat N [17] used the Pareto optimal method to study and design flat pad aerostatic bearings and proposed a method for considering roughness sensitivity. The research shows that a multi-orifice aerostatic flat pad bearing was very sensitive to surface contour changes. Sharma SC [18] investigated the impact of misalignment and wear on radial bearings, and the results showed that the orifice compensator bearing was more sensitive to wear depth changes compared to the capillary compensated bearing. Wang X et al. [19,20] studied the influence of surface waviness on gas bearing and found that the surface waviness in different directions had different effects on the static and dynamic characteristics of the bearing. Feng K [21] studied the performance of micro spherical spiral groove gas bearings with surface roughness considering temperature effects. The results showed that the gas temperature of the bearing increased significantly with increased wall roughness. Song M [22] investigated the influence of the shape error of the bearing surface on the stability of the bearing using a semi-implicit format. The results showed that the shape errors of the bearing’s inner surface and journal surface had a different degree of effect on bearing performance, and the shape errors of the rotating shaft had more obvious effects. In the literature [13,23,24,25], detailed analysis of the bearing performance considering surface friction was also carried out.
Because the structure scale of MEMS gas bearings are much smaller than that of traditional gas bearings, much more attention should be paid to the wear of the bearing’s inner wall. Previous investigations on wall friction or wear of bearings mostly focus on thrust gas bearings and traditional radial gas bearings, however few of them focus on micro radial gas bearings. Moreover, the description of bearing wear and friction is mostly based on the single roughness and wear numerical model, which cannot describe the randomness property of the wear and surface roughness very well. Therefore, this paper proposes a mathematical model for describing bearing wear and roughness properties using a statistical method and then investigates the static and dynamic characteristics of MEMS gas bearings under specific wall wear and roughness from the perspective of probability. Finally, the probabilistic sensitivity of bearing performance is studied with wear at different axial and radial positions, and then some practical methods are proposed to prevent wear.
2. Numerical Method
2.1. Mathematical Model of Wear
The wall wear that is investigated in this paper mainly consists of two parts: firstly, as shown in Figure 1, in the manufacturing process of the bearing, the surface of the bearing has various types of irregularities due to the influence of various uncontrollable factors. This surface structure forms the geometric characteristics of the gas bearing’s inner surface, which includes the surface roughness, waviness, and the surface profile. This paper only considers the influence of surface roughness and supposes that there is no systematic error in bearing manufacturing—that is, the waviness is 0. Secondly, because of the wear and tear effect of the bearing in operation, pits or protrusions on the inner wall of the bearing appear. This surface structural change will also lead to changes in the gas film morphology of the bearing and furthermore affects the gas bearing’s performance. When the wear dimension of the bearing’s inner surface is close to the machined roughness, the two can be considered together. In this investigation, the comprehensive study was carried out by combining these two kinds of surface topography, and for convenience, “wear” was adopted to comprehensively describe them.
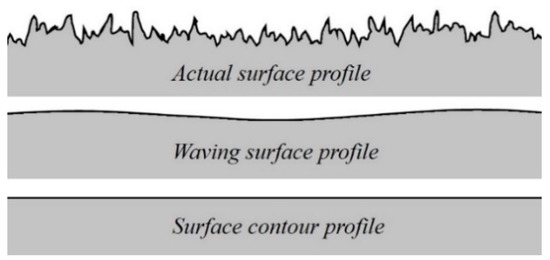
Figure 1.
Three types of surface topography.
Figure 2 shows the microstructure of wear. Similar to the definition of roughness, the following two parameters were introduced to describe the wear mathematical model of the bearing’s inner wall:

Figure 2.
Microstructure of wear.
When the wall wear is discrete value, the definition of Ra gives:
During the operation of gas bearings, the wear of the inner surface is mainly caused by the erosion of gas. With the action of gas force, the adhesion and shedding of microscopic particles constantly occurs on the inner wall of the gas bearing, resulting in the occurrence of pits and protrusions on the inner wall of the bearing. In order to simplify the description, without considering the movement of the wall contour profile that is caused by wear, assume that the wall wear is a small value and the mean value of wear is 0. Ra, which can be further written as:
where σ(y) represents the standard deviation of the wear degree. Furthermore, the distribution of the surface wear value is assumed to have a normal distribution. When analyzing the problem from a statistical point of view, the probability density of the wall wear value is:
where μ is the mean value of the normal distribution and μ = 0, σ is the standard deviation. Figure 3 shows the probability density of the normal distribution, and the probability density function is:
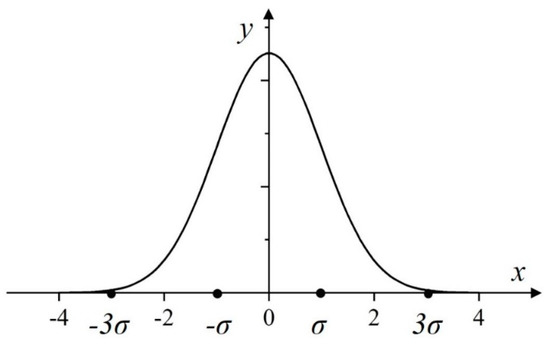
Figure 3.
Probability density of the normal distribution.
The stochastic process is introduced into the process of modeling the degree of wear at different circumferential or axial positions, and all wear data follows the above normal distribution. In the simulation process, it is impossible to take extreme values considering the actual wear situation. According to the Pauda criterion, the simulated wear data is considered a coarse error when the absolute value of the wall wear is greater than 3σ, and this data should be eliminated. Applying this concept to the investigation of this paper, in order to make the surface wear distribution more uniform, it is considered that the coarse error occurs when the wear value is larger than σ—that is, when the absolute value of the wear value is less than σ.
2.2. Solution of the Lubrication Equation Considering the Rarefaction Effect
The structural schematic diagram of the gas bearing is shown in Figure 4. For MEMS gas bearing, the scale of the molecular free path cannot be negligible relative to the characteristic film thickness. Previous studies have shown that the flow state in the bearing clearance is a typical slip flow [26], and the simulation accuracy is not good enough to describe the flow state using the traditional Reynolds equation. According to the theory of S. Fukui and R. Kaneko [11,12], the lubrication equation can be obtained by the Boltzmann equation based on the theory of molecular dynamics under any Kn number. Extend the lubrication equation to two-dimensional space and transfer to the cylindrical coordinate system:
where D0 is the characteristic form of D (inverse Knudsen number), τ is the dimensionless time item, defined as , ω is the journal rotating speed, is the relative Poiseuille flow rate, which can be expressed as:
where Qcon is the Poiseuille flow rate of continuous flow and Qp(D) is the Poiseuille flow rate of rarefied flow, which can be obtained by Equation (9) according to the FK model:
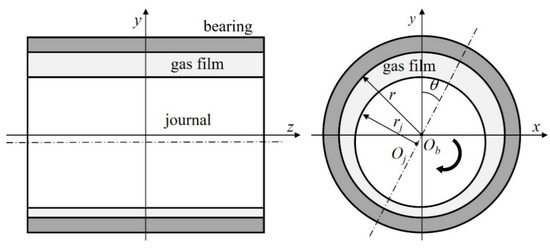
Figure 4.
Schematic diagram of a typical bearing-rotor system.
Equation (7) describes the flow state of the gas bearing in the transient state considering the rarefaction effect. For the steady process, the static lubrication equation can be gained by discarding the time-dependent term:
In this paper, the finite element method (FEM) is used to solve Equations (7) and (10). The solution is based on two assumptions: (1) The film pressure does not change in the radial direction; (2) The flow in the film clearance is isothermal. As shown in Figure 5, the cylindrical solution domain is expanded into a rectangular domain and the whole solution domain is discretized by a four-node quadrilateral element, in which the transient and static lubrication equations are solved. Φ is adopted as the interpolation function as well as the weight function in Galerkin integral. Equation (10) can be transformed in any finite element region as:
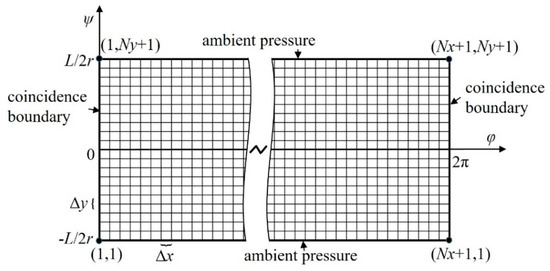
Figure 5.
Rectangular solution domain and mesh model.
The pressure interpolation function was introduced to obtain the pressure value at a certain node in a finite element by the product of node pressure and local coordinates:
By using the Green formula and substituting Equation (12) into the lubrication equation, the FEM equation of the element gives:
The isoparametric element is introduced and the form of interpolation function Φ is taken for Equation (13). The element interpolation function in Equation (14) is the dimensionless form of standard quadrilateral element interpolation function, where , .
Assembling the coefficient matrices of all the finite element equations in the whole solution domain, Equation (15) can be obtained:
where A and B are the total coefficient matrices. The Newton–Raphson method was employed to solve the nonlinear equations:
where F(P) is the implicit function of the dimensionless pressure, the Hamiltonian “” represents the multiplication of the corresponding items in the two matrices. The distribution of the pressure field can be obtained by iteration. Then, the Simpson integral for Equation (18) was adopted to obtain the load capacity of the gas bearing.
The solution of the transient lubrication equation can be obtained by the partial derivative method based on the static solution. The rarefied flow term was introduced into the transient lubrication equation to obtain the eight dynamic coefficients. Assuming that a small perturbation is applied to the journal, the coordinate (ε0, θ0) represents the static equilibrium position of the bearing, and the coordinate (ε, θ) represents the transient position of the journal at a certain moment, where ε is the eccentricity ratio and θ is the attitude angle. Then, the location of the journal gives:
where E0 is the perturbation amplitude of ε, Θ0 is the perturbation amplitude of θ. The perturbation pressure and the film thickness can also be expressed in this form.
It can be seen from Equation (9) that the dimensionless Poiseuille flow coefficient can be regarded as a function of the pressure P and film thickness H. Taylor expansion was performed at (P0, H0), and the linear term was retained. Then, the linearized coefficient gives:
By substituting Equation (20) into Equation (7), the dynamic lubrication equation considering the rarefaction effect gives:
The partial derivative method was employed to gain the solution to Equation (21). Two partial derivatives to be solved are firstly defined:
Then, the equations for two partial derivatives gives:
where and are the partial derivatives of the dimensionless Poiseuille flow coefficient to the local pressure P and the local film thickness H. These two parameters can be obtained by the chain rule:
Similar to the solution process of the static lubrication equation, the FEM was employed to solve Equations (23) and (24). Then, the distribution of two partial derivatives could be gained. The complex form of the bearing’s eight dynamic coefficients in (ε, θ) coordinates can be obtained by Equations (27)–(30):
Then, transform the consequences from (ε, θ) coordinates to the standard Cartesian coordinates system:
2.3. Method Validation
To validate the correctness of the mathematical model and the numerical method in this paper, the test data of this study are compared with the data of Lee Y-B [14]. The numerical analysis method was employed by Lee Y-B to give the variation rule of load capacity with the bearing number considering the rarefaction effect. The investigation data have been cited by many scholars and have strong authority. In this paper, the same geometric and operating parameters as Lee Y-B were used for calculations, as shown in Table 1:

Table 1.
Geometric and operating parameters of the bearing in Lee Y-B’s article.
The load capacity of the gas bearing in the continuous and rarefied flow models were calculated, respectively. Figure 6 shows the comparison between the calculation results of this paper and Lee Y-B. It can be seen that the calculation results in this paper agree well with Lee Y-B’s results in both flow states, which validates the correctness and accuracy of the rarefaction model and solution method of this paper.
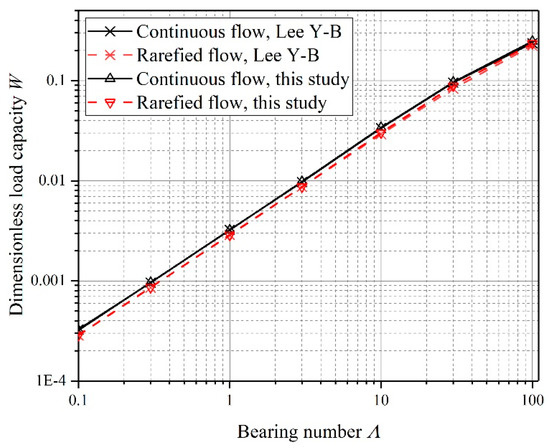
Figure 6.
Comparison between the results of this paper and Lee Y-B.
2.4. Research Object and Solution Process
The statistical method and stochastic process were adopted to investigate the sensitivity of MEMS gas bearing performance to the bearing inner wall wear in different axial and circumferential positions. Figure 7 shows the axial and circumferential distribution of wear that was considered in the study. In the axial direction, since the gas bearing is symmetrical along the central axis, the symmetric distribution wear form was adopted when considering the wear distribution. The inner wall surface of the bearing was divided into five parts along the axial direction in this study, and the serial number increases from both ends of the bearing to the middle. In the circumferential direction, the inner wall surface was equally divided into six parts along the circumferential direction from φ = 0. For the bearing given in Table 2, the attitude angle is 40.65° when the bearing inner wall is smooth. The position of the attitude angle is marked with a dashed line in Figure 7, which represents the minimum position of the gas film thickness of the bearing with the smooth wall.

Figure 7.
Axial and circumferential distribution of wear. (a) axial wear region distribution. (b) circumferential wear region distribution.

Table 2.
Structural and operating parameters of MEMS gas bearing.
Figure 5 shows the mesh model and the boundary conditions for the MEMS gas bearing solution domain. When the wear zone to be studied was determined, the wear values were decided in accordance with the method described in Section 2.1 to simulate the wear at that position. For the static calculation, the Dirichlet boundary condition was set on both ends of the bearing, the boundary pressure was atmospheric pressure, and the coincidence conditions were set on the left and right sides of the rectangular solution domain:
For the dynamic calculation, the boundary type was the same as the static solution:
3. Results and Discussion
3.1. Sensitivity Analysis of Axial Wear
Figure 8 shows the static performance point distribution of the MEMS gas bearing with wear in different axial regions. The horizontal ordinate represents the attitude angle and the vertical ordinate represents the dimensionless load capacity. In each case, the static performances of 50 working conditions were calculated to explore the static performance range of the bearing. The red circle points are the static performance points with rough walls and the blue triangle point is the static performance point with smooth walls.

Figure 8.
Static performance point distribution with wear in axial regions. (a) axial region 1. (b) axial region 2. (c) axial region 3. (d) axial region 4. (e) axial region 5.
A comprehensive comparison of Figure 8 shows that when the wear is near both ends of the bearing, most of the red points are in the upper left of the blue point. This distribution implies that the probability of attitude angle decrease and load capacity increase is higher. As the axial wear regions move towards the center of the bearing, there are more and more red points that gradually move to the lower right direction of the blue point, which means that the probability of attitude angle increase and load capacity decrease gradually becomes greater. In general, besides Figure 8e, there are still more points in the upper left direction of the static performance point. This result shows that when the wear region gradually shifts to the central area, the position of the journal tends to fall back, which indicates that the bearing stability will increase with a high probability in the first four cases, and this probability will become smaller and smaller. In the fifth case, when the wear region is located in the center of the bearing, there are more red points at the lower right direction of the blue point and the position of the journal tends to rise, which indicates that the bearing stability will decrease with a high probability.
The results above can be explained as follows: the wear protrusion can be equivalent to the support point. When the support point is near both ends of the bearing, the support stability will be enhanced, which is shown in Figure 8 as there are more red (circle) points at the upper left side of the blue point. When the wear region goes to the center, the stability of the protrusion support is weakened, which means that there are more red points at the lower right side of the blue point. However, due to the uncertainty and randomness of wear, the enhancement or weakening was only analyzed from the perspective of probability, not absolutely, indicating that all the analyses in this paper are based on probability and absolute laws do not exist.
On the other hand, comparing the figures in Figure 8, as the wear region moves toward the center, the distribution of the red points tends to be denser, which indicates that the influence of wear on the static performance of the bearing gradually decreases as the wear region goes to the center. The wear near both ends of the bearing has the most obvious effect on the static performance of the bearing.
In addition, when assuming that the boundary of the discrete points is an approximate ellipse, it can be seen that the slope of the long axis is always negative when the wear position changes, which indicates that when the bearing capacity increases, the attitude angle decreases.
The dynamic characteristic coefficients of the MEMS gas bearing are closely related to the perturbation frequency ratio (Ω) of the journal [26]. The dynamic coefficients of the gas bearing when Ω = 1 are taken as a demonstration here. Figure 9, Figure 10, Figure 11 and Figure 12 show the sensitivity of the bearing’s eight dynamic characteristic coefficients to different axial wear regions. It can be found from the figures that as the wear position moves toward the center, the distributions of dimensionless stiffness coefficients and dimensionless damping coefficients are more concentrated, indicating that the sensitivity of eight dynamic coefficients to wear is reduced.
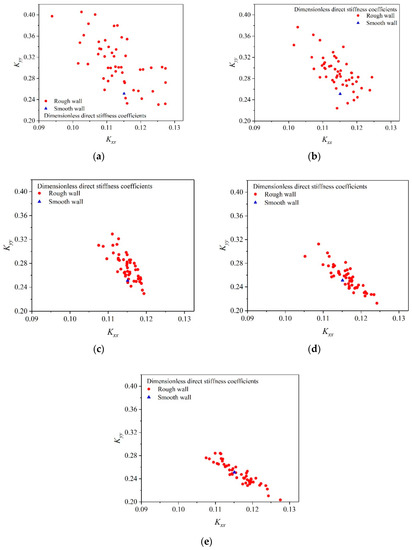
Figure 9.
Direct stiffness coefficients distribution with wear in axial regions. (a) axial region 1. (b) axial region 2. (c) axial region 3. (d) axial region 4. (e) axial region 5.

Figure 10.
Cross stiffness coefficients distribution with wear in axial regions. (a) axial region 1. (b) axial region 2. (c) axial region 3. (d) axial region 4. (e) axial region 5.
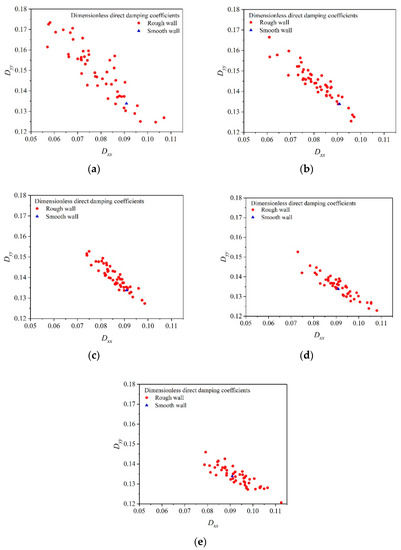
Figure 11.
Direct damping coefficients distribution with wear in axial regions. (a) axial region 1. (b) axial region 2. (c) axial region 3. (d) axial region 4. (e) axial region 5.

Figure 12.
Cross damping coefficients distribution with wear in axial regions. (a) axial region 1. (b) axial region 2. (c) axial region 3. (d) axial region 4. (e) axial region 5.
Figure 9 shows the direct stiffness coefficients distribution with wear in different axial regions. When the wear region closes to both ends of the bearing, most of the red (cicle) points are in the upper left of the blue point, which indicates that the Kxx will decrease and Kyy will increase with a high probability. When the wear regions move to the center, more and more red points move to the lower right of the blue point, which indicates that the probability PRB (Kxx > Kxx0) and PRB (Kyy < Kyy0) will increase.
Figure 10 shows the cross stiffness coefficients distribution characteristics of Kxy and Kyx. When the wear region is near both ends of the bearing, in the high probability, both of the cross stiffness coefficients Kxy and Kyx will increase. As the wear position moves toward the center of the bearing, the probability PRB (Kxy > Kxy0) and PRB (Kyx > Kyx0) increases.
Figure 11 shows the direct damping coefficients distribution characteristics of Dxx and Dyy. When the wear region is near both ends of the bearing, there are more test points on the upper left side of the reference point, indicating that Dxx will decrease and Dyy will increase with a high probability. As the wear position shifts toward the center, there are more test points on the lower right side of the reference point, which indicates that the probability PRB (Dxx > Dxx0) and PRB (Dyy < Dyy0) will increase.
Figure 12 shows the cross damping coefficients distribution characteristics of Dxy and Dyx. When the wear region is near both ends of the bearing, there are more test points on the lower left side of the reference point, indicating that both Dxy and Dyy will decrease with a high probability. As the wear position shifts toward the center, the occurrence frequency of the test points at the upper right side of the reference point increases, which indicates that the probability PRB (Dxx > Dxx0) and PRB (Dyy > Dyy0) will increase.
Figure 13 shows the standard deviation of the eight dimensionless dynamic coefficients in the sample space when wear exists at different axial regions. As can be seen from Figure 13, when the wear position moves from the bearing’s end to the center, the standard deviation of each dimensionless dynamic coefficient shows a general decreasing trend. This phenomenon indicates that under the same degree of wear, when the wear position is close to the center, the uncertainty of the bearing operation shows a tendency to decrease.

Figure 13.
Standard deviation of the eight dynamic coefficients.
The distribution boundary of dynamic coefficients can be equivalent to an ellipse. The ratio of the long axis to the short axis is different in different simulation cases. Different ratios represent different variation relationships between two variables. The correlation coefficient was adopted to characterize the relationship of the studied variables in each group of coordinates, which is defined as:
where, Cov (X, Y) is the covariance of two variables, which gives:
D(X) and D(Y) are the variance of X and Y. Table 3 shows the correlation coefficients of the variables in each group. It can be found that in all cases, the absolute values of the correlation coefficients of each group are greater than 0.6. Especially when the axial wear region is near the center, the absolute values of the correlation coefficients of each group are greater than 0.8, which indicates that there is a very strong correlation between the variables of each group.

Table 3.
Correlation coefficients of dimensionless dynamic coefficients for axial wear.
The wear in this investigation can be equivalent to a small perturbation when the value of parameter σ is small. In this situation, each parameter of the bearing varies approximately linearly with perturbation, therefore the absolute value of the correlation coefficient here is close to 1.
3.2. Sensitivity Analysis of Circumferential Wear
Figure 14 shows the static performance point distribution of the MEMS gas bearing with wear in different circumferential regions. The analysis results show that the wear in regions 1 and 2 has very little effect on the dynamic and static characteristics of the gas bearing. Therefore, for the convenience of expression, only the performances distribution of region 3 to region 6 are shown below. Fifty working conditions were calculated for each wear case. In the same coordinate system, when the wear exists in region 4, the dispersion degree of the static performance test points is the most obvious, and the dispersion degree gradually decreases when the wear position moves away from region 4. When the wear exits in regions 1, 2, and 6, the points dispersion degree is very small, which indicates that the effect of wear on the bearing performance can be neglected in these three regions.
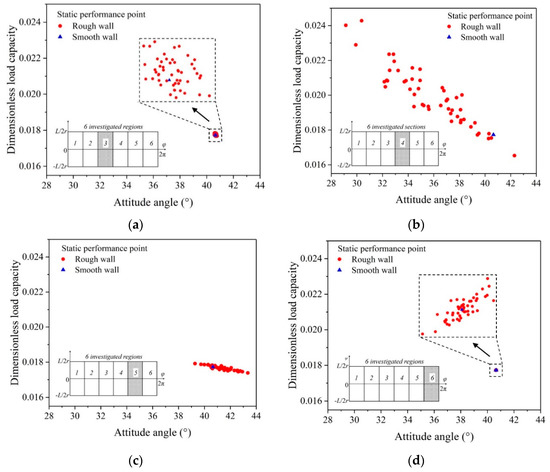
Figure 14.
Static performance point distribution with wear in circumferential regions. (a) circumferential region 3. (b) circumferential region 4. (c) circumferential region 5. (d) circumferential region 6.
From the perspective of bearing geometry, these three regions are away from the main loading area of the bearing and the gas film is relatively thick, therefore, the perturbation of the gas film has a very limited effect on the static characteristics of the bearing. Under the condition without considering wear, the attitude angle of the gas bearing is 40.65°, which indicates that the minimum thickness area of the gas film falls at region 4. At this position, the film thickness is more sensitive to the wall wear, and the change of film thickness has a more obvious effect on the film pressure, which further affects the static performance of the bearing. Therefore, the dispersion degree of the static performance point at region 4 is more obvious.
As shown in Figure 14b, most of the red (circle) points are in the upper left direction of the blue point, which indicates that the attitude angle will decrease and load capacity will increase with a high probability when wear exists in region 4. In addition, when assuming that the boundary of all sample points is an ellipse, results show that the slope of the long axis is positive when wear occurs in region 1 and region 2, then the slope slowly becomes negative when wear goes to region 3, and then again becomes positive when wear moves to region 6. The change above indicates that the correlation between attitude angle and load capacity is constantly changing between synchronous increase and asynchronous increase.
Figure 15, Figure 16, Figure 17 and Figure 18 show the direct and cross dynamic coefficients distribution considering wear in different circumferential regions, respectively. Similarly, in region 1, 2, and 6, the direct and cross dynamic coefficients of the bearing change little, so in actual operation, the wear of these regions has a negligible effect on bearing performance. However, in region 4, the dispersion degree of dynamic distribution is relatively large, so the wear near region 4 should be focused on.
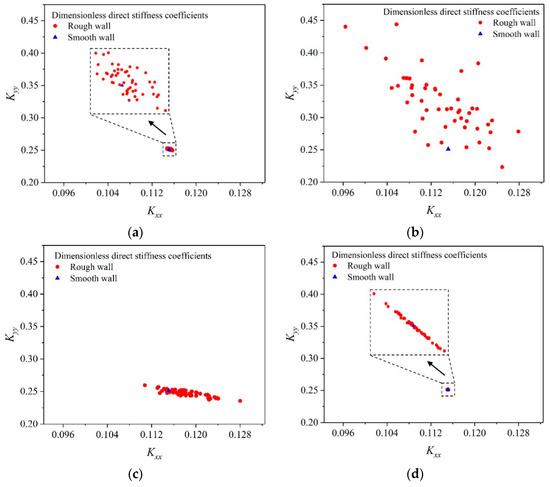
Figure 15.
Direct stiffness coefficients distribution with wear in circumferential regions. (a) circumferential region 3. (b) circumferential region 4. (c) circumferential region 5. (d) circumferential region 6.

Figure 16.
Cross stiffness coefficients distribution with wear in circumferential regions. (a) circumferential region 3. (b) circumferential region 4. (c) circumferential region 5. (d) circumferential region 6.
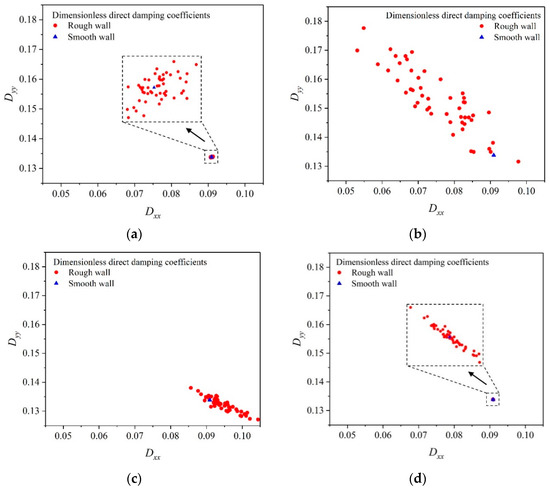
Figure 17.
Direct damping coefficients distribution with wear in circumferential regions. (a) circumferential region 3. (b) circumferential region 4. (c) circumferential region 5. (d) circumferential region 6.
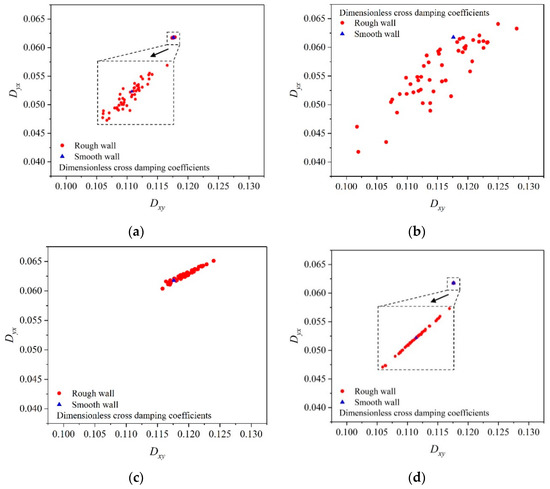
Figure 18.
Damping coefficients distribution with wear in circumferential regions. (a) circumferential region 3. (b) circumferential region 4. (c) circumferential region 5. (d) circumferential region 6.
For the direct stiffness coefficients group (Kxx, Kyy), when wear occurs in region 4, most of the red (circle) points are in the upper left direction of the blue (triangle) point, indicating that Kxx will decrease and Kyy will increase with a high probability. For the cross stiffness coefficients (Kxy, Kyx), when wear occurs in region 4, most of the red points are in the upper right direction of the blue point, indicating that both of the Kxy and Kyx will increase with a high probability.
For the direct damping coefficients group (Dxx, Dyy), when wear occurs in region 4, most of the red (circle) points are in the upper left direction of the blue (triangle) point, indicating that Dxx will decrease and Dyy will increase with a high probability. For the cross stiffness coefficients (Dxy, Dyx), when wear occurs in region 4, most of the red points are in the lower left of the blue point, indicating that both of Dxy and Dyx will decrease with a high probability.
Figure 19 shows the standard deviation of the eight dimensionless dynamic coefficients when there is wear in different circumferential positions. The conclusion can be drawn that all the sample standard deviations of the eight dynamic coefficients reach the maximum when there is wear in region 4. The results above indicate the uncertainty of the dynamic characteristic reaches the largest, which means the influence of wear on the bearing is most obvious in this case.
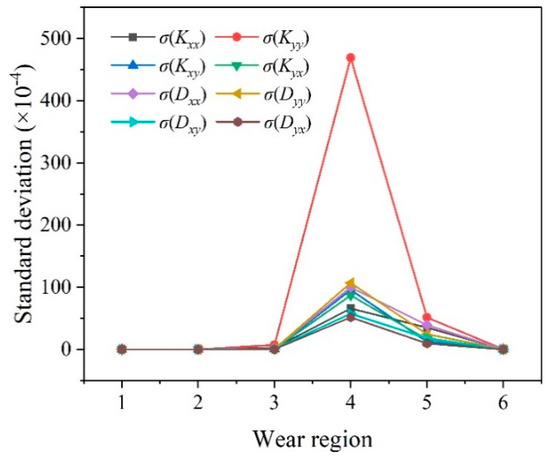
Figure 19.
Standard deviation of the eight dynamic coefficients.
Table 4 shows the correlation coefficients of dimensionless dynamic coefficients for circumferential wear. It can be seen that most of the correlation coefficients are greater than 0.6 as a whole, which indicates that there is a strong correlation between each coefficient.

Table 4.
Coefficients of dimensionless dynamic coefficients for circumferential wear.
When the wear occurs in the regions away from the minimum film thickness area, the influence of the wear on the gas flow field is very small, so the wear can be equivalent to a small perturbation. In this case, the dynamic coefficients are approximately linear with the perturbation, furthermore resulting in an approximately linear relationship between each dynamic coefficient—that is, the absolute value of the correlation coefficient is close to 1.
4. Conclusions
In this investigation, the sensitivity of MEMS gas bearing performance to axial and circumferential wear was investigated in detail considering the rarefaction effect. In the actual operation of MEMS gas bearing, specifically, the following conclusions can be drawn from the analysis of this paper:
- (1)
- An approximate mathematical model and calculation method for characterizing the wear of MEMS gas bearing’ inner wall is proposed, and the statistical method is put forward to describe the static and dynamic characteristics of the MEMS gas bearing, then the sensitivity of bearing’ performances to circumferential and axial wear is obtained.
- (2)
- When there is an axial wear, as the wear position moves from the bearing ends toward the center, the distribution points of static performance and the dynamic characteristic coefficients tends to be dense, indicating that the operating stability of the bearing is relatively stronger when there is wear near the axial center. The standard deviations of the eight dynamic coefficients tend to decrease as the wear position moves toward the center.
- (3)
- When there is a circumferential wear, the wear near the minimum film thickness area has a greater influence on the static and dynamic properties of the MEMS gas bearing. The standard deviations of the eight dynamic coefficients reach a maximum with the wear region near the minimum film thickness area.
- (4)
- For both the circumferential and axial wear states, in general, the correlation coefficients of the dynamic coefficients for each group are high, which means that the wear can be equivalent to a small perturbation.
- (5)
- According to the analysis results, in order to obtain better stability and dynamic performances of gas bearing, in the actual manufacturing process of gas bearing, a higher standard of smoothness and wear resistance should be imposed in the main loading region and the area near both ends.
Some practical approaches can be adopted to resist wear. Firstly, in the actual operation process, periodic replacement of the bearing loading region can be applied to reduce the wear of gas bearing and make the wear of the whole bearing more uniform, which should achieve the purpose of improving the service life of gas bearing. Secondly, increasing the purity of the lubricant and preventing fine particles from entering the gas. Because the rotating speed of gas bearing is very high, these kinds of fine particles will impact the inner surface of the bearing at a very high speed, which will lead to wear and tear.
Author Contributions
Conceptualizeation, L.L., D.Z. and Y.X.; investigation, L.L.; methodology, L.L. and D.Z.; resources, D.Z. and Y.X.; software, L.L. and Y.X.; supervision, D.Z. and Y.X.; validation, D.Z.; writing-original draft preparation, L.L.; review and editing, L.L., D.Z. and Y.X.
Funding
This research received no external funding.
Conflicts of Interest
The authors declare no conflict of interest.
Nomenclature
| c | radius clearance/mm | Qp | flow rate coefficients for Poiseuille flows |
| C | Dimensionless radius clearance | dimensionless flow rate coefficients for Poiseuille flows | |
| D | inverse Knudsen number | r | bearing radius/mm |
| D0 | characteristic inverse Knudsen number | rj | journal radius/mm |
| D(x,y), D(ε,θ) | Dimensionless damping coefficients | Rg | gas constant/J·mol−1·K−1·kg−1 |
| e | Eccentricity/μm | T | Transformation matrix |
| E0 | perturbation amplitude of eccentricity ratio | Ta | temperature/K |
| f | journal rotating frequency/Hz | z | axis coordinate |
| H | dimensionless film thickness, H = h/c | dimensionless axis coordinate | |
| H0 | Dimensionless steady film thickness | α | angle between θ and rear center line of misalignment journal/rad |
| HE, HΘ | derivative of Hd0 to. E0 and Θ0 | δH | Film thickness perturbation |
| Hd0 | perturbation amplitude of film thickness | δP | Pressure perturbation |
| Kn | Knudsen number | δε | eccentricity ratio perturbation |
| K(x,y), K(ε,θ) | Dimensionless stiffness coefficients | δθ | attitude angle perturbation/deg |
| L | bearing length/mm | ε | eccentricity ratio |
| n | Journal rotating speed/r·min−1 | ε0 | eccentricity ratio in static position |
| pa | atmospheric pressure/Pa | dimensionless projection length of the rotor axis at the rotor end face | |
| P | dimensionless pressure, P = p/pa | θ | attitude angle/deg |
| P0 | Dimensionless steady film pressure | θ0 | attitude angle in static position/deg |
| Pd0 | perturbation amplitude of pressure | Θ0 | perturbation amplitude of attitude angle/deg |
| PE, PΘ | derivative of Pd0 to. E0 and Θ0 | Λ | bearing number |
| PEI, PER | Imaginary and real part of PE | μ | air viscosity/Pa·s |
| PΘI, PΘR | Imaginary and real part of PΘ | ν | Journal perturbation frequency |
| PEIΩ, PERΩ | PE and PΘ divided by Ω | τ | dimensionless time |
| PEI0, PER0 | PEI and PER when Ω tends to 0 | φ, ψ | cylinder coordinates |
| PEI+∞, PER+∞ | PEI and PER when Ω tends to +∞ | φx, φy | deflection angle/rad |
| Qcon | flow rate for continuum flow | Ω | Perturbation frequency ratio |
References
- Wang, W.; Wang, Y.; Bao, H.; Xiong, B.; Bao, M. Friction and wear properties in MEMS. Sens. Actuators A Phys. 2002, 97, 486–491. [Google Scholar] [CrossRef]
- Epstein, A.; Senturia, S.; Al-Midani, O.; Anathasuresh, G.; Epstein, A.; Senturia, S.; Al-Midani, O.; Anathasuresh, G.; Ayon, A.; Breuer, K.; et al. Micro-heat engines, gas turbines, and rocket engines-The MIT microengine project. In Proceedings of the 28th Fluid Dynamics Conference, Snowmass Village, CO, USA, 29 June 1997; p. 1773. [Google Scholar]
- Epstein, A.H.; Senturia, S.D.; Anathasuresh, G.; Ayon, A.; Breuer, K.; Chen, K.S.; Ehrich, F.; Gauba, G.; Ghodssi, R.; Groshenry, C.; et al. Power MEMS and microengines. In Proceedings of the International Solid State Sensors and Actuators Conference (Transducers’ 97), Chicago, IL, USA, 19 June 1997; pp. 753–756. [Google Scholar]
- Alexander, F.J.; Garcia, A.L.; Alder, B.J. Direct simulation Monte Carlo for thin-film bearings. Phys. Fluids 1994, 6, 3854–3860. [Google Scholar] [CrossRef]
- Myo, K.S.; Zhou, W.; Lee, K.L.; Yu, S.; Hua, W. Direct Monte Carlo simulation of nanoscale mixed gas bearings. Adv. Mech. Eng. 2015, 7, 1687814015589528. [Google Scholar] [CrossRef]
- Su, W.; Liu, H.; Zhang, Y.; Wu, L. Rarefaction cloaking: Influence of the fractal rough surface in gas slider bearings. Phys. Fluids 2017, 29, 102003. [Google Scholar] [CrossRef]
- Liu, R.; Wang, X.L.; Zhang, X.Q. Effects of Gas Rarefaction on Dynamic Characteristics of Micro Spiral-Grooved Thrust Bearing. J. Tribol. 2012, 134, 0222011–0222017. [Google Scholar] [CrossRef]
- Park, D.J.; Kim, C.H.; Jang, G.H.; Lee, Y.B. Theoretical considerations of static and dynamic characteristics of air foil thrust bearing with tilt and slip flow. Tribol. Int. 2008, 41, 282–295. [Google Scholar] [CrossRef]
- Zhang, X.Q.; Wang, X.L.; Liu, R.; Wang, B. Influence of temperature on nonlinear dynamic characteristics of spiral-grooved gas-lubricated thrust bearing-rotor systems for microengine. Tribol. Int. 2013, 61, 138–143. [Google Scholar] [CrossRef]
- Bird, G. Molecular Gas Dynamics and the Direct Simulation of Gas Flows; Oxford Engineering Science Series; Clarendon: Oxford, UK, 1994. [Google Scholar]
- Fukui, S.; Kaneko, R. Analysis of Ultra-Thin Gas Film Lubrication Based on Linearized Boltzmann Equation: First Report—Derivation of a Generalized Lubrication Equation Including Thermal Creep Flow. J. Tribol. 1988, 110, 253–261. [Google Scholar] [CrossRef]
- Fukui, S.; Kaneko, R. A Database for Interpolation of Poiseuille Flow Rates for High Knudsen Number Lubrication Problems. J. Tribol. 1990, 112, 78–83. [Google Scholar] [CrossRef]
- Zhang, C.; Jiang, X.; Wang, L.; Sun, T.; Gu, L. Effect of surface roughness on the start-stop behavior of air lubricated thrust micro-bearings. Tribol. Int. 2018, 119, 436–442. [Google Scholar] [CrossRef]
- Lee, Y.B.; Kwak, H.D.; Kim, C.H.; Lee, N.S. Numerical prediction of slip flow effect on gas-lubricated journal bearings for MEMS/MST-based micro-rotating machinery. Tribol. Int. 2005, 38, 89–96. [Google Scholar] [CrossRef]
- Li, W.L. Squeeze film effects on dynamic performance of MEMS μ-mirrors-consideration of gas rarefaction and surface roughness. Microsyst. Technol. 2008, 14, 315–324. [Google Scholar] [CrossRef]
- White, J.W.; Raad, P.E.; Tabrizi, A.H.; Ketkar, S.P.; Prabhu, P.P. A Numerical Study of Surface Roughness Effects on Ultra-Thin Gas Films. J. Tribol. 1986, 108, 171–177. [Google Scholar] [CrossRef]
- Bhat, N.; Barrans, S.; Kumar, A.; Barrans, S. Performance analysis of Pareto optimal bearings subject to surface error variations. Tribol. Int. 2010, 43, 2240–2249. [Google Scholar] [CrossRef][Green Version]
- Sharma, S.C.; Phalle, V.M.; Jain, S.C. Combined Influence of Wear and Misalignment of Journal on the Performance Analysis of Three-Lobe Three-Pocket Hybrid Journal Bearing Compensated with Capillary Restrictor. J. Tribol. 2012, 134, 011703. [Google Scholar] [CrossRef]
- Wang, X.; Xu, Q.; Wang, B.; Zhang, L.; Yang, H.; Peng, Z. Effect of surface waviness on the static performance of aerostatic journal bearings. Tribol. Int. 2016, 103, 394–405. [Google Scholar] [CrossRef]
- Wang, X.; Xu, Q.; Huang, M.; Zhang, L.; Peng, Z. Effects of journal rotation and surface waviness on the dynamic performance of aerostatic journal bearings. Tribol. Int. 2017, 112, 1–9. [Google Scholar] [CrossRef]
- Feng, K.; Li, W.J.; Wu, S.B.; Liu, W.H. Thermohydrodynamic analysis of micro spherical spiral groove gas bearings under slip flow and surface roughness coupling effect. Microsyst. Technol. 2017, 23, 1779–1792. [Google Scholar] [CrossRef]
- Song, M.; Azam, S.; Jang, J.; Park, S.S. Effect of shape errors on the stability of externally pressurized air journal bearings using semi-implicit scheme. Tribol. Int. 2017, 115, 580–590. [Google Scholar] [CrossRef]
- Andharia, P.I.; Pandya, H.M. Effect of Longitudinal Surface Roughness on the Performance of Rayleigh Step Bearing. Int. J. Appl. Eng. Res. 2018, 13, 14935–14941. [Google Scholar]
- Shi, B.; Guo, K.; Feng, Y. Modified MGL Equation Considering Both Effects of Surface Roughness and Accommodation Coefficient for Ultra-thin Gas Film Lubrication. In Proceedings of the 2018 IEEE International Magnetics Conference (INTERMAG), Singapore, 23–27 April 2018; pp. 1–2. [Google Scholar]
- Wu, Y.; Yang, L.; Xu, T.; Xu, H. Interactive Effects of Rarefaction and Surface Roughness on Aerodynamic Lubrication of Microbearings. Micromachines 2019, 10, 155. [Google Scholar] [CrossRef] [PubMed]
- Li, L.; Zhang, D.; Xie, Y. Effect of misalignment on the dynamic characteristic of MEMS gas bearing considering rarefaction effect. Tribol. Int. 2019, 139, 22–35. [Google Scholar] [CrossRef]
© 2019 by the authors. Licensee MDPI, Basel, Switzerland. This article is an open access article distributed under the terms and conditions of the Creative Commons Attribution (CC BY) license (http://creativecommons.org/licenses/by/4.0/).