Article

Utilizing Energy Storage for Reliability Solutions in Active Distribution Systems

Department of Electrical and Computer Engineering University of Saskatchewan, Saskatoon, SK S7N4S4, Canada
*
Author to whom correspondence should be addressed.
Appl. Sci. 2019, 9(20), 4392; https://doi.org/10.3390/app9204392
Submission received: 17 September 2019 / Revised: 8 October 2019 / Accepted: 14 October 2019 / Published: 17 October 2019
(This article belongs to the Special Issue Battery Energy Storage in Smart Grid)

Abstract

:
Stochastic failures in a distribution network result in different reliability events, such as voltage sags and momentary and sustained interruptions, causing significant financial losses for many customers. Strategic utilization of energy storage system (ESS) can help mitigate these reliability events. This paper investigates the role of ESS toward providing reliability solutions in the context of an active distribution system. In this regard, scenario-based probabilistic modeling of reliability event mitigation with the ESS is presented, which is integrated into the reliability evaluation framework. The proposed approach is efficient in assessing reliability solutions with ESS considering storage technology type, power/energy rating, hardware availability, presence of other distributed energy resources, etc. A range of case studies is conducted to evaluate mitigation of reliability events at a different level of the distribution system. Valuable insights into the efficient utilization of ESS are provided based on findings.

1. Introduction

The quality of supply is getting increased attention in modern society with the widespread use of sensitive equipment and industrial processes. These devices/processes are subject to misoperation even with short-duration reliability events: voltage sags and momentary interruptions. Financial losses due to short-duration reliability events are significant for an industrial/commercial customer [1]. The sustained interruption-based reliability indices are generally utilized in system planning and regulatory compliance structures [2]. Such practice, however, fails to provide incentives for utilities to invest in system upgrades to improve the reliability performance considering short-duration reliability events. However, regulators and electric utilities are taking into account disruptive voltage sag and momentary interruption in addition to sustained interruptions, together termed as Reliability Events (RE) [1], in system planning and regulatory policies with ongoing changes in the modern distribution system [2].
Commercial and industrial customers generally install a standby supply system in the form of the uninterruptible power supply (UPS) or emergency generators to deal with short- and long-duration reliability events [3]. Sensitive customer loads can be connected to multiple supply points, such that in case of a disturbance in the primary supply point, the secondary supply will take up the load with fast switching action [4]. Voltage sag mitigation with power electronic-based devices, e.g., dynamic voltage regulator (DVR), dynamic sag corrector (DSC), Thyristor voltage regulator (TVR), flexible ac transmission system (FACTS) devices, etc., are also common in modern distribution system [5,6].
With the advent of smart control, monitoring, and communication systems, distributed energy resources (DERs), which include energy storage system (ESS) and distributed generation (DG), are also being utilized to mitigate different reliability events. DERs can help reduce the impact of sag event by injecting an additional reactive power in case of voltage dips during system contingencies [7]. The energy storage installed at customer premises can override short- and long-duration reliability events [8,9]. Microgrid, which consists of controllable loads and DERs integrated at the point of common coupling (PCC) of distribution network, operates in isolated mode during utility supply disturbances (sags and interruptions), thereby protecting critical load against reliability events [7,10]. DERs that are not part of such microgrids and integrated along a distribution feeder can also operate in an islanded mode to reduce long-duration outages [11].
Various aspects of utilization of ESS and other distributed energy resources to mitigate different reliability events have been explored in the existing literature. Reference [3] provides an analytic method to assess the contribution of energy storage and a backup generator to reduce the impact of sustained outages. A new method of protecting sensitive load against momentary interruptions using inverter-coupled ESS is developed in Reference [9]. The potential of sodium–sulfur batteries to protect customer devices/processes are investigated in Reference [8]. Authors in Reference [7] have discussed the role of DG in the mitigation of reliability events with the microgrid-like operation and an additional current injection method. References [5,6] have presented methodologies to model the contribution of power electronic-based devices to lower the impact of voltage sag on an individual load point and overall network. A Monte Carlo simulation-based approach is developed to quantify the role of ESS in reducing sustained outages experienced by customers in Reference [11]. The impact of intermittent renewable energy resources on the distribution network and the use of energy storage to mitigate this issue have been explored in Reference [12]. Authors in Reference [13] have analyzed the reliability and economic aspect of the microgrid with renewable energy resources and storage from the system planning perspective.
Works in References [3,8,9,11,13] either only considers supply interruptions or the methods proposed are not readily applicable in the context of utility-scale distribution network. References [5,6,7,12] have taken into account the voltage sag/swell, however, generalized methods are lacking to incorporate the intermittency of renewable DGs and energy limitation of storages. Thus, the above-reported literature lacks the systematic approach to assess the role of ESS to mitigate short- and long-duration reliability events at a different level of a distribution system. Such a comprehensive assessment provides a basis to examine the cost-effectiveness of reliability-centric upgrades at the customer and system planning level. In this regard, this work explores the role of ESS, along with other resources, to mitigate reliability events that arise from random failures in the distribution network. Scenario-based probabilistic modeling of reliability event mitigation with the ESS is presented, which is integrated into the reliability evaluation framework. The proposed approach is efficient in assessing the reliability solutions with ESS considering storage technology type, power/energy rating, hardware availability, presence of other distributed energy resources, etc. The possible use of other resources to alleviate reliability/power quality issues is also discussed. A range of case studies is performed considering the ESS at an end-user premise, and the utility/microgrid-scale ESS to examine their potential to provide reliability solutions. Finally, valuable insights into the efficient utilization of ESS are provided based on findings.

2. Quantification of Reliability Events

This section illustrates different reliability events and their causes and presents a framework to assess the reliability of the distribution network. Upon the occurrence of a fault in the network, root mean square voltage magnitude drops below the nominal voltage, thus leading to voltage sag. Both temporary and permanent faults cause the voltage sag until the responsible protection device operates [14]. The severity of voltage sag depends on fault location, fault impedance, fault-clearing time, sensitivity of customer equipment/process, moment of occurrence of sag event, etc.
A momentary interruption occurs due to a brief loss of continuity of supply resulting from opening and closing of a protective device for a short duration (usually, the duration of 1–5 min is taken). Multiple interruptions caused by the recloser operating sequence is designated as one momentary interruption event in this work. The permanent fault, besides the temporary fault, can lead to a momentary interruption due to the service restoration with an automatic switching [2]. The momentary interruption introduced by DERs due to the restoration of supply with the islanded operation with automatic switching [15] is also considered in this work. The sustained interruption is defined as any interruption event, other than the momentary interruption. It should be noted that the temporary failure might cause sustained interruption as well. For instance, if a temporary failure causes a fuse to operate, customers downstream the fuse would experience sustained interruption until the fuse is replaced [2].
It should be noted that depending on the nature of the contingency and protection settings different load points experience different reliability events. Voltage sags, momentary interruptions, and sustained interruptions resulting from both temporary and permanent failures are considered in this work. Sometimes, one reliability event experienced by the customer evolves to another one upon the sequence of protection device operations. It is illustrated with an example of a permanent fault on L4 in Figure 1. It causes R2 to operate in order to clear the fault; therefore, LP3 and LP4 experience a momentary interruption during recloser operation. It should be noted that before R2 actuates, all load points in the network experience voltage sag. However, after a preset number of operations, R2 lock-opens resulting in sustained interruptions for LP3 and LP4 until the repair is done. In these situations of the temporally evolving reliability events, the final reliability event due to a contingency is assigned to the load point. Such practices result in a better estimation of customer reliability profile and associated financial losses.
Reliability evaluation frameworks are mostly based on failure mode and effect analysis (FEMA) using the contingency enumeration technique. This paper adopts the same approach. Steps illustrated in Algorithm 1 quantifies different reliability events for load points and the system. The frequency and duration of reliability events and the associated customer damage cost are utilized to quantify the reliability profile. F l , D S E denotes the expected frequency of equipment/processes disruption due to voltage sag for a load point. Expected frequency of momentary and sustained interruptions experienced by a load point is represented by F l , M I and F l , S I , respectively. These frequency indices are expressed in terms of occurrence/year. Expected annual outage time (also called unavailability) associated with a sustained interruption for a load point is represented by U l , S I and measured in hr/yr. D l , D S E , D l , M I , and D l , S I provide the estimation of average annual customer damage cost (k$/yr) due to disruptive voltage sags, momentary interruptions, and sustained interruptions, respectively. The damage cost is a function of customer category, outage duration, and average demand of a customer. The expected value of system-level reliability index is obtained by aggregating the corresponding index of network load points. It should be noted that frequency and duration-based indices are weighted by the number of customers at each load point. Indices for load point reliability profile are quantified using (5)–(8), whereas (9)–(12) provide the estimation of indices used in system-level reliability profile. The reliability profile of a feeder segment of a network can be obtained in a similar fashion as that of system profile considering load points of that particular segment.
Algorithm 1: Quantification of reliability events.
Step 1.
Model contingency (fault) c x . The fault can be further subdivided into three phases (3-ph), line to line (L-L), line to line to ground (L-L-G), and single line to ground (SLG). The temporary failure rate is assumed to be three times the permanent failure rate in this work [2], and the probability distribution of short circuit fault is assumed as follows: 5% 3-ph, 15% L-L, 10% L-L-G, and 70% for SLG [14].
Step 2.
Pick a contingency and simulate its impact on load points considering all reliability events as described above in Section 2. Assign load points experiencing sags and momentary interruptions to L s a g c , x and L M I c , x . Note L S I c , x and T l , S I c , x for load points experiencing sustained interruption and the corresponding outage duration.
Step 3.
Update the contribution of contingency toward reliability events experienced by load points with (1)–(4).
F l , D S E * c , x = Ψ ( M s a g ,   D s a g , S s a g c c   )      l     L s a g c , x
F l , M I * c , x =   f c , x       l     L M I c , x
F l , S I * c , x =   f c , x        l     L S I c , x
U l , S I * c , x =   f c , x × T l , S I c , x        l     L S I c , x
The damage cost incurred to load points ( D l , R E c , x ) for each type of reliability event (RE) due to the contingency is also evaluated [16].
These indices with an asterisk are obtained without considering DERs/microgrids. Corresponding values after considering DERs/microgrids operation (to be discussed in Section 3) are denoted without an asterisk (*).
Step 4.
Repeat Step 1 to Step 3 for all possible contingencies in a network and obtain load point reliability profile: { F l , D S E ,   F l , M I , F l , S I ,   U l , S I , D l , D S E , D l , M I , D l , S I ,   D l , t o t } as given in (5)–(8).
F l , R E = c   F   l , R E c , x              R E   { D S E ,   M I ,   S I }
U l , S I = c U l , S I c , x
D l , R E = c D l , R E c , x                 R E   { D S E ,   M I ,   S I }
D l , t o t = R E D l , R E              R E   { D S E ,   M I ,   S I }
Step 5.
Obtain the system reliability profile: { F D S E , F M I , F S I , U S I ,   D D S E , D M I , D S I , D t o t } using load point reliability profile obtained in Step 4 as given in (9)–(12).
F R E =   l L   F l , R E × N l N C        R E   { D S E ,   M I ,   S I }
U S I = l L   U l , S I × N l N C
D R E = l L D l , R E        R E   { D S E ,   M I ,   S I }
D t o t = R E D R E         R E   { D S E ,   M I ,   S I }
Detailed protection system setting and restoration strategy is not explained in this work. Graph theory [17] or other suitable approaches [10] can be adopted for this purpose. It should be noted that the severity of voltage sag, as represented in (1), mainly depends on its retained magnitude ( M s a g ), duration ( D s a g ), and the sensitivity of customer equipment/process to voltage sag ( S s a g c c ) [14,18]. The magnitude of voltage sag ( M s a g ) greatly depends on fault type, location of the fault, as well as fault impedance. The voltage sag due to self-distinguishing faults is not considered. The fault position method is adopted, and the fault analysis is performed on the basis of the classical symmetrical-component model to evaluate M s a g [19].
The corresponding duration of voltage sag ( D s a g ) depends on the short circuit level, fault-clearing times of protective devices, self-extinguishing nature of the fault, and the delay used in protection settings [14,18]. The probabilistic representation of fault-clearing time associated with a primary protection device can be represented with a probability distribution function (PDF) [18,20], as depicted by the normal distribution in Figure 2a. Such PDF is discretized into multiple intervals, and a mid-point value is represented as the value of sag duration ( D s a g ). The magnitude and duration of voltage sag due to a contingency is noted and compared against the sag tolerance curve of customer equipment/process as shown in Figure 2b. In this paper, such sag events that are beyond the sag tolerance curve are reported under ‘disruptive sag event’ (DSE). This work incorporates a probabilistic approach, similar to works in References [18,20], to quantify the frequency of DSE as illustrated in Algorithm 1, and takes into account different types of fault, protection settings and resulting duration, and associated probabilities (weightages).

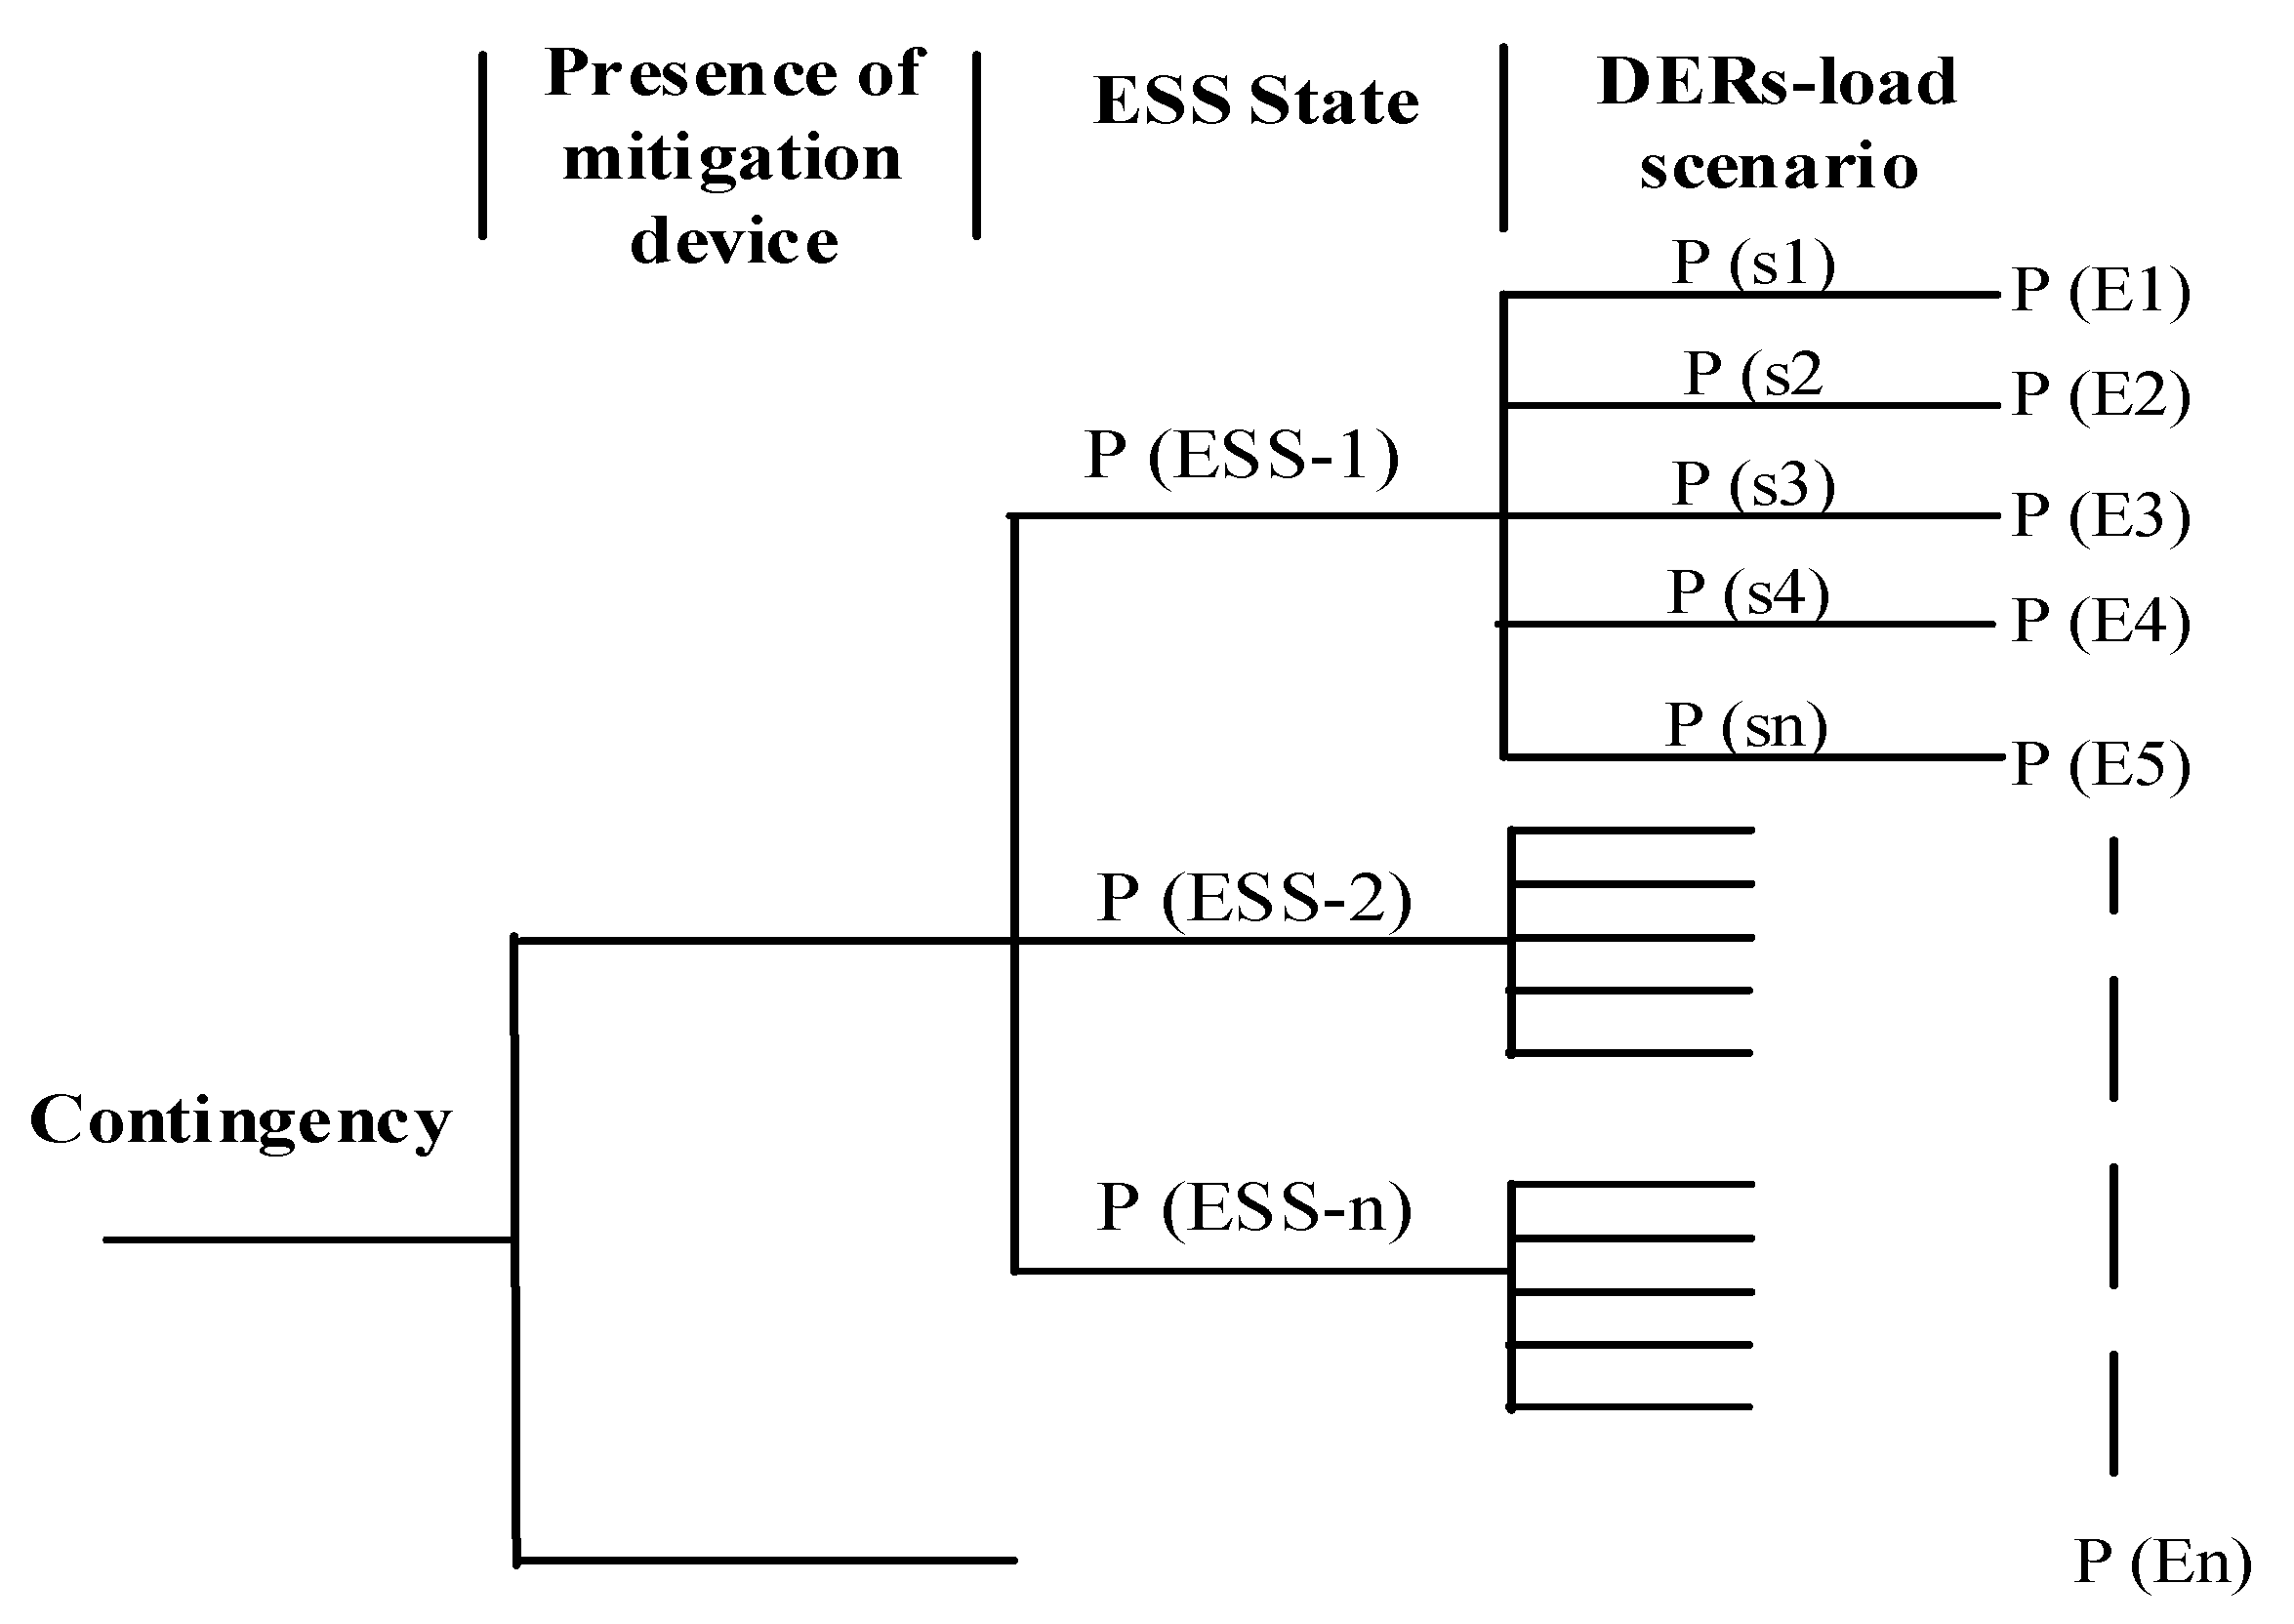
3. Scenario-Based Probabilistic Modeling of Reliability Solutions with ESS

This section develops a scenario-based stochastic modeling approach for the mitigation of reliability events brought by ESS. ESS could be present at the customer premise, integrated along the main feeder along with other distributed resources, or in a microgrid protecting one or more customer loads (MG1 and MG2 in Figure 3). Such microgrids generally have DGs, storage, and controllable loads necessary to balance voltage and frequency while operating in an isolated mode in case of a fault in the utility supply side. Management and control system of the microgrid has the ability to switch into an isolated mode in a sub-cycle range with the help of fast-acting switch at PCC, thus, preventing damage to sensitive loads [10]. The same switch at PCC [10] would clear any fault within the microgrid. The seamless transfer to the isolated mode and resynchronization with the utility grid helps mitigate voltage sags and momentary/sustained interruptions experienced by microgrid customers.
DERs integrated along the main feeder (Seg 3 and Seg 4 in Figure 3) generally disconnect as soon as they detect a fault [15]. However, they can be reconnected, and supply load points located on a healthy segment of the network if an islanding operation is permitted. Such provision reduces the sustained outages experienced by customers but cannot reduce the impact of voltage sags and momentary interruptions. Thus, ESS (DERs) present at customer-premise or inside the microgrid is considered to be able to mitigate both short- and long-duration reliability events, whereas the ESS (DERs) integrated along the feeder are considered to mitigate long-duration reliability events only. The developed model incorporates hardware availability, power rating, state of charge (SOC) levels, and discharge duration of ESS. It also considers the intermittency of renewable DG, varying load level, and energy limitation characteristics of ESS and correlation between renewable DG output and the load. Scenario representation (such as using historical time-series data, or through the simulation approach) preserve the intermittency and correlation associated with renewable DG output and load. However, a large set of scenarios decreases computational efficiency, which necessitates the use of scenario-reduction methods. Utilization of appropriate approaches while generating the original scenario set and obtaining a reduced set is necessary to ensure the accuracy along with the computational efficiency. In this paper, the original scenario set is represented by historical time series data of renewable DG output and load demand. The final reduced set is obtained with a backward-scenario reduction method [10], which uses the relative closeness among the scenarios and individual scenario probability to eliminate scenarios. Steps within Algorithm 2 illustrate the probabilistic modeling of reliability event mitigation assessment with ESS. The model developed in Algorithm 2 is integrated into the reliability evaluation framework (developed in Section 2) as described in Algorithm 3, thus completing the scenario-based probabilistic modeling of reliability event mitigation with ESS.
Algorithm 2: Probabilistic modeling of reliability event mitigation with the ESS.
Step 1.
Obtain the original scenario set of hourly renewable DG output, e.g., solar photovoltaic (PV) output, wind generator output, and load level using historical data.
Step 2.
Divide the original set of scenarios into two groups, one with data from daylight hours and one with data from night hours, to preserve the typical characteristic of PV not being available during nighttime.
Step 3.
Use the scenario reduction method [10,21] on both sets obtained from Step 2 and merge them to obtain the representative scenario set of DG output (d) and load ( l ); S C d , l = { S C d , l s n , P s c , d g 1 s n , P s c , d g 2 s n , l s c s n   π s c s n } . Here, s n represents a scenario number representing the particular DG output P s c , d g 1 s n and P s c , d g 2 s n , and load level l s c s n . π represents the probability of a scenario under consideration. Two types of renewable resources (Photovoltaic and Wind) are denoted with d g 1 and d g 2 . The output of all DGs for a scenario ( S C ) can be combined to get DG output P s c , d g s n .
Step 4.
Incorporate ESS in the scenario set obtained above as follows:
  • Evaluate the power required from ESS, for a scenario s n ; P s n E S , r e q = ( l s c s n P s c s n )
  • Evaluate c h k p = P a v a E S P s n E S , r e q . The available power of ESS ( P a v a E S S ) depends on hardware availability and rated power.
  • If c h k p < 0 , assign π E S s n = π s c s n , else; π E S s n = π s c s n    e ( D a v a E S S / r l c ) where r l c is the average outage time for load point l due to contingency without considering ESS operation. Discharge duration available ( D a v a E S S ) for a scenario s n is given by D a v a E S = max ( η ×   S O C i n i ×   P a v a E S ×   T r a t e d E S min (   P s n E S , r e q ,     P a v a E S S ) , 0 ) . where η , T r a t e d E S , and S O C i n i , respectively, denote efficiency, discharge duration at rated ESS power, and SOC of ESS (expressed in per unit).
Algorithm 3: Integration of model developed in Algorithm 2 into the reliability assessment framework.
Step 1.
Form an event tree considering all possible events ( E x ) following an occurrence of C x . It incorporates the status of fault isolation and presence of mitigation measures, hardware availability, capacity state of ESS, different scenarios of DG output level and load level, as shown in Figure 4.
Step 2.
Evaluate the probability of events, P ( E x ) , where x is event number ranging from 1 to a total number of events ( n ).
Step 3.
Pick an event (from ( E 1 ) to ( E n )) from an event tree and execute Algorithm 2 to find the probability of reliability event ( R E ) not being mitigated for a load point as given in (13).
P l , R E c , x ( E x ) = P ( E x ) ×   π E S
Step 4.
Repeat Step 2–Step 3 until all scenarios of the event tree are covered, and update (14).
P l , R E c , x = x = 1   n P l , R E c , x ( E x )
Step 5.
Modify frequency/duration indices in (1)–(4) as represented by (15)–(16).
F l , R E c , x = F l , R E * c , x × P l , R E c , x       R E   { D S E ,   M I ,   S I }
U l , S I c , x = U l , S I * c , x × P l ,   S I c , x
Figure 4. Tree diagram of scenarios following a contingency.
Applsci 09 04392 g004

4. Case Studies and Discussion

Figure 3 shows the test distribution system, which is the modified version of feeder 4 at Bus 6 of Roy Billinton Test System (RBTS) [16]. The residential, commercial, and small industrial customer load points are indexed with “RL”, “CL”, and “IL”, respectively. Each residential customer load point “RL” is assumed to have 79 customers with a peak load of 0.27 MW. Corresponding values for “CL” and “IL” are 7 and 0.5 MW, and 1 and 1 MW, respectively. Recloser, fuse, and automatic sectionalizer are indexed with “R”, “F”, and “S”, respectively, in Figure 3. Times to failure and repair are characterized by exponential distributions. The permanent failure rate and average repair time for lines are taken to be 0.046 failures/yr-km and 5 h, respectively. Switching time for manual switches/sectionalizers is 0.5 h. The fuse replacement time is taken as 1.5 h.
The line impedance and other short circuit parameters are taken from Reference [22]. Mean values of fault clearing time for fuse and reclosers are 50 ms and 300 ms with 10% standard deviation. Ride-through capability for different customer categories is assumed as follows: sag magnitude of 0.85 and duration of 40 ms for commercial/industrial customers. Corresponding values for residential customers are 0.75 and 300 ms, respectively. The damage cost is a function of a customer category, outage duration, and average demand of a customer [16]. This work uses a sector customer damage function obtained from the Canadian Survey [16] as shown in Table 1 to estimate financial losses due to reliability events. The damage cost associated with sag event is assumed to be equal to that of momentary interruption which corresponds to the interruption duration of 1 min in Table 1. Damage cost data for sustained interruptions are determined using the data corresponding to interval of more than 1 min presented in Table 1. Results associated with customer financial losses in the presented studies complement information obtained from the reliability indices.

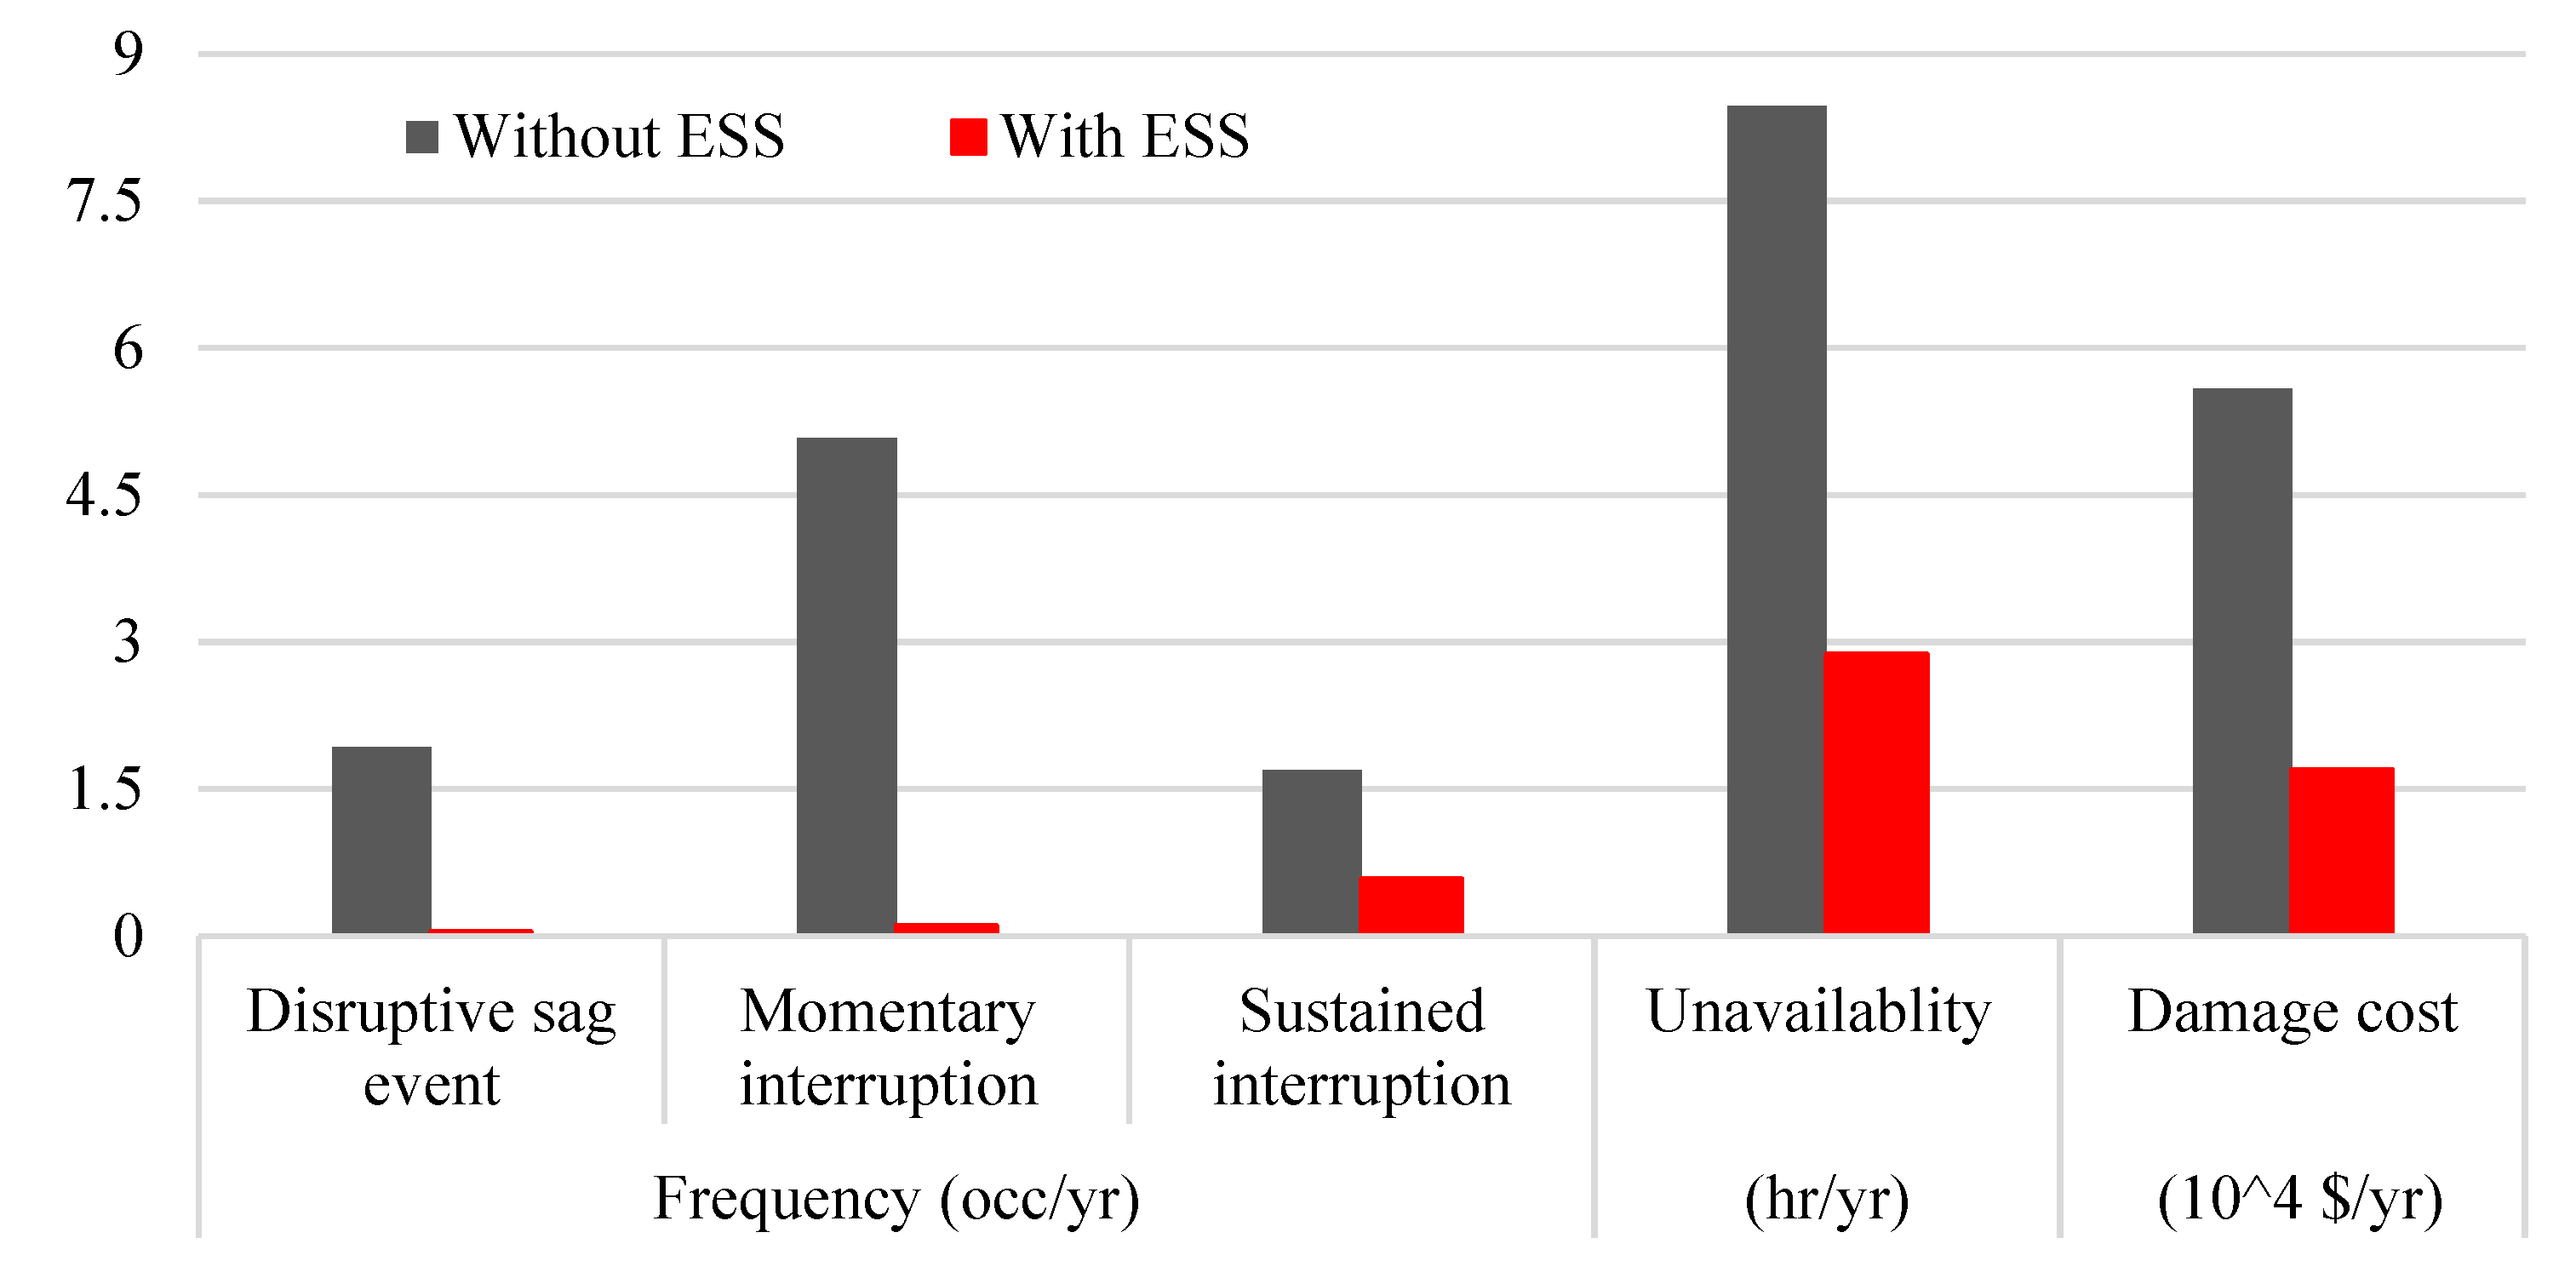
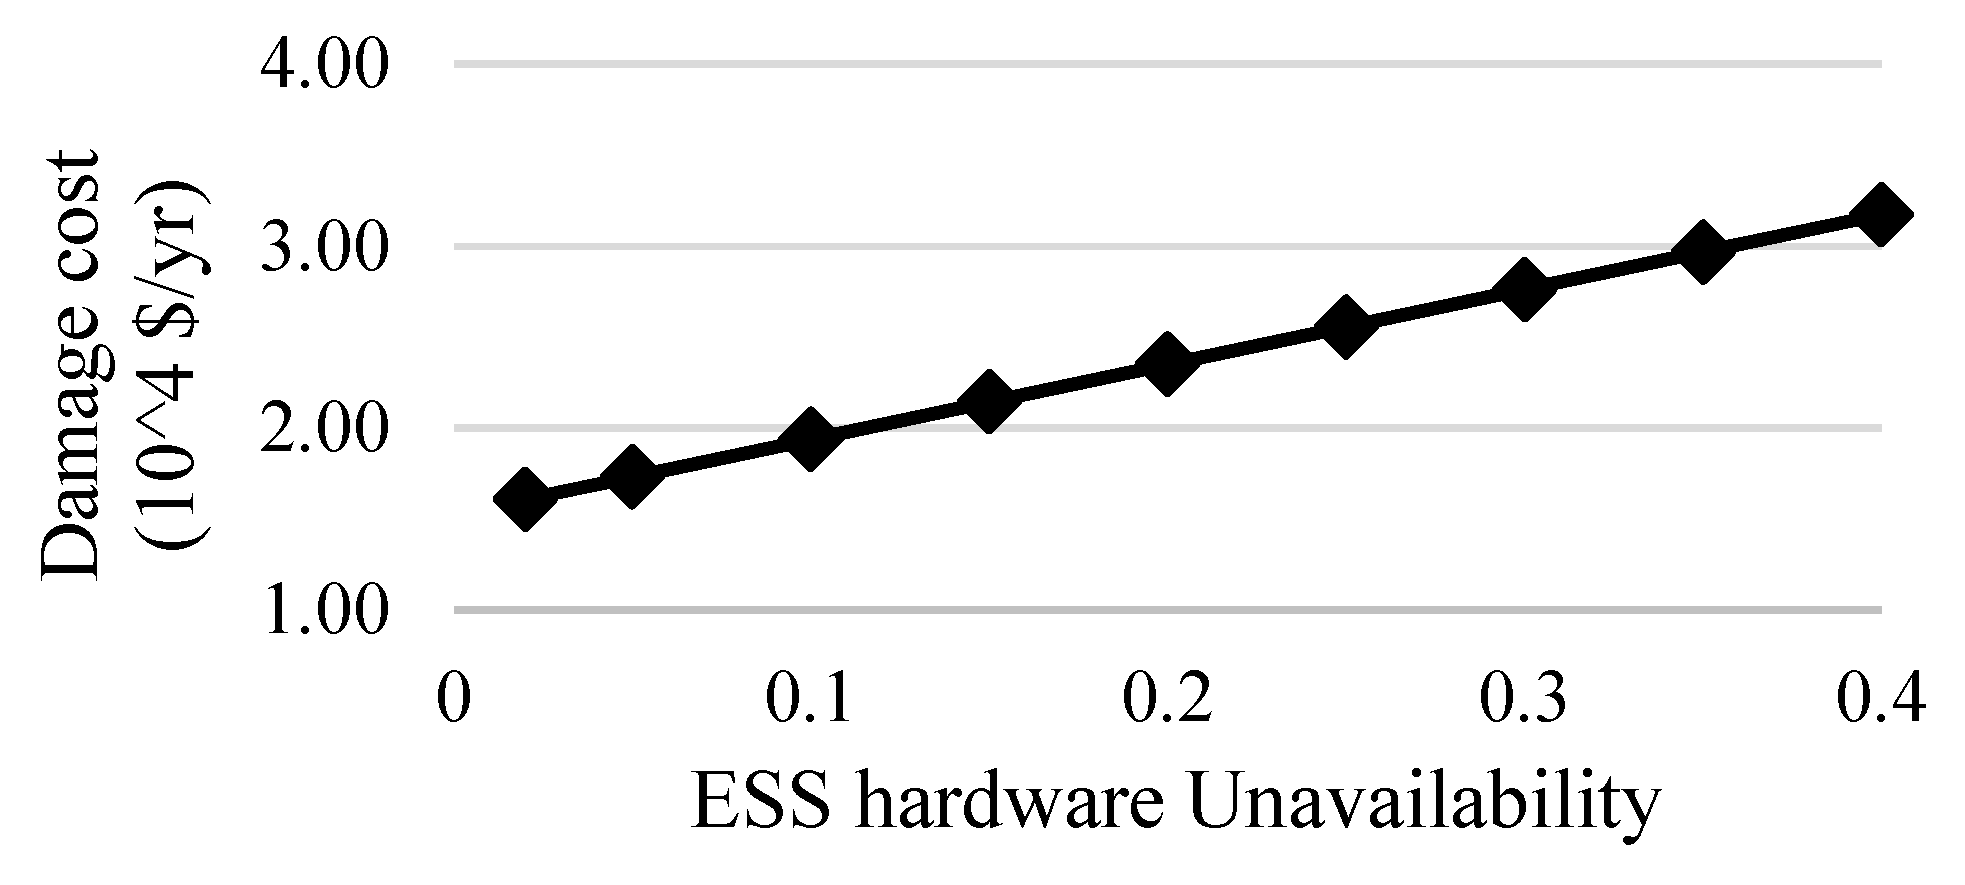
4.1. End-User Reliability Profile with ESS

This section explores the role of ESS toward mitigating different reliability events for a customer sensitive to short-duration reliability events. In addition, the reliability impacts of other resources are also discussed. The critical loads are fed with utility supply during normal condition. ESS takes up the load in isolated microgrid mode in case of utility supply disturbances within a fraction of cycle [8]. The supply is transferred back to utility after utility supply becomes normal. Based on this assumption, the reliability benefit from ESS is assessed executing the algorithm developed in Section 2 and 3. The component availability model of ESS is developed as described in the authors’ previous work [23] is used. This study considers Sodium Sulfur based “PQ-50” module [23] batteries rated at 1 MW and 7 MWhr capacity. The efficiency and allowed minimum SOC are taken as 90% and 10%, respectively. The hardware unavailability for ESS is assumed 2%. ESS-rated capacity is matched to support the entire load, hence the variation in load is neglected in this study.
It should be noted that reliability performance of load point is poor, as it is located far from the substation in a radial distribution feeder. Figure 5 shows the reliability indices of IL9 with and without ESS without considering the operation of DERs/microgrids. The y-axis of Figure 5 shows the magnitude of annual outage time, damage cost, and frequency of disruptive sags, momentary, and sustained interruptions. Results indicate that ESS is effective in improving reliability performance in both short- and long-duration reliability events. It should be noted that the frequency of short-duration reliability events is reduced significantly compared to the sustained interruption-based indices. It is because the discharge duration and SOC of ESS can significantly limit the mitigation of sustained interruption but have little impact on short-duration reliability events. The mitigation of sustained interruptions greatly depends on the initial SOC at the time of contingency, efficiency, and discharge duration of BESS. In addition, reliability improvement depends on hardware availability as well.
Another study is conducted to analyze the impact of initial SOC at the time of occurrence of contingency and the rated discharge duration of ESS to mitigate long-duration outages. Figure 6a,b, respectively, shows that load point unavailability increases with a decrease in SOC and rated discharge duration in the case of sustained forced outages. The sustained interruption frequency follows a similar trend. This means if ESS is utilized for peak shaving or other application instead of standby mode, ability of ESS mitigating sustained outages reduce. However, it does not significantly affect the mitigation for short-duration reliability events. Given that batteries suffer from degradation and need a periodic replacement due to the limited life cycle, other ESS technologies, such as Flywheel, Magnetic energy storage systems (SMES), Supercapacitor, etc., are also used to protect critical loads. These technologies, however, cannot retain energy for a long duration and, therefore, need to be used with other resources (battery, backup generator, etc.) to reduce the financial impact due to long-duration reliability events.
The hardware failure of ESS also plays a vital role in the relative reliability improvement. Both short- and long-duration reliability event-based indices are affected by component failures. A case study was conducted by varying hardware unavailability of ESS and total damage cost incurred to the customer connected at IL9. Figure 7 shows an increase in damage cost with the increase in ESS unavailability. The hardware availability depends on the maintenance practices, configuration of ESS, failure characteristics of components, etc. Results in Figure 7 provide useful information in investing in ESS component reliability.
Apart from using ESS in microgrid mode taking up critical loads in case of utility supply disturbances (as described above), other means of reliability solutions, especially for voltage sag, are also in practice in industries. The injection of series voltage or series voltage by extending the existing power electronic interface used for DG operation help reduces the impact of voltage sag [7]. Power electronic-based devices such as FACTs, STATCOM, SVC, DVR, TVR, etc., can also be used to mitigate voltage sag of the overall system as well as individual buses [5,6]. Their effectiveness to mitigate voltage sag depends on rating and location. Although such practices are effective to mitigate voltage sag, they do not contribute to mitigating interruptions.

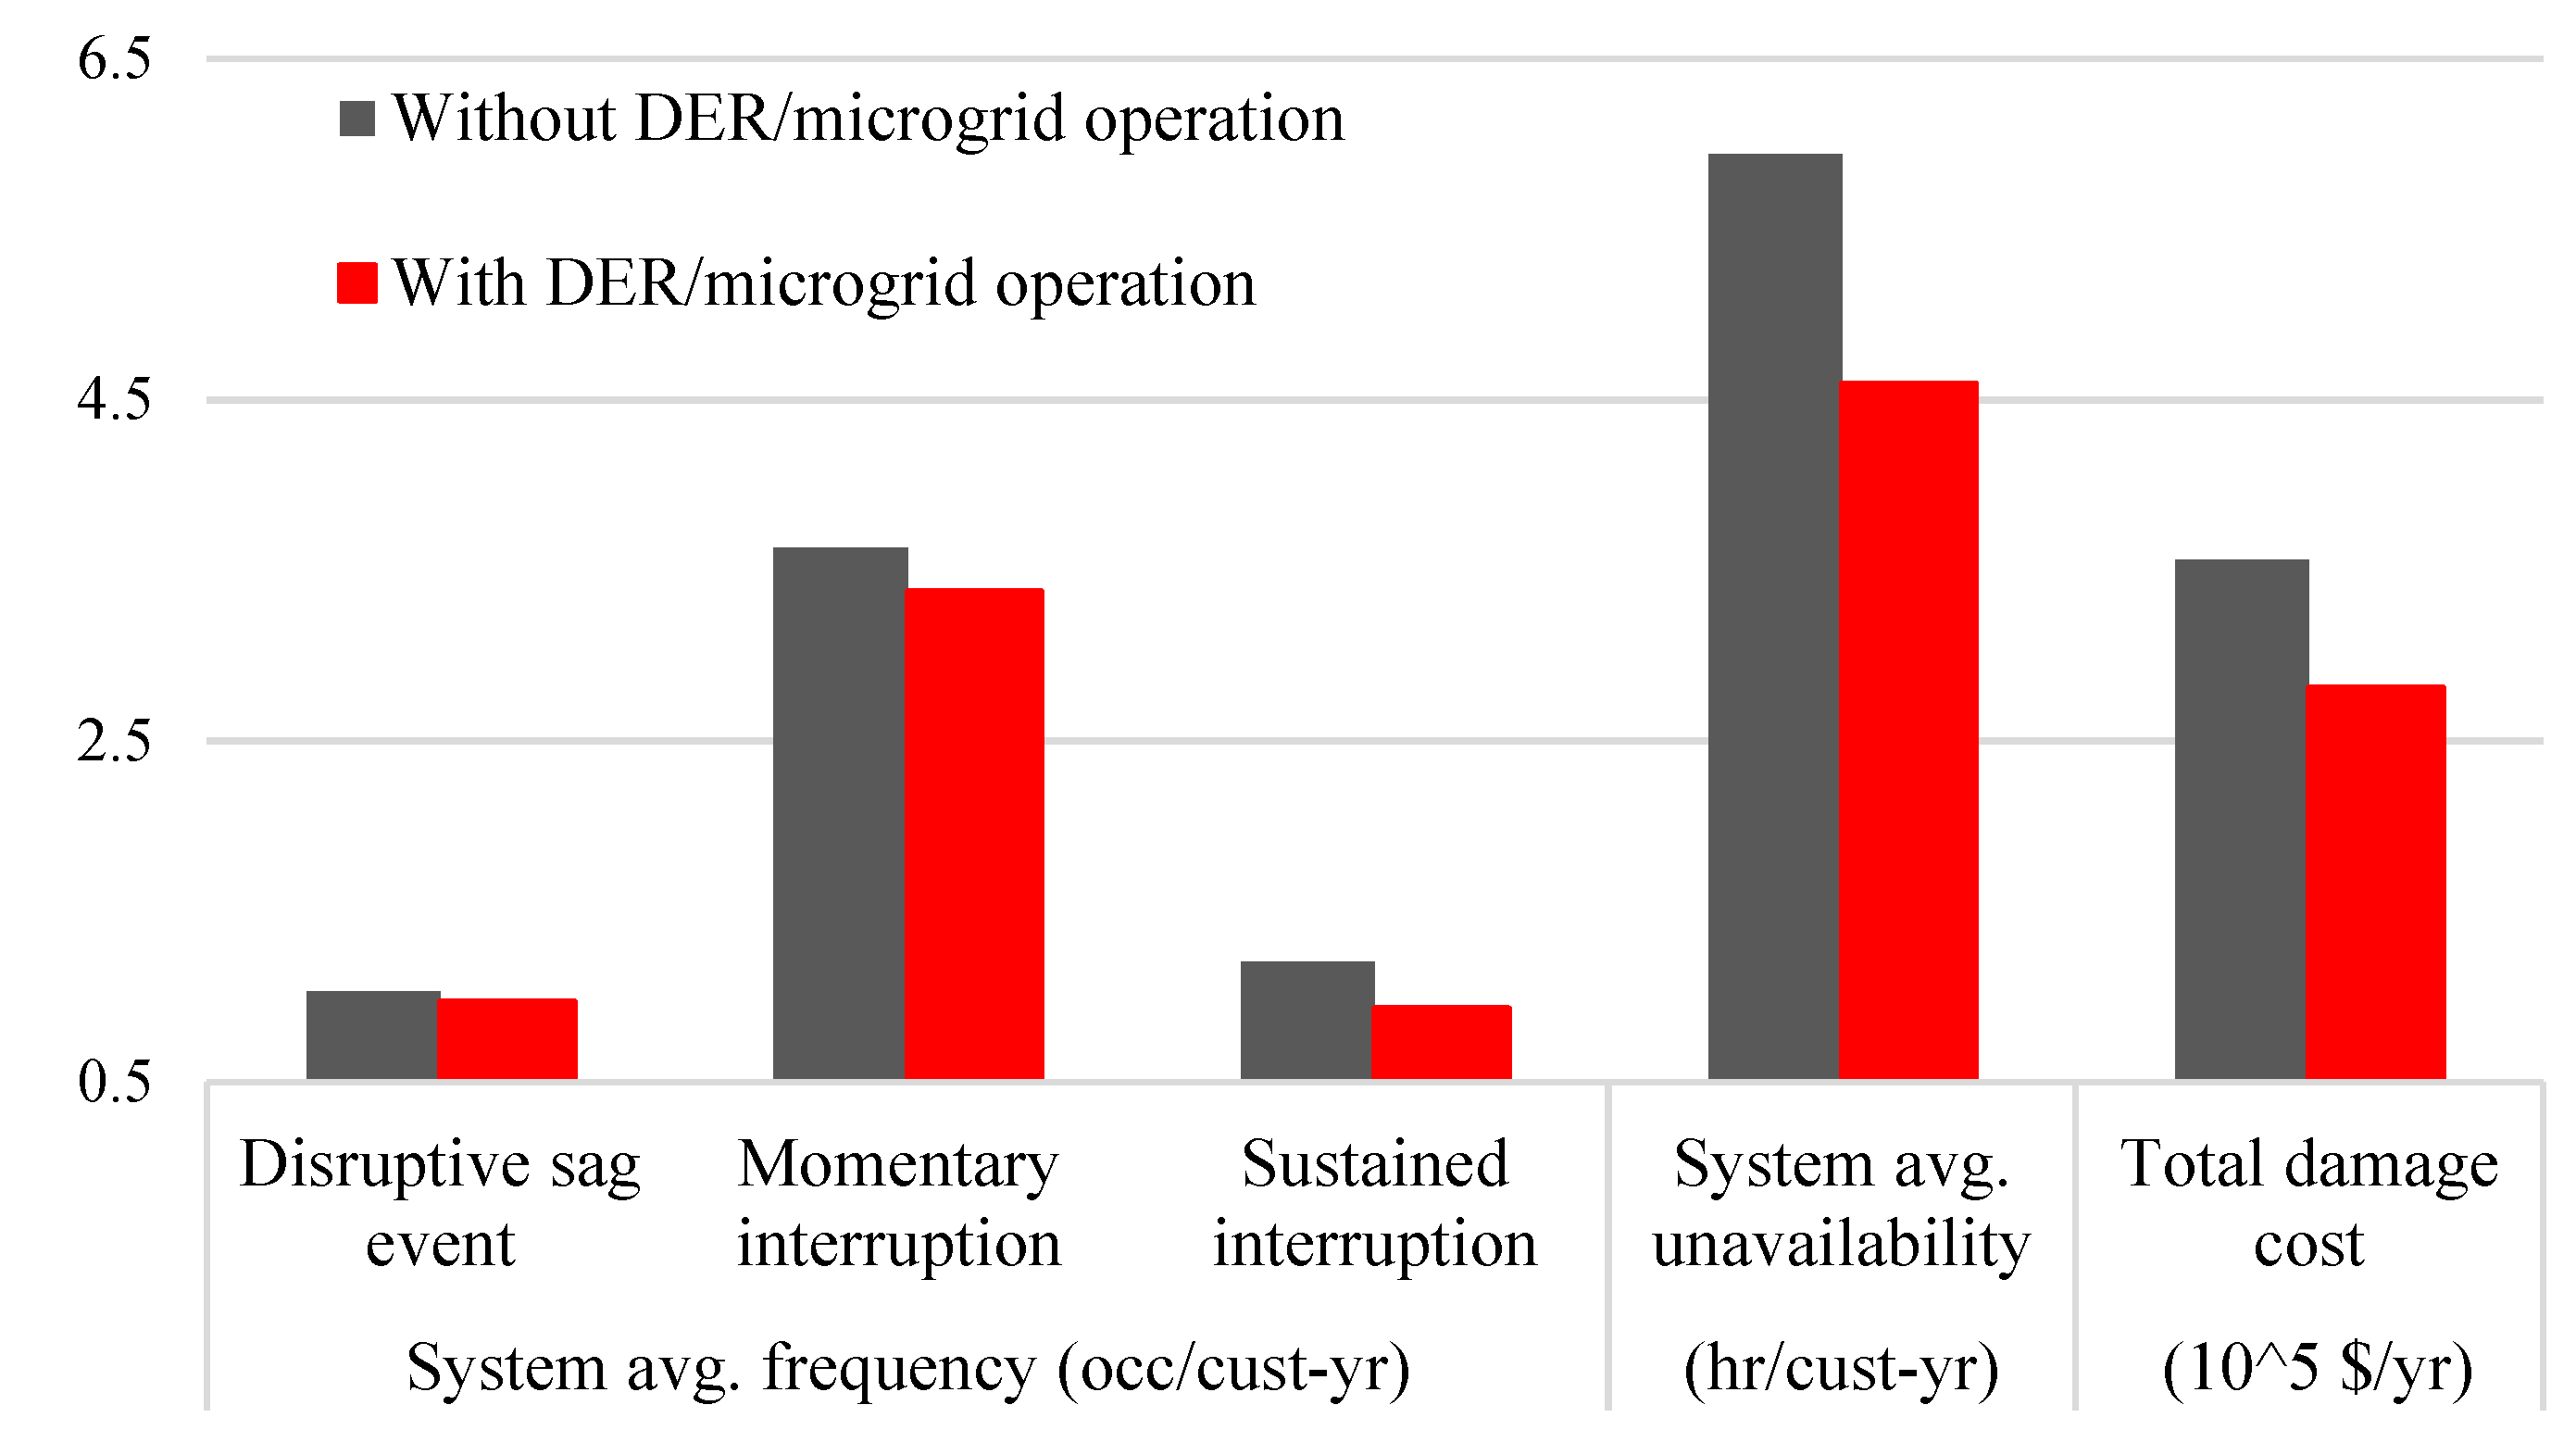
4.2. DERs/Microgrids and Reliability Improvement

In this section, role of DERs/microgrid in mitigating reliability events is discussed. Microgrids (MG1 and MG2) and DERs are integrated (in Seg 3 and Seg 4) into the distribution network as shown in Figure 3. For the purpose of illustration, microgrids and DERs are assumed to consist of PV arrays, wind generators, and an ESS. Historical time series data for wind speed and PV irradiance are taken from Reference [24] for Los Alamitos, California, and the USA for the Year 2003. Corresponding renewable power outputs are obtained using an analytical set of equations [25]. It is acknowledged that the use of more elaborate models considering physical and environmental parameters can also be used to obtain renewable DG output. The rated capacity of wind generator, PV arrays, and ESS for each segment and microgrid are shown in Table 2. SOC and hardware unavailability of ESS used in Section 4.1 are utilized.
Table 3 shows the reliability improvement for customers benefited from DER/microgrid operations. The reliability profile of customers within MG1 indicates that the implementation of microgrid helps reduce the impact of voltage sag, momentary interruption, and sustained interruptions. The customers within MG2 experience a similar improvement in their reliability profile. The islanding operation of DERs in Segment 3 reduces the associated annual outage time (Unavailability, U S I ). However, frequency of momentary interruptions ( F M I ) for these customers appears to be increased. It is due to the restoration of supply with DERs through automatic switching, as mentioned in Section 2. There is no change in the frequency of disruptive sag event ( F D S E ) since voltage sag mitigation with such DERs is not considered. Customers within Segment 4 of the test network experience similar reliability improvement as that of Segment 3. The total customer damage cost ( D t o t ) reported in Table 3 shows that the integration of DERs/microgrid reduces financial losses incurred to customers. It should be noted that the reliability profile of customers located at different parts of the network is dependent on various factors in addition to times to failure and repair of distribution network elements, such as network topology, protection settings, operation strategy of the network (radial/meshed, provision of back-feed supply), voltage sensitivity of customer equipment and processes, and location, capacity, and mix of resources of DERs/microgrids, etc. The methodology developed in this paper take such factors into consideration to quantify the impact of different reliability events to distribution system customers.
In the deregulated environment, utilities are rewarded/penalized based on their system reliability performance as part of the performance-based rate-making. The integration of DERs/microgrids improves the reliability of the worse performing load points as well as the overall network as reported in Figure 8. Results show decrement in system indices of annual outage time, damage cost, and the frequency of disruptive sag event, momentary and sustained interruptions with DERs/microgrids operation. It should be noted that the reliability profile of load points within segment 1 and 2 remain unchanged since there is no DERs/microgrids integrated.
The system reliability profile takes into account all load points and number of customers associated with them. Thus, the contribution of DERs/microgrids in enhancing system reliability profile is lower than that observed in Seg 3, Seg 4, MG 1, and MG 2. Furthermore, incremental reliability benefits are highly influenced by various factors, such as network topologies, provision of fault isolation within microgrid/segments of network, rated power/energy capacity of resources, intermittency/variability of renewable DGs, system load profile, operation modes of ESS, and hardware availability of resources. It should be noted that the quantification of the reliability contribution of renewable DG outputs is affected by the method to represent original scenarios, scenario reduction approach, and the number of reduced scenarios. Thus, care should be taken while using the scenario reduction method to ensure there is a balance between accuracy and computation time. In addition, possible scenarios of different mitigation resources and their states upon the occurrence of contingency (as shown in Figure 4) should be incorporated as elaborated in this paper to assess the accurate reliability profile. Results of case studies presented in this section support the possibility of reliability solutions with DERs/microgrids in the context of the distribution system.

5. Conclusions

This paper explores the role of ESS in providing reliability solutions in the context of the active distribution system. In this regard, a scenario-based probabilistic modeling approach is presented to assess the role of ESS, together with DGs, to mitigate different reliability events (voltage sags, momentary interruptions, and sustained interruptions). A range of case studies conducted shows that the incremental reliability benefits with ESS highly depend on technology type, rated power, hardware availability, rated energy, operating mode, and the presence of other distributed energy resources. Results and discussion presented in this paper imply that the sensitive customer can protect the critical load against disruptive reliability events with ESS. Furthermore, the integration of DERs/microgrids can provide reliability solutions utilizing the advanced control, monitoring, and communication facilities of the smart grid. The approach and case studies provide valuable insights for the reliability-centric system upgrades/investments in the context of the active distribution system.

Author Contributions

Conceptualization, P.G., P.P., and R.K.; methodology, P.G.; software, P.G. and P.P.; validation, P.G., P.P., and R.K.; writing—original draft preparation, P.G.; writing—review and editing, P.P. and R.K.; supervision, R.K.

Funding

This research was funded by NSERC, Canada, under NSERC Energy Storage Technology Network.

Conflicts of Interest

The authors declare no conflict of interest.

Nomenclature

l / L Index of load point and set of network load points.
N l Number of customers at load point l .
N C Total number of customers in a network under consideration.
c x Index of contingency; where x denotes temporary and permanent failure.
D S E ,   M I ,   S I Disruptive voltage sags, momentary, and sustained interruptions, respectively.
R E Reliability event; R E   { D S E , M I , S I } .
M S a g Magnitude of voltage sag.
D S a g Duration of voltage sag.
f c , x Rate of occurrence of c x (occ/yr).
L R E c , x Set of load points experiencing R E due to c x .
T l , S I c , x   Interruption time for load point l experiencing S I due to c x (hr).
F l , R E c , x Frequency of occurrence of R E for l due to c x considering DERs/microgrids (occ/yr).
F l , R E *   c , x Value of F l , R E c , x without considering DERs/microgrids (occ/yr).
U l , S I c , x Unavailability due to S I for l due to c x considering DERs/microgrids (hr/yr).
U l , S I *   c , x Value of U l , S I c , x without considering DERs/microgrids (hr/yr).
D l , R E c , x Damage cost of RE for l due to c x (k$/yr).
P l , R E c , x Probability of reliability event ( R E ) caused by c x not being mitigated for l .
F l , R E Frequency of occurrence of R E for load point l (occ/yr).
F R E System frequency index for of R E (occ/cust-yr).
U S I System index of unavailability of S I (hr/cust-yr).
D l , R E Damage cost due to R E for l (k$/yr).
D l , t o t Total damage cost due to all the reliability events for l (k$/yr).
D R E System index of customer damage cost due to R E (k$/yr).
D t o t Total system damage cost due to all the reliability events (k$/yr).

References

  1. LaCommare, K.H.; Eto, J.H. Understanding the Cost of Power Interruptions to US Electricity Consumers; Lawrence Berkeley National Lab.(LBNL): Berkeley, CA, USA, 2004. [Google Scholar]
  2. Ortmeyer, T.H.; Reeves, J.A.; Hou, D.; McGrath, P. Evaluation of Sustained and Momentary Interruption Impacts in Reliability-Based Distribution System Design. IEEE Trans. Power Deliv. 2010, 25, 3133–3138. [Google Scholar] [CrossRef]
  3. Singh, C.; Gubbala, N.V. Reliability analysis of electric supply including standby generators and uninterruptible power supply system. In Proceedings of the Conference Record of the 1993 IEEE Industry Applications Conference Twenty-Eighth IAS Annual Meeting, Toronto, ON, Canada, 2–8 October 1993; pp. 1454–1460. [Google Scholar]
  4. Brown, R.; Ochoa, J. Impact of subcycle transfer switches on distribution system reliability. IEEE Trans. Power Syst. 2000, 15, 442–447. [Google Scholar] [CrossRef]
  5. Chang, C.; Yu, Z. Distributed Mitigation of Voltage Sag by Optimal Placement of Series Compensation Devices Based on Stochastic Assessment. IEEE Trans. Power Syst. 2004, 19, 788–795. [Google Scholar] [CrossRef]
  6. Chan, J.Y.; Milanović, J.V. Assessment of the Economic Value of Voltage Sag Mitigation Devices to Sensitive Industrial Plants. IEEE Trans. Power Deliv. 2015, 30, 2374–2382. [Google Scholar] [CrossRef]
  7. Macken, K.J.; Bollen, M.H.; Belmans, R.J. Mitigation of voltage dips through distributed generation systems. IEEE Trans. Ind. Appl. 2004, 40, 1686–1693. [Google Scholar] [CrossRef]
  8. Tamyurek, B.; Nichols, D.K.; Demirci, O. The NAS battery: A multifunction energy storage system. In Proceedings of the 2003 IEEE Power Engineering Society General Meeting (IEEE Cat. No. 03CH37491), Toronto, ON, Canada, 13–17 July 2003; Volume 4, pp. 1991–1996. [Google Scholar]
  9. Anwar, A.; Zhang, Y.; Brice, C.W.; Dougal, R.A. Soft Reclosing of an Industrial Power Network Using an Inverter-Controlled Energy-Storage System. IEEE Trans. Power Deliv. 2014, 29, 1111–1119. [Google Scholar] [CrossRef]
  10. Chen, C.; Wu, W.; Zhang, B.; Singh, C. An Analytical Adequacy Evaluation Method for Distribution Networks Considering Protection Strategies and Distributed Generators. IEEE Trans. Power Deliv. 2014, 30, 1392–1400. [Google Scholar] [CrossRef]
  11. Farzin, H.; Fotuhi-Firuzabad, M.; Moeini-Aghtaie, M. Role of Outage Management Strategy in Reliability Performance of Multi-Microgrid Distribution Systems. IEEE Trans. Power Syst. 2017, 33, 2359–2369. [Google Scholar] [CrossRef]
  12. Crossland, A.F.; Jones, D.; Wade, N.S.; Walker, S.L. Comparison of the Location and Rating of Energy Storage for Renewables Integration in Residential Low Voltage Networks with Overvoltage Constraints. Energies 2018, 11, 2041. [Google Scholar] [CrossRef]
  13. Adefarati, T.; Bansal, R.C. Reliability, economic and environmental analysis of a microgrid system in the presence of renewable energy resources. Appl. Energy 2019, 236, 1089–1114. [Google Scholar] [CrossRef]
  14. Cebrian, J.C.; Kagan, N.; Milanović, J.V. Probabilistic estimation of distribution network performance with respect to voltage sags and interruptions considering network protection setting—Part I: The methodology. IEEE Trans. Power Del. 2016, 33, 42–51. [Google Scholar] [CrossRef]
  15. Pregelj, A.; Begovic, M.; Rohatgi, A. Recloser Allocation for Improved Reliability of DG-Enhanced Distribution Networks. IEEE Trans. Power Syst. 2006, 21, 1442–1449. [Google Scholar] [CrossRef]
  16. Wang, P.; Billinton, R. Time sequential distribution system reliability worth analysis considering time varying load and cost models. IEEE Trans. Power Deliv. 1999, 14, 1046–1051. [Google Scholar] [CrossRef]
  17. Xie, K.; Zhou, J.; Billinton, R. Reliability evaluation algorithm for complex medium voltage electrical distribution networks based on the shortest path. IEEE Proc. - Gener. Transm. Distrib. 2003, 150, 686–690. [Google Scholar] [CrossRef]
  18. Cebrian, J.C.; Kagan, N. Hybrid Method to Assess Sensitive Process Interruption Costs Due to Faults in Electric Power Distribution Networks. IEEE Trans. Power Deliv. 2010, 25, 1686–1696. [Google Scholar] [CrossRef]
  19. Milanovic, J.V.; Gupta, C.P. Probabilistic Assessment of Financial Losses due to Interruptions and Voltage Sags—Part II: Practical Implementation. IEEE Trans. Power Deliv. 2006, 21, 925–932. [Google Scholar] [CrossRef]
  20. Liao, H.; Abdelrahman, S.; Guo, Y.; Milanovic, J.V. Identification of Weak Areas of Network Based on Exposure to Voltage Sags—Part II: Assessment of Network Performance Using Sag Severity Index. IEEE Trans. Power Deliv. 2014, 30, 2401–2409. [Google Scholar] [CrossRef]
  21. Gautam, P.; Wheeler, K.A.; Karki, R.; Faried, S.O. Impact of the penetration levels of PV and synchronous machine based DG sources on the reliability of a microgrid. In Proceedings of the 2017 IEEE Electrical Power and Energy Conference (EPEC), Saskatoon, SK, Canada, 22–25 October 2017; pp. 1–6. [Google Scholar]
  22. Martinez, J.A.; Martin-Arnedo, J. Voltage sag stochastic prediction using an electromagnetic transients program. IEEE Trans. Power Del. 2004, 19, 1975–1982. [Google Scholar] [CrossRef]
  23. Gautam, P.; Karki, R. Quantifying Reliability Contribution of an Energy Storage System to a Distribution System. In Proceedings of the 2018 IEEE Power & Energy Society General Meeting (PESGM), Portland, OR, USA, 5–9 August 2018; pp. 1–5. [Google Scholar]
  24. NREL Website. Available online: https://www.nrel.gov/nwtc/index.html (accessed on 2 August 2018).
  25. Ansari, O.A.; Safari, N.; Chung, C.Y. Reliability assessment of microgrid with renewable generation and prioritized loads. In Proceedings of the 2016 IEEE Green Energy and Systems Conference (IGSEC), Long Beach, CA, USA, 7 November 2016; pp. 1–6. [Google Scholar]
Figure 1. Distribution network for illustration purpose.
Applsci 09 04392 g001
Figure 2. (a) Probability distribution function (PDF) of sag duration; (b) Sag tolerance curve.
Applsci 09 04392 g002
Figure 3. Distributed energy resources (DERs)/microgrids integrated test distribution network.
Applsci 09 04392 g003
Figure 5. Improvement in the reliability profile of IL9 with ESS.
Applsci 09 04392 g005
Figure 6. Impact of (a) ESS state of charge; (b) the rated discharge duration on the unavailability of IL9.
Applsci 09 04392 g006
Figure 7. Impact of ESS hardware unavailability on the financial loss of IL9.
Applsci 09 04392 g007
Figure 8. System reliability performance with DERs/microgrids.
Applsci 09 04392 g008
Table 1. Sector customer damage function [16].
Sector TypeInterruption Duration (minutes)
12060240480
Industrial1.6253.8689.08525.1655.81
Commercial0.3812.9698.55231.3283.01
Residential0.0010.0930.4824.91415.69
Table 2. Resources of DERs/microgrids within segments/microgrids (MG).
SegmentsWind GeneratorPV ArraysESS
MG1, MG20.6 MW0.6 MW1.4 MW/9.8 MWhr
Seg3, Seg40.3 MW0.3 MW0.7 MW/4.9 MWhr
Table 3. Reliability improvement (%) of segments with DERs/microgrid operations.
Segments/MGFDSE (occ/cust-yr)FMI (occ/cust-yr)USI (hr/cust-yr)Dtot (k$/yr)
MG1Base case1.1265.0788.648135.866
Improvement (%)33.8521.6118.7519.72
Seg3Base case1.1163.2435.53115.619
Improvement (%)0−10.3430.3129.63

