1. Introduction
The subject of this article is a software expert system for the analysis of the electromagnetic compatibility (EMC) conditions on a ship as a tool to support the design, exploitation, and modernization of sea vessel equipment, especially in navy ships. This system can be used to analyze the EMC of not only a ship’s environment, but also other topological structures. This subject is very important in practice; however, for defense reasons, it is not widely described in the scientific and technical literature.
The idea of a topological description of the field interactions between electrical and electronic elements and systems was proposed by Tesche [
1]. This approach was developed by Baum [
2], Parmantier et al. [
3], and Agee et al. [
4]. The phrase “topological” means the type of spatial object; in this case, it characterizes the ship structure, especially the internal structure (below the deck). A ship’s construction is a complicated spatial structure with a specified number of electromagnetic (EM) shielding walls, such as decks, superstructures, compartments, and rooms through which EM disturbances penetrate and influence the functioning of the ship’s electrical and electronic devices. On the other hand, the shielding walls also perform useful functions, particularly in the protection of the ship’s steering systems and control networks against disturbances. To improve the EMC conditions, it is desirable to effectively lower the level of the disturbances that affect the electrical and electronic devices and systems, as well as the radiation from them [
5]. Another important problem to consider is the EM leak of information, which degrades the safety and security conditions of the ship’s information system [
6].
For many years, problems related to the state of the EMC conditions in a ship’s environment have been the subject of joint research conducted at the Gdansk University of Technology’s and at the R&D Marine Technology Centre in Gdynia (Poland) [
7].
The design of a ship’s internal structure and deployment of electrical and electronic devices is a complex problem due to the fact that the signals from these devices negatively influence each other’s operations. This is a very important problem to consider in naval ships. It is known that every ship contains different electrical, electronic, and radio devices, including electrical power equipment and transmitting antennas, that radiate EM fields (EM disturbances), which influence the operation and functionality of the electrical and electronic equipment. Moreover, naval ships have many command and steering systems composed of different electronic elements. Additionally, due to the complicated form of a ship’s structure, which consists of many EM shielding walls, investigations into the EMC conditions of the ship’s internal environment, i.e., under the main deck, is a very complex issue. Knowledge of the EMC condition state of a ship’s environment improves design procedures, exploitation efficiency, and modernization tasks in the ship. The proposed topological EMC model and its matrix description can be used to improve EMC analysis.
The described method for analyzing EMC conditions when designing the ship’s internal structure, the deployment of energy stations, radio communication and radio navigation equipment, and elements of the ship’s control systems has important utility. The described method also has use during the performance of modernization work on a ship’s equipment, e.g., installing new electronic systems that are necessary on the modern battlefield.
One novelty of this article is the use of a matrix calculus to describe the distribution of EM disturbances in a ship’s topological structure. Using such an approach to analyze the state of the EMC condition of the electrical and electronic systems and devices installed in such structures, an effective computational tool was developed for practical applications.
The problem outlined in this paper is based on the theory and practice of EM shielding, and takes into account applicable standards [
8,
9,
10,
11]. First, the topological model of a typical ship’s construction with the shielding planes is shown and the EM disturbance sources are classified. Next, the matrix description of the EMC model is formulated. The description of a general EMC scenario using the model is also presented. To verify the assumptions, the results of calculations and measurements obtained under in situ conditions are compared and analyzed. Finally, the practical usefulness of the topological model for investigations into the EMC conditions of a ship’s environment are summarized.
2. The Concept of an EMC Topological Model
It should be emphasized that the proposed model is intended for numerical calculations used in simulations of various interference scenarios reflecting situations occurring during ship’s operation. This involves calculating the effective RMS (Root Mean Square) value corresponding to the value measured with a broadband electric field meter at the indicated place on the ship. The value of the electromagnetic interference (e-m) is determined by the electrical component of this interference, which is expressed by Equations (1)–(5).
Estimating this value is very useful both in the initial design analyses and also in the specific operating conditions of the ship. The sources of this interference are usually radiocommunication and radiolocation transmitters, as well as intentional e-m signals coming from different sources. This makes it possible to predict threats to the ship’s operation devices resulting from such disturbances and, on this basis, to protect these devices using appropriate shielding and/or appropriate locations in the ship’s structure. The most susceptible systems to such disturbances are automatic ship command systems, especially certain elements of this system, e.g., the torpedo tube control subsystem. For obvious reasons, the details of this are not the subject of the reviewed article. For this reason, the topological model presented in the article as described by matrix equations was presented at a high level of generality when expressing the idea of these calculations. In these simulations, only the attenuation of the ship’s walls and attenuation in the spaces between these walls were taken into account, which are described in detail below (p. 2.2).
In addition, the applied description of the propagation of interference from their sources to the indicated place on the ship was not rigorous; it was not based on a vector description and was not of a waveform nature. This approach would be virtually impossible in such dynamic conditions on the ship.
2.1. A Ship’s EMC Topological Structure
As already mentioned, a typical ship structure consists of a specified number of shielding walls, i.e., shielding planes, that influence the EM disturbance distribution. A disturbance interaction of an EM signal is related to its electrical component E, i.e., the electrical field strength. In practice, the disturbance distribution is described by effective values of the electrical component E of the propagating EM field, which mainly depends on the localization and value of its source and the properties of the shielding planes. The arrangement of the shielding planes results from the ship’s internal structure.
Figure 1 shows a ship’s general topological structure, where:
EuT is the equipment under test that is affected by all existing disturbing signals;
Sp is the p-th shielding plane, such as a deck or walls, and ;
is the m-th internal (i.e., under the main deck) EM field source (disturbance source) that radiates the disturbing signal, where ;
is the j-th external (i.e., above the main deck) EM field source (disturbance source) that radiates the disturbing signal, where ; and
is the k-th extraneous external EM field source (disturbance source) that radiates the disturbing signal from another ship or aircraft, where .
Using the above-presented topological structure of a ship’s environment, the value of the total disturbing signal at a given equipment under test (EuT) device, taking into account the arrangement of the signal sources and the location of particular shielding planes, can be calculated. An effective value
of the total disturbing signal at the selected
l-th EuT can be calculated in the following way, due to the resultant disturbing signals that are radiated by transmitting antennas, with other sources of disturbing signals being classified into three groups, namely, internal, external, and extraneous external, i.e.,
in which
is the resultant value of the sum of the ship’s own internal disturbing signals, which equals
is the resultant value of the sum of the ship’s own external disturbing signals, which equals
is the resultant value of the sum of extraneous external disturbing signals, which equals
Equations (1)–(4) describe the summation of disturbing signals, which indicate the measured effective scalar quantities; these powers are expressed by squares of electric field strength of the electromagnetic signal.
As can be seen, the disturbing signal values depend on their source values, the space attenuation of the disturbing signals along the paths between their sources and the EuT’s location, and the attenuation of the shielding planes that are located on the propagation paths of the disturbance signals.
Otherwise, the total value of does not exceed its accepted (limited) value of , ensuring the correct operation of the l-th EuT, i.e.,
Verification of Equation (5) is one of the main goals of EMC analysis. This requires calculating the abovementioned sums of the disturbing signals, i.e., , , and , for which the topological model of the ship’s EMC environment is proposed. However, if the total value of the disturbing signals at the EuT device exceeds the threshold value , an additional shielding cover to suppress the disturbing signals should be used.
2.2. The Matrix Description of the EMC Topological Model
Considering the topological model of a ship’s structure, we can determine the effective value of
—the resultant EM disturbance that influences the operation of the selected
l-th EuT—as presented in
Figure 1 and described by Equation (1). The value of the first component
in Equation (1), i.e., the components
in Equation (2), where
, can be calculated by solving the following matrix equation:
in which
is a diagonal matrix of the activation coefficients of the ship’s own internal disturbance sources, which can be used to activate the selected sources of the disturbing signals in simulation investigations, i.e., the matrix has the following form:
where
is the value of the
m-th source’s disturbing signal;
Path of the ship’s own internal disturbing signals, which has the following form:
where
where
is the attenuation value of the
p-th shielding plane for the frequency of the
m-th internal disturbing signal
.
The attenuation
of a shielding plane (wall) depends on the disturbing signal’s frequency
f, the shielding material’s thickness
h, and its kind, i.e., its conductivity
and relative magnetic permeability
. In practice, the attenuation value is calculated or measured at the given frequencies [
13]. The results of this can be recorded in matrix form, i.e.,
.
The values of the other components included in Equation (1), i.e.,
and
, should be calculated in a similar way to (6)–(12), i.e.,
in which
is a diagonal matrix of the activation coefficients of the ship’s own external disturbing sources, which has the same role as and a similar form to Equation (7);
is a vector of the source values of the ship’s own external disturbing signals, which has a similar form to Equation (8);
is a matrix of the presence coefficients of the shielding planes on the propagation path of the ship’s own internal disturbing signals, which has a similar form to Equation (9);
is a matrix of the loss (attenuation) values of the ship’s own external disturbing signals when passing through the shielding planes, which has a similar form to Equation (11);
is a vector of the space attenuation values of the disturbing signals along their propagation path from sources to the EuT, which has a similar form to Equation (12) and
is a diagonal matrix of the activation coefficients of the extraneous external disturbing sources, which has the same role as and a similar form to Equation (7);
is a vector of the source values of the extraneous external disturbing signals, which has a similar form to Equation (8);
is a matrix of the presence coefficients of the shielding planes on the path of the extraneous external disturbing signals, which has the same form as Equation (9);
is a matrix of the loss (attenuation) values of the extraneous external disturbing signals when passing through the shielding planes, which has a similar form to Equation (11);
is a vector of the space attenuation values of the extraneous external disturbing signals along their propagation path from sources to the EuT, which has a similar form to Equation (12).
The above also require knowledge of the remaining vectors and matrices, i.e., , , , , , , , , , and , which can be formulated in the above-described way.
3. Description of the General EMC Topological Model
3.1. General Scenario
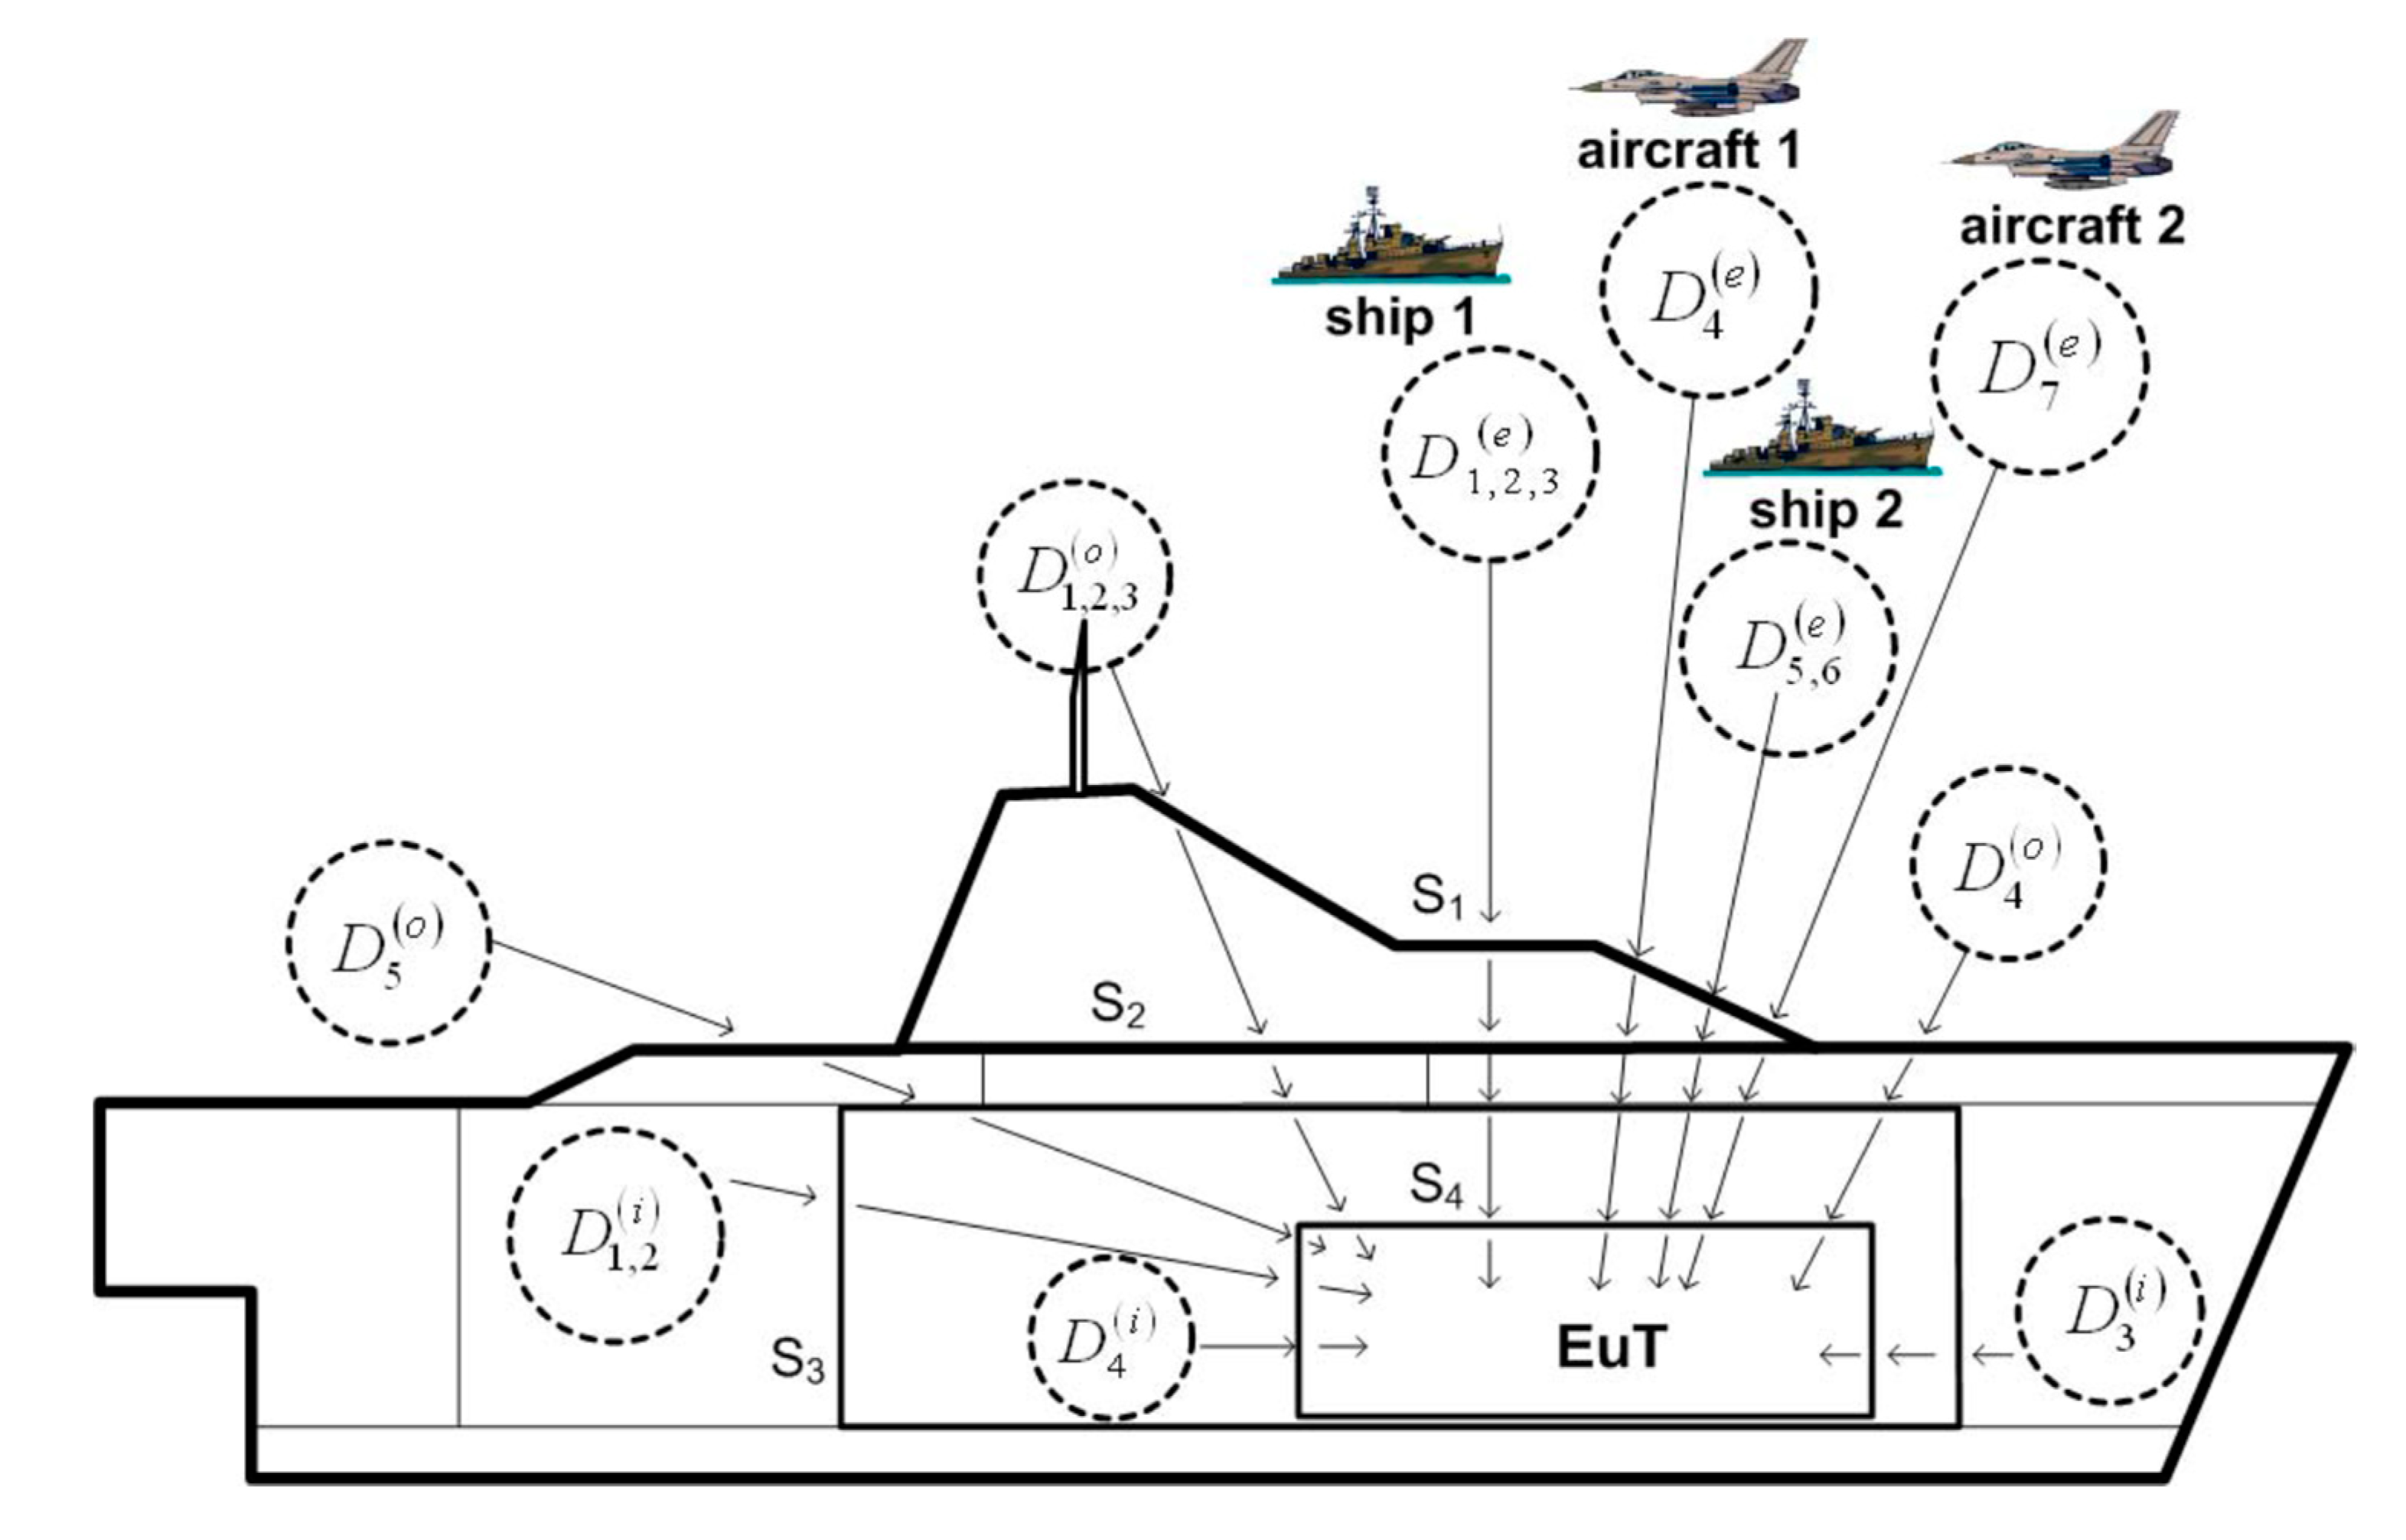
A practical application of the described EMC topological model is presented in the general scenario illustrated in
Figure 2, where the ship’s structure consists of four shielding planes
and the given EuT is located in a cabin (shielding plane
). Four internal disturbing signals, five external disturbing signals, and seven extraneous external disturbing signals radiate from their sources
, and
, and have an influence on the operation of the EuT.
These disturbing signals can be characterized as follows.
Firstly, the ship’s own internal disturbance sources are:
- -
, the ship’s power station, which radiates the disturbing signal , propagating to the EuT via shielding planes and ;
- -
, the ship’s power system, which radiates the disturbing signal , propagating to the EuT via shielding planes and ;
- -
, the ship’s passive defense system, which radiates the disturbing signal , propagating to the EuT also via shielding planes and ;
- -
, the ship’s radio station, which radiates the disturbing signal , propagating to the EuT only via shielding plane .
Secondly, the ship’s own external disturbance sources are:
- -
, the ship’s navigation radar antenna, which radiates the disturbing signal , propagating to the EuT via all shielding planes;
- -
, the ship’s combat radar antenna, which radiates the disturbing signal , propagating to the EuT via all shielding planes;
- -
, the ship’s high-frequency (HF) radio station transmitting antenna, which radiates the disturbing signal , propagating to the EuT via all shielding planes;
- -
, the ship’s active defense system, which radiates the disturbing signal , propagating to the EuT via shielding planes , and ; and
- -
, the ship’s helicopter, which radiates the disturbance signal , propagating to the EuT also via shielding planes , , and .
Thirdly, the extraneous disturbance sources are:
- -
, the transmitting antenna of the combat radar equipment for the first extraneous ship, which radiates the disturbing signal , propagating to the EuT via all shielding planes;
- -
, the navigation radar antenna of the first extraneous ship, which radiates the disturbing signal , propagating to the EuT via all shielding planes;
- -
, the transmitting antenna of the very-high-frequency (VHF) radio station of the first extraneous ship, which radiates the disturbing signal , propagating to the EuT via all shielding planes;
- -
, the transmitting antenna of the ultra-high-frequency (UHF)/VHF station of the first extraneous combat aircraft, which radiates the disturbing signal , propagating to the EuT via all shielding planes;
- -
, the navigation radar antenna of the second extraneous ship, which radiates the disturbing signal , propagating to the EuT via all shielding planes;
- -
, the transmitting antenna of the navigation radar equipment of the second extraneous ship, which radiates the disturbing signal , propagating to the EuT via all shielding planes;
- -
, the transmitting antenna of the navigation radar equipment of the second extraneous combat aircraft, which radiates the disturbing signal , propagating to the EuT via all shielding planes.
The method for preparing the contents of the matrices and vectors in Equation (6), Equation (13), and Equation (14) for the scenario shown in
Figure 2 is presented in
Section 3.2.
3.2. Description of the Topological Matrix
As already mentioned, the main subject of EMC condition investigations of a ship’s environment during its design and exploitation in practice involves determining the resultant value of the disturbing signal, as seen in Equation (1), at the selected EuT device. As shown in
Figure 2, the resultant disturbance is the sum of three classes of disturbances, i.e., internal, external, and extraneous disturbances. Each group consists of a specified number of disturbing signals. The internal group contains four disturbing signals, the external group contains five disturbing signals, and the extraneous group contains seven disturbing signals, i.e.,
,
, and
, respectively. To calculate the resultant value in Equation (1) of the total disturbing signal
at the selected
l-th EuT, the values of Equations (2)–(4), i.e.,
,
, and
, are calculated. Thus, it is necessary to have knowledge of the vectors and matrices in Equations (6)–(14), which are adequate for the scenario in
Figure 2.
Firstly, the vectors and matrices of
in Equation (6) for the scenario are of the following forms:
Secondly, the vectors and matrices of
in Equation (13) are of the following forms:
Thirdly, the vectors and matrices of
in Equation (14) have the following forms:
Taking into account the above matrix description, the
input data is divided into two groups. The first group characterizing the phenomenon of the analyzed disturbances consists of the
basic data contained in Equation (11) and Equation (12), and in further parts of the article in Equations (16), (18), (19), (21), (23), (24), (26), (28), and (29). Effective values of the interference field (measured or calculated or adopted for simulation) are observed in Equations (16), (21), and (26), and wall attenuation factors (calculated, measured, or adopted for simulation based on the manufacturer’s descriptions) are in Equations (18), (23), and (28). The attenuation factor of the space between the place where the source of the disturbance was determined and the point of impact of this disturbance (usually measured in accordance with the requirements described in [
14]) is shown in Equations (19), (24), and (29). The second group consists of the
control data contained in Equation (7) and Equation (9), and in further parts of the article in Equations (15), (17), (20), (22), (25), and (27).
Control data expressing the contribution of individual sources of interference in the attenuation process according to the classification is adopted in Equation (1), according to the division into
internal disturbing signals, external disturbing signals, and
extraneous disturbing signals, which are included respectively in Equations (15), (20), and (25). The
Control data expressing the ratio of individual walls of the ship structure in the attenuation process, also according to the above classification, are included respectively in Equations (17), (22), and (27).
The calculated output data from Equations (6), (13), and (14) are used to calculate the final RMS value using Equation (1).
4. Verification of the Measurements from the EMC Topological Model
In this section, the practical verification of the described EMC topological matrix model is analyzed. The verification was made in situ (in an actual ship’s environment) as an example of the possibility of testing a real-life scenario, as shown in
Figure 3 [
14].
In this scenario, the EuT is located in a subspace (the radio station room) surrounded by shielding plane and disturbed by four EM signals, which are as follows:
is the ship’s own internal disturbing signal, at a frequency of 29.5 MHz, from a radio amplifier surrounded by the shielding plane , which is situated under the main deck in the radio station room. The signal propagates to the EuT only via this plane;
is the first external disturbing signal, which propagates at a frequency of 2 MHz from the transmitting antenna, and is situated above the main deck to the EuT via shielding planes and ;
is the second external disturbing signal, which propagates at a frequency of 3025 MHz from the navigation radar antenna to the EuT in a similar way as above, via the shielding planes and ;
is the third external disturbing signal, which propagates at a frequency of 9325 MHz from the navigation radar antenna to the EuT in a similar way as above, also via the shielding planes and .
At first, a theoretical EMC investigation of this scenario by applying the EMC topological model is performed. This requires a calculation of the effective value of the total disturbing signal at the EuT by using Equation (1). Consequently, this requires calculation of both resultant values of the internal and the external disturbing signals, i.e., and , respectively, using Equation (2) and Equation (3). In turn, this requires calculation of the components of these signals, i.e., , , , and , by solving Equation (6) and Equation (13).
For this, we need to know:
the source values of these signals, i.e., , , , and ;
the attenuation values of the shielding planes, i.e., , , , , , , and ;
the attenuation values of the disturbing signals in space, i.e., , , , and .
The values of the source’s disturbing signals were measured during activation of the mentioned sources of EM disturbances. These values were as follows: , , , and .
The attenuation characteristics of the shielding planes (walls),
, and
, with the points of the attenuation values
of the specified shielding planes for the selected frequencies of the marked disturbing signals, are presented in
Figure 4. These characteristics are measured for perpendicular orientation of the measuring signal trajectory relative to the plane of the shielding surface.
The in situ verification tests included measurements of elements of Equation (6) and Equation (13), which are expressed respectively by Equation (30) and Equation (31).
The total values of the attenuation of the disturbing signals in the space between their sources and the EuT, taking into account the subspaces between the shielding planes, are calculated. These values are as follows: , due to the space’s short distance, and , due to the space’s total distance, which was equal to 4.5 m.
Taking into account the above, for the scenario presented in
Figure 3, the resultant value of the internal disturbing signal
, as seen in Equation (2), at the EuT has the one component, i.e.,
where
.
The values of the components of the external disturbing signal
, as seen in Equation (3), can be calculated by (13), which has the following form:
Practically, the best way to verify the correctness of the EMC topological model is to compare the values of the disturbing signals at the EuT, i.e., , , , and , which can be calculated by using the model to measure their values using a spectrum analyzer.
The theoretical values calculated by the EMC topological model and the values in situ measured using a spectrum analyzer of all the disturbing signals at the EuT are compared and expressed in
Figure 5, where the lines show the values measured by the spectrum analyzer and the circles show the values calculated by using the described topological model.
For practical reasons, the obtained number of test results is small due to the limited number of measurements on an operating navy ship. However the results of these measurements are unique on a global scale. The smallest difference between the calculated (25 dBμV/m) and measured (24 dBμV/m) values of the same disturbing signal, i.e., () at the EuT, is 0.9 dB, or 3.7%. These results are acceptable. However, the largest difference between the calculated (29.5 dBμV/m) and measured (36.5 dBμV/m) values of the same signal, i.e., () at the EuT, is 7 dB, or 19%, which is relatively high.
Such a discrepancy in the results is influenced by the complexity and tightness of the ship’s construction. However, simulation studies using this model allow us to analyze variations in the location of a ship’s devices and systems that are sensitive to EM disturbances. This allows us to develop an optimal solution in this respect. Often, it is not important to accurately determine the value of a disturbing signal at the selected location of the EuT, but the identification of where this signal will potentially be the smallest allows us to determine the best EuT location. Due to time and cost constraints, such an approach is the only one that is acceptable in the practice of a ship’s exploitation or the rebuilding of a ship’s electrical and electronic equipment.
Summarizing the results of the comparison and taking into account practical aspects, especially the complex character of EMC investigations, we conclude that the EMC topology model is useful for practical applications, particularly when designing studies regarding the optimal locations for a ship’s electrical and electronic equipment.
5. Conclusions
This article considered the problem of analysis of the electromagnetic compatibility in a ship’s environment. This problem is important to consider and has an impact on people’s safety and the ship’s operation. Currently, techniques and ship technologies are characterized by the use of complex systems and electronic devices, including radio communication and radio navigation systems. The electronic systems and devices for automatic control of the ship’s functions are particularly sensitive in this respect. Usually, they operate at relatively low energy levels and are sensitive to electromagnetic disturbances.
In this paper, the problem concerning EM interactions between electrical and electronic devices in a naval ship’s environment are analyzed. These devices radiate EM fields that have a mutual influence on their operation, thereby disturbing their operation properties. This problem is important to consider because it is vital that these devices work effectively. The described method has important utility for analyzing EMC conditions when designing a ship’s internal structure, the deployment of energetic equipment and radio and navigation devices, and electronic elements of the ship’s control systems.
To analyze and solve the problem, a new computational model in the form of a matrix equation set is proposed. In the model, the ship’s internal structure (under the main deck) and the locations of the sources of disturbing signals are taken into account. The ship’s topological structure and its EMC topological model are described. Classification of the disturbing signals in a real naval ship scenario is shown.
An example application of the matrix description and verification of the measurements in an in situ naval ship scenario are also presented. This verification confirms the usefulness of the proposed model in the design and exploitation of naval ship operations. For example, this helps to determine the kind of shielding planes (walls) that can be applied to effectively protect electrical and electronic ship devices against EM disturbances. It can be applied to the modernization of a ship structure’s exploitation to obtain better EMC conditions, and also to improve the safe functioning of electrical and electronic equipment.
Moreover, the described topological matrix EMC model can be used in simulation investigations of extraneous EM disturbances.
