Article

Monitoring of Fatigue Crack Propagation by Damage Index of Ultrasonic Guided Waves Calculated by Various Acoustic Features

School of Aerospace Engineering, Xiamen University, Xiamen 361005, China
*
Authors to whom correspondence should be addressed.
Appl. Sci. 2019, 9(20), 4254; https://doi.org/10.3390/app9204254
Submission received: 18 September 2019 / Revised: 1 October 2019 / Accepted: 3 October 2019 / Published: 11 October 2019
(This article belongs to the Special Issue Fracture and Fatigue Assessments of Structural Components)

Abstract

:
Under cyclic and repetitive loads, fatigue cracks can be further propagated to a crucial level by accumulation, causing detrimental effects to structural integrity and potentially resulting in catastrophic consequences. Therefore, there is a demand to develop a reliable technique to monitor fatigue cracks quantitatively at an early stage. The objective of this paper is to characterize the propagation of fatigue cracks using the damage index (DI) calculated by various acoustic features of ultrasonic guided waves. A hybrid DI scheme for monitoring fatigue crack propagation is proposed using the linear fusion of damage indices (DIs) and differential fusion of DIs. An experiment is conducted on an SMA490BW steel plate-like structure to verify the proposed hybrid DIs scheme. The experimental results show that the hybrid DIs from various acoustic features can be used to quantitatively characterize the propagation of fatigue cracks, respectively. It is found that the fused DIs calculated by the acoustic features in the frequency domain have an improved reliable manner over those of the time domain. It is also clear that the linear and differential amplitude fusion DIs in the frequency domain are more promising to indicate the propagation of fatigue cracks quantitatively than other fused ones.

1. Introduction

Fatigue cracks, which originate from a damaged precursor at an imperceptible level under repetitive loading, is one of the cardinal reasons for the failure of metallic structures. It is reported that up to 90% of the failures of in-service metallic structures are typically caused by fatigue cracks [1], and the formation of an initial fatigue crack does not necessarily result in immediate failure for the real-world structure [2]. Under cyclic loads, fatigue cracks at the scale of a few micrometers are then accumulated into microcracks by accumulation, which can deteriorate continuously and eventually amalgamate to form macrocracks [3,4]. Under repetitive loads, the macrocracks can be further propagated to a crucial level at an amazing rate without sufficient warning, causing detrimental effects on structural integrity and potentially resulting in catastrophic consequences [5]. Therefore, the early perception of small-scale fatigue cracks has become a critical measure to ensure the durability, reliability, and integrity of engineering structures [6,7].
The majority of current guided wave-based non-destructive testing (NDT) and structural health monitoring (SHM) techniques [3,8,9,10,11,12,13] have been proposed for monitoring crack propagation in different engineering structures, which exploit the variations from temporal features associated with baseline signals. More research studies of temporal signal features primarily focus on the magnitude-based and energy-based signals [14,15], wave reflections or transmissions [16,17], energy dissipation [18], and mode conversions [19]. Meanwhile, acoustic emission (AE) technology is widely used for continuously monitoring fatigue cracks, and AE-based fatigue crack evaluation techniques are exploited based on counting the number of signals allured by crack propagation [20,21]. The scattering and attenuation of ultrasonic guided waves caused by fatigue cracks are applied to quantify the cracks’ growth [22,23,24]. Although most approaches of temporal features have the capacity to locate fatigue cracks, characterizing the orientation and size of fatigue cracks accurately still remains an extremely challenging task [25], because small-scale fatigue cracks can lead to a feeble signal difference for the damage-scattered waves in the time domain. Therefore, signal features processing and analysis associated with the frequency domain are then extracted to characterize the fatigue crack propagation, because the signal features in the frequency domain are more stable, accurate, and recognizable than those of the temporal domain.
The ultrasonic guided waves methods based on damage indices (DIs) have become research hotspots in the field of damage detection over the years, which aim to highlight the variations of structural fatigue cracks. The accuracy and effectiveness of the techniques substantially rely on the means of the defined DI at each path [25], thus, there is an increasing interest in introducing DI for guided wave-based SHM [26]. Based on linear (time of flight (TOF) and energy) and nonlinear temporal features of guided waves, damage indices (DIs) are respectively constructed, which are used to locate fatigue damage near a rivet hole of an aluminum plate [3,9,25]. Moreover, the synthetic DI methods are easily interpretable, which can intuitively reflect the overall health status in the inspected structure. A hybrid DI characterization scheme for ultrasonic guided waves is developed and experimentally validated in aluminum plate specimens, which can be used to evaluate the statistical distribution of fatigue cracks under uncertainties and update the prognosis results. However, according to the aforementioned literature survey, damage indices are used to locate cracks and identify the existence of multi-scale cracks in practice [25]. The crack growth is a gradually patulous process, the ultrasonic guided waves DI approach has been rarely employed to characterize the crack propagation quantitatively. In addition, a hybrid DI scheme is proposed that is associated with various acoustic features, which can be used to indicate the fatigue crack propagation quantitatively by experimental validation. This is deemed as an improvement to characterize crack growth in current monitoring studies. Although it is a highly challenging assignment in perceiving small-scale fatigue cracks, it is also of vital importance for continuously monitoring the crack propagation [10].
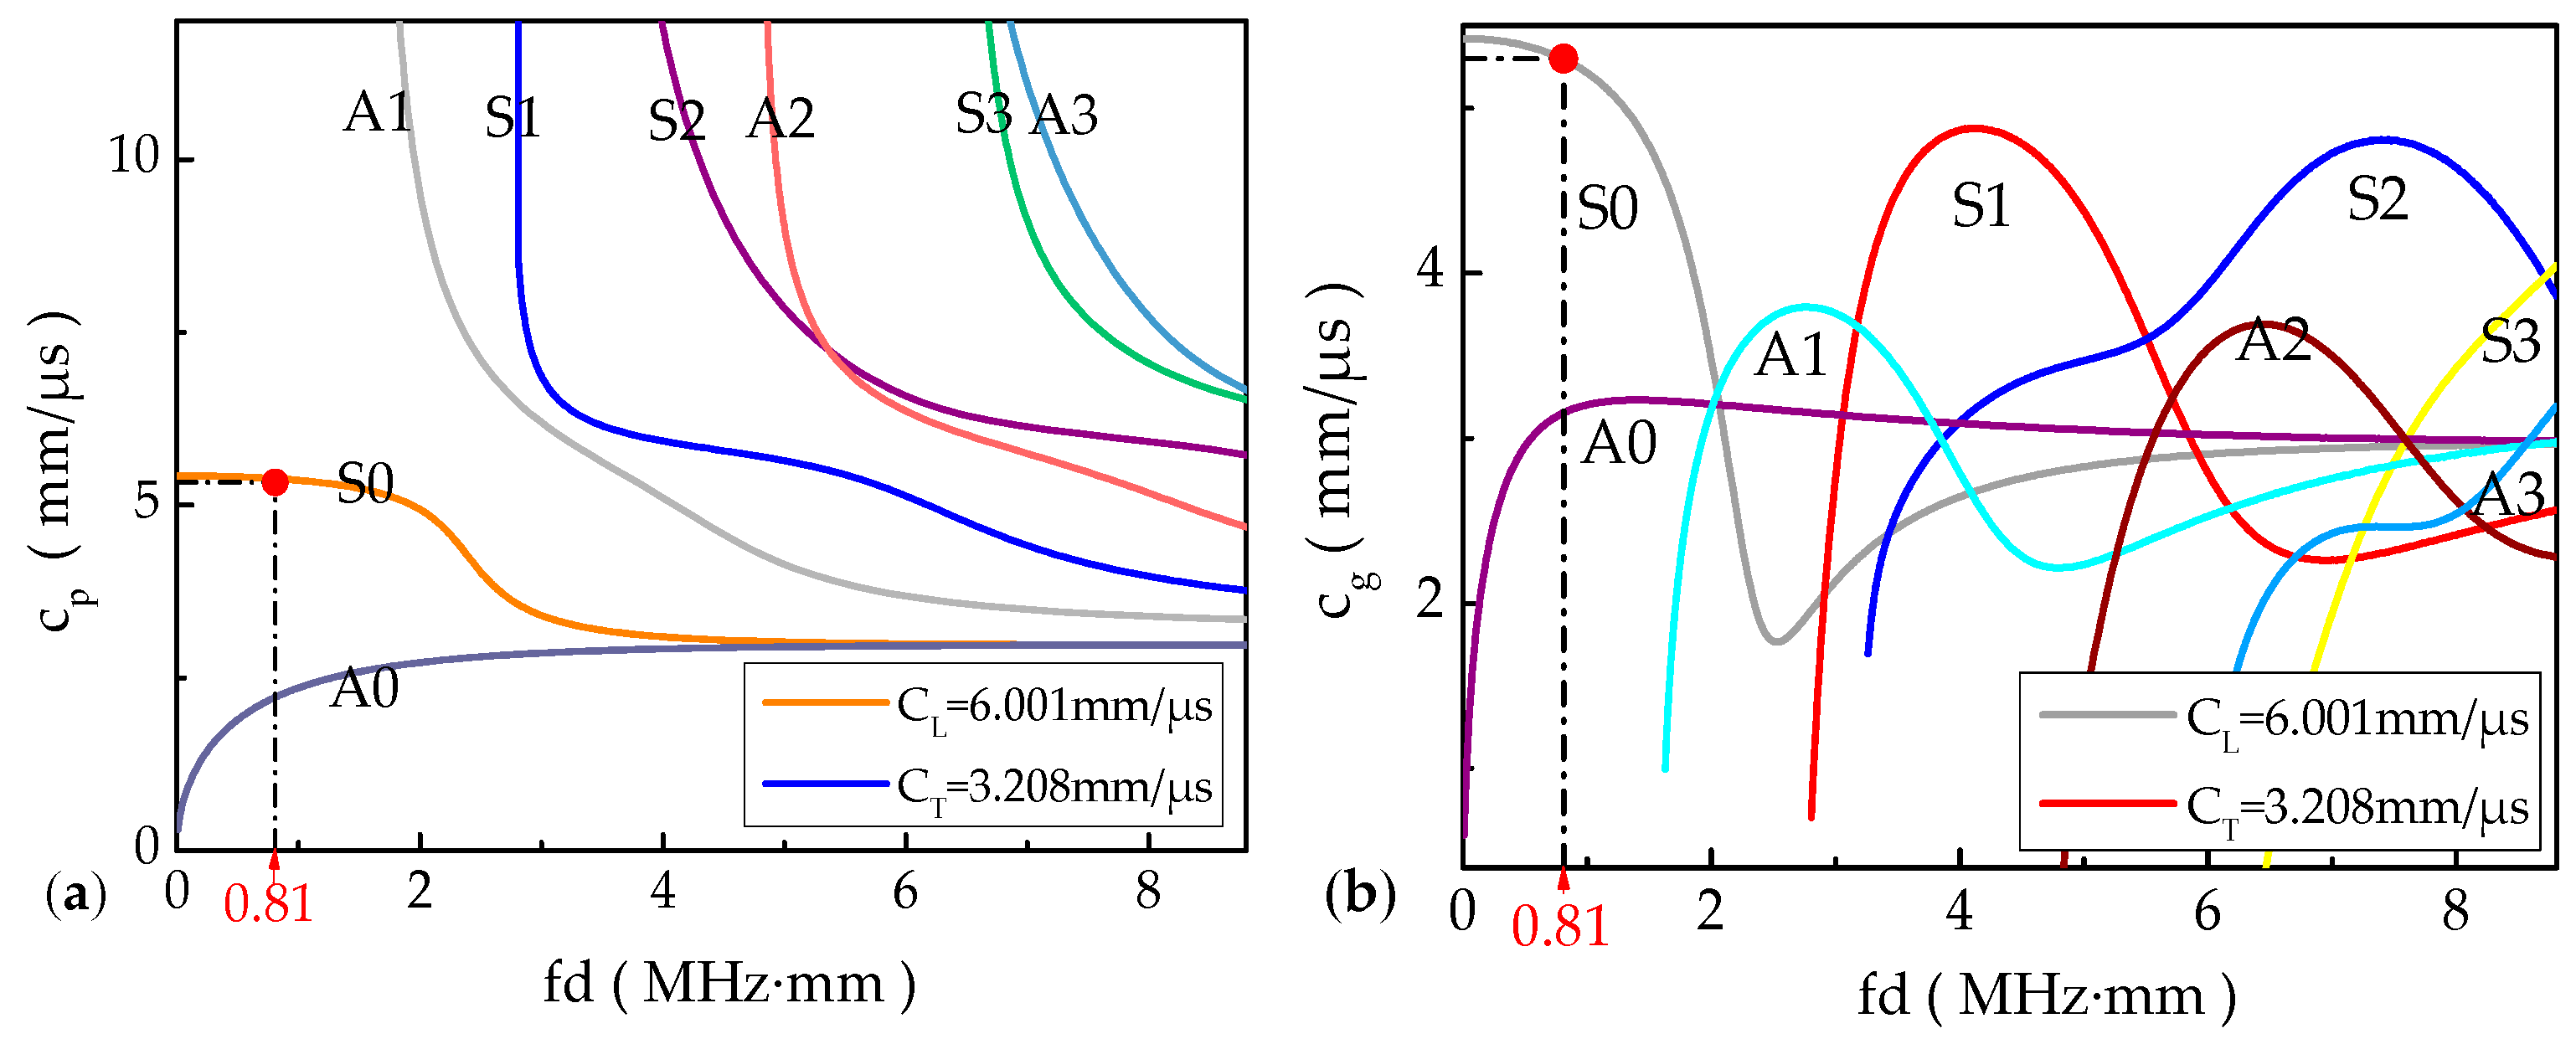
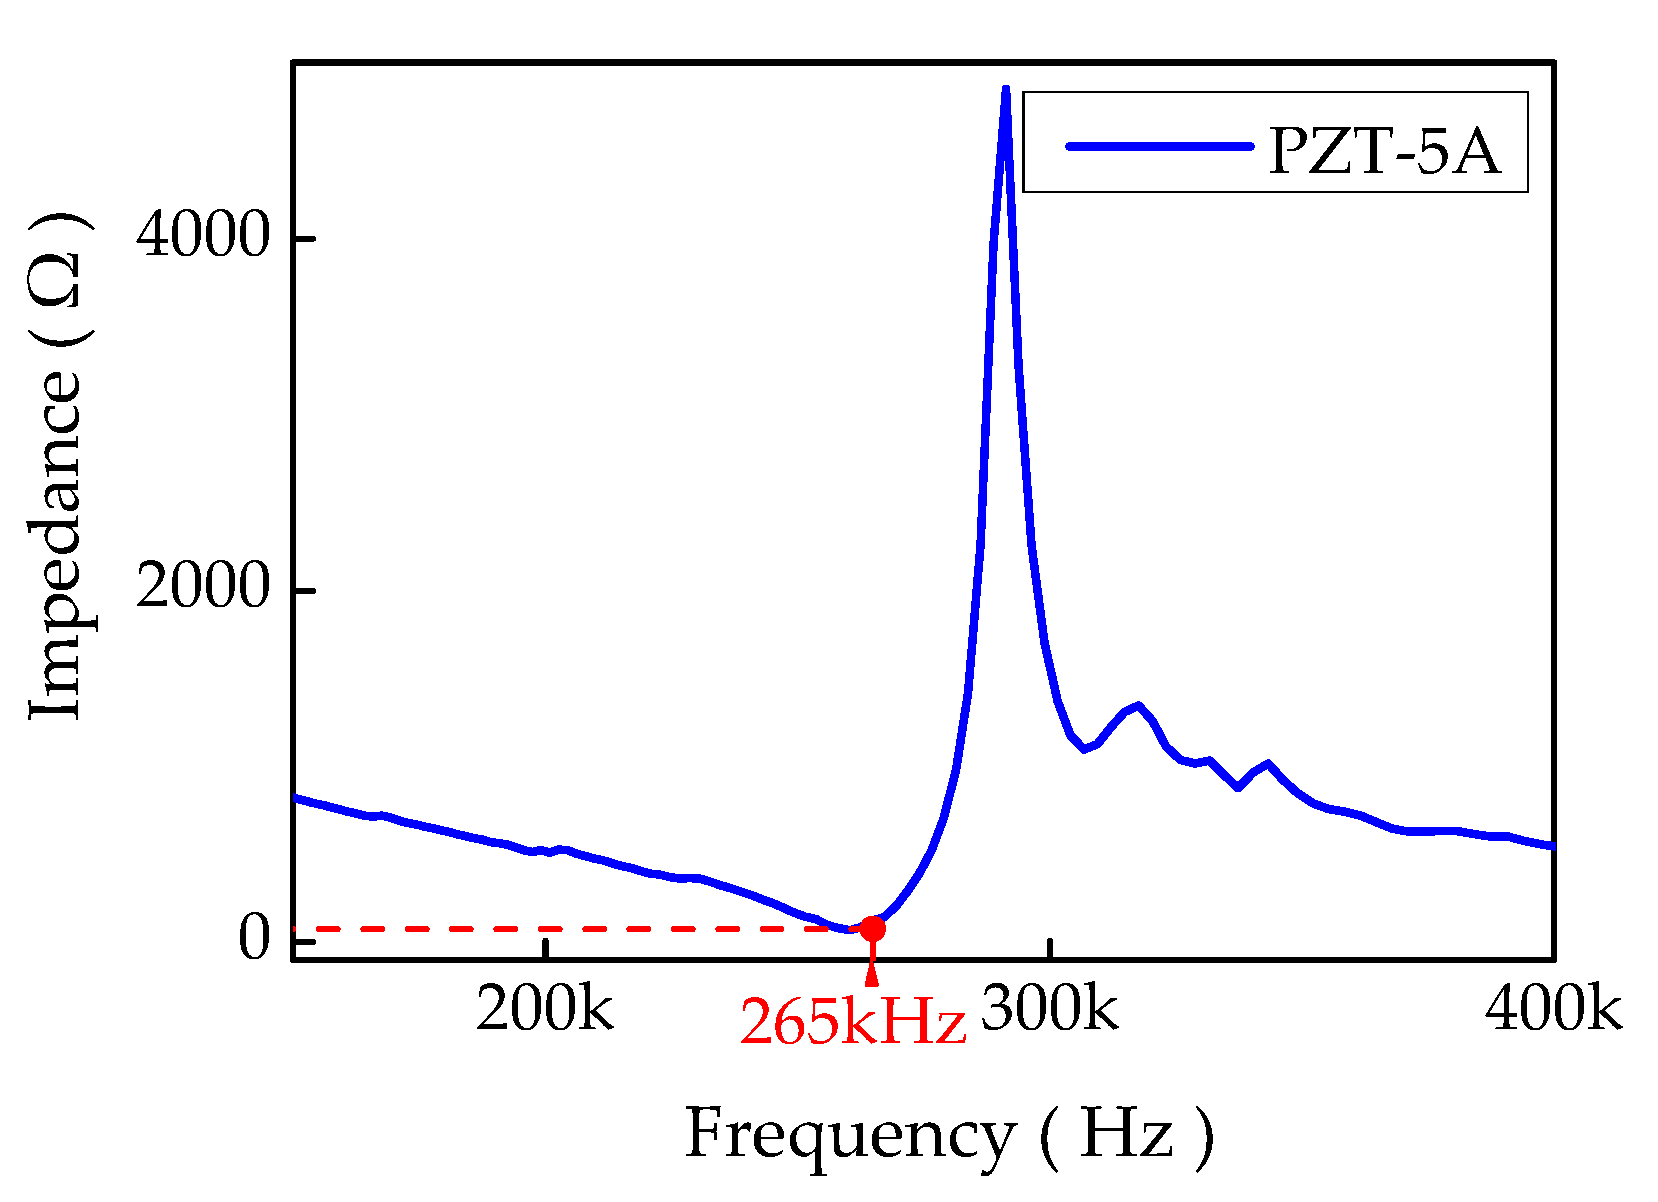
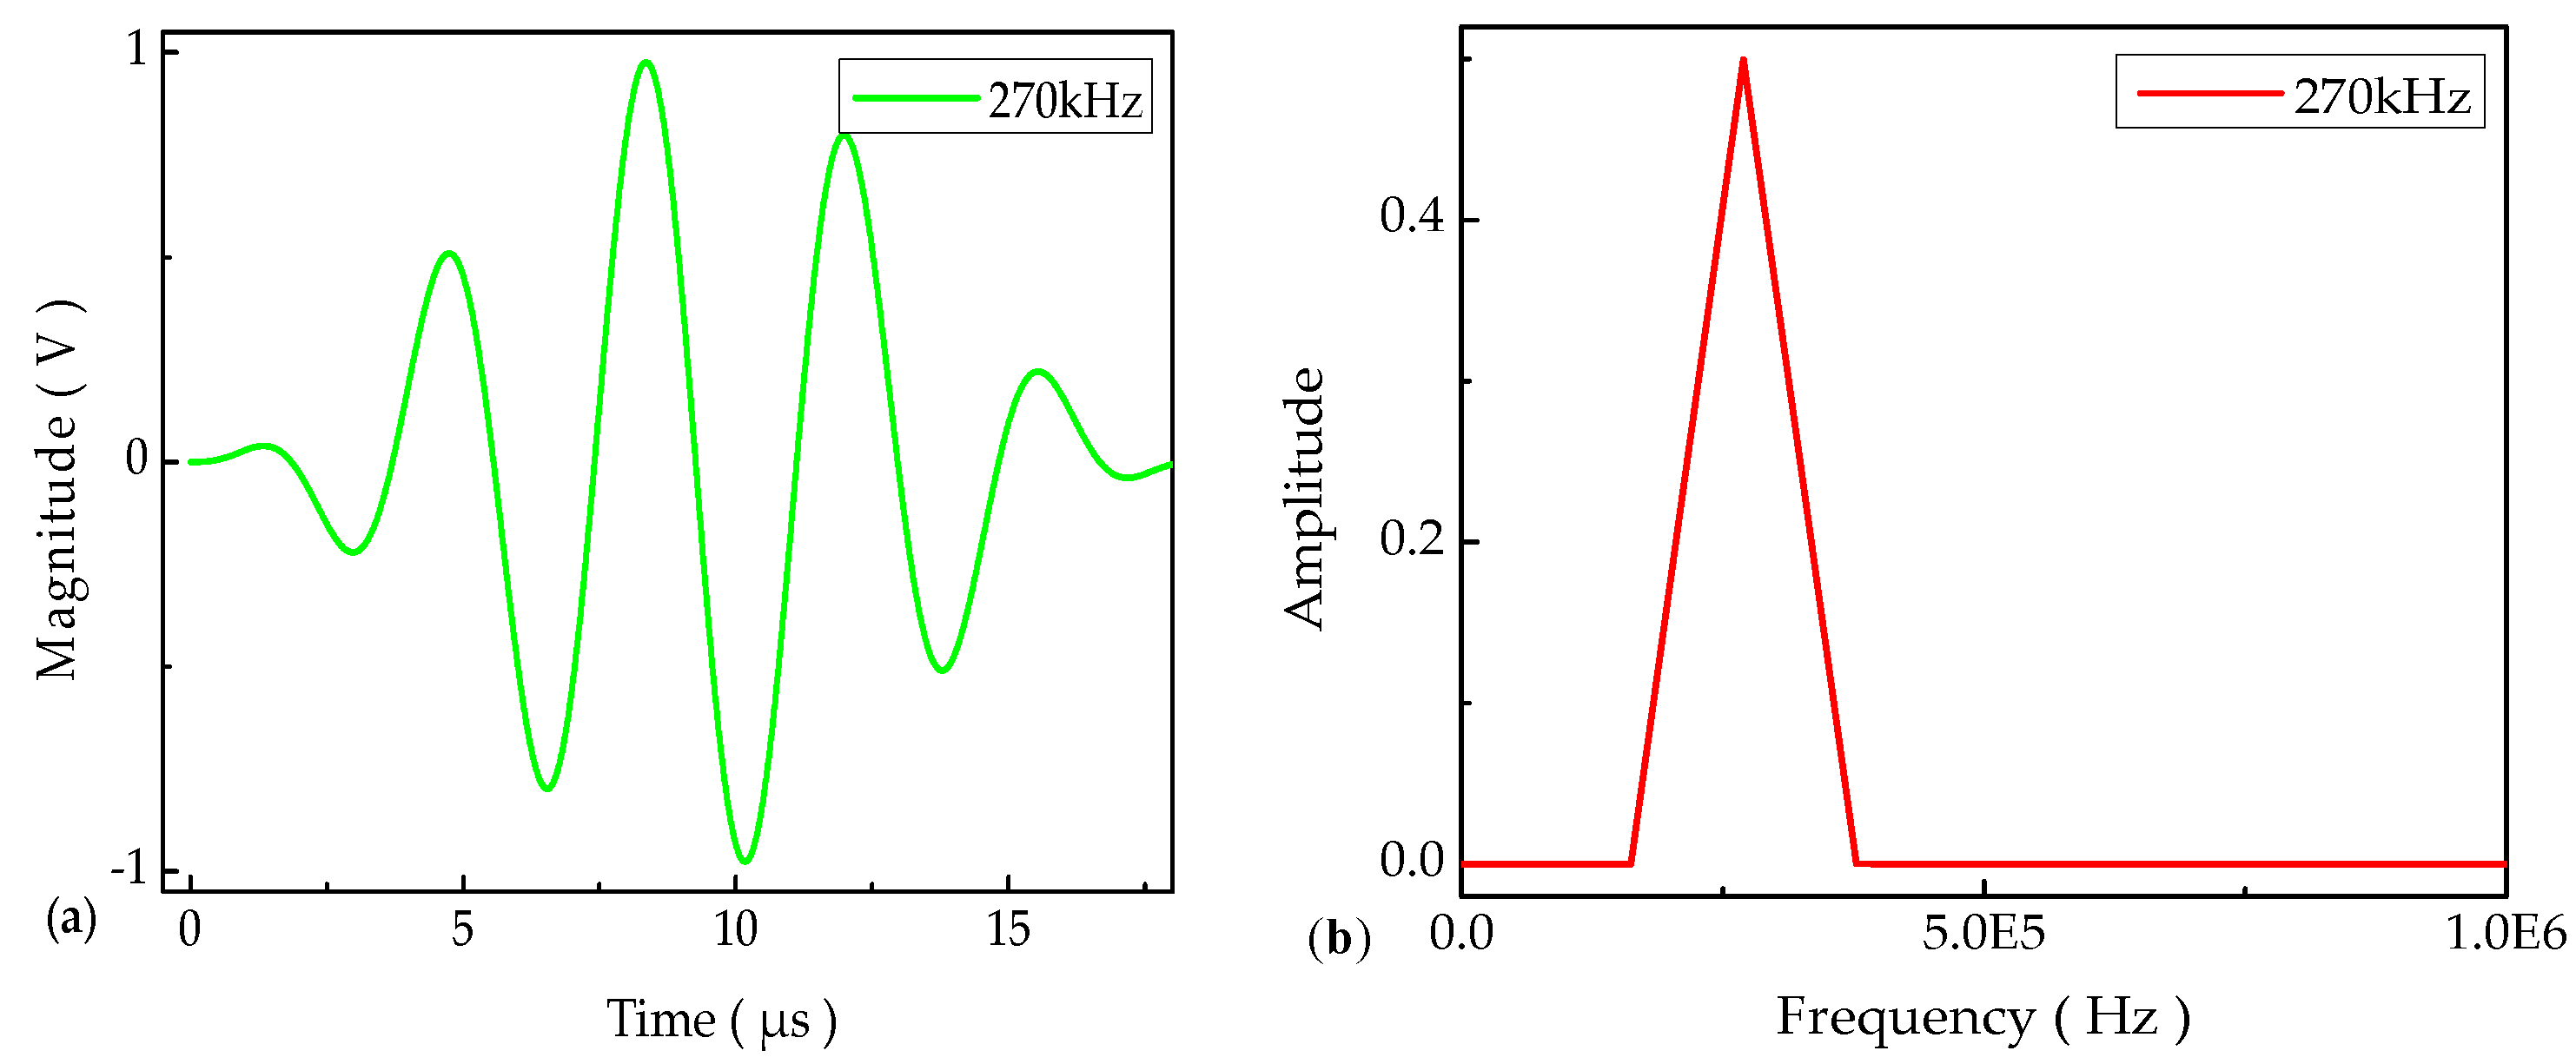
The objective of this paper is to propose a technique to monitor the fatigue crack propagation in an SMA490BW steel plate-like structure. Ultrasonic guided waves DIs calculated by various acoustic features are used to track the crack propagation. The features of crack characterization are firstly expressed by magnitude/amplitude-based and energy-based DIs extracted from time-frequency domain signals. Based on the DI weights of each actuator–sensor path, a hybrid fusion scheme is then proposed to fuse all the available DIs of each path. Subsequently, an experimental setup of an active sensor network with a sparse transducer configuration is used for actuating and sensing guided waves. Finally, the different synthetic fusion DI algorithms of the S0 guided waves mode are calculated to emphatically characterize the crack propagation and destruction level of an in-service metallic structure.

2. Fundamental Theory

2.1. Propagation of Ultrasonic Guided Waves in SMA490BW Steel Plate

Figure 1 illustrates the dispersion curves of ultrasonic guided waves in an SMA490BW steel plate, which is calculated using DISPERSER®. Generally, the phase velocity and group velocity of the propagating guided waves are respectively described by Cp and Cg. The phase velocity is the speed of a particle moving at a specific frequency. The group velocity is the disseminated speed of all wave packets [27]. The phase velocity Cp has the relationship with the wavelength λ guided   wave and frequency f, as shown in Equation (1).
C p = f λ guided   wave
Since the selected excitation frequency of guided waves is 270 kHz, the uniform thickness of the SMA490BW steel plate is 3 mm, and the product of frequency–thickness is 0.81 MHz·mm, as marked in Figure 1. The S0 mode propagates at the fastest velocity among all available modes, thus, it can be completely separated from the other modes, boundary reflection, attenuation, and mode conversion signals. Therefore, the acquired signals of the S0 mode are adopted for the corresponding signal processing and analysis in this paper.

2.2. Features for Fatigue Crack Characterization

The TOF, magnitude/amplitude, and wave energy extracted from the captured signals are three sorts of the most representative ultrasonic guided waves features, which have proven effectiveness in locating gross damage [9,25,28]. In this study, the magnitude/amplitude and wave energy signals acquired from a piezoelectric active sensor network with a pitch–catch configuration are respectively extracted at different crack lengths for establishing magnitude/amplitude-based and energy-based DIs, which are opted to indicate guided waves signal features.

2.2.1. Magnitude/Amplitude-Based DIs

In this study, in order to interpret ultrasonic guided waves features acquired by individual actuator–sensor paths in an active sensor network. A damage index (DI) is established across the entire inspection area, within which fatigue cracks, if there are any, are expected to be visualized by an intuitive DI. Here, the DI is defined with the magnitude/amplitude alteration of a scattering wave caused by the occurrence of a crack at a particular actuator–sensor path in the inspection area, denoting a magnitude/amplitude-based DI.
D I ( i , j ) m a g n i t u d e - k - t = u ( i , j ) B - k ( t ) u ( i , j ) D - k ( t ) u ( i , j ) B - k ( t )
D I ( i , j ) a m p l i t u d e - k - f = u ( i , j ) B - k ( f ) u ( i , j ) D - k ( f ) u ( i , j ) B - k ( f )
In Equations (2) and (3), DI(i,j) stands for the DI calculated at the Ai–Sj actuator-sensor path, magnitude/amplitude refers to the temporal magnitude/spectrum amplitude features of an ultrasonic guided wave, and subscript k represents the kth (Ai–Sj) actuator–sensor path. The t and f refer to the time and frequency domain, respectively. u ( i , j ) B - k ( t ) and u ( i , j ) D - k ( t ) exclusively correspond to the baseline signal and current signal of the magnitude peaks of the S0 mode, which are acquired by the Ai–Sj actuator–sensor path in the time domain. Similarly, their corresponding benchmark signal and current signal in the frequency domain are u ( i , j ) B - k ( f ) and u ( i , j ) D - k ( f ) . u ( i , j ) B - k ( t ) u ( i , j ) D - k ( t ) and u ( i , j ) B - k ( f ) u ( i , j ) D - k ( f ) are the scatter magnitude/amplitude signal of the S0 mode caused by fatigue cracks in the time and frequency domain. On account of Equations (2) and (3), the defined magnitude/amplitude-based DIs are used for quantitatively characterizing the crack propagation at each path in the inspected engineering structure.

2.2.2. Energy-Based DIs

The discrepancy in fatigue cracks (different distances to an actuator–sensor path, severities, and orientations [25]) can result in a distinct damage-scattered magnitude of ultrasonic guided waves. Therefore, the deviations of wave energy, which depend on the ultrasonic guided waves signals captured from the target structure (called damage or current signal) and its healthy counterpart acquired from a pristine benchmark (denoted baseline signal), can be employed to develop a DI. In consideration of the correlations between the current and baseline signals, as follows:
D ( i , j ) e n e r g y - k - t = t 1 t 2 [ u ( i , j ) B - k ( t ) u ( i , j ) D - k ( t ) ] 2 d t t 1 t 2 u ( i , j ) B - k 2 ( t ) d t
D ( i , j ) e n e r g y - k - f = f 1 f 2 [ u ( i , j ) B - k ( f ) u ( i , j ) D - k ( f ) ] 2 d f f 1 f 2 u ( i , j ) B - k 2 ( f ) d f
Equations (4) and (5) are similar to Equations (2) and (3), in which D I ( i , j ) e n e r g y alludes to the DI that is defined at the Ai–Sj path for ultrasonic guided waves signal features associated with energy. The baseline signal u ( i , j ) B - k ( t ) and damage signal u ( i , j ) D - k ( t ) in the time domain are acquired by the Ai–Sj actuator-sensor path, and their corresponding benchmark signal and current signal in the frequency domain severally are u ( i , j ) B - k ( f ) and u ( i , j ) D - k ( f ) . t 1 t 2 [ u ( i , j ) B - k ( t ) ] 2 d t is the baseline signal energy of the S0 mode in the time domain. The t1 is the initial time position of the S0 mode, and the t2 is the end time position of the S0 mode. f 1 f 2 [ u ( i , j ) B - k ( f ) ] 2 d f is the baseline energy signal of the S0 mode in the frequency domain. The f1 is the initial frequency position of the S0 mode, and the f2 is the end frequency position of the S0 mode. Similarly, t 1 t 2 [ u ( i , j ) B - k ( t ) u ( i , j ) D - k ( t ) ] 2 d t and f 1 f 2 [ u ( i , j ) B - k ( f ) u ( i , j ) D - k ( f ) ] 2 d f are the scatter energy of the S0 mode caused by fatigue cracks in the time and frequency domain. An energy-based DI related with the guided waves signal feature can be constructed at each path, which is applied to quantify the crack growth and characterize the destruction level in the inspected structure range. Furthermore, the greater D I ( i , j ) e n e r g y - k obtained along with the Ai–Sj path, the larger the indicated fatigue crack propagation.

3. Fusion of DIs

Driven by the incentive to visualize the procedure of fatigue crack propagation, a damage index synthetic fusion algorithm of each actuator–sensor path is further developed in this study. Using a hybrid fusion method does not weaken the characterization of crack propagation, but it does intuitively and rapidly comprehend the overall health status within the inspection of the SMA490BW plate-like structure. The fatigue crack propagation can be described by the fitting correlation of hybrid fused DIs of various acoustic characteristics.
In terms of Equations (2)–(5), the extracted various signal features are used to establish different DIs. The corresponding magnitude/amplitude and energy DIs are calculated at each actuator–sensor path, which are applied to define the original DIs. The original DI has a prior perception for fatigue cracks on the current path. In practice, an original DI not only contains information associated with cracks, but also unwanted signal features such as ambient noise and measurement uncertainties, multiple guided waves modes conversion, and reflections from structural boundaries. These unwanted signal features possibly dilute crack-associated features and weaken the proportion from a single actuator–sensor path [25]. Therefore, based on the DI weights of different paths, the signal representations of the fused DIs are embodied by Equations (6)–(9). The ultimate fitting result is a straight line, which can be used to indicate the fatigue crack propagation effectively.
To summarize the above, each actuator–sensor path (N in total) offers an original DI via a pitch–catch configuration. Then, a hybrid fusion scheme is proposed to coalesce all the available DIs of each path in the sensor network, as follows:
D I ( i , j ) m a g n i t u d e - f u s i o n - t = k = 1 N ( α m a g n i t u d e - k - t D I ( i , j ) m a g n i t u d e - k - t )
D I ( i , j ) am p l i t u d e - f u s i o n - f = k = 1 N ( α am p l i t u d e - k - f D I ( i , j ) am p l i t u d e - k - f )
D I ( i , j ) e n e r g y - f u s i o n - t = k = 1 N ( α e n e r g y - k - t D I ( i , j ) e n e r g y - k - t )
D I ( i , j ) e n e r g y - f u s i o n - f = k = 1 N ( α e n e r g y - k - f D I ( i , j ) e n e r g y - k - f )
where D I ( i , j ) m a g n i t u d e - f u s i o n - t and D I ( i , j ) e n e r g y - f u s i o n - t are the ultimate fusion DIs in the time domain, meanwhile, D I ( i , j ) am p l i t u d e - f u s i o n - f and D I ( i , j ) e n e r g y - f u s i o n - f are the synthetic DIs in the frequency domain. The k stands for the kth actuator–sensor path, while α refers to the weights of each path. The incentive to build such a hybrid fusion scheme is twofold:
(i) An arithmetic fusion equally takes into account prior perceptions from each actuator–sensor path and well decentralizes individual contributions. Although the arithmetic fusion fully encompasses previous perceptions from all paths, information including ambient noise and measurement uncertainties are also engaged, which might overstate the presence of fatigue cracks and lead to false alarms, and
(ii) The synthesized fusion DI method is obtained by implementing a probability weighting operation on the original DIs of each actuator–sensor path. A hybrid DI scheme is constructed to enhance the approach tolerance for environmental noise, measurement uncertainties, and erroneous perceptions from individual paths.
The hybrid fusion scheme can be used to represent the fatigue crack propagation quantitatively, which effectively strengthens the individual original DIs of crack-related information and enhances the availability, stability, and signal-to-noise ratio of the fitting signals.

4. Experiment

4.1. Specimens

The research objective is to monitor the fatigue crack propagation by means of the DIs in ultrasonic guided waves. Furthermore, the material type of the bogie frame is SMA490BW steel. The intensity and rigidity of SMA490BW steel are confirmed in accordance with JISE4208 standard (railway vehicle bogie static load test method).
A 190 mm × 187 mm × 3 mm bogie steel plate is used in the experiment, whose material properties and chemical composition are shown in Table 1 and Table 2. Using an active sensor network with a comparatively sparse transducer configuration, six manufactured identical PZT-5As are surface-mounted on the specimen by conductive epoxy. Each PZT-5A has a diameter of 8 mm and thickness of 0.48 mm. A1–A3 of PZT-5As are respectively used for actuators as ultrasonic guided waves inputs, whereas S4–S6 of PZT-5As are used for sensors, forming nine actuator–sensor paths: A1−S4, A1−S5, A1−S6, A2−S4, A2−S5, A2−S6, A3−S4, A3−S5, and A3–S6 are respectively named the first to ninth actuator–sensor paths, as schematically shown in Figure 2. Those paths are deployed by the physically existing actuators (A1–A3) and sensors (S4–S6), the actuator–sensor path network can also be formed to locate any position of interest within the inspection area virtually [25]. Fatigue cracks propagate approximately from 0.0 mm to 180.0 mm in steps of 5.0 mm, which are cut using a 1.0 mm thick saw blade. The visible fatigue crack through the plate thickness and in parallel with the 187.0 mm side is generated.

4.2. Experimental Setup

The 64-channel Scan-Genie II data acquisition integration system developed by Acellent Technologies, Inc. is used for signals excitation and reception. At each crack length measurement, the relevant ultrasonic guided wave signal responses are recorded. Considering that the signal energy of the guided waves is mostly concentrated in the vicinity of the narrowband probing frequency domain and the dispersion characteristics can also be reduced accordingly, the narrowband sinusoidal tone burst modulated by a Hanning window is calculated by Equation (10) as an excitation frequency. The excitation signal is applied to A1–A3 of PZT-5As, respectively, and the peak-to-peak voltage of the output signal is 50 V, it is amplified by the gain parameter setting before it is sent to A1–A3. The remaining S4–S6 of PZT-5As are used to measure the guided waves signals. In the meantime, the sampling rate is 24 MHz, the sampling point is 6000 and the quality of measurement is improved by averaging the signals with multiple acquisitions. Therefore, the output signal responses are obtained six times and averaged to improve the signal-to-noise ratio.
h ( n ) = 1 2 [ 1 c o s ( 2 π n N 1 ) ]   ( n   =   0 , 1 , , N 1 )

4.3. Exciting Frequency Selection

Firstly, a mode-tuning experiment [7] is carried out to select the optimal excitation frequency that could maximize the magnitude/amplitude responses of the guided waves. The sweep ranges of central frequency are determined by considering the local resonance characteristics of PZT-5A. As a result, the driving frequencies are swept from 110 kHz to 330 kHz in steps of 20 kHz. Then, it is applied to one of the actuators to generate guided waves and the rest of the sensors are used for receiving. At each excitation frequency, the magnitude signals of ultrasonic guided waves are recorded. The local resonance frequency of PZT-5A measured by a WK-6500B impedance instrument is 265 kHz, as shown in Figure 3, and the resonance frequency [29] calculated by theoretical Equation (11) is 304 kHz. The central frequency error between theoretical calculation and experimental measurement is less than 13%, and the difference can be negligible. The frequency near the resonance frequency of PZT-5A is selected as the central excitation frequency of the experimental because the signals acquired at this frequency have a high stability and a high signal-to-noise ratio. Therefore, the excitation frequency of 270 kHz is chosen to excite guided waves in the rest of the studies. Figure 4 shows the excitation signal of five-cycle Hanning-windowed sinusoidal tone bursts at 270 kHz, it can also be seen that the amplitude of the central frequency from the spectrogram is maximum at 270 kHz.
f r e s - P Z T = η n 2 π r 1 ρ E ( 1 υ 2 )
η n = η n ( υ ) , in which n generally equals 1, υ P Z T = 0.35 , η 1 = 2.0795 , r refers to the radius of PZT-5A, and E stands for the elastic modulus.

5. Results and Discussions

The measured guided wave signals from the damaged specimen and baseline signals in intact specimen are used to construct magnitude/amplitude-based and energy-based DIs for quantitatively characterizing crack growth in an SMA490BW steel plate-like structure along with the actuator–sensor paths. In cases where a crack is exactly located near the path or the crack size is equivalent to the same order of magnitude of the detection wavelength, the representative acoustic features of the measured guided wave are changed significantly, which corresponds to the larger DI coefficient between two signals. In contrast, the signal deviation would be trivial if the crack is far away from the actuator–sensor path or the crack size is much smaller than the probing wavelength [25]. In particular, the magnitude/amplitude-based and energy-based DIs have proven the susceptibility to signal magnitude/amplitude variation as well as signal energy transformation.
This section includes four parts: (1) data comparison of different sampling points, (2) magnitude-based and energy-based DIs in the time domain, (3) amplitude-based and energy-based DIs in the frequency domain, and (4) signal fusion for all the actuator–sensor paths.

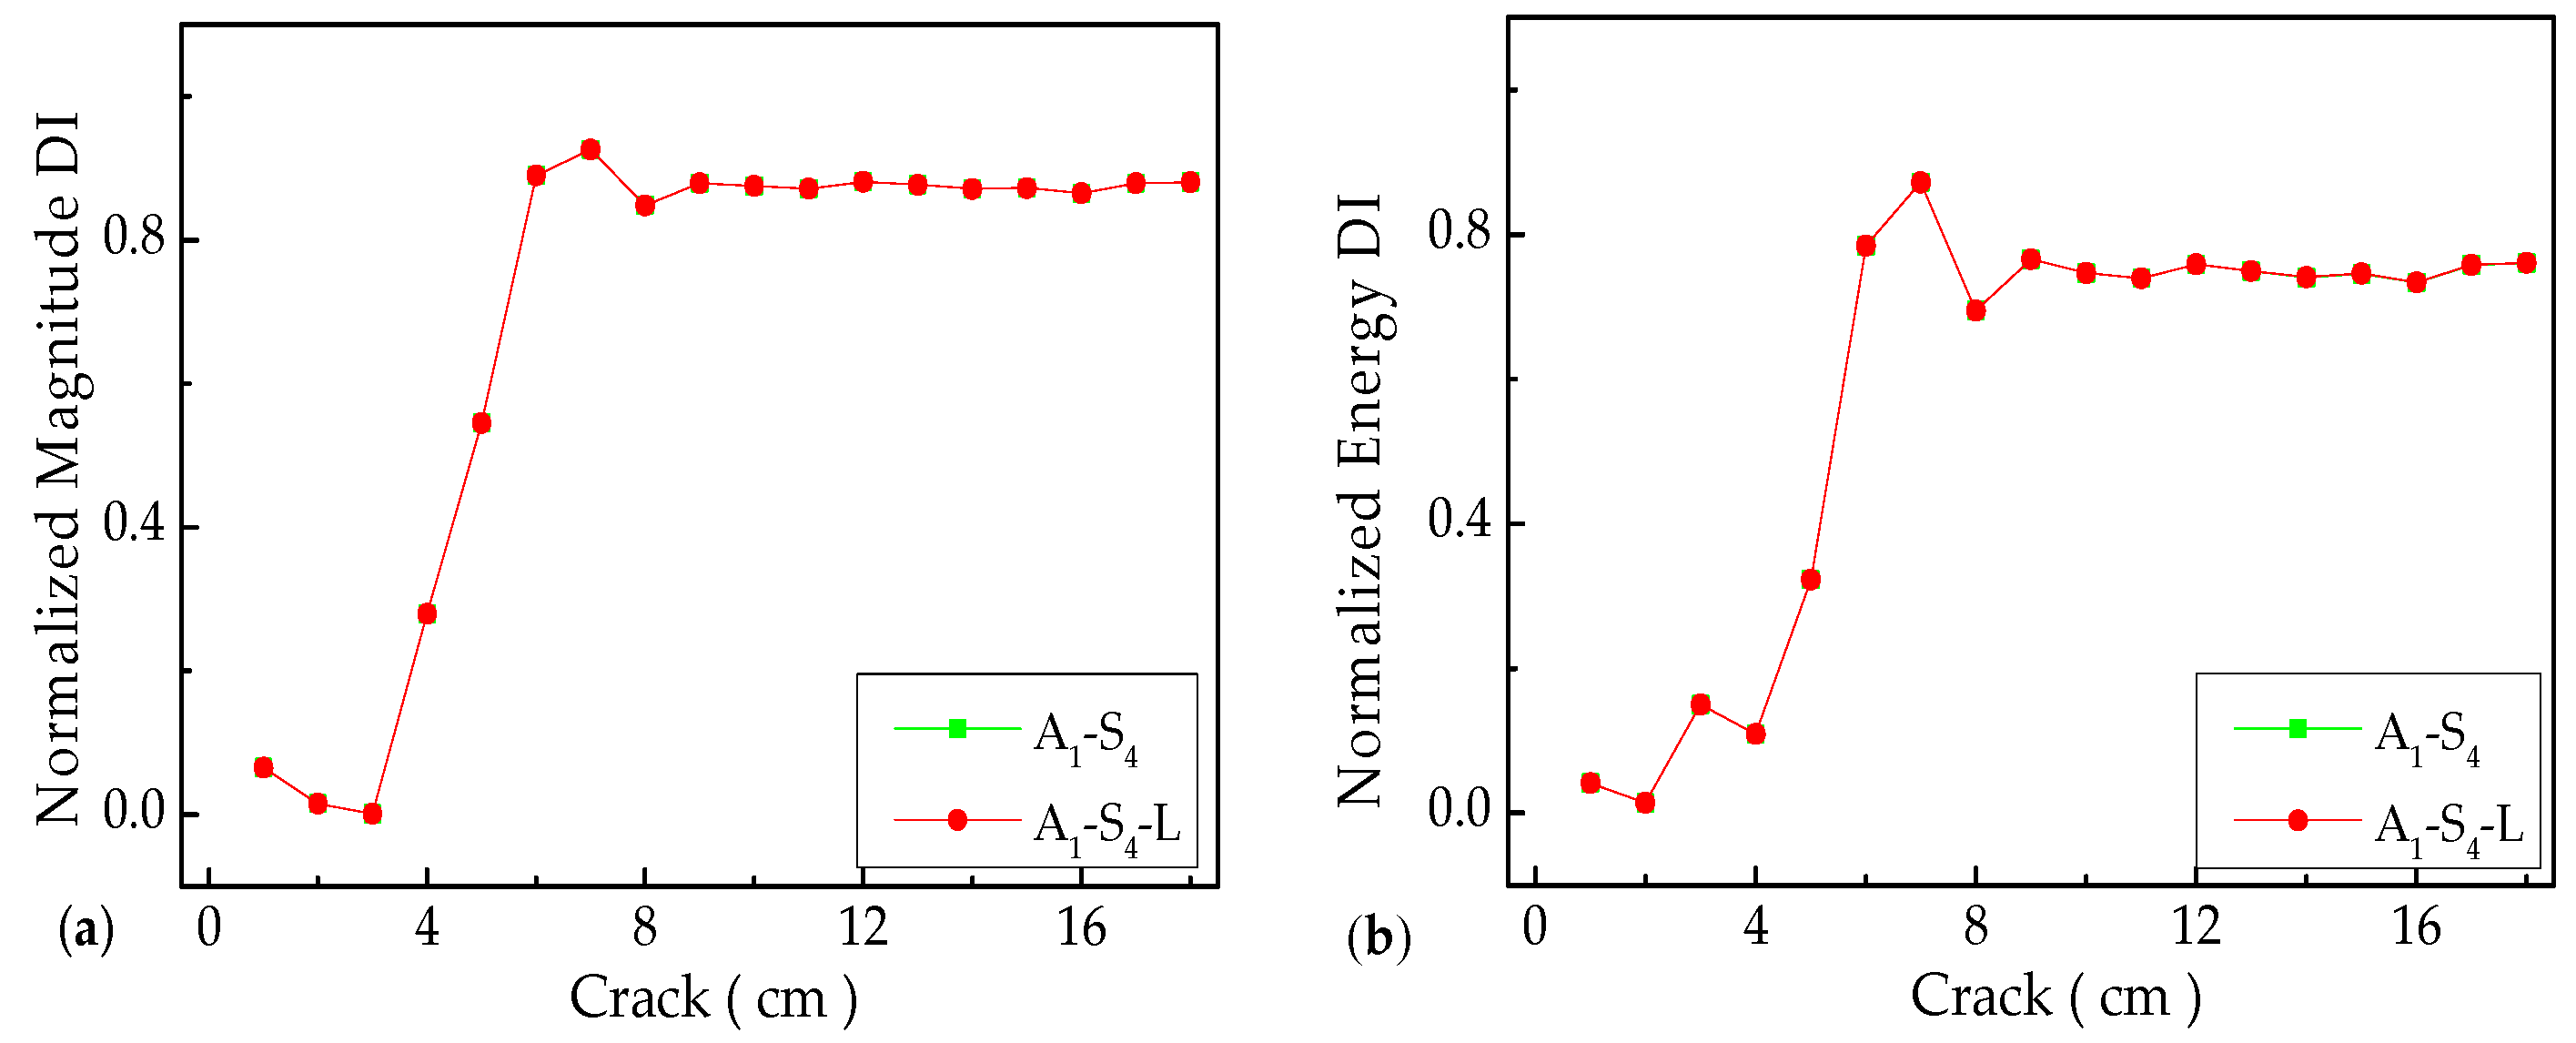
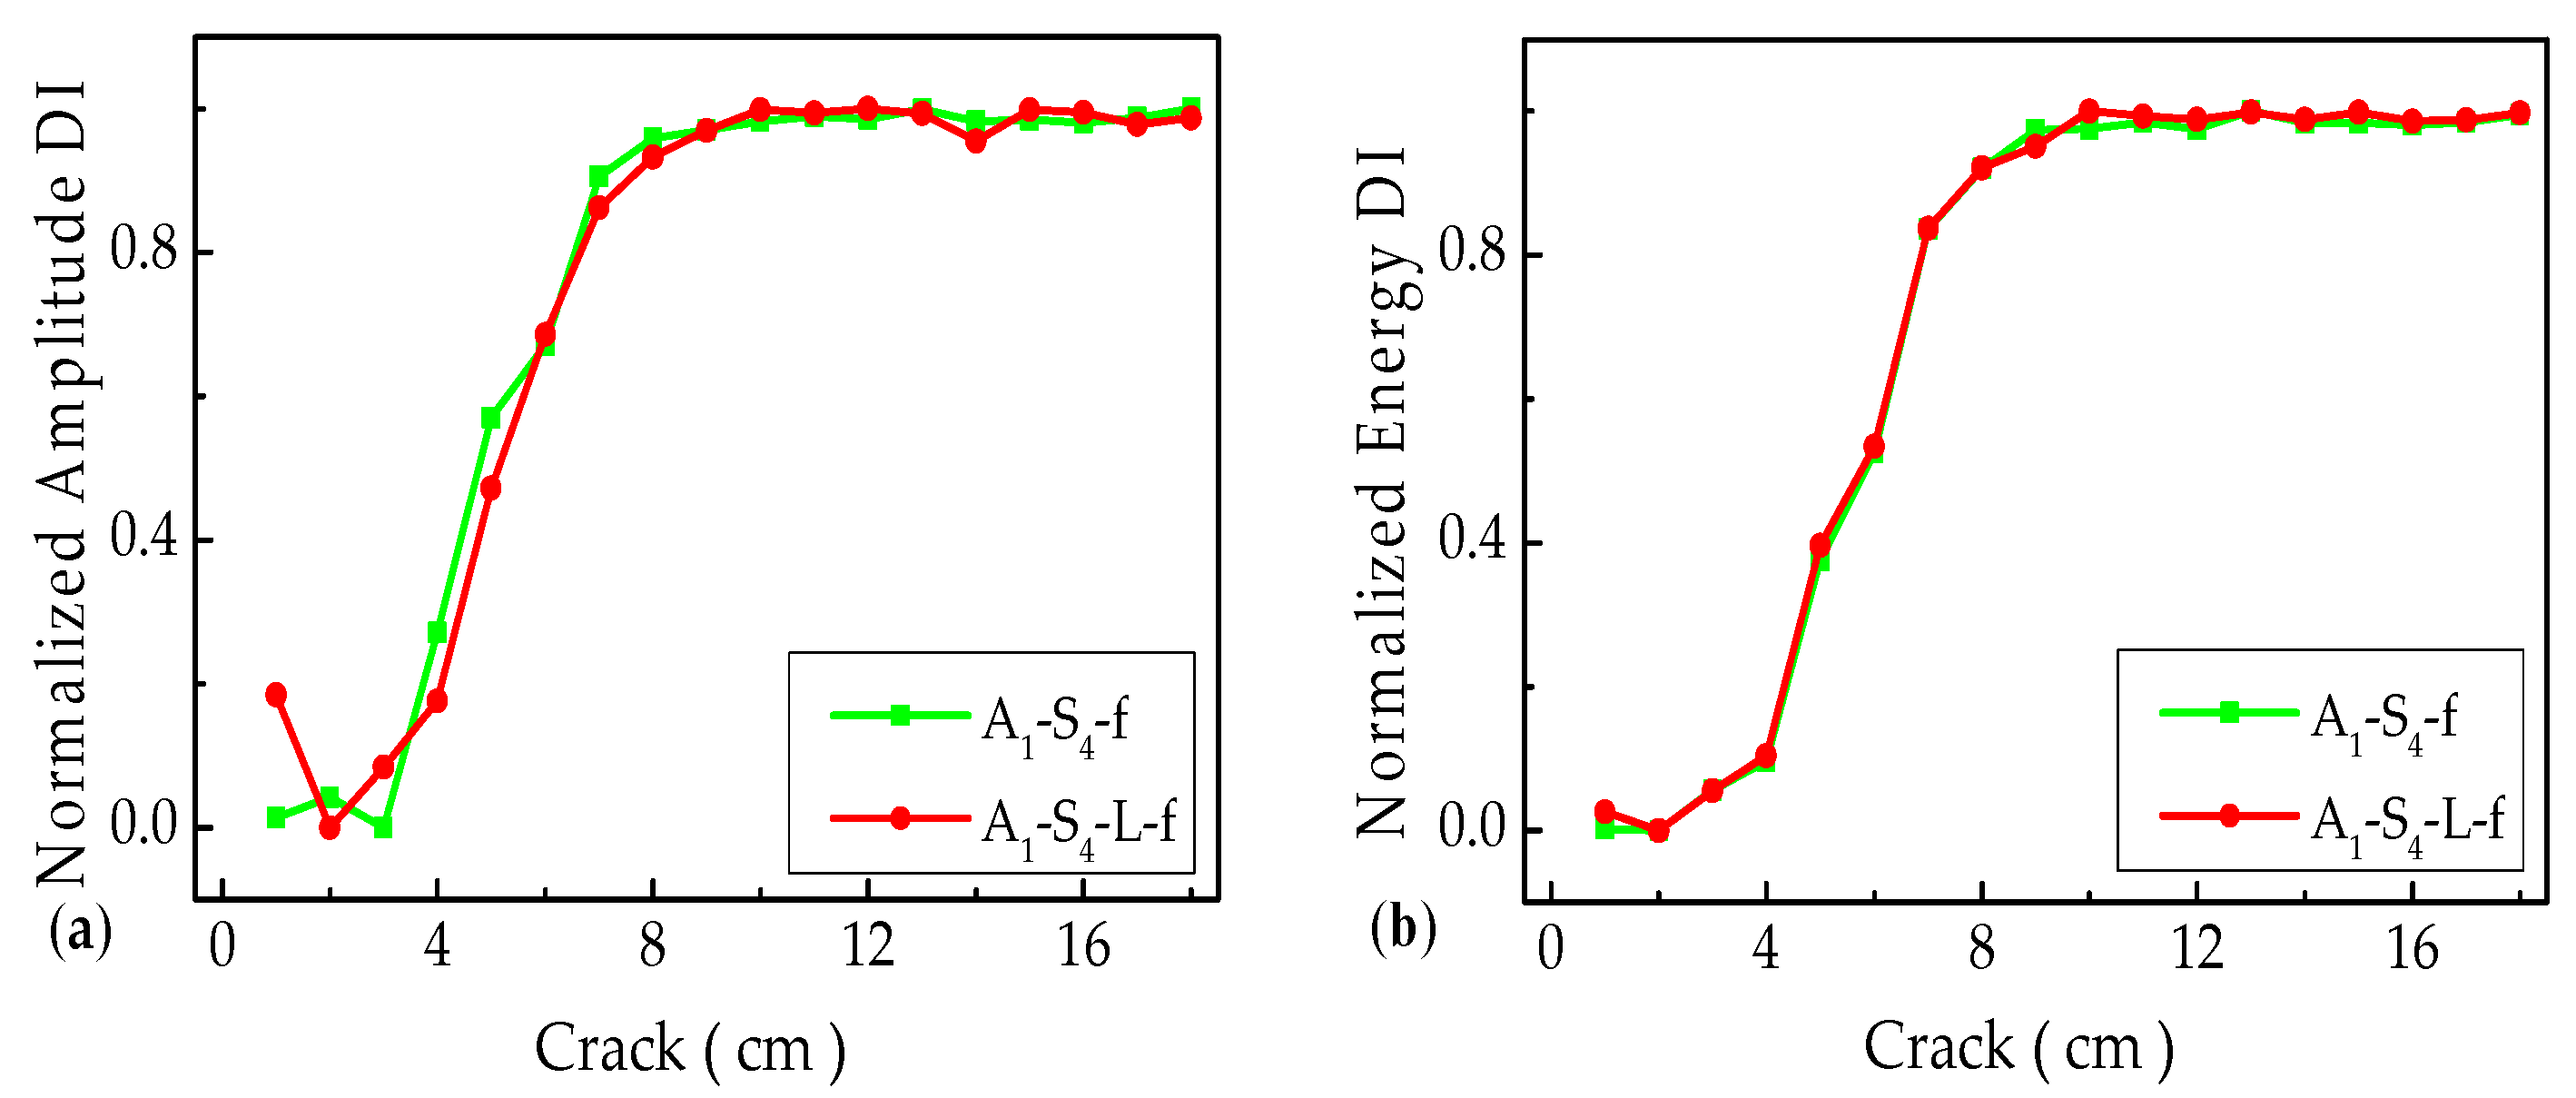
5.1. Data Comparison of Different Sampling Points

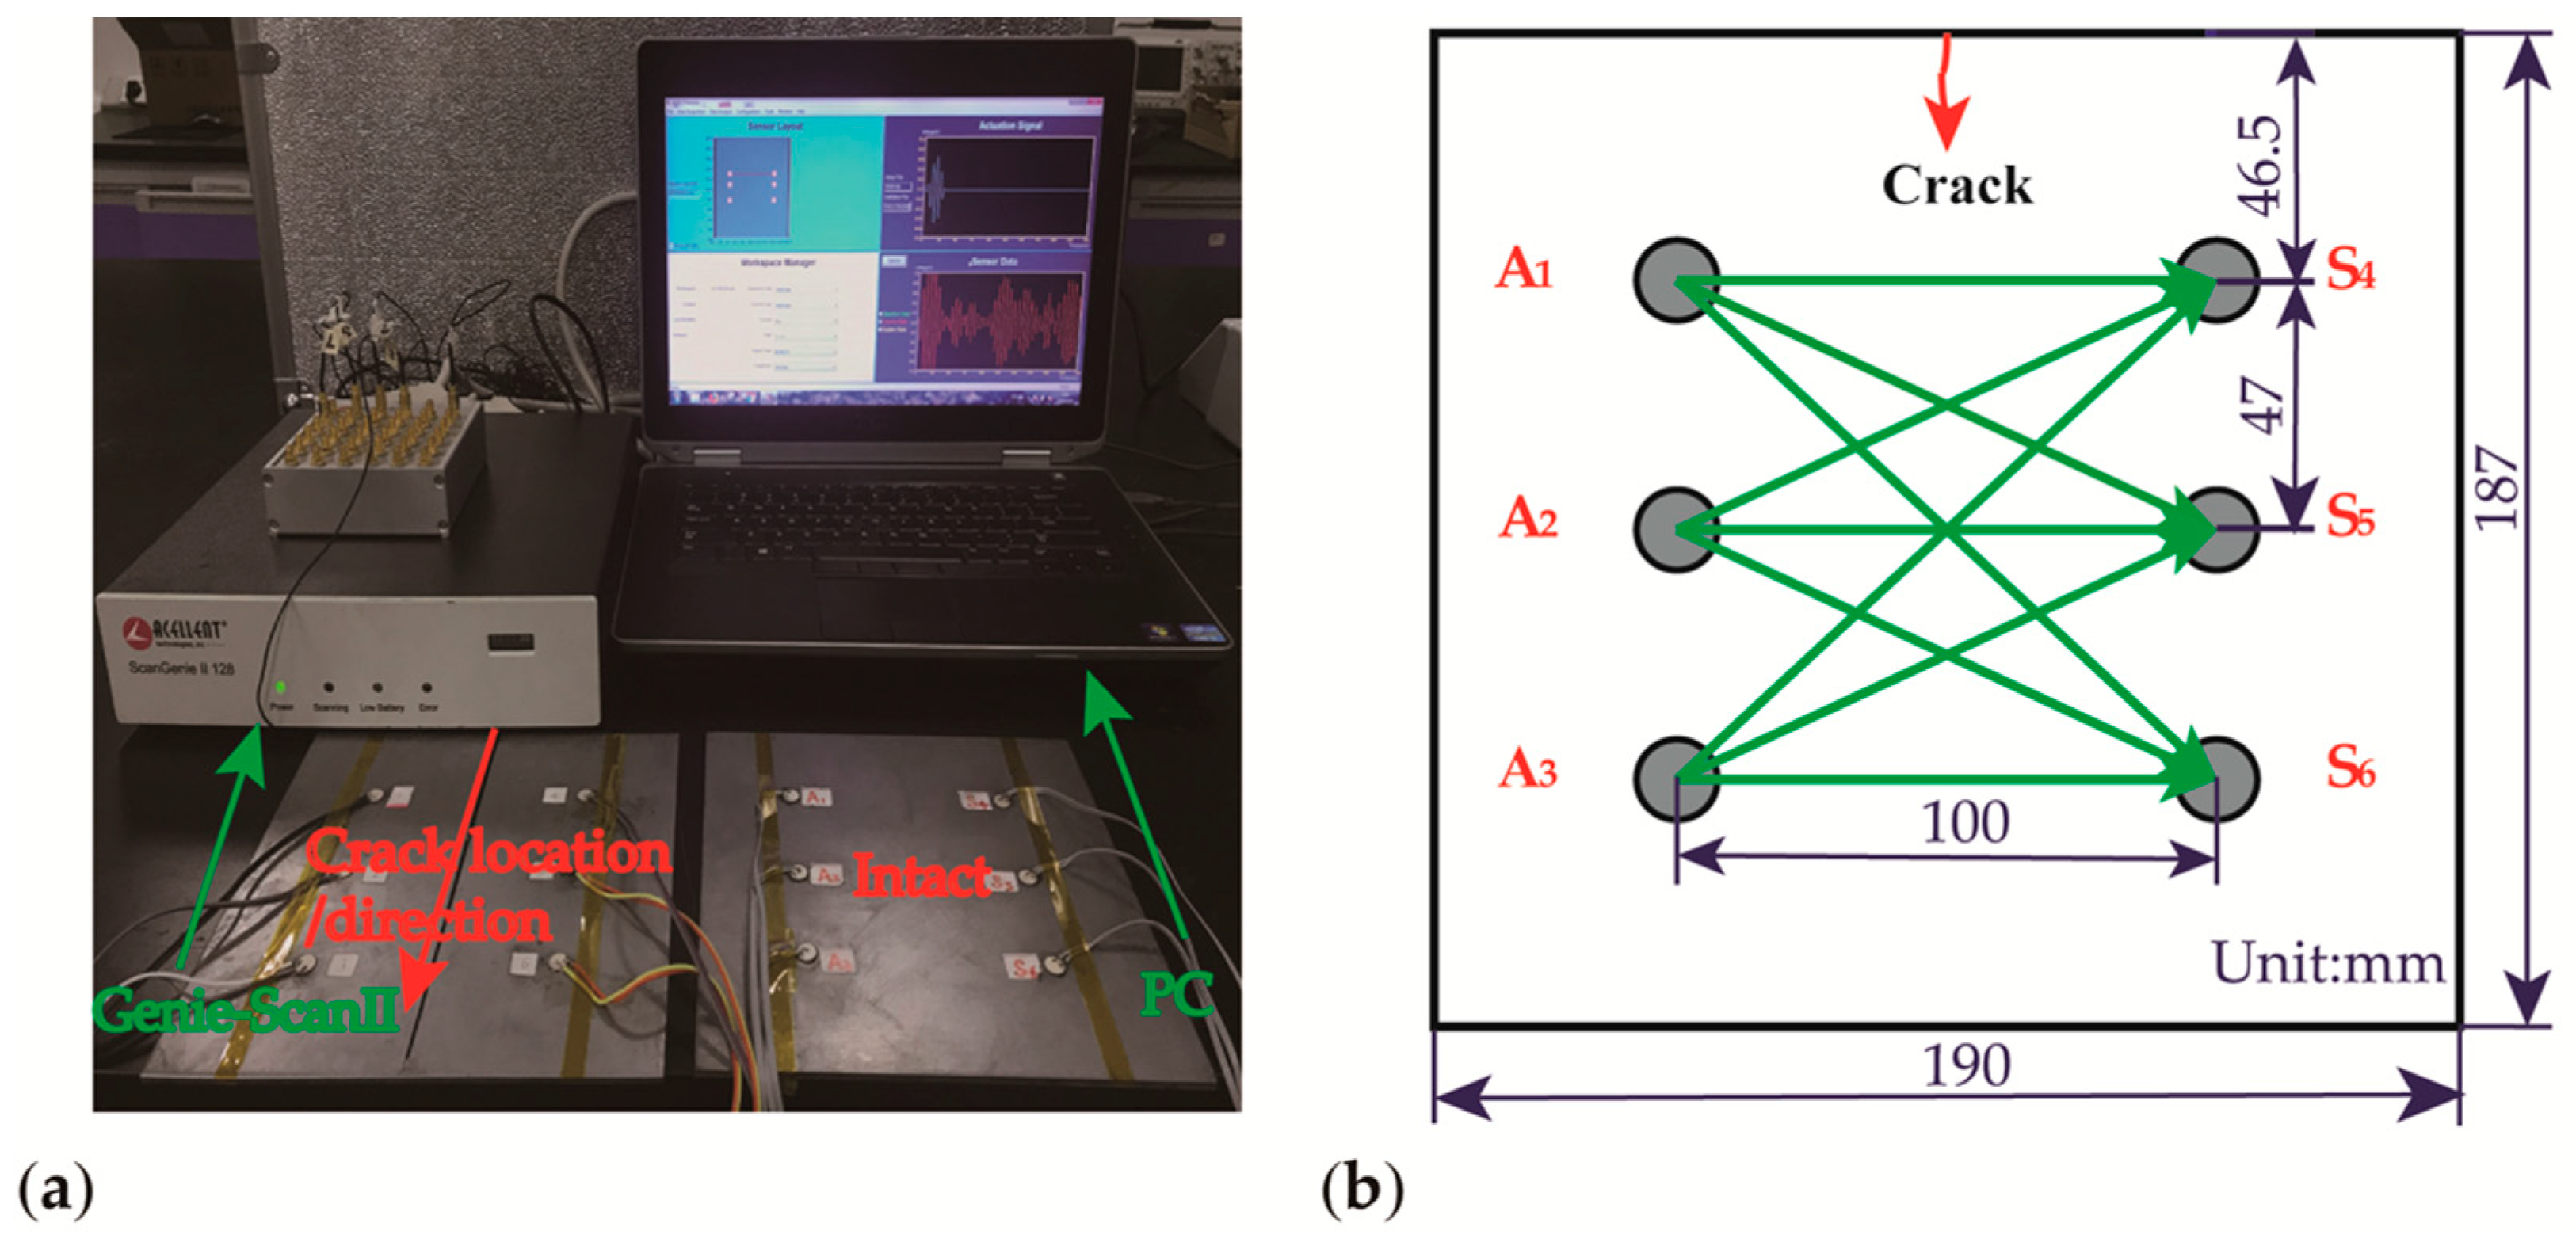
In general, it is well accepted that the more sampling points are acquired at an active sensor network, the better the signals are measured in an accurate, stable, and practicable manner. Different sampling points signals of S0 mode are extracted to calculate the magnitude/amplitude-based DIs and energy-based DIs in the time-frequency domain. We only select the representative path such as actuator–sensor path A1–S4, as shown in Figure 5 and Figure 6.
A1-S4 stands for the sampling points of the common length in the time domain, and A1–S4–L refers to the sampling points of the longer length from the time domain. A1–S4–f and A1–S4–L–f correspond to the common length and longer length in the frequency domain, respectively. In the time domain, the magnitude-based and energy-based DIs of two different types of sampling points are exactly identical, as shown in Figure 5. Based on the amplitude-based DIs in the frequency domain, it is found that almost no fluctuations of DIs are observed for the reason that the measured signals are prone to be contaminated with lower noise and improved reliability in practice. Moreover, ultrasonic guided waves are highly dispersive and multimodal, which causes some difficulties in the process of signal feature extraction. Nevertheless, the overall distribution of magnitude/amplitude-based and energy-based DIs are well consistent. Considering that the differences between the magnitude/amplitude-based and energy-based DIs of different sampling points are very small, and they can be ignorable, to some extent. Therefore, the sampling points of the common length are selected to analyze and process the acquired signals in the following studies.

5.2. Magnitude-Based and Energy-Based DIs in Time Domain

The intensity of damage-reflected wave energy is taken as a sensitive indicator to determine the orientation of fatigue cracks, as correlated in which the strongest reflection is captured perpendicular to the direction of incidence. With the increase of the incidence angle of the guided waves, the intensity of the crack-reflected signal energy declines quickly. Based on this, the actuator–sensor paths are selected by extracting signal features associated with higher intensity energy [30], the gained signals also have a higher signal-to-noise ratio. Therefore, the investigations successively select the actuator–sensor paths A1−S4, A2−S5, A3−S6, A2−S4, and A2−S6 as representative paths in the time-frequency domain, as displayed in Figure 7, Figure 8, Figure 9 and Figure 10. On this condition, the different paths A1–S4, A2−S5, and A3−S6 are perpendicular to the crack orientation with a fixed crack length of 1.0 cm. Similarly, A2−S4, A2−S5, and A2−S6 are selected as the comparison paths of A1−S4, A2−S5, and A3−S6, the magnitude variations of the extracted S0 mode in the time domain are presented in Figure 7.
The normalized magnitude-based and energy-based DIs in the time domain are calculated by Equations (2) and (4). As shown in Figure 8, in cases where the crack of the A1−S4 actuator–sensor path propagates from 0.0 cm to 3.0 cm, the A2−S5 actuator–sensor path propagates from 0.0 cm to 8.0 cm, or the A3−S6 actuator–sensor path propagates from 0.0 cm to 12.0 cm, there are no obvious variations in the DIs with some negligible fluctuations. The detection features of magnitude-based and energy-based DIs are substantially restricted to evaluate the fatigue crack, in case that the crack size is comparable with the probing wavelength. It is also found that the temporal features of guided waves are fairly limited to characterize the fatigue crack growth near the actuator–sensor paths with high sensitivity. When the progressive crack is large enough or near the actuator–sensor paths, with an increase of the fatigue crack, the remarkable DIs can be obtained. On the contrary, when the extended fatigue crack locates far from the actuator–sensor paths, it shows that the DIs are less sensitive to characterizing the crack variations without significant changes.

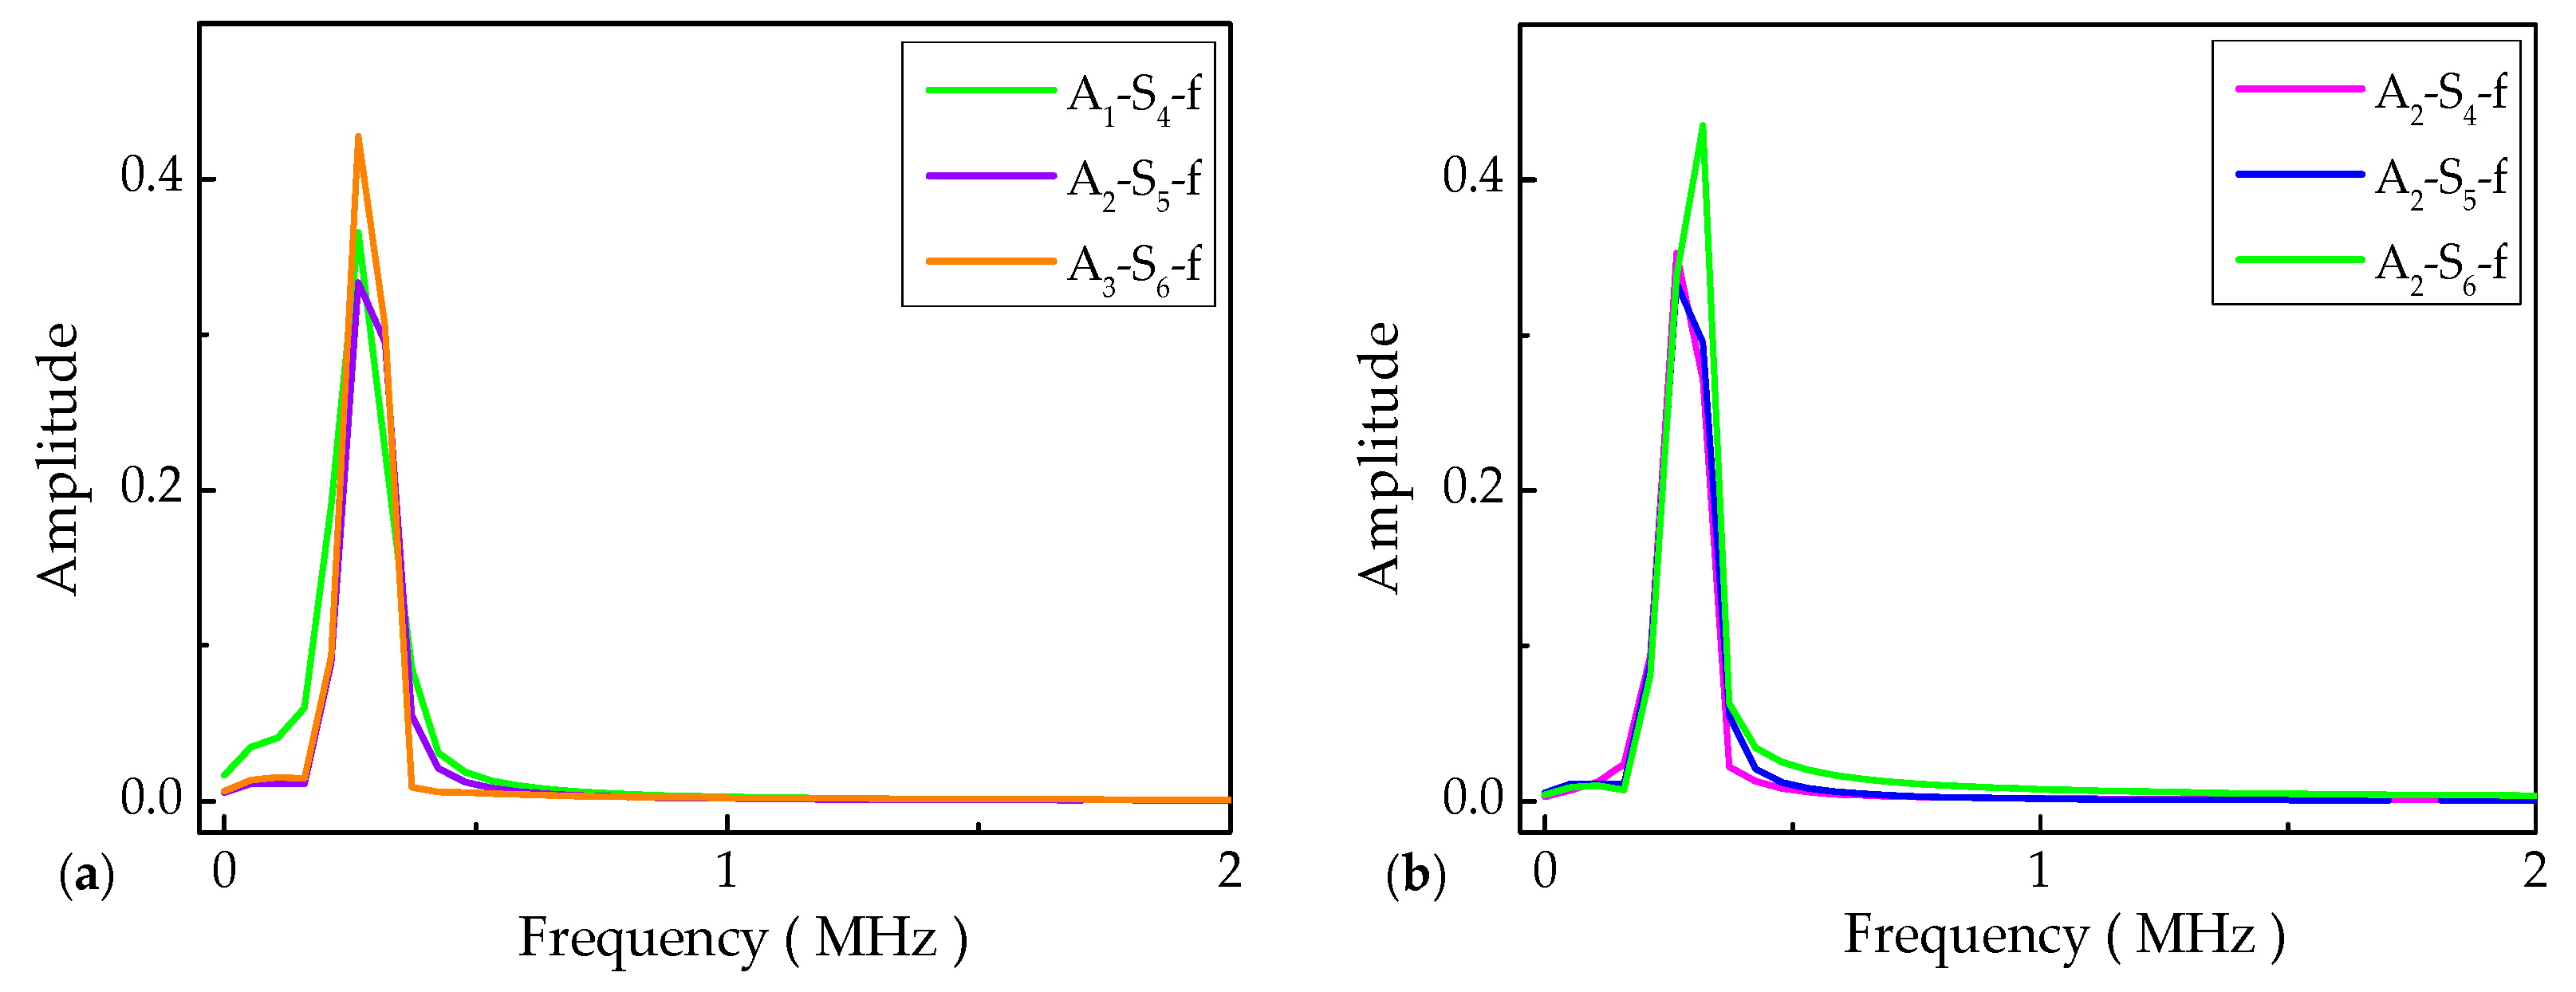
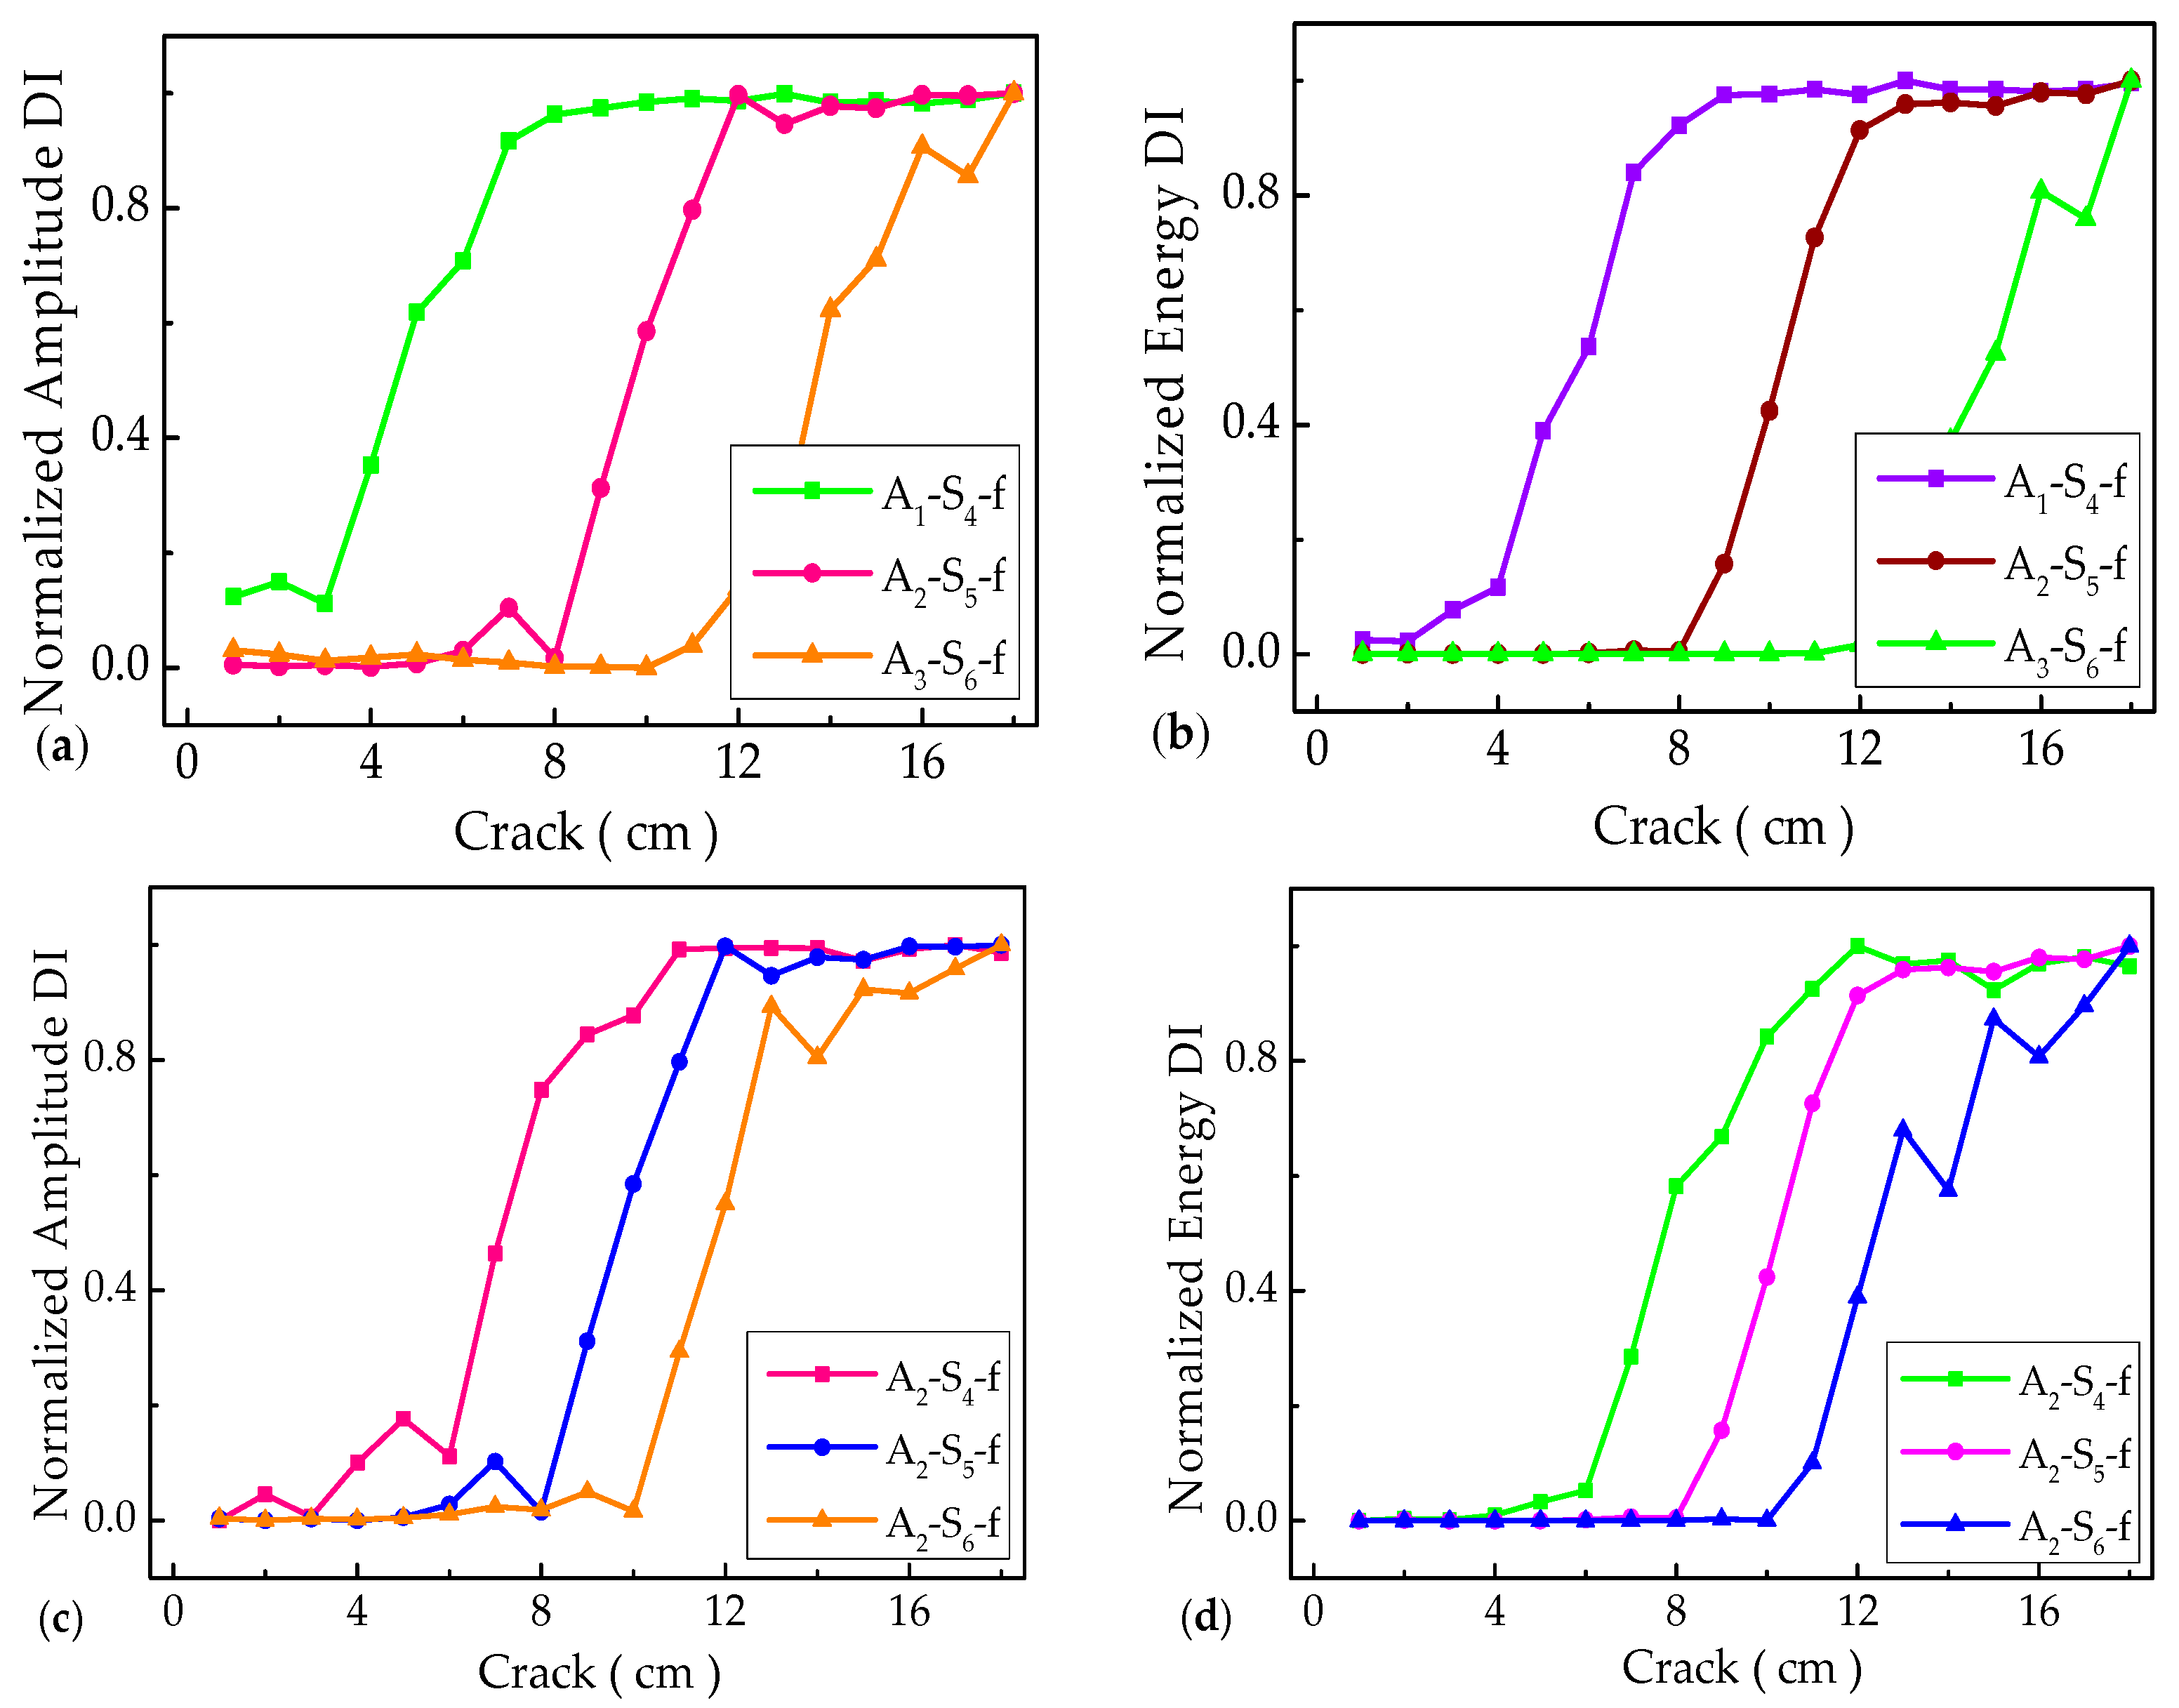
5.3. Amplitude-Based and Energy-Based DIs in Frequency Domain

The normalized magnitude-based and energy-based DIs in the time domain can provide convenient conditions for crack propagation quantification, but their effectiveness in depicting crack size and damage level are still controversial. This is because small-scale cracks can cause a feeble variety for the crack-scattered wave in the time domain, that is, the magnitude of fatigue crack is often altered at an imperceptible level within the temporal information. Therefore, the signal features associated with the frequency domain are extracted to improve the sensitivity and stability of amplitude-based and energy-based DIs, in accordance with a pitch–catch sensor network configuration [25]. Fast Fourier transform (FFT) is used to process time-domain signals to obtain a frequency spectrum [31], as shown in Figure 9. Compared with the magnitude variations in the time domain from Figure 7, the amplitude variations in the frequency domain are illustrated in a more obvious and reliable manner.
The signals shown in Figure 8 are subsequently preformed with fast Fourier transform (FFT) to obtain the corresponding frequency spectrogram, as shown in Figure 10. The overall trend of DIs obtained in the frequency domain is basically consistent with that of the time domain. However, when the crack of the A1−S4 actuator-sensor path spreads from 0.0 cm to 6.0 cm, the A2−S5 actuator–sensor path spreads from 0.0 cm to 11.0 cm, or the A3−S6 actuator–sensor path spreads from 0.0 cm to 15.0 cm, there are no outstanding peaks for the amplitude-based and energy-based DIs. It is clearly observed that the variations of DIs are gradually and steadily obverted to the stable stage. In addition, the variations of DIs can be regarded as insignificant in the stable stage, which are consistent with the observations in Figure 8.

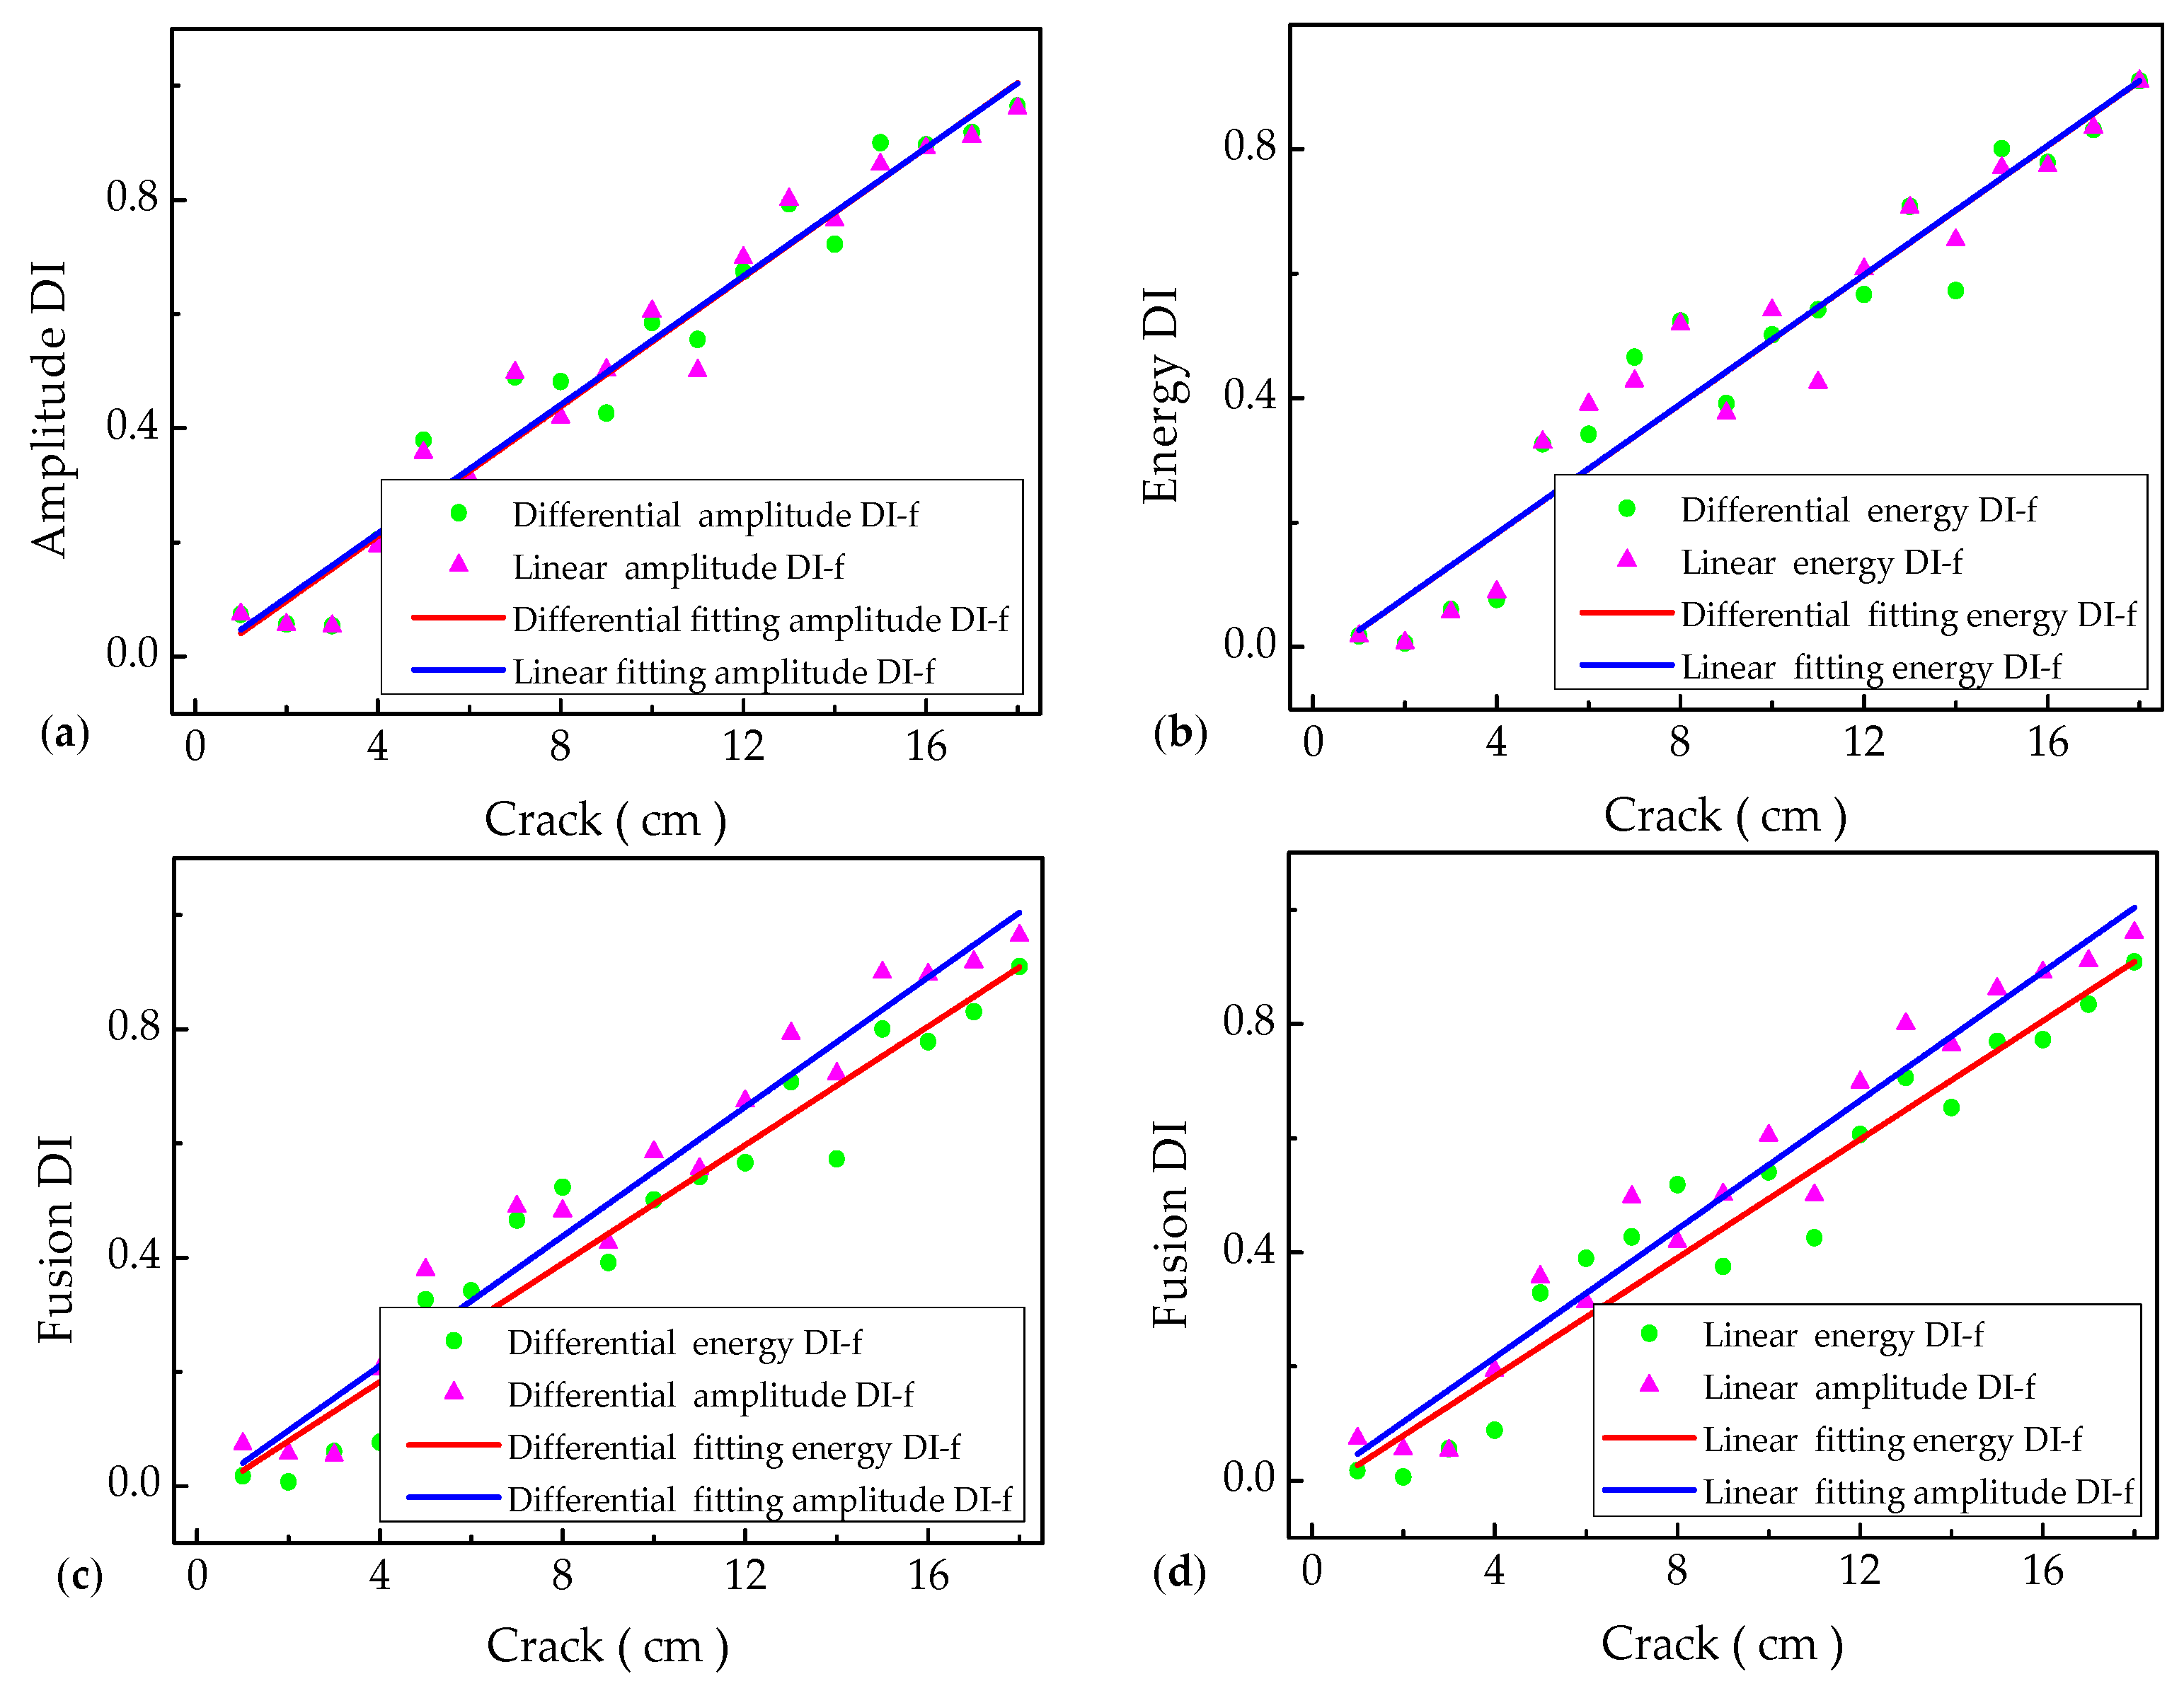
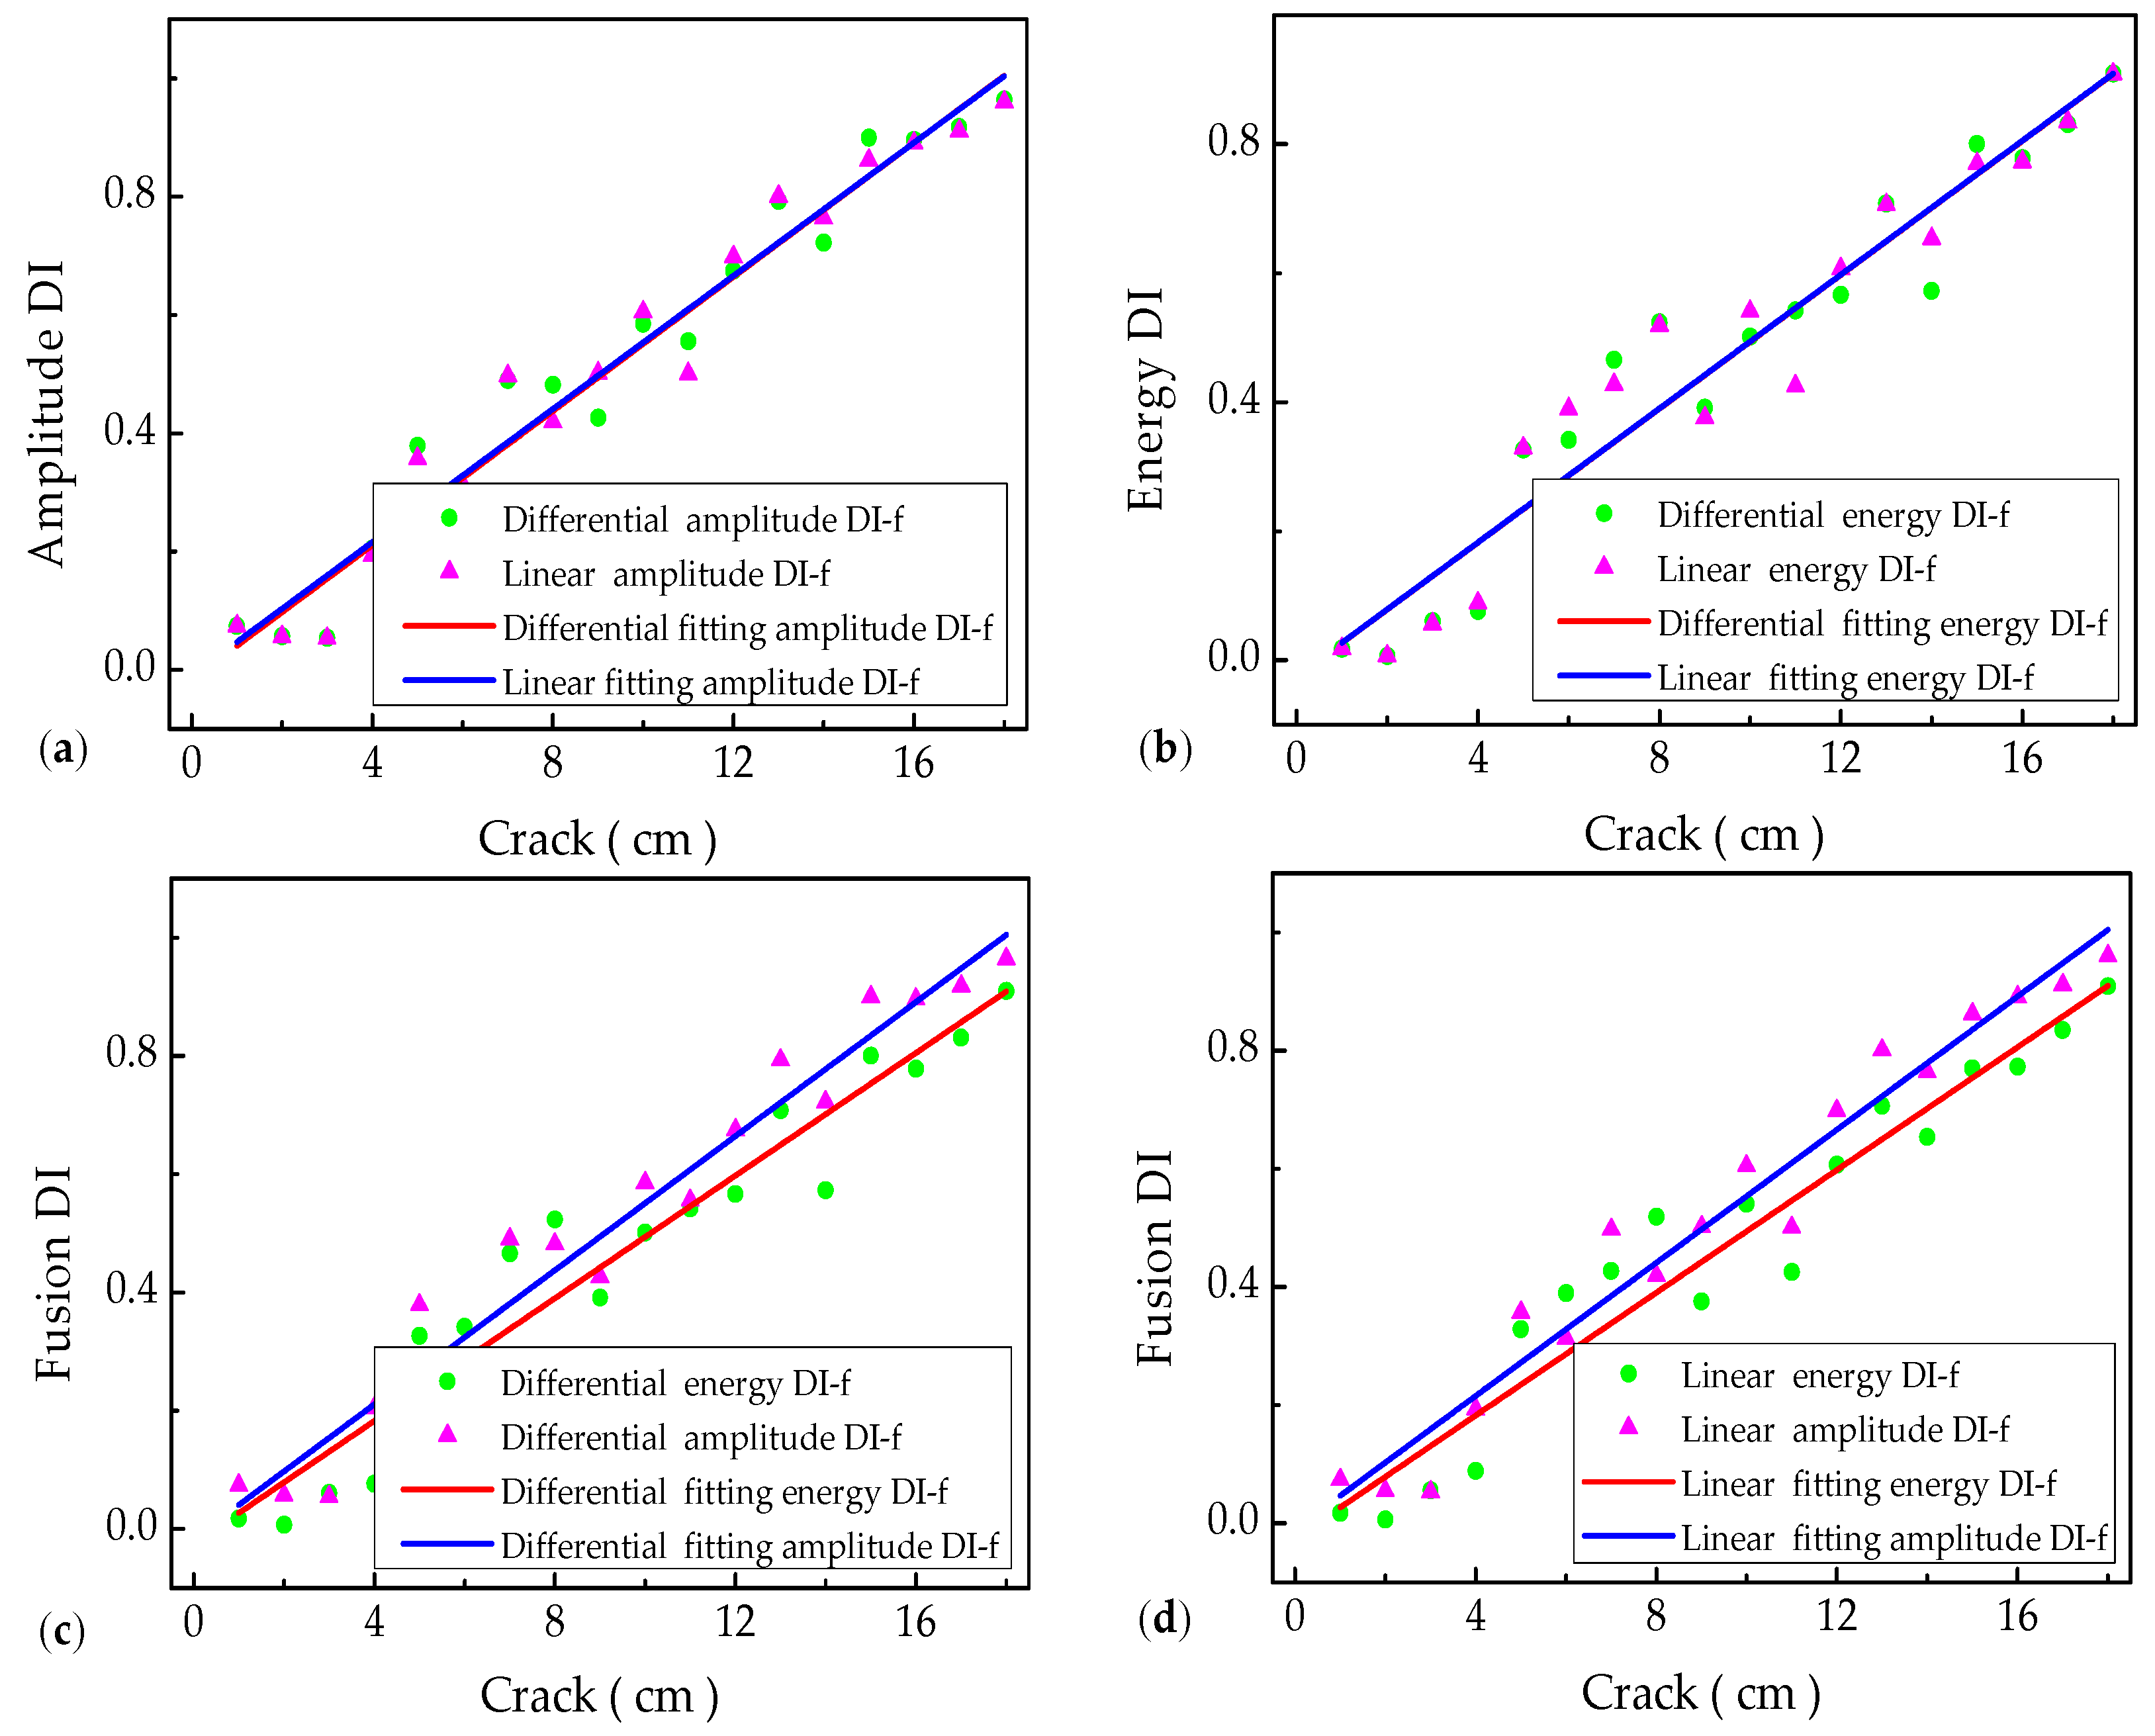
5.4. Signal Fusion for All Actuator–Sensor Paths

In order to strengthen the crack-interrelated features of the individual original DIs, the environmental noise and measurement uncertainties (unwanted information in individual original DIs) need to be lessened effectively, and the signal-to-noise ratio of the captured crack signal features need to be heightened as much as possible. According to the DI weights of each actuator–sensor path, the extracted original DIs are required to decentralize individual contributions equally and amalgamate all available signal features at each specific crack. A synthetic DI related with fatigue crack is proposed, which can be used to characterize the crack propagation at all paths. Based on the analysis in the time-frequency domain, the hybrid magnitude/amplitude-based DIs (defined by Equations (6) and (7)) and energy-based DIs (defined by Equations (8) and (9)) calculated by the fusion arithmetic are separately illustrated in Figure 11 and Figure 12.
Firstly, the linear fitting of DIs is conducted at different crack growth regions for each actuator–sensor path. Based on the DI weights of different paths, linear fusion DIs are extracted for all the actuator–sensor paths. The first-order differential is the difference between two consecutive neighbors in a discrete DI function. Differential fusion DIs are obtained by different weights of all the paths. Based on the analysis of linear fusion DIs and differential fusion DIs (including magnitude/amplitude-based and energy-based DIs), Figure 11 severally displays the ultimate DIs in the time domain. Experimental results show that the propagation of the fatigue crack can be calibrated by the synthetic DIs quantitatively. It is found that the fitting differences between the linear magnitude and differential magnitude DIs are especially tiny, and the fitting straight lines are mostly coincident. Moreover, it can also be clearly observed that the stability of linear and differential magnitude fitting DIs is better than that of linear energy fitting and differential energy fitting DIs. Simultaneously, the results indicate that the stabilities of differential energy fitting DIs are the worst in the time domain. In other words, the fitting effectiveness from different fitting methods can be represented alternatively by the fitting correlation coefficients and mean squared error in Table 3 and Table 4.
Similarly, the fitting DIs from the frequency domain can characterize the propagation of crack accurately, as shown in Figure 12. Obviously, it indicates that the overall fitting DIs in the frequency domain coincide with the fitting in the time domain. Whereas, it is corroborated that the stability and reliability of the fitting DIs in the frequency domain are better than those in the time domain. Simultaneously, it is particularly interesting that small differences between the experimental measurement DIs and the fitting DIs can be clearly identified in Figure 12, Table 3 and Table 4.
It can be concluded that the synthetic fusion DIs of different acoustic features can be used to calibrate the propagation of fatigue crack quantitatively to a certain extent. However, considering the stability, reliability, and practicability of the signals, the linear and differential amplitude fusion schemes in the frequency domain are shown to have better promising alternatives for characterizing the crack propagation.

6. Conclusions

It is of great significance but also a highly challenging assignment to monitor small-scale fatigue crack continuously. In addition, it is of vital importance for calibrating the fatigue crack propagation quantitatively, synchronously. In this paper, the typical ultrasonic guided waves signal characteristics in the time-frequency domain are acquired from an SMA490BW steel plate associating with an active sensor network. The crack characterization approaches using various acoustic features (capitalizing on the magnitude/amplitude-based and energy-based DIs in the time-frequency domain) are established by constructing different DIs from the extracted S0 mode signals of ultrasonic guided waves, which are used for online monitoring of the fatigue crack propagation quantitatively. The results reveal that the magnitude/amplitude-based and energy-based DIs of individual actuator–sensor paths are substantially restricted to characterize the fatigue crack with a size on the same order of the magnitude of the central wavelength or indicate fatigue crack propagation near the paths with high sensitivity. Subsequently, according to the weights of individual paths, a synthetic fusion scheme is developed to fuse all available DIs for all paths. Using the linear fused DIs and differential fused DIs in the time-frequency domain, a synthetic fusion DI scheme of different acoustic features is proposed, which can indicate the propagation of fatigue crack accurately. It is also clear that the stability and reliability of the fused DIs calculated by the acoustic features in the frequency domain are better than those in the time domain. Ultimately, it is important to realize that the linear and differential amplitude fusion DIs of a bogie plate-like structure in the frequency domain are more promising to characterize the crack propagation quantitatively than other fused ones.

Author Contributions

Conceptualization, H.J.; Data curation, H.J. and J.Y.; Formal analysis, H.J.; Methodology, H.J., W.L. and X.Q.; Project administration, X.Q.; Supervision, W.L.; Validation, H.J.; Writing—original draft, H.J.; Writing—review & editing, H.J., W.L. and X.Q.

Funding

This research was funded by the National Natural Science Research Foundation of China (Grant Numbers 11972314, 11774295) and Jiangsu Bide Science and Technology Co. Ltd.

Conflicts of Interest

The authors declare no conflict of interest.

References

  1. Campbell, F.C. Elements of Metallurgy and Engineering Alloys; ASM International: Cleveland, OH, USA, 2008. [Google Scholar]
  2. Kulkarni, S.S.; Achenbach, J.D. Structural health monitoring and damage prognosis in fatigue. Struct. Health Monit. 2008, 7, 37–49. [Google Scholar] [CrossRef]
  3. Su, Z.; Zhou, C.; Hong, M.; Cheng, L.; Wang, Q.; Qing, X. Acousto-ultrasonics-based fatigue damage characterization: Linear versus nonlinear signal features. Mech. Syst. Signal Proc. 2014, 45, 225–239. [Google Scholar] [CrossRef]
  4. Yang, B.; Zhao, Y.X. Experimental research on dominant effective short fatigue crack behavior for railway LZ50 axle steel. Int. J. Fatigue 2012, 35, 71–78. [Google Scholar] [CrossRef]
  5. Zhao, Y.X.; Yang, B. Scale-induced effects on fatigue properties of the cast steel for Chinese railway rolling wagon bogie frames. Adv. Mater. Res. 2010, 118–120, 59–64. [Google Scholar] [CrossRef]
  6. Kundu, T.; Das, S.; Jata, K.V. Health monitoring of a thermal protection system using Lamb waves. Struct. Health Monit. 2008, 8, 29–45. [Google Scholar] [CrossRef]
  7. Sohn, H.; Lee, S.J. Lamb wave tuning curve calibration for surface-bonded piezoelectric transducers. Smart Mater. Struct. 2009, 19, 15007–15012. [Google Scholar] [CrossRef]
  8. Mitra, M.; Gopalakrishnan, S. Guided wave based structural health monitoring: A review. Smart Mater. Struct. 2016, 25, 053001. [Google Scholar] [CrossRef]
  9. Hong, M.; Su, Z.; Lu, Y.; Sohn, H.; Qing, X. Locating fatigue damage using temporal signal features of nonlinear Lamb waves. Mech. Syst. Signal Proc. 2015, 60, 182–197. [Google Scholar] [CrossRef]
  10. Lim, H.J.; Sohn, H.; Kim, Y. Data-driven fatigue crack quantification and prognosis using nonlinear ultrasonic modulation. Mech. Syst. Signal Proc. 2018, 109, 185–195. [Google Scholar] [CrossRef]
  11. Qing, X.; Li, W.; Wang, Y.; Sun, H. Piezoelectric transducer-based structural health monitoring for aircraft applications. Sensors 2019, 19, 545. [Google Scholar] [CrossRef]
  12. Qing, X.P.; Beard, S.J.; Kumar, A.; Ooi, T.K.; Chang, F.K. Built-in sensor network for structural health monitoring of composite structure. J. Intel. Mater. Syst. Struct. 2006, 18, 39–49. [Google Scholar] [CrossRef]
  13. Xie, F.; Li, W.; Zhang, Y. Monitoring of environmental loading effect on the steel with different plastic deformation by diffuse ultrasound. Struct. Health Monit. 2018, 18, 602–609. [Google Scholar] [CrossRef]
  14. Ostachowicz, W.; Kudela, P.; Malinowski, P.; Wandowski, T. Damage localisation in plate-like structures based on PZT sensors. Mech. Syst. Signal Proc. 2009, 23, 1805–1829. [Google Scholar] [CrossRef]
  15. Kundu, T.; Nakatani, H.; Takeda, N. Acoustic source localization in anisotropic plates. Ultrasonics 2012, 52, 740–746. [Google Scholar] [CrossRef]
  16. Michaels, J.E. Detection, localization and characterization of damage in plates with an in situ array of spatially distributed ultrasonic sensors. Smart Mater. Struct. 2008, 17, 035035. [Google Scholar] [CrossRef]
  17. Koh, Y.L.; Chiu, W.K.; Rajic, N. Effects of local stiffness changes and delamination on Lamb wave transmission using surface-mounted piezoelectric transducers. Compos. Struct. 2002, 57, 437–443. [Google Scholar] [CrossRef]
  18. Wu, Z.; Qing, X.P.; Chang, F.K. Damage detection for composite laminate plates with a distributed hybrid PZT/FBG sensor network. J. Intel. Mat. Syst. Struct. 2009, 20, 1069–1077. [Google Scholar]
  19. Ramadas, C.; Balasubramaniam, K.; Joshi, M.; Krishnamurthy, C.V. Interaction of guided Lamb waves with an asymmetrically located delamination in a laminated composite plate. Smart Mater. Struct. 2010, 19, 065009. [Google Scholar] [CrossRef]
  20. Li, D.; Kuang, K.S.C.; Koh, C.G. Fatigue crack sizing in rail steel using crack closure-induced acoustic emission waves. Meas. Sci. Technol. 2017, 28, 065601. [Google Scholar] [CrossRef]
  21. Gagar, D.; Foote, P.; Irving, P. A novel closure based approach for fatigue crack length estimation using the acoustic emission technique in structural health monitoring application. Smart Mater. Struct. 2014, 23, 105033. [Google Scholar] [CrossRef]
  22. Ihn, J.B.; Chang, F.K. Detection and monitoring of hidden fatigue crack growth using a built-in piezoelectric sensor/actuator network: II. Validation using riveted joints and repair patches. Smart Mater. Struct. 2004, 13, 621–630. [Google Scholar] [CrossRef]
  23. Masserey, B.; Fromme, P. Fatigue crack growth monitoring using high-frequency guided waves. Struct. Health Monit. 2013, 12, 484–493. [Google Scholar] [CrossRef] [Green Version]
  24. Qiu, L.; Yuan, S.; Bao, Q.; Mei, H.; Ren, Y. Crack propagation monitoring in a full-scale aircraft fatigue test based on guided wave-Gaussian mixture model. Smart Mater. Struct. 2016, 25, 055048. [Google Scholar] [CrossRef]
  25. Zhou, C.; Su, Z.; Cheng, L. Probability-based diagnostic imaging using hybrid features extracted from ultrasonic Lamb wave signals. Smart Mater. Struct. 2011, 20, 125005. [Google Scholar] [CrossRef]
  26. Migot, A.; Bhuiyan, Y.; Giurgiutiu, V. Numerical and experimental investigation of damage severity estimation using Lamb wave-based imaging methods. J. Intel. Mater. Syst. Struct. 2019, 30, 618–635. [Google Scholar] [CrossRef]
  27. Li, W.; Cho, Y.; Achenbach, J.D. Detection of thermal fatigue in composites by second harmonic Lamb waves. Smart Mater. Struct. 2012, 21, 85–93. [Google Scholar] [CrossRef]
  28. Yan, J.; Jin, H.; Sun, H.; Qing, X. Active Monitoring of Fatigue Crack in the Weld Zone of Bogie Frames Using Ultrasonic Guided Waves. Sensors 2019, 19, 3372. [Google Scholar] [CrossRef] [PubMed]
  29. Zhu, J.; Wang, Y.; Qing, X. Modified electromechanical impedance-based disbond monitoring for honeycomb sandwich composite structure. Compos. Struct. 2019, 217, 175–185. [Google Scholar] [CrossRef]
  30. Zhou, C.; Su, Z.; Cheng, L. Quantitative evaluation of orientation-specific damage using elastic waves and probability-based diagnostic imaging. Mech. Syst. Signal Proc. 2011, 25, 2135–2156. [Google Scholar] [CrossRef]
  31. Magdalena, P. Spectral Methods for Modelling of Wave Propagation in Structures in Terms of Damage Detection—A Review. Appl. Sci. 2018, 8, 1124. [Google Scholar]
Figure 1. Dispersion curves of ultrasonic guided waves in an SMA490BW steel plate (a) Phase velocity curves; (b) Group velocity curves.
Applsci 09 04254 g001
Figure 2. Experimental setup of an SMA490BW steel plate (a) The experimental equipment and specimen; (b) Schematic diagram of the specimen.
Applsci 09 04254 g002
Figure 3. The measured impedance of PZT-5A by a WK-6500B impedance instrument.
Applsci 09 04254 g003
Figure 4. The 270 kHz excitation signals of five-cycle sinusoidal tone bursts modulated by Hanning-windowed (a) Excitation signal; (b) Excitation spectrum signal.
Applsci 09 04254 g004
Figure 5. The magnitude and energy damage indexes (DIs) of different sampling points in the time domain (a) Normalized magnitude-based DIs; (b) Normalized energy-based DIs.
Applsci 09 04254 g005
Figure 6. The amplitude and energy DIs of different sampling points in the frequency domain (a) Normalized amplitude-based DIs; (b) Normalized energy-based DIs.
Applsci 09 04254 g006
Figure 7. The magnitude of measured signals with different actuator–sensor paths in the time domain (a) A1−S4, A2−S5, and A3−S6 paths; (b) A2−S4, A2−S5, and A2−S6 paths.
Applsci 09 04254 g007
Figure 8. The magnitude and energy DIs of different actuator–sensor paths in the time domain (a) Normalized magnitude-based DIs of the A1−S4, A2−S5, and A3−S6 paths; (b) Normalized energy-based DIs of the A1−S4, A2−S5, and A3−S6 paths; (c) Normalized magnitude-based DIs of the A2−S4, A2−S5, and A2−S6 paths; (d) Normalized energy-based DIs of the A2−S4, A2−S5, and A2−S6 paths.
Applsci 09 04254 g008
Figure 9. The amplitude of signals with different actuator–sensor paths in the frequency domain (a) A1−S4, A2−S5, and A3−S6 paths; (b) A2−S4, A2−S5, and A2−S6 paths.
Applsci 09 04254 g009
Figure 10. The amplitude and energy DIs of different actuator–sensor paths in the frequency domain (a) Normalized magnitude-based DIs of A1−S4, A2−S5, and A3−S6 paths; (b) Normalized energy-based DIs of A1−S4, A2−S5, and A3−S6 paths; (c) Normalized magnitude-based DIs of A2−S4, A2−S5, and A2−S6 paths; and (d) Normalized energy-based DIs of A2−S4, A2−S5, and A2−S6 paths.
Applsci 09 04254 g010
Figure 11. The magnitude and energy DIs of different fusion methods in the time domain (a) Linear and differential fusion magnitude DIs; (b) Linear and differential fusion energy DIs; (c) Differential fusion of magnitude-energy DIs; and (d) Linear fusion of magnitude-energy DIs.
Applsci 09 04254 g011
Figure 12. The amplitude and energy DIs of different fusion methods in the frequency domain (a) Linear and differential fusion amplitude DIs; (b) Linear and differential fusion energy DIs; (c) Differential fusion of amplitude-energy DIs; (d) Linear fusion of amplitude-energy DIs.
Applsci 09 04254 g012
Table 1. Material parameters of the SMA490BW steel plate.
MaterialD (mm) ρ ( k g / m 3 ) f (kHz)E (Gpa)G (Gpa) υ
SMA490BW3785027021080.70.3
Table 2. Chemical composition of the SMA490BW steel plate.
MaterialCSiMnPSCrNiCuOther
SMA490BW0.180.651.40.0350.750.750.300.50.15
Table 3. The correlation coefficients of various acoustic features.
Correlation CoefficientsTime Domain AnalysisFrequency Domain Analysis
Linear magnitude/amplitude0.975290.9806
Differential magnitude/amplitude0.972840.97793
Linear energy0.941540.96643
Differential energy0.858930.96573
Table 4. The mean squared error of various acoustic features.
Mean Squared ErrorTime Domain AnalysisFrequency Domain Analysis
Linear magnitude/amplitude0.006820.00384
Differential magnitude/amplitude0.005540.00445
Linear energy0.014910.00577
Differential energy0.00640.00589

