Article

The Relationships between Somatic Cells and Isoleucine, Leucine and Tyrosine Content in Cow Milk

by
Federica Ianni
1,
Paola Sechi
2,
Alessandro La Mantia
3,
Lucia Pucciarini
1,
Emidio Camaioni
1,
Beniamino T. Cenci Goga
2,*,
Roccaldo Sardella
1,* and
Benedetto Natalini
1
1
Department of Pharmaceutical Sciences, University of Perugia, Via Fabretti 48, 06123 Perugia, Italy
2
Department of Veterinary Medicine, University of Perugia, Via San Costanzo 4, 06126 Perugia, Italy
3
School of Advanced Studies, University of Camerino, Via Camillo Lili 55, 62032 Camerino, Italy
*
Authors to whom correspondence should be addressed.
Appl. Sci. 2019, 9(2), 349; https://doi.org/10.3390/app9020349
Submission received: 10 December 2018 / Revised: 17 January 2019 / Accepted: 18 January 2019 / Published: 21 January 2019
(This article belongs to the Section Chemical and Molecular Sciences)

Abstract

:

Featured Application
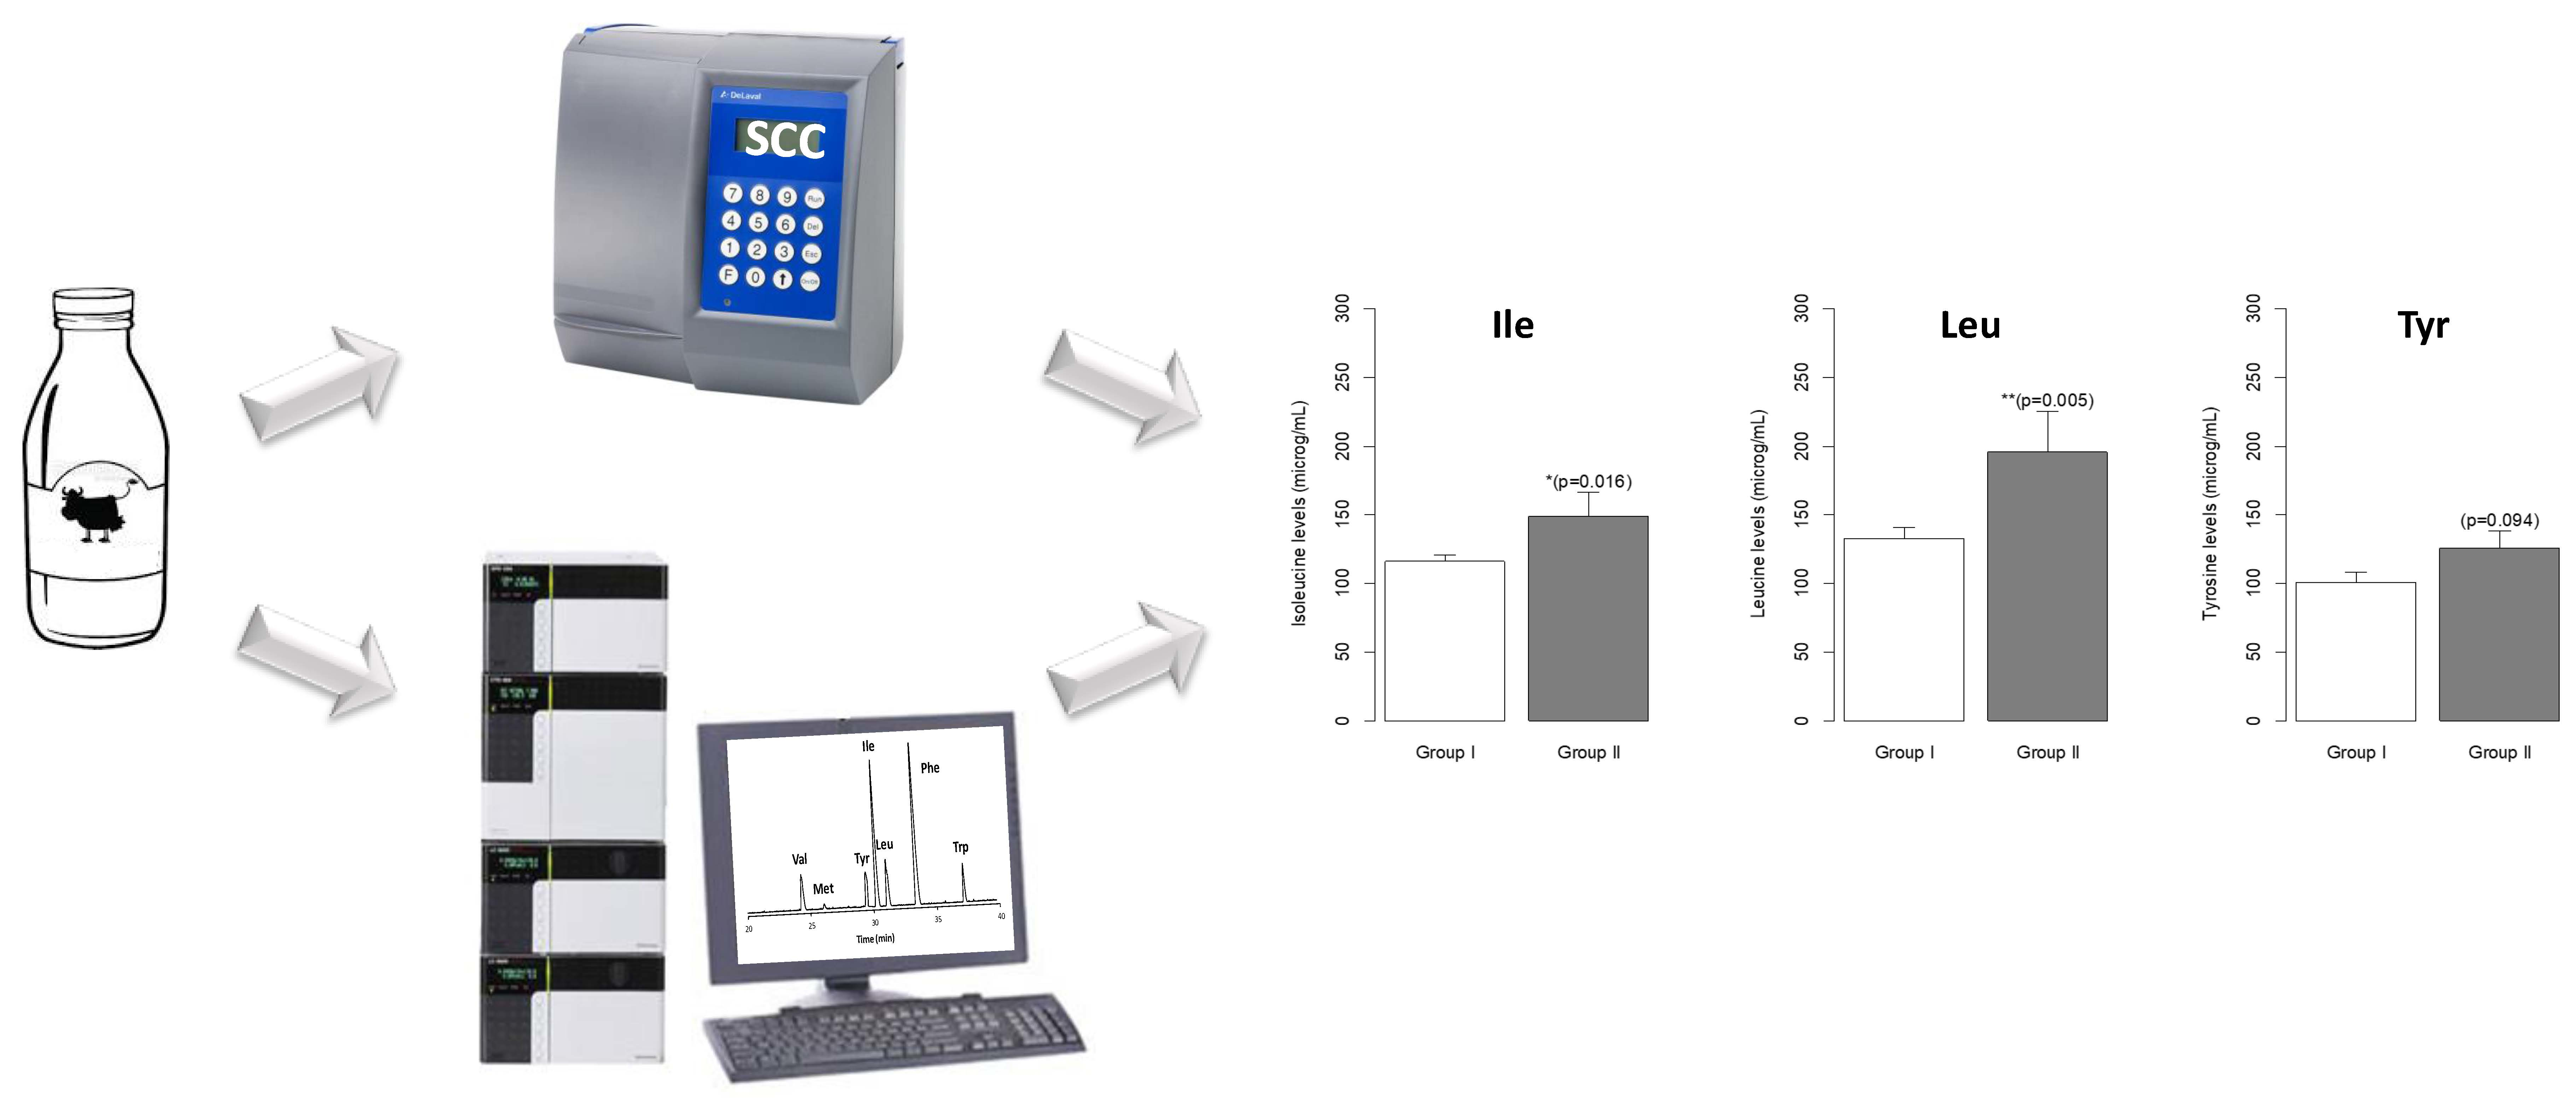
Monitoring the levels of the amino acids isolecucine, leucine, and tyrosine could represent a new potential tool for a rapid diagnosis of subclinical mastitis in cows and hence to qualify cow milk in association with the traditional somatic cell count-based method.

Abstract

The early diagnosis of cow subclinical mastitis represents a pivotal factor for a prompt and adequate animal treatment. Although several methods are available, the somatic cells count (SCC) still remains the elective test directly carried out on milk samples. In mastitis affected cows (even at subclinical stages), altered concentrations of specific metabolites, including free amino acids, is a well-known occurrence. In order to define the relationships between the variation of the unbound amino acids content with the SCC value, a direct ion-pairing reversed-phase method based on the use of the evaporative light-scattering detector (IP-RP-HPLC-ELSD) was applied to 65 cow milk samples. The statistical analysis of variance (ANOVA) was pursued in order to find a correlation between the SCC value and the concentration of isoleucine (Ile), leucine (Leu), valine (Val) and tyrosine (Tyr). Samples were divided in two groups according to their SCC value: Group I comprised all ones with SCC < 400,000 cells/mL; Group II encompassed those with a SCC > 400,000 cells/mL. Statistical analyses highlighted significant differences in the content of the branched-chain amino acids Ile and Leu, between the two groups (p < 0.02* and <0.005**, respectively). This study confirms that a dysmetabolism of certain free amino acids parallels elevated SCC values.

Graphical Abstract

1. Introduction

Mastitis is a major endemic disease of dairy animals, characterized by the inflammation of all structures forming the mammary tissue and the surrounding connective tissues. Mastitis significantly influences the quality and quantity of mammary parenchyma, leading to pathological changes in the glandular tissue of the udder and inducing physical, chemical and bacteriological alteration in the milk [1,2]. Mastitis occurs worldwide with a high incidence and has various underlying causes and severity degrees which reduce milk production and adversely impact on farm animal welfare. Several bacterial species have been identified as mastitis-causing pathogens; among others, Escherichia coli, Streptococcus uberis, Staphylococcus aureus, Streptococcus agalactiae, are worth being mentioned [3,4,5,6]. Bacterial contamination of milk from the affected cows renders it unsuited to human consumption as it can provide a spread of diseases like tuberculosis, Q-fever and brucellosis, just to cite some [3]. In this scenario, the early diagnosis of mastitis, especially at its subclinical stages, becomes a pivotal factor for a prompt treatment of the animal, thus minimizing mammary lesions and the related consequences. While clinical mastitis can be readily diagnosed from either abnormality in milk flavour, taste and colour or through the occurrence of secondary clinical signs (such as swollen quarters), the diagnosis of subclinical states is more problematic. Indeed, in the latter case, clinical signs are not evident (milk appears normal) and the use of specific tests is required for effective detection [3,7,8]. Although several methods have been so far developed for rapid diagnosis of subclinical mastitis [9], the somatic cells count (SCC) still remains the elective test carried out on milk samples to recognize early stage of intramammary infections. Generally, elevated SCC values indicate low milk quality and might be prognostic for further aggravation.
The results of many studies [3,10,11] suggest that cows with milk SCC levels lower than 200,000 have not been infected with major mastitis pathogens (namely, Staphylococcus aureus and Streptococcus agalactiae), while SCC values above 300,000 cells/mL are sign of probable infection.
However, about 15% of infected cows have SCC milk levels < 200,000 cells/mL, thus behaving as false negative samples. At the same time, a quite relevant percentage (about 15%) of uninfected milk samples is misclassified according to SCC, indicating the potential occurrence of false positives [3]. EU Regulation 98 (Regulation (EC) No 853/2004 of the European Parliament and of the Council of 29 April 2004 laying down specific hygiene rules for food of animal origin) stipulates that food business operators must initiate procedures to ensure that raw milk meets the following criteria: plate count at 30 °C ≤ 100,000 colony forming unit (cfu)/mL and SCC ≤ 400,000 cells/mL.
The concept that metabolite concentrations change during mastitis (even at a subclinical stage) is well-known [7,12]. Accordingly, in previous studies [13,14,15,16] it was found that total amino acid content significantly increases in mastitis milk compared to normal, with a particular enhancement in the content of some specific species, including branched-chain and aromatic amino acids (referred to as BCAAs and AAAs, respectively). In these studies, indirect reversed-phase (RP) chromatography methods based on the use of derivatizing reagents were applied. It is well established that indirect method can incur into misquantification of the actual amino acid content, as a consequence of the required multi-step derivatization processes. Indeed, for different amino acids, derivatization reaction can go to completion in a different time; the high purity of the derivatizing reagent is critical since the presence of impurities (along with the excess of the derivatizing reagent itself) can generate side products that could interfere with separation; derivatization can be time consuming.
In an attempt to define the relationships between SCC and the concentration of isoleucine (Ile), leucine (Leu), valine (Val) and tyrosine (Tyr) in milk, a direct ion-pairing reversed-phase method based on the use of the evaporative light-scattering detector (IP-RP-HPLC-ELSD) was applied to 65 cow milk samples.

2. Materials and Methods

2.1. Chemicals and Reagents

Analytical grade acetonitrile (ACN), hydrochloric acid (HCl), picric acid, were purchased from Carlo Erba (Bologna, Italy). Heptafluorobutyric acid (HFBA), ammonia solution (NH4OH), Dowex 50WX2 ion-exchange resin (100–200 mesh, 2% linking) and all the underivatized amino acid standards were purchased from Sigma-Aldrich (Milano, Italy). Water for HPLC analysis was purified with a New Human Power I Scholar water purification system (Human Corporation, Seoul, Korea). The employed eluent components (see caption to Figure 1 for details) were degassed with 20 min sonication before use. The 65 milk samples were kindly provided by a local farm and classified according to the SCC value by the provincial cattle breed associations of Perugia (Associazione Provinciale Allevatori, APA, Perugia, Italy).

2.2. Instrumentation

The HPLC measurements were made on a Shimadzu (Kyoto, Japan) LC-20A Prominence, equipped with a CBM-20A communication bus module, two LC-20AD dual piston pumps, an SPD-M20A photodiode array detector and a Rheodyne 7725i injector (Rheodyne Inc., Cotati, CA, USA) with a 20 μL stainless steel loop. A Varian 385-LC evaporative light scattering detector (ELSD) (Agilent Technologies, Santa Clara, CA, USA) was utilized to follow the HPLC analyses. The analogue-to-digital conversion of the output signal from the ELSD was allowed by a common interface device. The adopted ELSD conditions for the analysis were: 30 °C nebulisation temperature, 50 °C evaporation temperature, 1 L/min gas flow rate (air) and 1 as the gain factor.
A Prevail RP18 column (Grace, Sedriano, Italy) (250 mm × 4.6 mm i.d., 5 μm, 110Å pore size), was used as the analytical column for the HPLC analysis. The flow rate was fixed at 0.7 mL/min. Column temperature was fixed at 25 °C, through a Grace (Sedriano, Italy) heater/chiller (Model 7956R) thermostat.

2.3. Milk Sampling

All tests were performed on 65 samples collected at a dairy farm during the monthly control of the APA dairy farmers. The dairy farm of choice has 300 lactating Holstein Friesian cows and is located in central Umbria region, Italy. Average milk production is 30.2 kg/day, all sampled cows were in their second or third lactation and between week-10 and weel-12 of lactation. Samples from composite quarter collection of individual mastitis cows were transported to the laboratory and then frozen at −80 °C prior to further analysis.
The sample size was calculated using the formula n = Z2 * p * (1 − p)/C2, where Z is the Z-value (e.g., 1.96 for a 95% confidence level), p is the expected prevalence, expressed as a decimal and C is the confidence interval, expressed as a decimal [17]. With an expected prevalence of 50% (0.5), a confidence interval of 10 and a confidence level of 0.95 a sample size of 63 animals is then required. With 300 lactating cows in the farm, the sample size provides a 95% confidence level (CL) for cow-level prevalence, with a confidence interval (CI) of 10.

2.4. Somatic Cells Count

SCCs were measured at the APA laboratory using a DeLaval cell counter according to the manufacturer’s instruction (Cell counter DCC; DeLaval, Tumba, Sweden). 60 µL of sample were aspirated into a small cassette that contained a DNA-specific fluorescent reagent that bound to the SCC nuclei. The machine counted the fluorescent SCC nuclei in milk using an integrated digital camera.

2.5. Extraction of Free Amino Acids from the Raw Milk Sample

Raw milk (100 mL) and 96% EtOH (200 mL) were kept under stirring for 30 min and centrifuged at 4000 rpm for 30 min at 25 °C. The supernatant was evaporated to a volume of approximately 25 mL in vacuum at 40 °C and both a saturated solution of picric acid in water (25 mL) and a 0.1 M HCl solution (25 mL) were added. The formed precipitate was removed by centrifugation at 4000 rpm for 10 min at 25 °C and the supernatant was purified with an ion-exchange Dowex 50WX2 resin (1 cm × 14 cm, 100–200 mesh, 2% linking). Elution was carried out with a 2.0 M NH4OH solution (45 mL). The eluate containing the extracted amino acid pool was frozen and lyophilized. The extracts were then assayed by using a previously developed ion-pairing IP-RP-HPLC method [18]. For the HPLC analysis, each lyophilized extract was solubilized into a 7.0 mM HFBA/ethanol solution (85:15, v/v), at a final concentration of 20 mg/mL. Prior to chromatographic runs, undissolved debris were precipitated by centrifugation at 4000 rpm for 15 min at 25 °C. Thereafter, the supernatant was analysed.

2.6. Statistical Methods

Statistical analyses were performed with the aid of the open source software CRAN-R version 3.3.0. (http://www.R-project.org) [19]. One-way ANOVA (Analysis of Variance) was used as a statistical test to assess the differences in means between the groups. Tukey’s HSD (Honest Significant Difference) methodology, at confidence level of 95%, was further employed for multiple comparisons between all pair-wise means to determine how they differ [20]. p < 0.05 was considered statistically significant.

3. Results and Discussion

APA preliminarily measured the SCC value in all 65 milk samples under investigation. Samples were then divided into two groups according to EU Regulation 853/2004 indications: Group I composed of milk samples with SCCs < 400,000 cells/mL (Table 1) and Group II encompassing samples with SCCs > 400,000 cells/mL (Table 2).
In order to directly appraise the relationships between the incidental alterations of the amino acid content with the SCC value, the free (unbound) amino acid pool was extracted from each of the 65 milk samples and then submitted to purification through an ion-exchange resin, as described in Section 2.5. A direct ion-pairing reversed-phase method based on the use of the evaporative light-scattering detector (IP-RP-HPLC/ELSD) was applied for the analysis of the milk extracts. The method was previously developed in our laboratory and profitably employed for the direct analysis of amino acids in complex food matrices [18,21]. Detailed information on the method is reported in the caption to Figure 1. The use of HFBA as IP reagent increases the residence time of the investigated polar analytes into the RP column, thereby enhancing the quality (both thermodynamic and kinetic) of the chromatographic performance as a whole. Moreover, differently from other perfluoroalkyl carboxylic acids, HFBA containing eluents give the advantage to avoid prolonged re-equilibration times between consecutive runs [18] as a result of its negligible adsorption onto the C18 chains. As an additional benefit arising from HFBA use, its volatility makes it compatible with mass spectrometry detectors for accurate molecular investigations. The chromatogram of an extract is exemplarily shown in Figure 1.
As expected [18,21], the selected IP-RP-HPLC-ELSD method, produced the co-elution of Ala/Glu and Ser/Asn (data not shown). Moreover, interfering matrix effects were found in the first 18 min of each sample analysis, thus impairing the detection of certain amino acids (data not shown). Therefore, the attention was exclusively addressed to all the remaining species eluting after 20 min of analysis: Val, Met, Tyr, Ile, Leu, Phe, Trp (Figure 1A). The elution order observed in Figure 1A is not readily explained as it is strictly correlated to analyte charge and polarity at once [18]. The chromatogram in Figure 1B reveals a pronounced selectivity and efficiency of the applied HPLC method towards the selected amino acid pool. Notwithstanding, the selected IP-RP-HPLC method allowed the base-line separation of the two isomers Ile and Leu. Quantitative analysis of Met, Phe and Trp was made difficult by their undetectable level in the majority of milk samples. Therefore, these three amino acids were overlooked in the study. For the remaining species (namely, the BCAAs and Tyr), the result of the quantitative analysis in the 65 extracts is shown in Table 1 and Table 2.
In order to find a relationship between the SCC value associated to each milk sample and the concentration of Ile, Leu, Val and Tyr, the statistical method based on the analysis of variance (ANOVA) was pursued. Indeed, bar plot analysis coupled with ANOVA studies and Tukey HSD (honest significant difference) tests, were useful to highlight differences in the amino acid content among the main two groups (I and II) of the analysed 65 milk samples (Table 1 and Table 2). More in depth, this analysis evidenced some statistically significant differences in the content of Ile, Leu and Tyr between the two milk sample groups. Notwithstanding, this represents the first study in which a direct chromatographic method has revealed a statistically significant difference of the content of Ile and Leu between the two established groups, with p = 0.016 and 0.005, respectively (Figure 2A,B), whereas, the content of Tyr was only slightly different in the two groups (p = 0.094, Figure 2C). On the other hand, the difference of the Val levels between the two groups was not statistically significant.
Furthermore, the bivariate Pearson correlation analysis between amino acid content and SCC value was also performed. A positive Pearson’s correlation coefficient, r, was found for Ile (0.397), Leu (0.495) and Tyr (0.348), standing for a positive correlation between the two variables. On the contrary, correlation was missed in the case of Val (0.055). On the basis of this result, only a moderate correlation was found for Ile, Leu and Tyr content versus SCC value.
Taking into account these results, we can argue that the content level of the BCAAs Ile and Leu is significantly altered with the occurrence of mastitis.
The observed alteration of BCAAs levels is anything but surprising. Indeed, an increasing number of metabolomic investigations clearly demonstrate that BCAAs can be potential biomarkers of disease [22,23]. Accordingly, several recent studies reveal that BCAAs are biomarkers associated with insulin resistance [24,25], risk of cardiovascular disease [26], stage I and II chronic kidney disease [27] and ischemic stroke [28]. The level of BCAAs discriminates lean from obese individuals and has the potential to predict populations at risk for cardiometabolic disease, type 2 diabetes as well as mortality from ischemic heart disease. Additionally, it has been found that BCAAs levels for patients with hepatitis B virus infection vary depending on the degree of liver damage. Furthermore, serum levels of BCAAs have been observed to decrease in patients with liver cirrhosis. Also interestingly, serum BCAAs to His ratios have been found to be significantly associated with knee osteoarthritis.

4. Method Validation
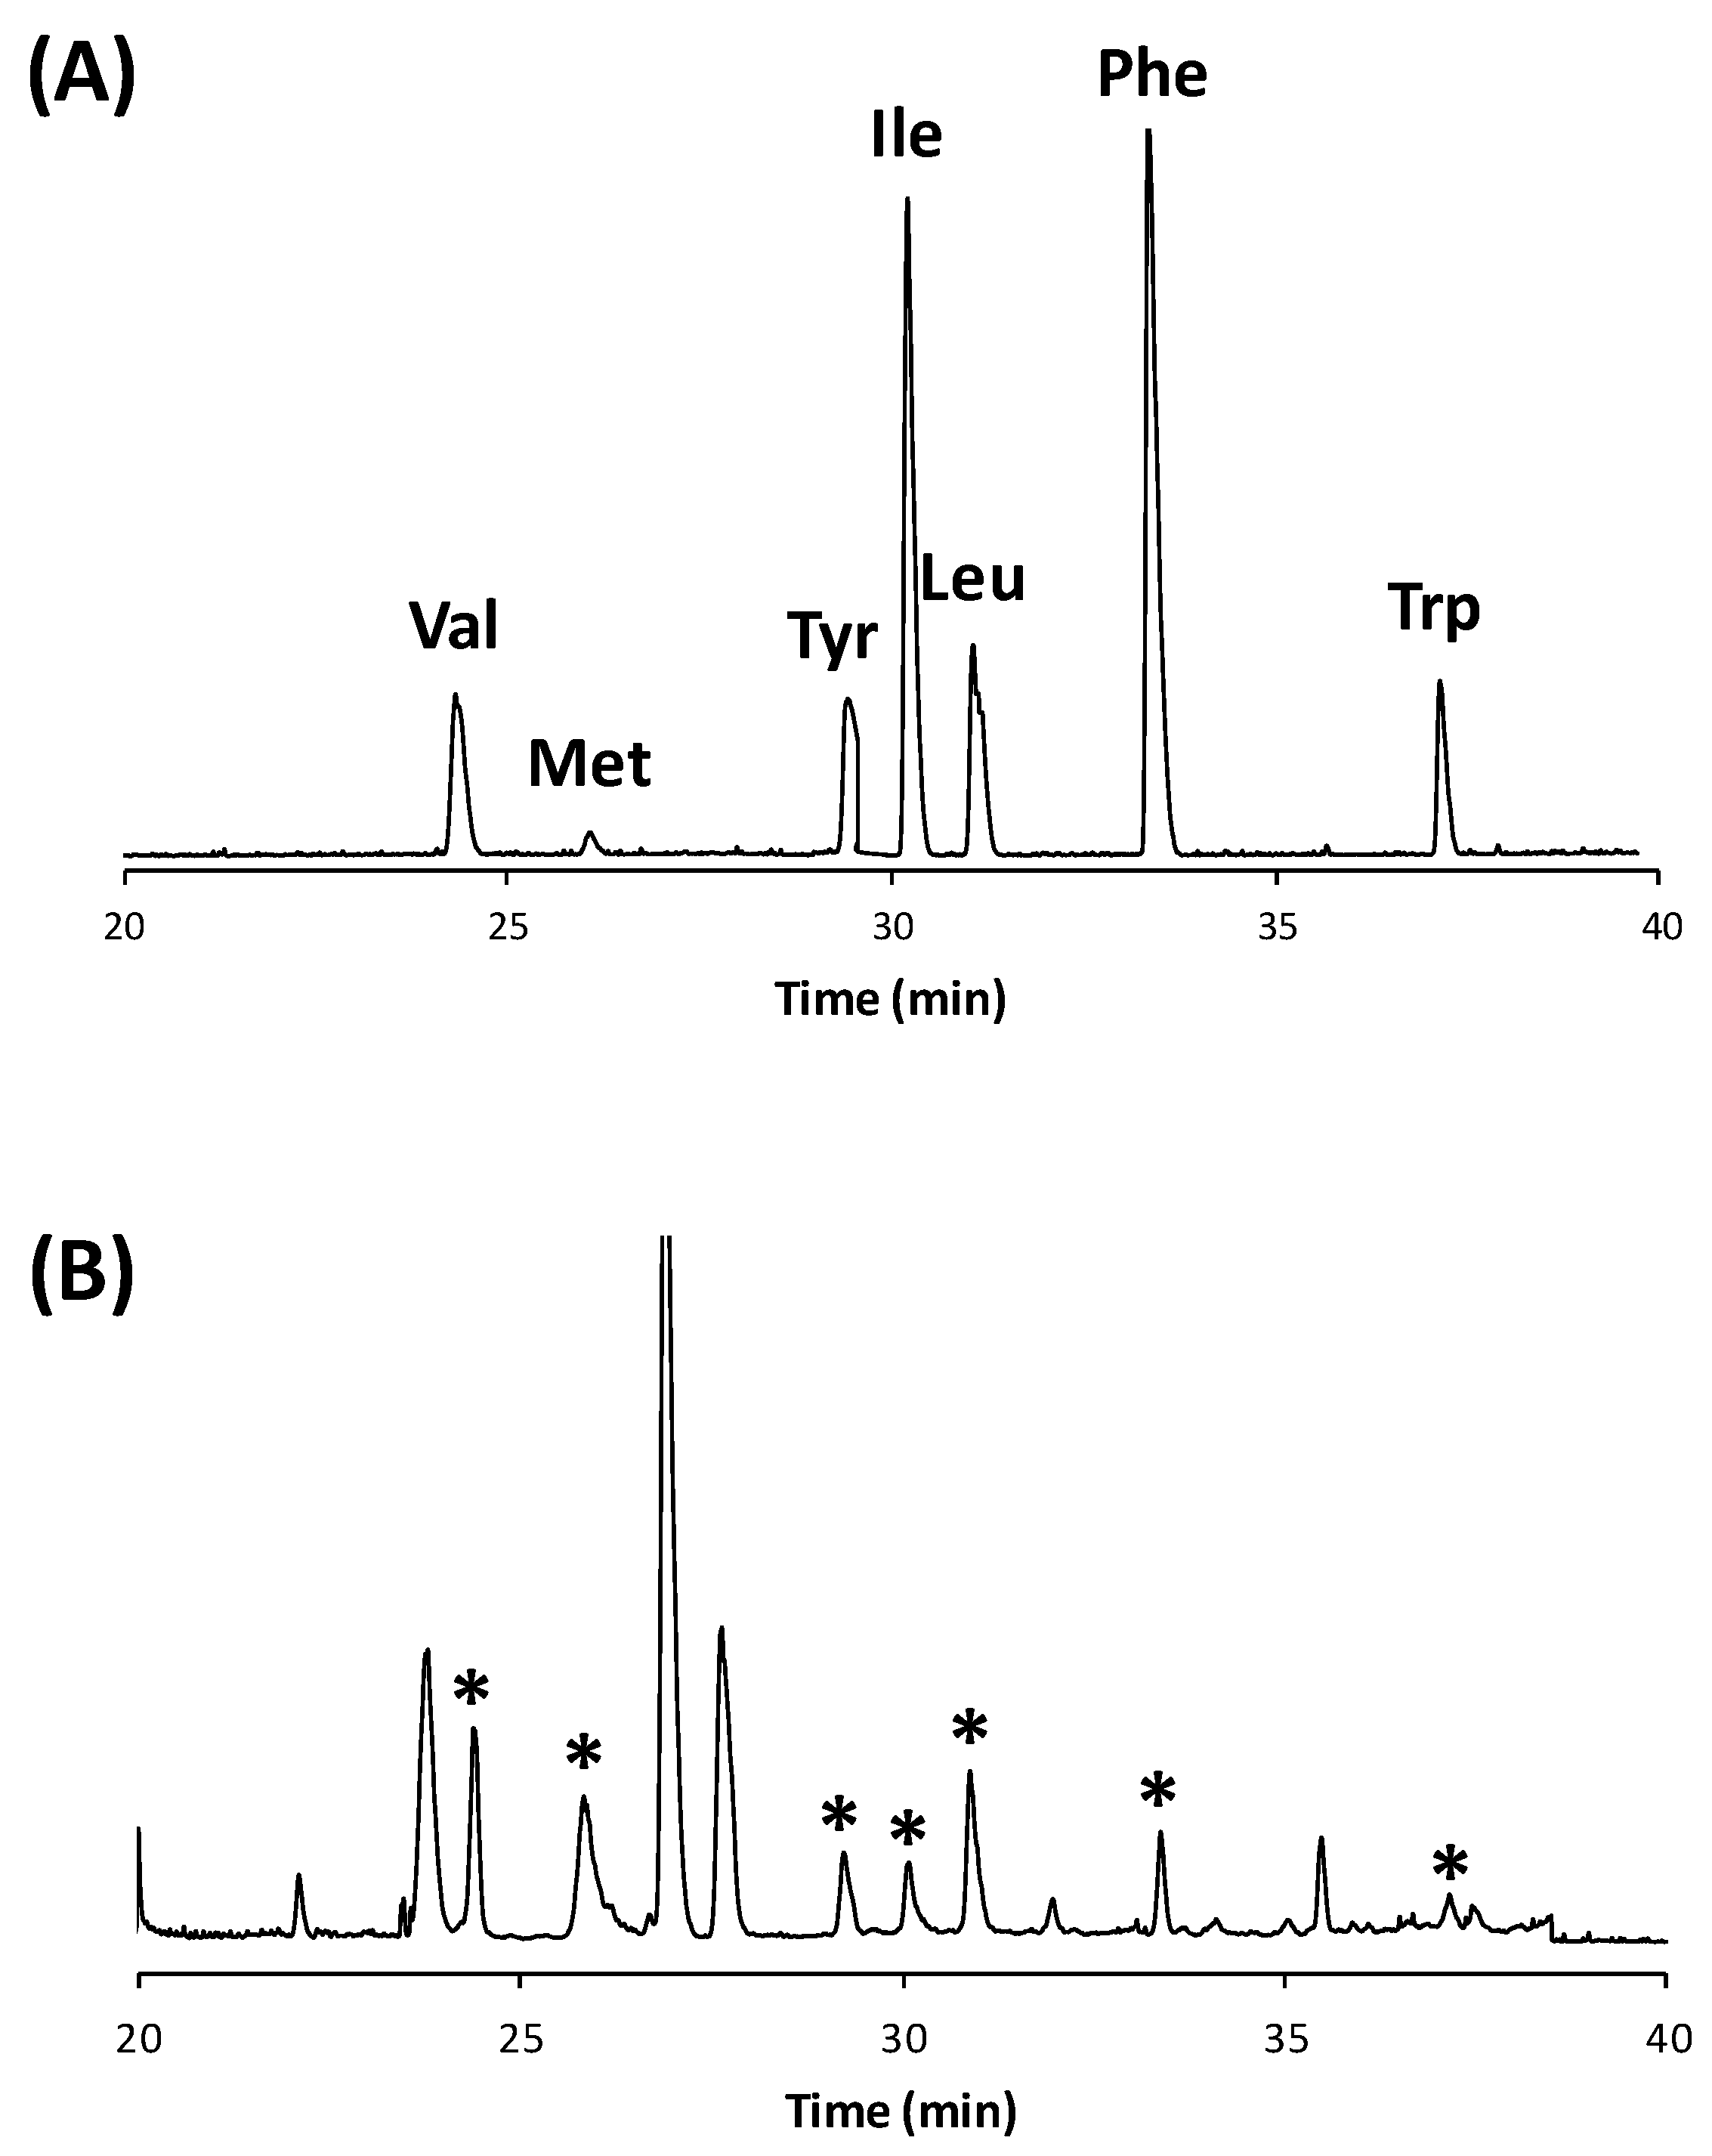
4.1. Selectivity

Aimed at identifying the presence of interference peaks within the investigated analysis time, three chromatograms of the selected solvent blank (namely the eluent system) were consecutively run. For the developed HPLC method, the peaks obtained (with very small areas in arbitrary units) did not overlap those corresponding to the two main peaks of the investigated analytes. Moreover, very appreciable separation (α) and resolution factor (RS) values between the peaks from each analyte (Table 3) were achieved with the selected eluent system. On this basis, the established method can be regarded as highly selective for the purpose of the present study.

4.2. Linearity

Ile, Leu, Tyr and Val content in the analysed 65 milk samples was established by relying upon four calibration curves, respectively built by using amino acid standard solutions with concentration values spanning in the range reported in Table 4. In contrast to conventional UV-Vis detectors, peak area values from ELSDs (A, the dependent y-variable) are correlated to the corresponding analyte concentrations (C, the independent x-variable) by a well-established exponential curve [29,30]. This holds true when rather wide concentration ranges are considered, which is the case of the present study. However, linear correlations are sometimes observed, especially when relatively narrow intervals are considered [31,32].
Regression Equations 1–4 reported in Table 4 were obtained after the following log-log transformation. The four linear curves were characterized by appreciable R2 values, spanning within the range 0.987–0.993. All the calibration standards were analysed in triplicate and the average value of the corresponding peak area utilized to build-up the regression lines.
In order to assess the quality of the developed HPLC method, a validation study on Leu (selected as parent analyte) was carried out.

4.3. Intra-Day and Inter-Day Precision and Accuracy

The IP-RP-HPLC/ELSD method was validated using two Leu external control solutions as fully described in Reference [21]. In the following paragraphs, a brief summary of the results is reported.
The developed chromatographic method was validated in terms of precision and accuracy, in both the short- (intra-day) and the long-term (inter-day) period.
The intra-day precision was assessed by using the regression Equation 2 reported in Table 4. Two control solutions used as external set were run in triplicate each day, for three consecutive days. Equation 2 was then used to calculate the concentrations of the control solutions. The intra-day precision was determined as the relative standard deviation (RSD%) among the concentration values achieved from consecutive injections. An appreciable precision of the method was obtained in the short-period, with RSD% values ranging from 1.05 to 9.5%, thus producing evidence on the good stability of the employed analytical method. The resulted rather high RSD% value (that is, 9.5%) can be ascribed to the so-called “detector fatigue” [21,33]. Indeed, a progressive reduction in the output stability after a prolonged use is a rather common issue with ELSDs.
For each control solution, the variation within replicate injections performed during the three-consecutive days of analysis (which means a total of nine injections) was used to calculate the inter-day precision. In this case, more than acceptable RSD% values, equal to 6.72 and 7.13%, were respectively found in the long-term (inter-day) of analysis for the higher and lower concentrated control solutions.
The Recovery% [34] was employed as test to estimate the accuracy of the applied IP-RP HPLC-ELSD method. Intra-day and inter-day accuracy were determined with the same external solutions previously used to apprise the precision. The short-term accuracy was determined by considering the three replicated runs for each control solution within a single day. In order to evaluate the long-term accuracy, the average value from nine determinations, along three consecutive days of analysis, was considered. Acceptable percentages of recovery were obtained, ranging from 89.38 up to 107.28% in the case of the intra-day analyses. Recovery% values, equal to 93.61 and 102.46%, were obtained for the lower and higher concentrated control solutions, respectively.

5. Conclusions

Molecular content of milk has been thoroughly investigated with different methods and techniques [35,36,37]. Most of these studies have been addressed to the evaluation of lipids [35], proteins [36] and peptides [37]. Instead, only few investigations have focused on the measure of free unbound amino acids [15], most of which relied upon the application of indirect methods. In the present work, a direct RP-HPLC-ELSD method based on the use of the HFBA as the IP agent was successfully applied for the direct analysis of the unbound amino acid content in 65 milk samples.
Milk samples were divided in two groups according to their characteristic SCC value: Group I comprised all ones with SCCs < 400,000 cells/mL; instead, Group II encompassed those having a SCC value > 400,000 cells/mL. Very interestingly, the application of the ANOVA and Tukey HSD studies shed light on some statistically significant differences in the content of the BCAAs Ile, Leu, between the two groups (p < 0.02* and <0.005**, respectively).
Although a relationship was found to some extent between SCC value and isoleucine, leucine and tyrosine content in cow milk, questions remain regarding the biochemical mechanisms underlying this occurrence. Based on these evidences, it is clear that there could be a great deal of clinical value in monitoring Ile and Leu levels in milk. Indeed, the two BCAAs could represent a new potential tool for a rapid diagnosis of subclinical mastitis in cows and hence to qualify cow milk in association with the traditional SCC-based method.
A future study will be carried out on a larger number of milk samples to assess the concrete possibility to use the chromatographic method for diagnostic purposes. In this setting, polymerase chain reaction (PCR) investigations will be performed in order to evaluate the relationship between the actual mastitis caused by different contagious and environmental bacteria to the level of isoleucine, leucine and tyrosine. These studies will be performed with the further intent to highlight the occurrence of false positive and false negative results sometimes associated with SCC analysis.

Author Contributions

Conceptualization, R.S. and B.T.C.G.; Milk sampling, P.S.; Chromatographic analysis, F.I. and A.L.M.; Method validation, F.I. and L.P.; Statistical methods, E.C.; Writing—Original Draft Preparation, F.I. an E.C.; Writing—Review and Editing, R.S. and E.C. Supervision, B.N.; Project Administration, B.T.C.G. and R.S.

Funding

This research received no external funding.

Acknowledgments

The authors acknowledge the Associazione Provinciale Allevatori, APA (Perugia, Italy) for the SCC analyses.

Conflicts of Interest

The authors declare that they have no conflict of interest.

References

  1. Bradley, A.J. Bovine Mastitis: An Evolving Disease. Vet. J. 2002, 164, 116–128. [Google Scholar] [CrossRef] [PubMed]
  2. Gruet, P.; Maincent, P.; Berthelot, X.; Kaltsatos, V. Bovine mastitis and intramammary drug delivery: Review and perspectives. Adv. Drug Deliv. Rev. 2001, 50, 245–259. [Google Scholar] [CrossRef]
  3. Sharma, N.; Singh, N.K.; Bhadwal, M.S. Relationship of Somatic Cell Count and Mastitis: An Overview. Asian-Australas. J. Anim. Sci. 2011, 24, 429–438. [Google Scholar] [CrossRef]
  4. Zhao, X.; Lacasse, P. Mammary tissue damage during bovine mastitis: Causes and control. J. Anim. Sci. 2008, 86, 57–65. [Google Scholar] [CrossRef] [PubMed]
  5. Swinkels, J.M.; Rooijendijk, J.G.A.; Zadoks, R.N.; Hogeveen, H. Use of partial budgeting to determine the economic benefits of antibiotic treatment of chronic subclinical mastitis caused by Streptococcus uberis or Streptococcus dysgalactiae. J. Dairy Res. 2005, 72, 75–85. [Google Scholar] [CrossRef] [PubMed]
  6. Cenci-Goga, B.T.; Karama, M.; Rossitto, P.V.; Morgante, R.A.; Cullor, J.S. Enterotoxin production by Staphylococcus aureus isolated from mastitic cows. J. Food Prot. 2003, 66, 1693–1696. [Google Scholar] [CrossRef]
  7. Pyörälä, S. Indicators of inflammation in the diagnosis of mastitis. Vet. Res. 2003, 34, 565–578. [Google Scholar] [CrossRef] [PubMed] [Green Version]
  8. Schukken, Y.H.; Wilson, D.J.; Welcome, F.; Garrison-Tikofsky, L.; Gonzalez, R.N. Monitoring udder health and milk quality using somatic cell counts. Vet. Res. 2003, 34, 579–596. [Google Scholar] [CrossRef] [PubMed] [Green Version]
  9. Lam, T.J.G.M.; Olde Riekerink, R.G.M.; Sampimon, O.C.; Smith, H. Mastitis diagnostics and performance monitoring: A practical approach. Ir. Vet. J. 2009, 62, S34–S39. [Google Scholar] [CrossRef]
  10. Kehrli, M.E.; Shuster, D.E. Factors Affecting Milk Somatic Cells and Their Role in Health of the Bovine Mammary Gland. Dairy Sci. 1994, 77, 619–627. [Google Scholar] [CrossRef]
  11. National Mastitis Council. Guidelines on Normal and Abnormal Raw Milk Based on Somatic Cell Count and Signs of Clinical Mastitis. 2001. Available online: http://www.nmconline.org/wp-content/uploads/2016/09/Guidelines-on-Normal-and-Abnormal-Raw-Milk.pdf (accessed on 30 November 2018).
  12. Baeker, R.; Haebel, S.; Schlatterer, K.; Schlatterer, B. Lipocalin-type prostaglandin D synthase in milk: A new biomarker for bovine mastitis. Prostaglandins Other Lipid Mediat. 2002, 67, 75–88. [Google Scholar] [CrossRef]
  13. Andrei, S.; Culea, M.; Matei, S.; Pintea, A.; Groza, I.S. Amino Acid Concentration in Normal and Subclinical Mastitis Milk. Bull. UASVM Vet. Med. 2001, 68, 15–19. [Google Scholar] [CrossRef]
  14. Brückner, H.; Jaek, P.; Langer, M.; Godel, H. Liquid chromatographic determination of D-amino acids in cheese and cow milk. Implication of starter cultures, amino acid racemases, and rumen microorganisms on formation, and nutritional considerations. Amino Acids 1992, 2, 271–284. [Google Scholar] [CrossRef] [PubMed]
  15. Csapó, J.; Csapó-Kiss, Z.; Stefler, J.; Martin, T.G.; Némethy, S. Influence of mastitis on D-amino acid content of milk. J. Diary Sci. 1995, 78, 2375–2381. [Google Scholar] [CrossRef]
  16. Ianni, F.; Sardella, R.; Lisanti, A.; Gioiello, A.; Cenci Goga, B.T.; Lindner, W.; Natalini, B. Achiral-chiral two-dimensional chromatography of free amino acids in milk: A promising tool for detecting different levels of mastitis in cows. J. Pharm. Biomed. Anal. 2015, 116, 40–46. [Google Scholar] [CrossRef] [PubMed]
  17. Mariano, V.; McCrindle, C.M.; Cenci-Goga, B.; Picard, J.A. Case-control study to determine whether river water can spread tetracycline resistance to unexposed impala (Aepyceros melampus) in Kruger National Park (South Africa). Appl. Environ. Microbiol. 2009, 75, 113–118. [Google Scholar] [CrossRef] [PubMed]
  18. Sardella, R.; Lisanti, A.; Marinozzi, M.; Ianni, F.; Natalini, B.; Blanch, G.P.; Ruiz del Castillo, M.L. Combined monodimensional chromatographic approaches to monitor the presence of d-amino acids in cheese. Food Control 2013, 34, 478–487. [Google Scholar] [CrossRef] [Green Version]
  19. R Development Core Team. R: A Language and Environment for Statistical Computing; R Foundation for Statistical Computing: Vienna, Austria, 2008; ISBN 3-900051-07-0. [Google Scholar]
  20. Tukey, J.W. Exploratory Data Analysis, 1st ed.; Addison-Wesley Publishing Company: Toronto, ON, Canada, 1977; ISBN 0-201-07616-0. [Google Scholar]
  21. Ianni, F.; Lisanti, A.; Marinozzi, M.; Camaioni, E.; Pucciarini, L.; Massoli, A.; Sardella, R.; Concezzi, L.; Natalini, B. Hydrophobic amino acid content in onions as potential fingerprints of geographical origin: The case of rossa da inverno sel. Rojo Duro. Molecules 2018, 23, 1259. [Google Scholar] [CrossRef]
  22. Ianni, F.; Pucciarini, L.; Camaioni, E.; Alunni, G.; Sardella, R.; Natalini, B. Branched-chain amino acids as potential diagnostic and prognostic disease biomarkers. Int. J. Clin. Res. Trials 2017, 2, 112. [Google Scholar] [CrossRef]
  23. Bifari, F.; Nisoli, E. Branched-chain amino acids differently modulate catabolic and anabolic states in mammals: A pharmacological point of view. Br. J. Pharmacol. 2017, 174, 1366–1377. [Google Scholar] [CrossRef]
  24. Ebbeling, C.B.; Pawlak, D.B.; Ludwig, D.S. Childhood obesity: Public-health crisis, common sense cure. Lancet 2002, 360, 473–482. [Google Scholar] [CrossRef]
  25. Giesbertz, P.; Daniel, H. Branched-chain amino acids as biomarkers in diabetes. Curr. Opin. Clin. Nutr. Metab. Care 2016, 19, 48–54. [Google Scholar] [CrossRef] [PubMed]
  26. James, P.T.; Rigby, N.; Leach, R. The obesity epidemic, metabolic syndrome and future prevention strategies. Eur. J. Cardiovasc. Prev. Rehabil. 2004, 11, 3–8. [Google Scholar] [CrossRef] [PubMed]
  27. Kumar, M.A.; Bitla, A.R.; Raju, K.V.; Manohar, S.M.; Kumar, V.S.; Narasimha, S.R. Branched chain amino acid profile in early chronic kidney disease. Saudi J. Kidney Dis. Transpl. 2012, 23, 1202–1207. [Google Scholar] [CrossRef]
  28. Kimberly, W.T.; Wang, Y.; Pham, L.; Furie, K.L.; Gerszten, R.E. Metabolite Profiling Identifies a Branched Chain Amino Acid Signature in Acute Cardioembolic Stroke. Stroke 2013, 44, 1389–1395. [Google Scholar] [CrossRef] [Green Version]
  29. Sardella, R.; Gioiello, A.; Ianni, F.; Venturoni, F.; Natalini, B. HPLC/ELSD analysis of amidated bile acids: An effective and rapid way to assist continuous flow chemistry processes. Talanta 2012, 100, 364–371. [Google Scholar] [CrossRef] [PubMed]
  30. Li, S.; Wu, Q.; Yin, F.; Zhu, Z.; He, J.; Barba, F.J. Development of a Combined Trifluoroacetic Acid Hydrolysis and HPLC-ELSD Method to Identify and Quantify Inulin Recovered from Jerusalem artichoke Assisted by Ultrasound Extraction. Appl. Sci. 2018, 8, 710. [Google Scholar] [CrossRef]
  31. Montesano, D.; Cossignani, L.; Giua, L.; Urbani, E.; Simonetti, M.S.; Blasi, F. A Simple HPLC-ELSD Method for Sugar Analysis in Goji Berry. J. Chem. 2016, 2016. [Google Scholar] [CrossRef]
  32. Natalini, B.; Sardella, R.; Gioiello, A.; Carbone, G.; Dawgul, M.; Pellicciari, R. Side-chain modified bile acids: Chromatographic separation of 23-methyl epimers. J. Sep. Sci. 2009, 32, 2022–2033. [Google Scholar] [CrossRef]
  33. Li, W.; Fitzloff, J.F. Simultaneous determination of terpene lactones and flavonoid aglycones in Ginkgo biloba by high-performance liquid chromatography with evaporative light scattering detection. J. Pharm. Biomed. Anal. 2002, 30, 67–75. [Google Scholar] [CrossRef]
  34. Vervoort, N.; Daemen, D.; Török, G. Performance evaluation of evaporative light scattering detection and charged aerosol detection in reversed phase liquid chromatography. J. Chromatogr. A 2008, 1189, 92–100. [Google Scholar] [CrossRef] [PubMed]
  35. Blasi, F.; Lombardi, G.; Damiani, P.; Simonetti, M.S.; Giua, L.; Cossignani, L. Triacylglycerol stereospecific analysis and linear discriminant analysis for milk speciation. J. Dairy Res. 2013, 80, 144–151. [Google Scholar] [CrossRef] [PubMed]
  36. De Jong, N.; Visser, S.; Olieman, C. Determination of milk proteins by capillary electrophoresis. J. Chromatogr. A 1993, 652, 207–213. [Google Scholar] [CrossRef]
  37. Nagpal, R.; Behare, P.; Rana, R.; Kumar, A.; Kumar, M.; Arora, S.; Morotta, F.; Jain, S.; Yadav, H. Bioactive peptides derived from milk proteins and their health beneficial potentials: An update. Food Funct. 2011, 2, 18–27. [Google Scholar] [CrossRef] [PubMed]
Figure 1. IP-RP-HPLC-ELSD analysis of (A) a pool of standard amino acids and (B) of the extract. Experimental conditions: column, Prevail RP18 column (Grace, Sedriano, Italy); mobile phase, eluent A (7.0 mM HFBA in water) and eluent B (net MeCN); gradient, 0–10 min, 100% A; 10–30 min, linear gradient to 75% A; 30–38 min, linear gradient to 70% A; 38–39 min, gradient back to 100% A; 39–65 min, 100% A; flow rate, 0.7 mL/min; column temperature, 25 °C; ELSD setting, Tneb 30 °C, Tvap 50 °C, gas flow rate 1 L/min, gain 1. Asterisks in (B) refer to the identified amino acids as indicated in (A).
Applsci 09 00349 g001
Figure 2. Bar plots for (A) Leu, (B) Ile and (C) Tyr concentration content values (mean ± standard error) and ANOVA/Tukey HSD analyses comparing the two groups.
Applsci 09 00349 g002
Table 1. Content values of selected amino acids in Group I, along with somatic cells count (SCC) value.
Sample #SCC (×103)Ile (μg/mL)Leu (μg/mL)Val (μg/mL)Tyr (μg/mL)
15114 ± 4139 ± 15172 ± 990 ± 6
2123138 ± 10135 ± 8200 ± 6238 ± 16
399179 ± 6265 ± 7527 ± 69128 ± 14
44987 ± 898 ± 19220 ± 10761 ± 10
573108 ± 6104 ± 11308 ± 850 ± 8
6113101 ± 9119 ± 18158 ± 2274 ± 13
75891 ± 1689 ± 16301 ± 18-
834194 ± 15204 ± 10897 ± 68246 ± 22
95391 ± 588 ± 871 ± 657 ± 6
106193 ± 3125 ± 2332 ± 1279 ± 6
1190177 ± 11230 ± 5386 ± 96188 ± 20
129130 ± 13151 ± 6126 ± 12138 ± 9
131095 ± 4100 ± 4119 ± 279 ± 7
149159 ± 2128 ± 2213 ± 11114 ± 2
1539103 ± 2101 ± 6280 ± 2888 ± 3
16139139 ± 2140 ±3140 ± 160 ± 2
177564 ± 656 ± 5102 ± 350 ± 2
184118 ± 1177 ± 4170 ± 6126 ± 1
1958133 ± 3218 ± 3511 ± 6137 ± 3
2092122 ± 2110 ± 5286 ± 4100 ± 6
21595 ± 1466 ± 4-51 ± 8
224104 ± 1384 ± 2-69 ± 5
23108139 ± 8220 ± 16405 ± 37137 ± 18
24104146 ± 9--159 ± 1
2559111 ± 8128 ± 33371 ± 36108 ± 8
2610576 ± 1074 ± 448 ± 719 ± 1
2713894 ± 1114 ± 7304 ± 9100 ± 6
287398 ± 1130 ± 1437 ± 2096 ± 7
298133 ± 4104 ± 1485 ± 3583 ± 6
305122 ± 7172 ± 13261 ± 59100 ± 4
3180117 ± 897 ± 12212 ± 142 ± 6
3262163 ± 2253 ± 2288 ± 15180 ± 11
33187 ± 176 ± 4217 ± 645 ± 3
3461104 ± 4146 ± 1417 ± 6189 ± 4
3517578 ± 587 ± 12252 ± 9159 ± 7
3617590 ± 4-175 ± 952 ± 3
3715488 ± 2101 ± 2220 ± 571 ± 5
38165135 ± 10158 ± 7314 ± 18158 ± 24
39157169 ± 13212 ± 10503 ± 6138 ± 14
40157131 ± 7150 ± 14583 ± 55112 ± 3
4117255 ± 142 ± 2106 ± 123 ± 1
4215492 ± 386 ± 3171 ± 1252 ± 3
43303149 ± 9142 ± 4393 ± 19146 ± 8
44319116 ± 2188 ± 6356 ± 40115 ± 5
4535153 ± 241 ± 1360 ± 228 ± 2
46331166 ± 6193 ± 6-205 ± 2
47353100 ± 8117 ± 15147 ± 1472 ± 12
48368127 ± 1145 ± 6167 ± 1113 ± 3
Data are expressed as mean ± standard deviation of at least three experiments.
Table 2. Content values of selected amino acids in Group II, along with SCC value.
Sample #SCC (×103)Ile (μg/mL)Leu (μg/mL)Val (μg/mL)Tyr (μg/mL)
49529104 ± 677 ± 14232 ± 3376 ± 7
5058556 ± 742 ± 7119 ± 454 ± 9
51778109 ± 5126 ± 6254 ± 30104 ± 10
5294291 ± 6-54 ± 790 ± 4
53485120 ± 3152 ± 1354 ± 21115 ± 2
54404111 ± 3175 ± 4-109 ± 6
55813134 ± 10166 ± 5157 ± 15123 ± 5
56528169 ± 13234 ± 3-193 ± 3
57619104 ± 3289 ±18298 ± 5971 ± 6
58541197 ± 11349 ± 41376 ± 29141 ± 3
59588199 ± 1328 ± 6335 ± 39155 ± 8
60799119 ± 4149 ± 2207 ± 2083 ± 4
611695150 ± 7157 ± 7230 ± 35133 ± 13
622488161 ± 15226 ± 24609 ± 77192 ± 34
63288190 ± 178 ± 4142 ± 1079 ± 17
643886226 ± 7422 ± 17203 ± 29200 ± 3
653886213 ± 1368 ± 6490 ± 11221 ± 13
Data are expressed as mean ± standard deviation of at least three experiments.
Table 3. Selected chromatographic parameters (retention factor k, separation factor α and resolution factor RS values) obtained in the analysis of the investigated amino acids according to their elution order.
Amino AcidSelected Chromatographic Parameters
kαRS
Val7.78
Tyr9.741.2525.25
Ile10.021.034.37
Leu10.351.034.48
Table 4. Calibration data for Ile, Leu, Val and Tyr, with the developed IP-RP-HPLC/ELSD method.
Amino AcidRegression EquationR2Linearity Range (µg/mL)Eq.
Iley = 2.0528x + 0.84740.98762.5–5001
Leuy = 1.5153x + 2.38290.99515.6–2502
Valy = 1.2477x + 2.74430.99350–10003
Tyry = 1.4012x + 2.24470.99362.5–5004

