A Review of Recent Results on Simultaneous Interrogation of Multiple Fiber Bragg Grating-Based Sensors Using Microwave Photonics


Abstract
:1. Introduction
2. Microwave Photonic Filters
2.1. Background
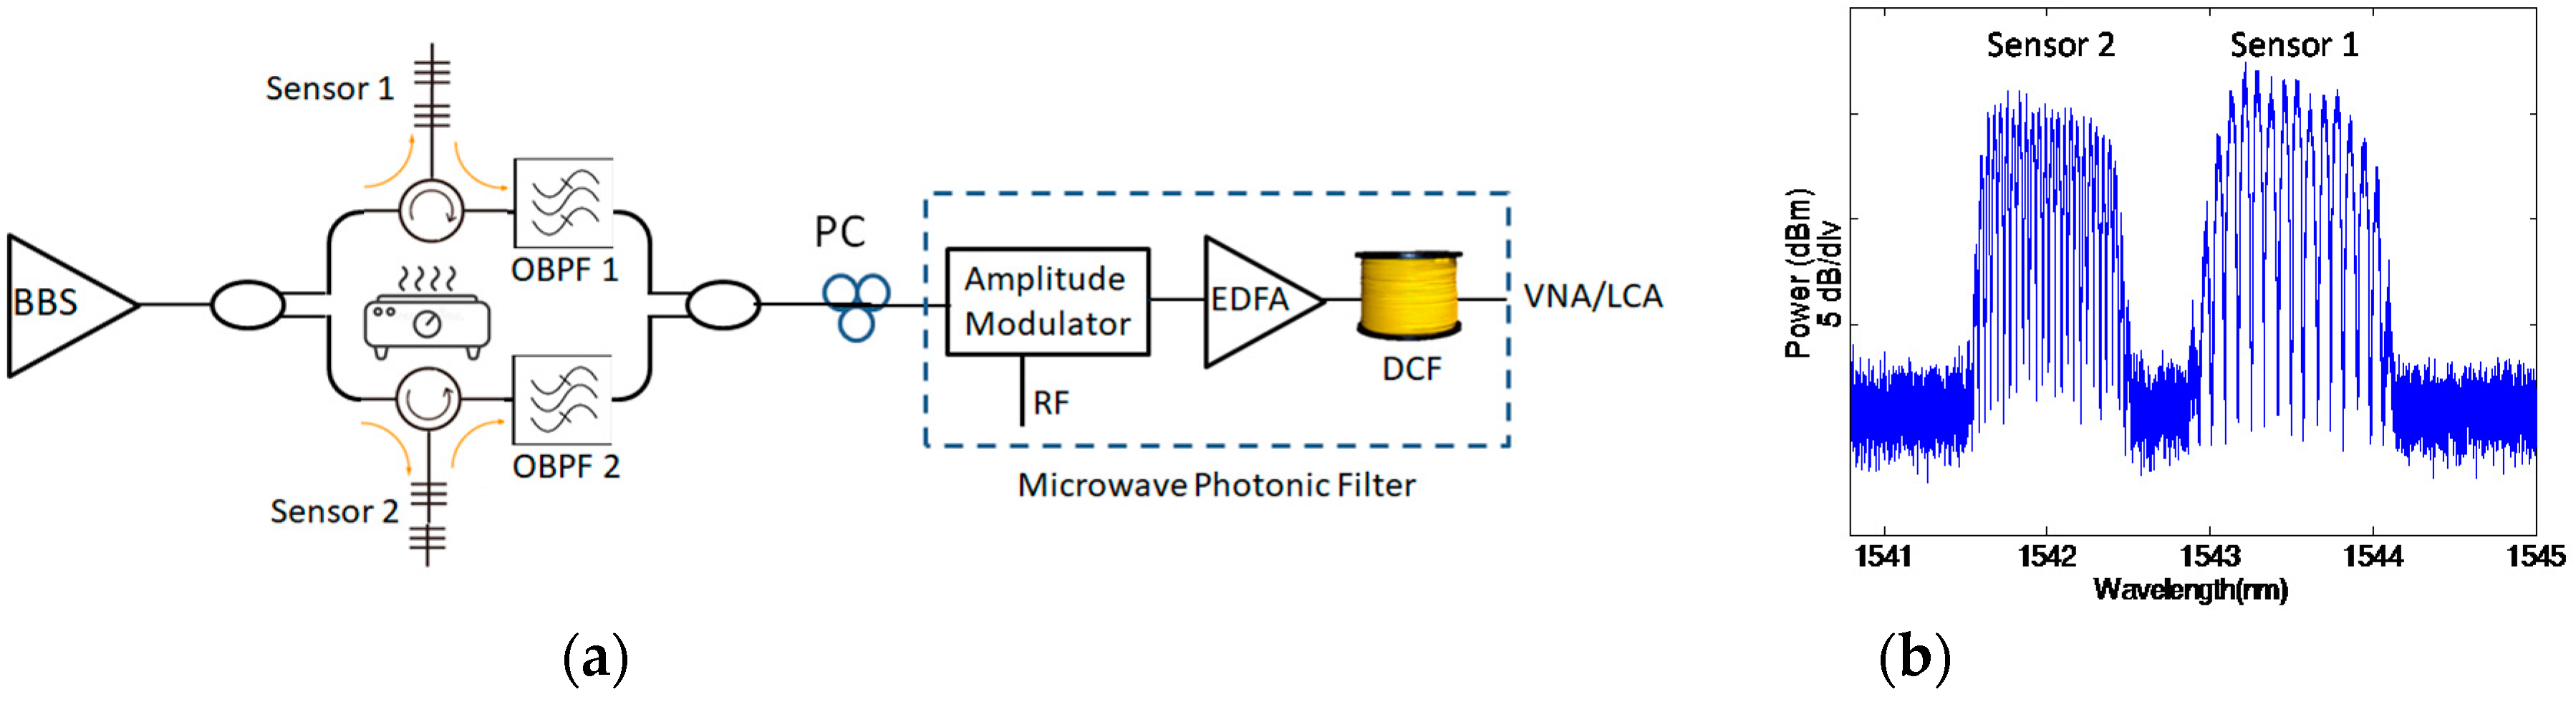
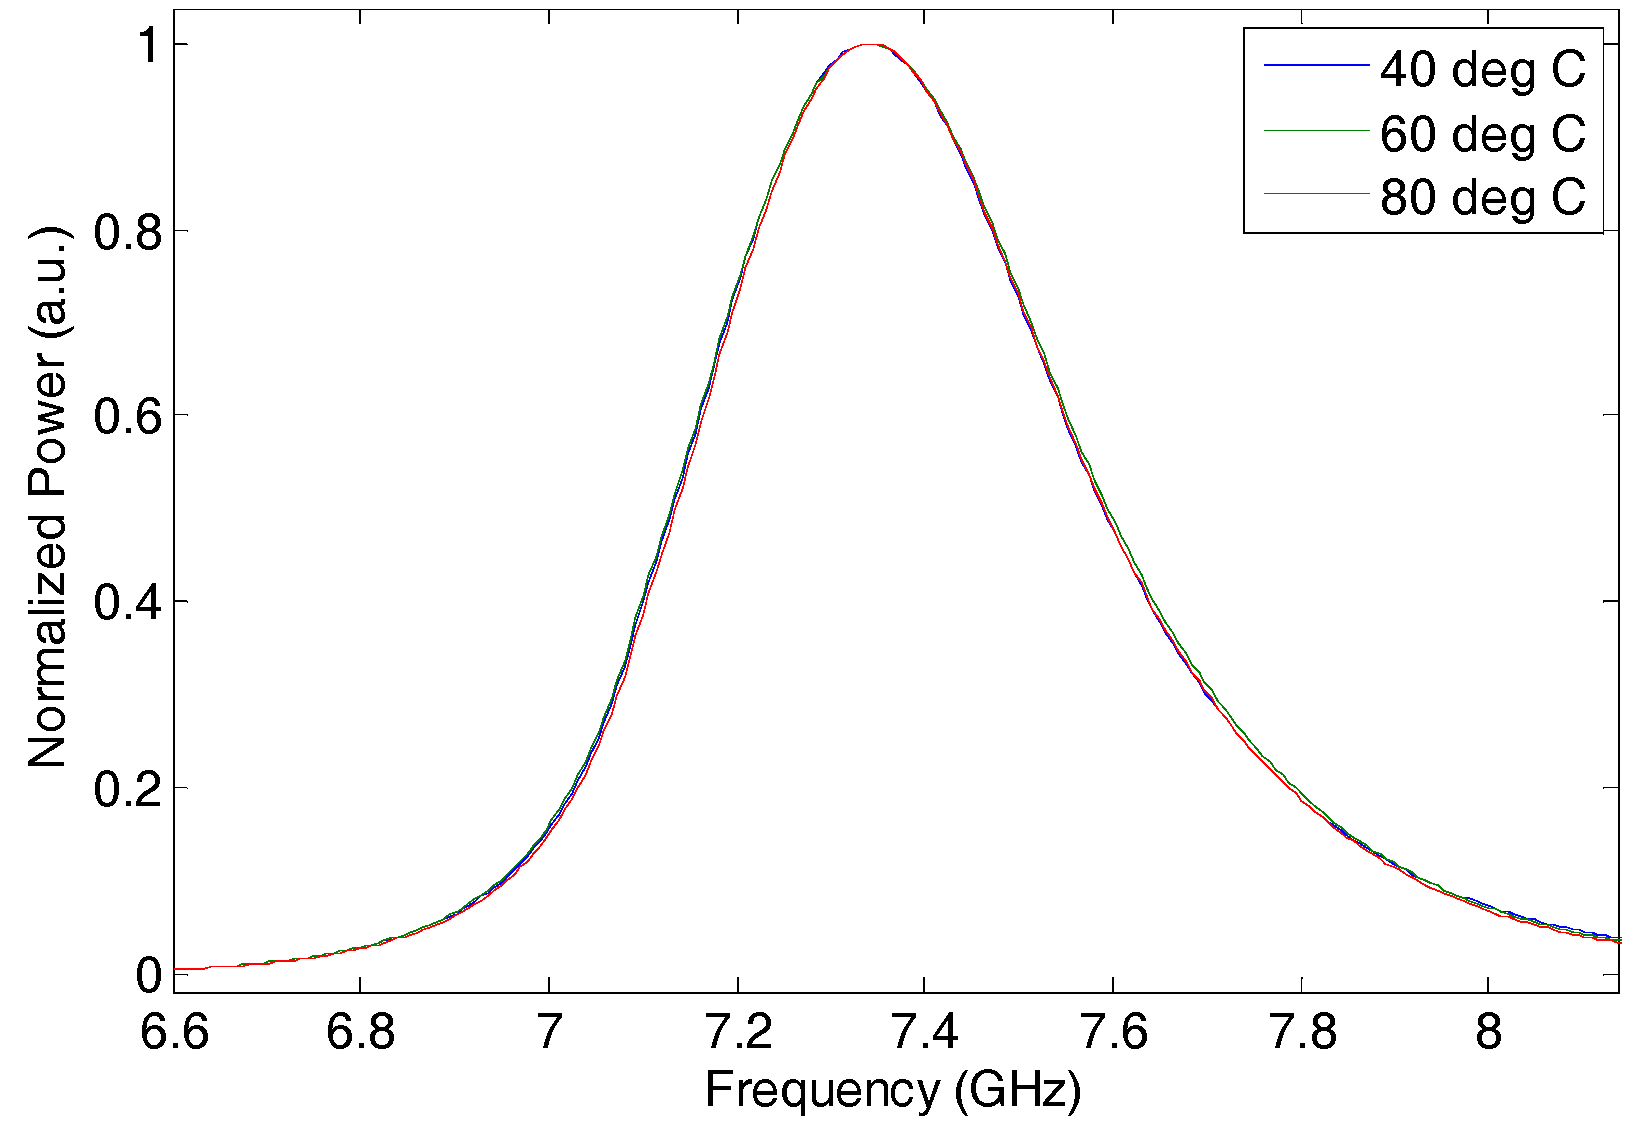
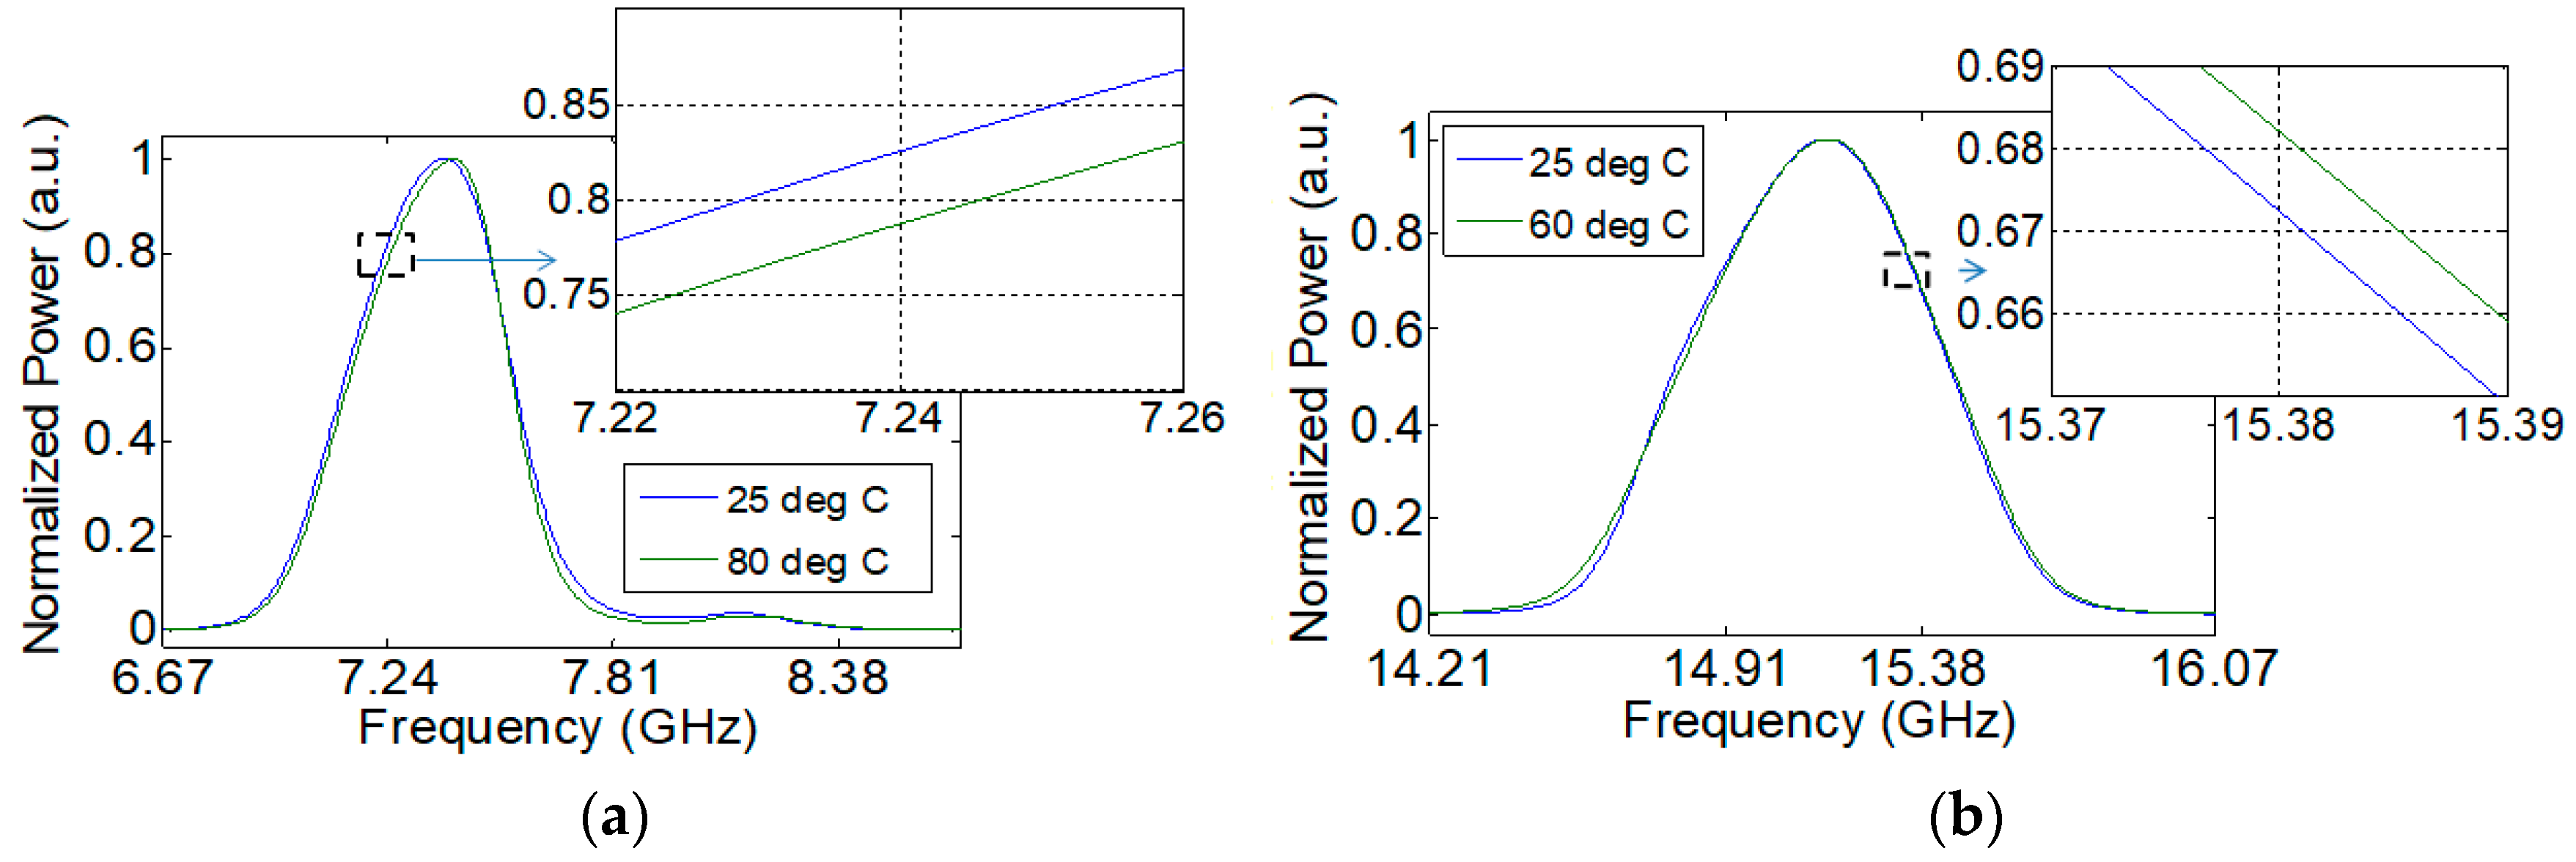
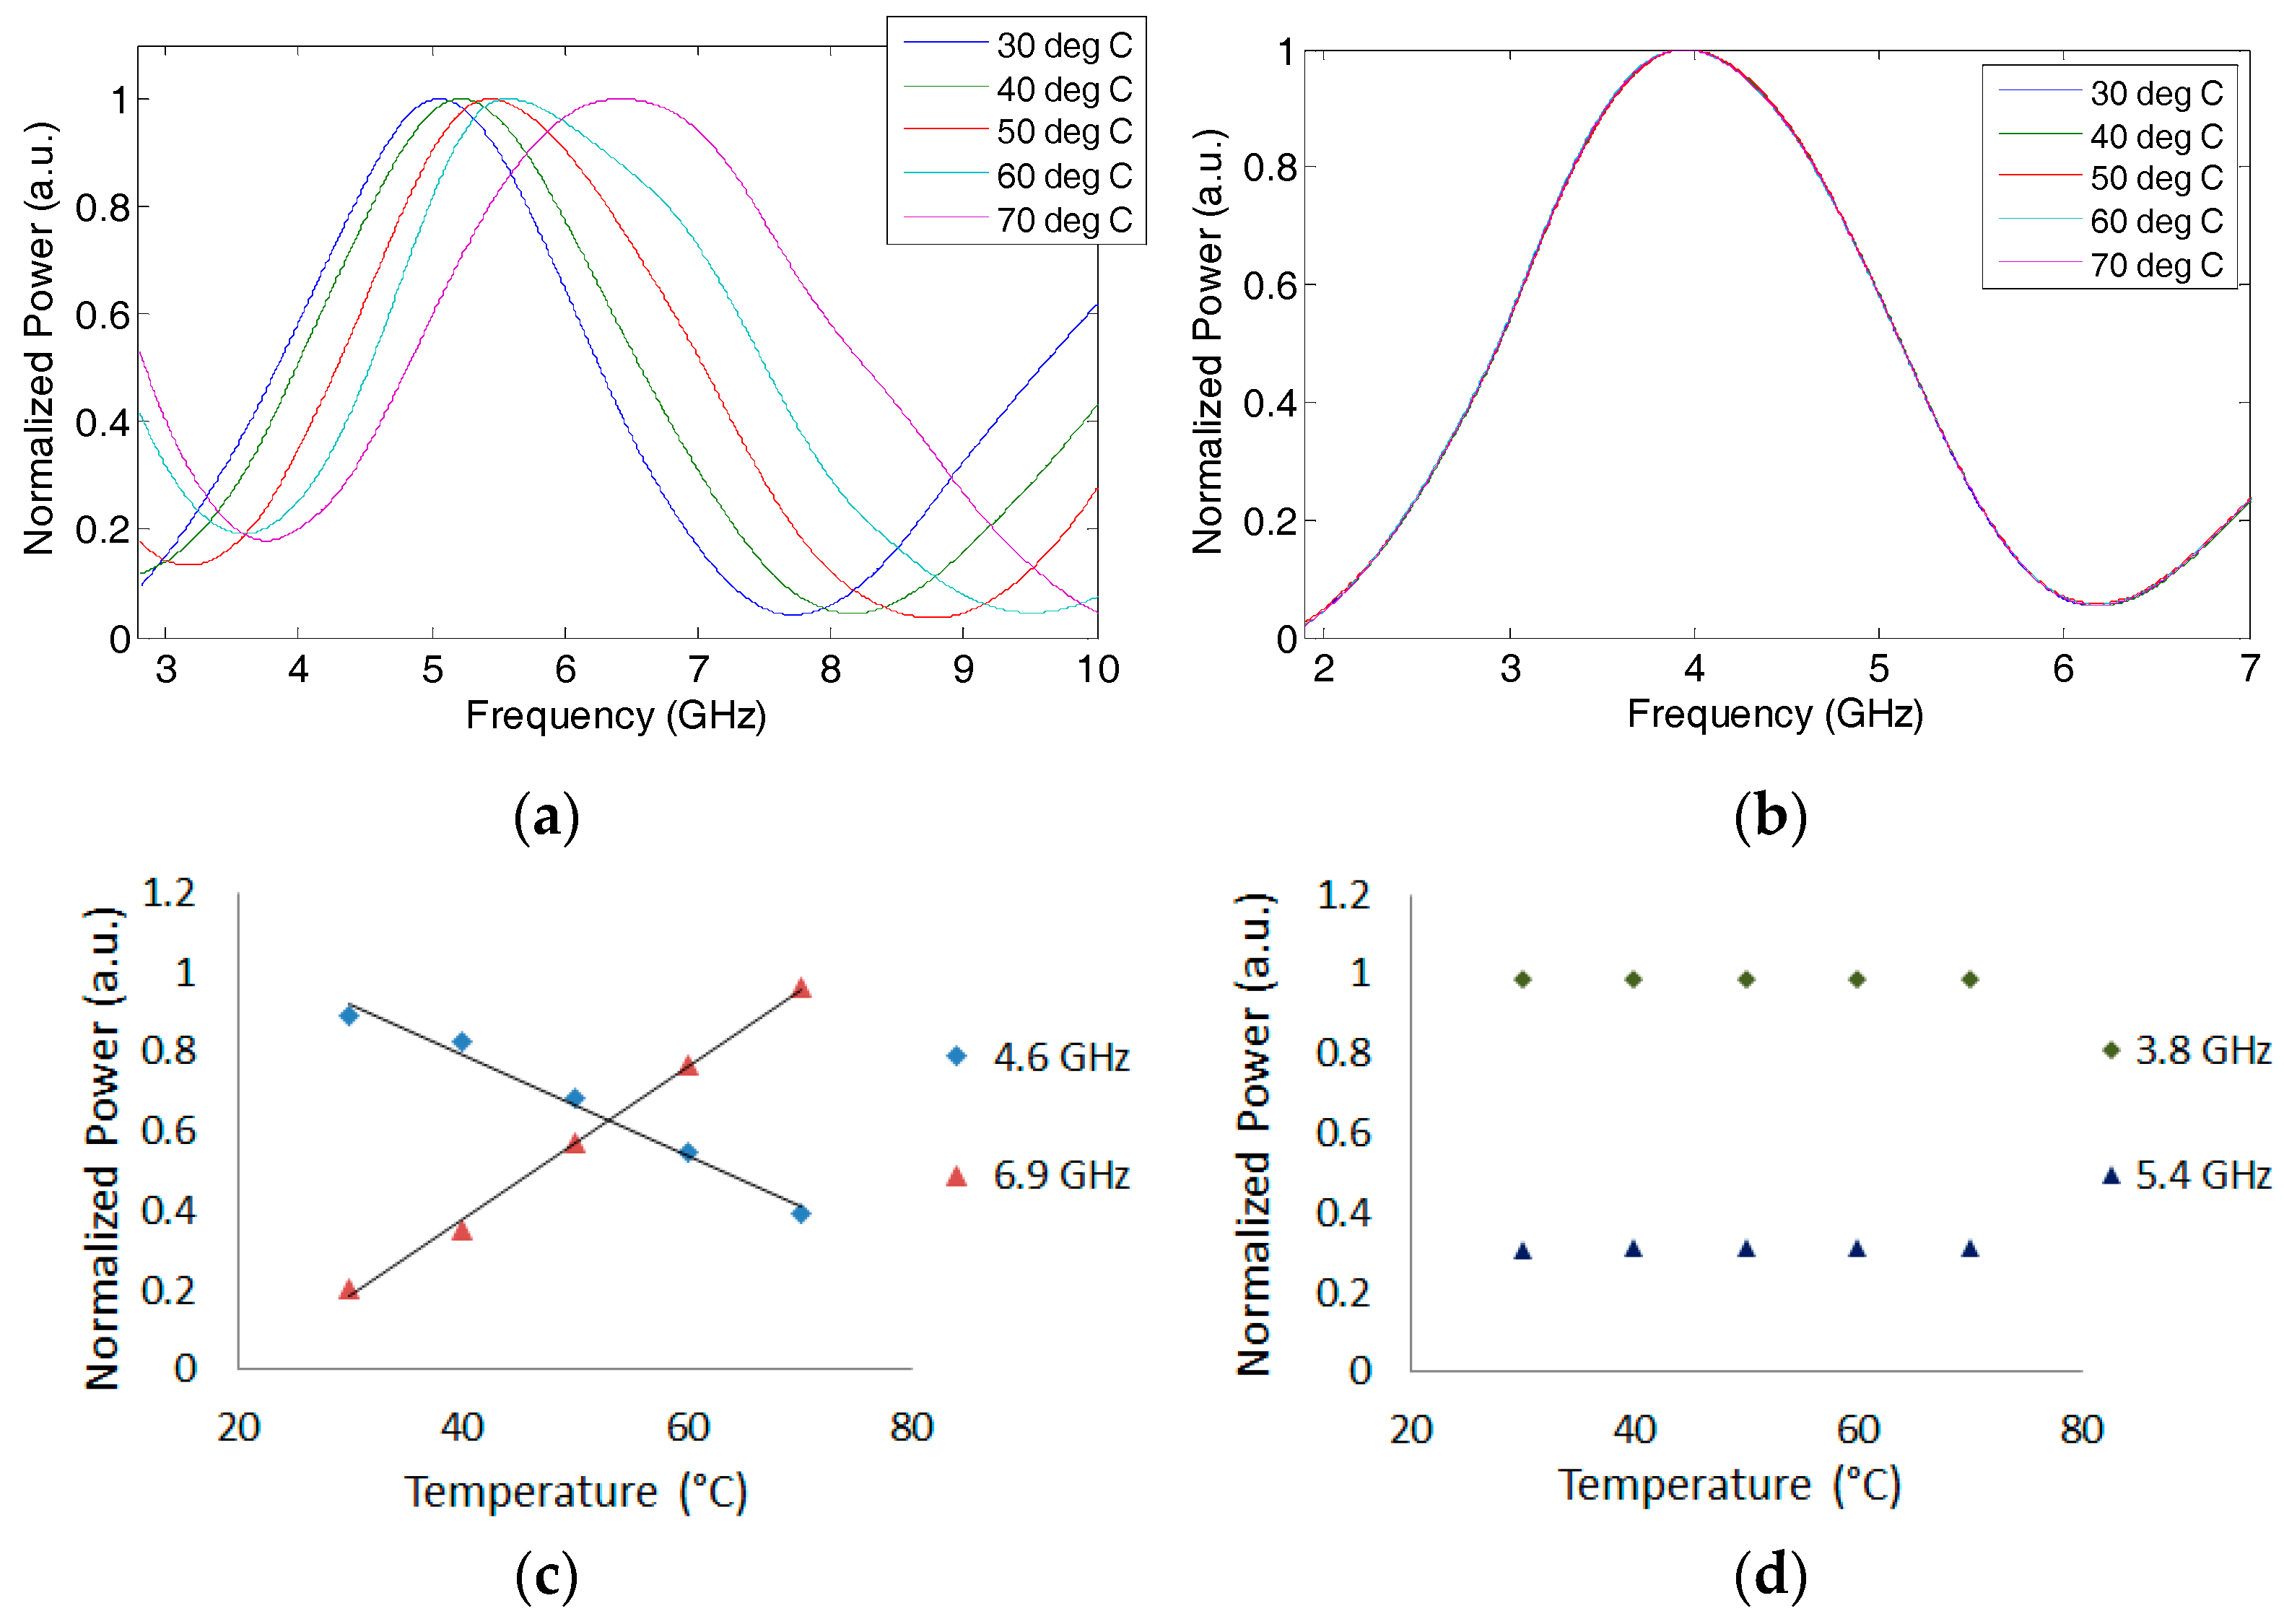
2.2. Single Bandpass MWP Filter
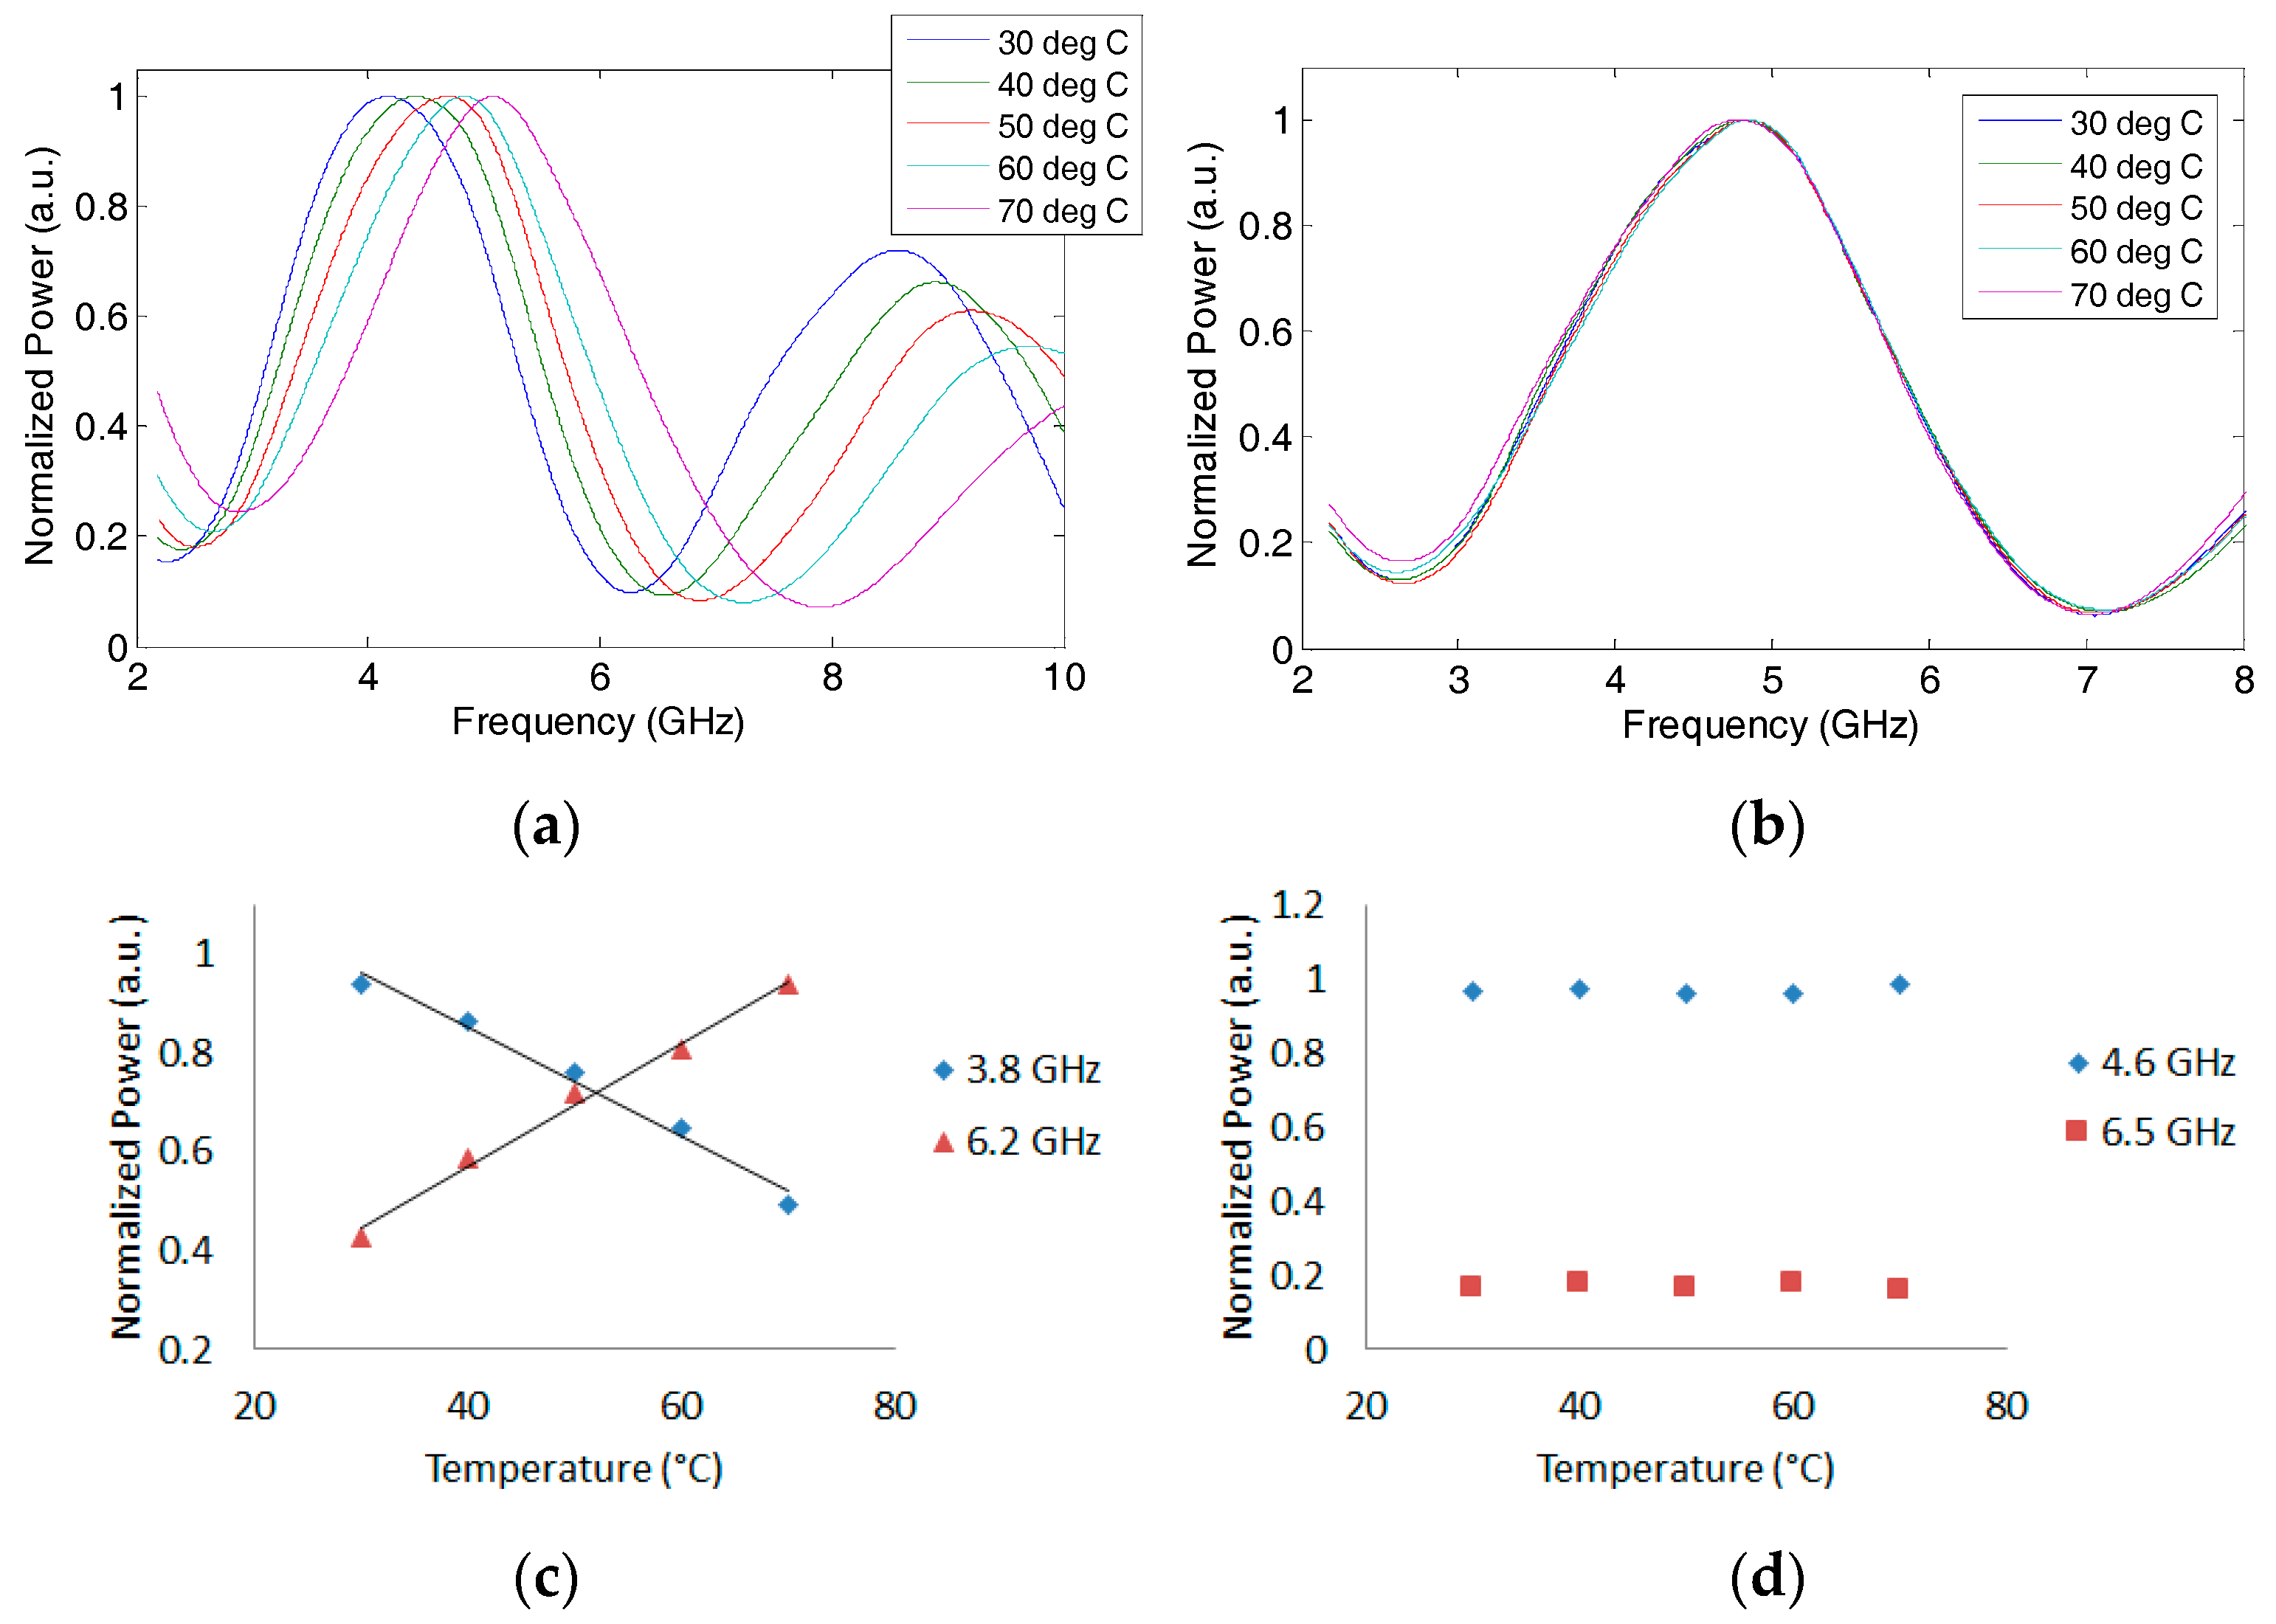
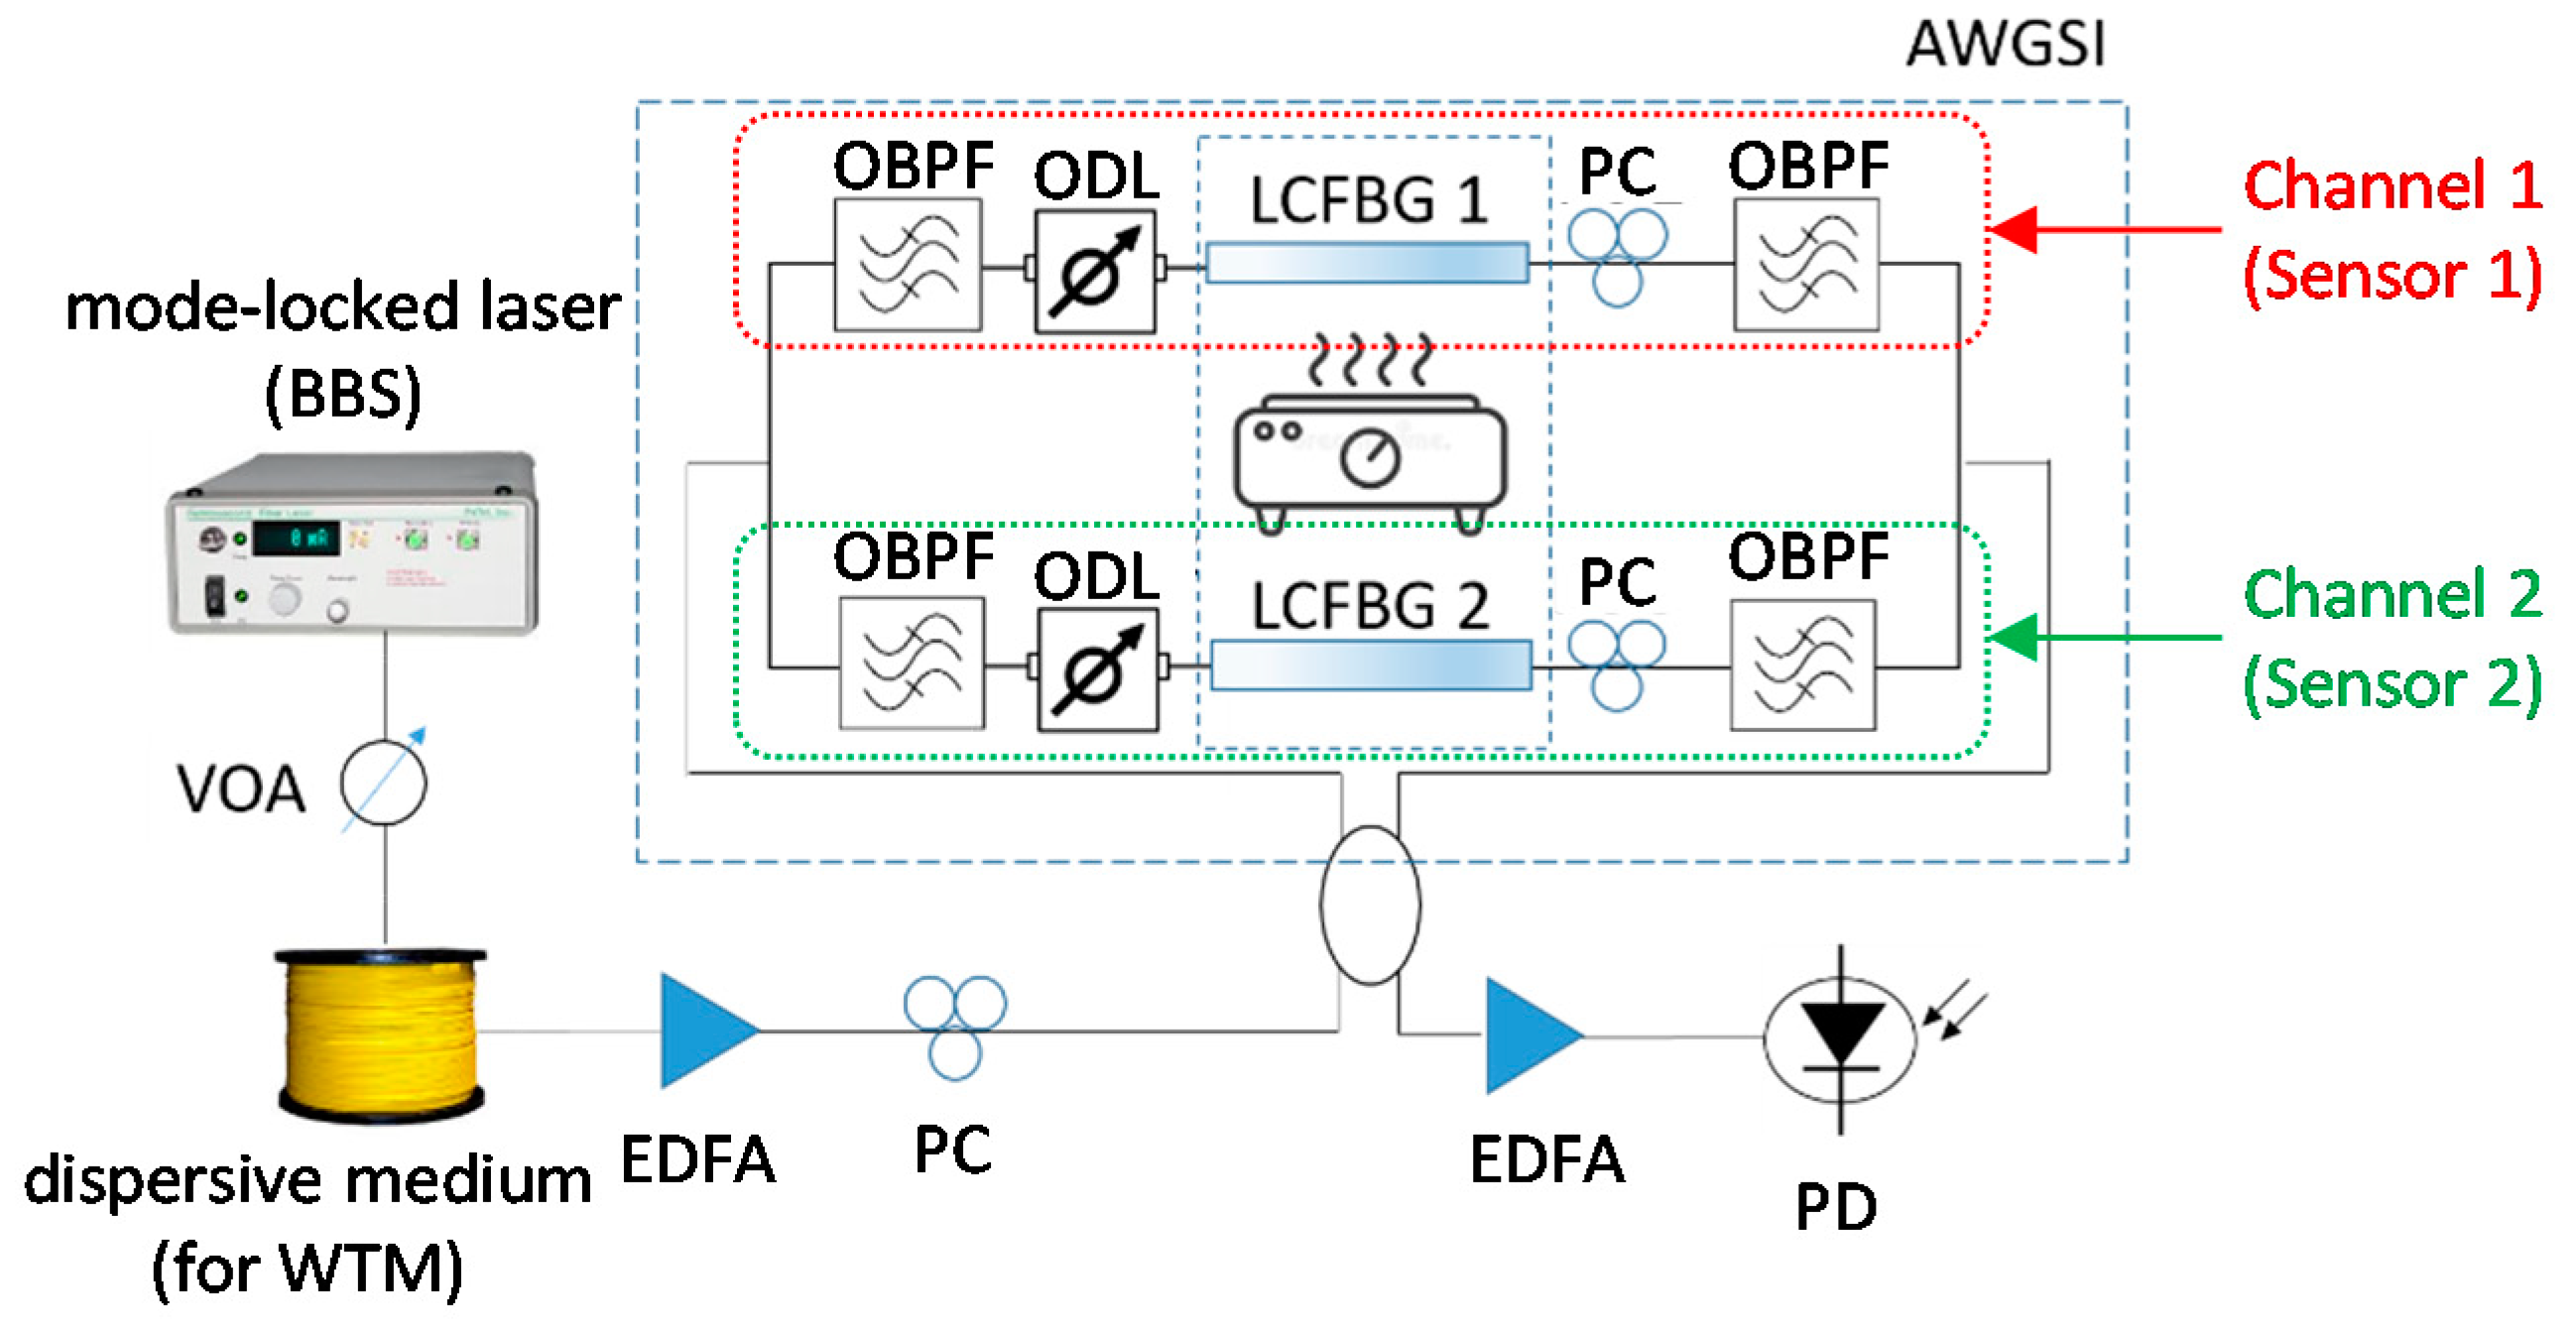
2.3. Two Tap MWP Filter Based on a Sagnac Loop Incorporating a Linearly Chirped FBG
3. Chirped Microwave Pulse Generation and Compression
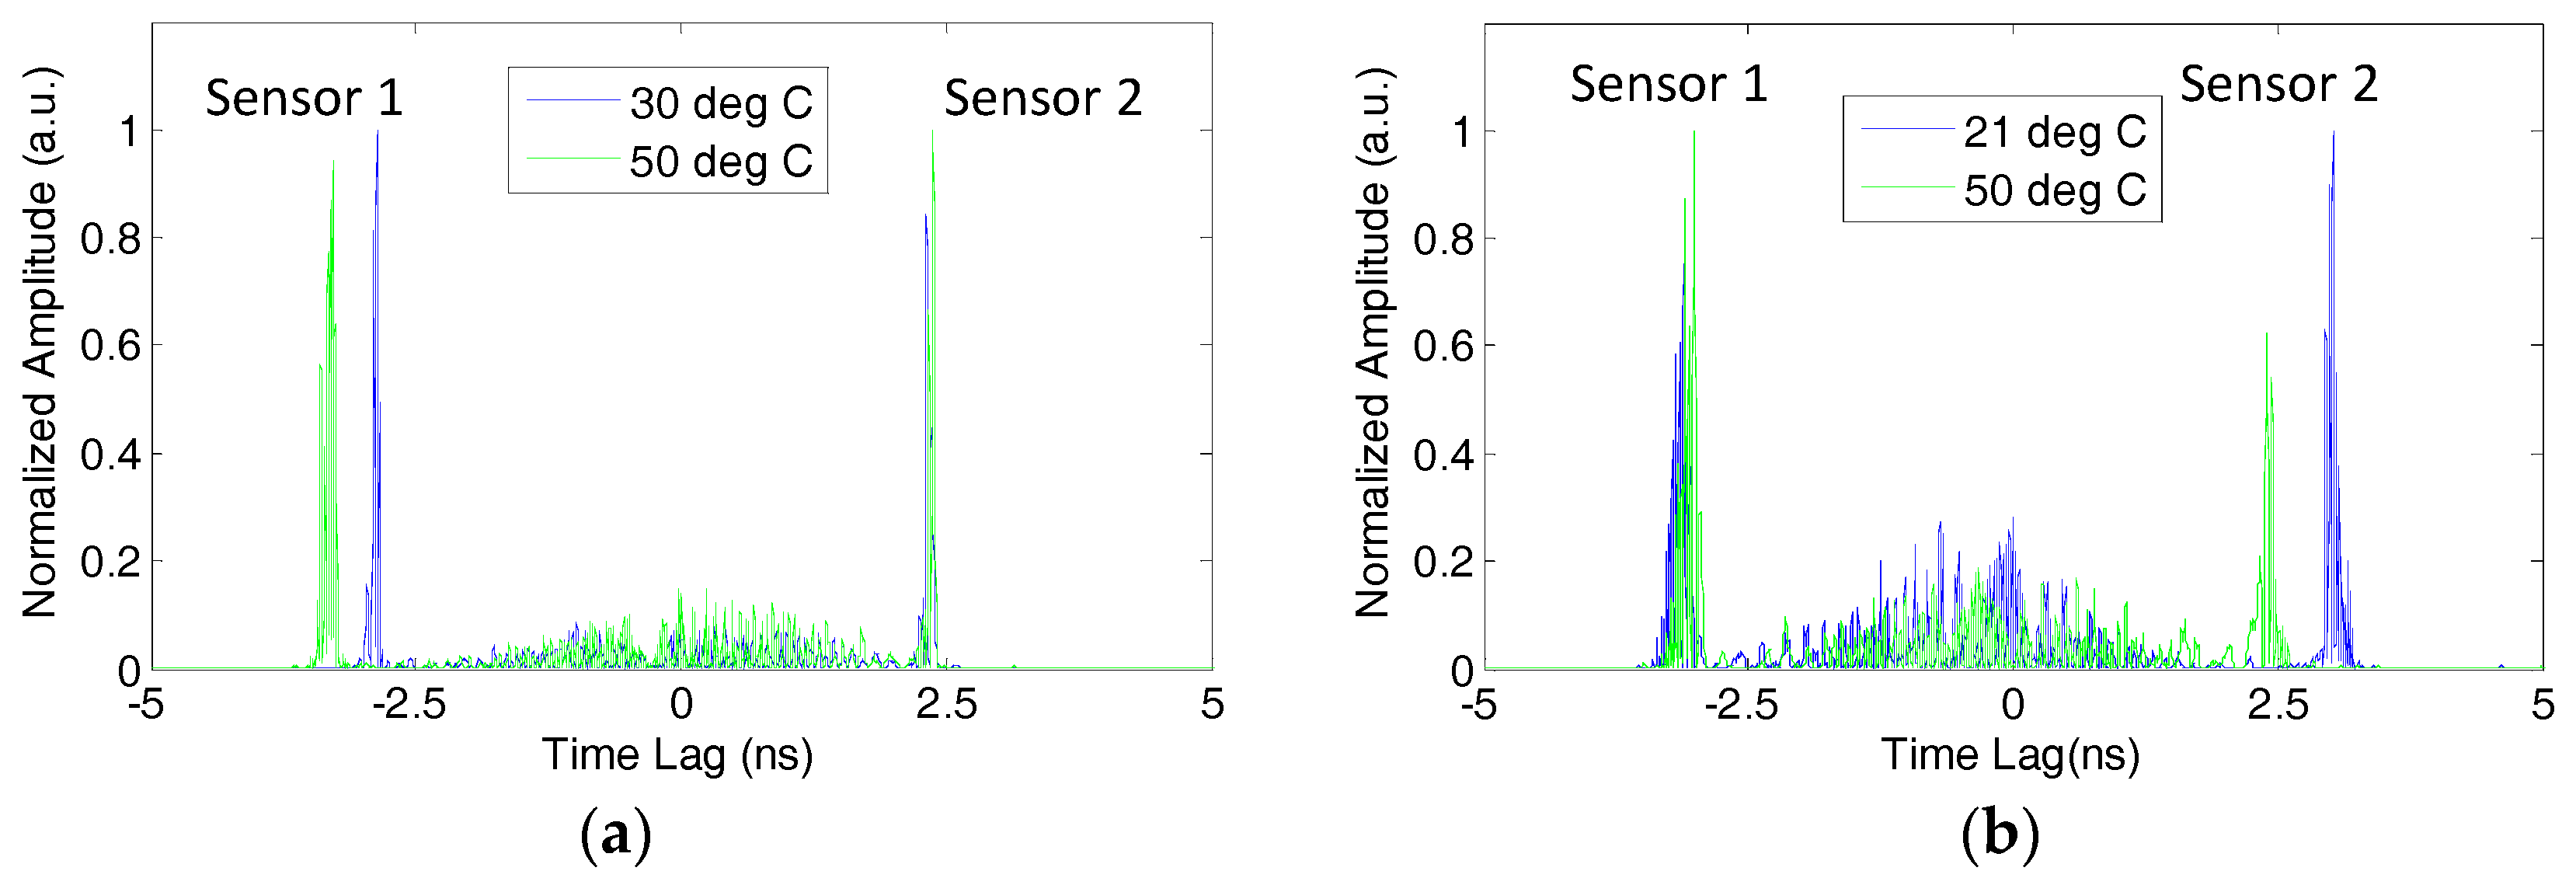
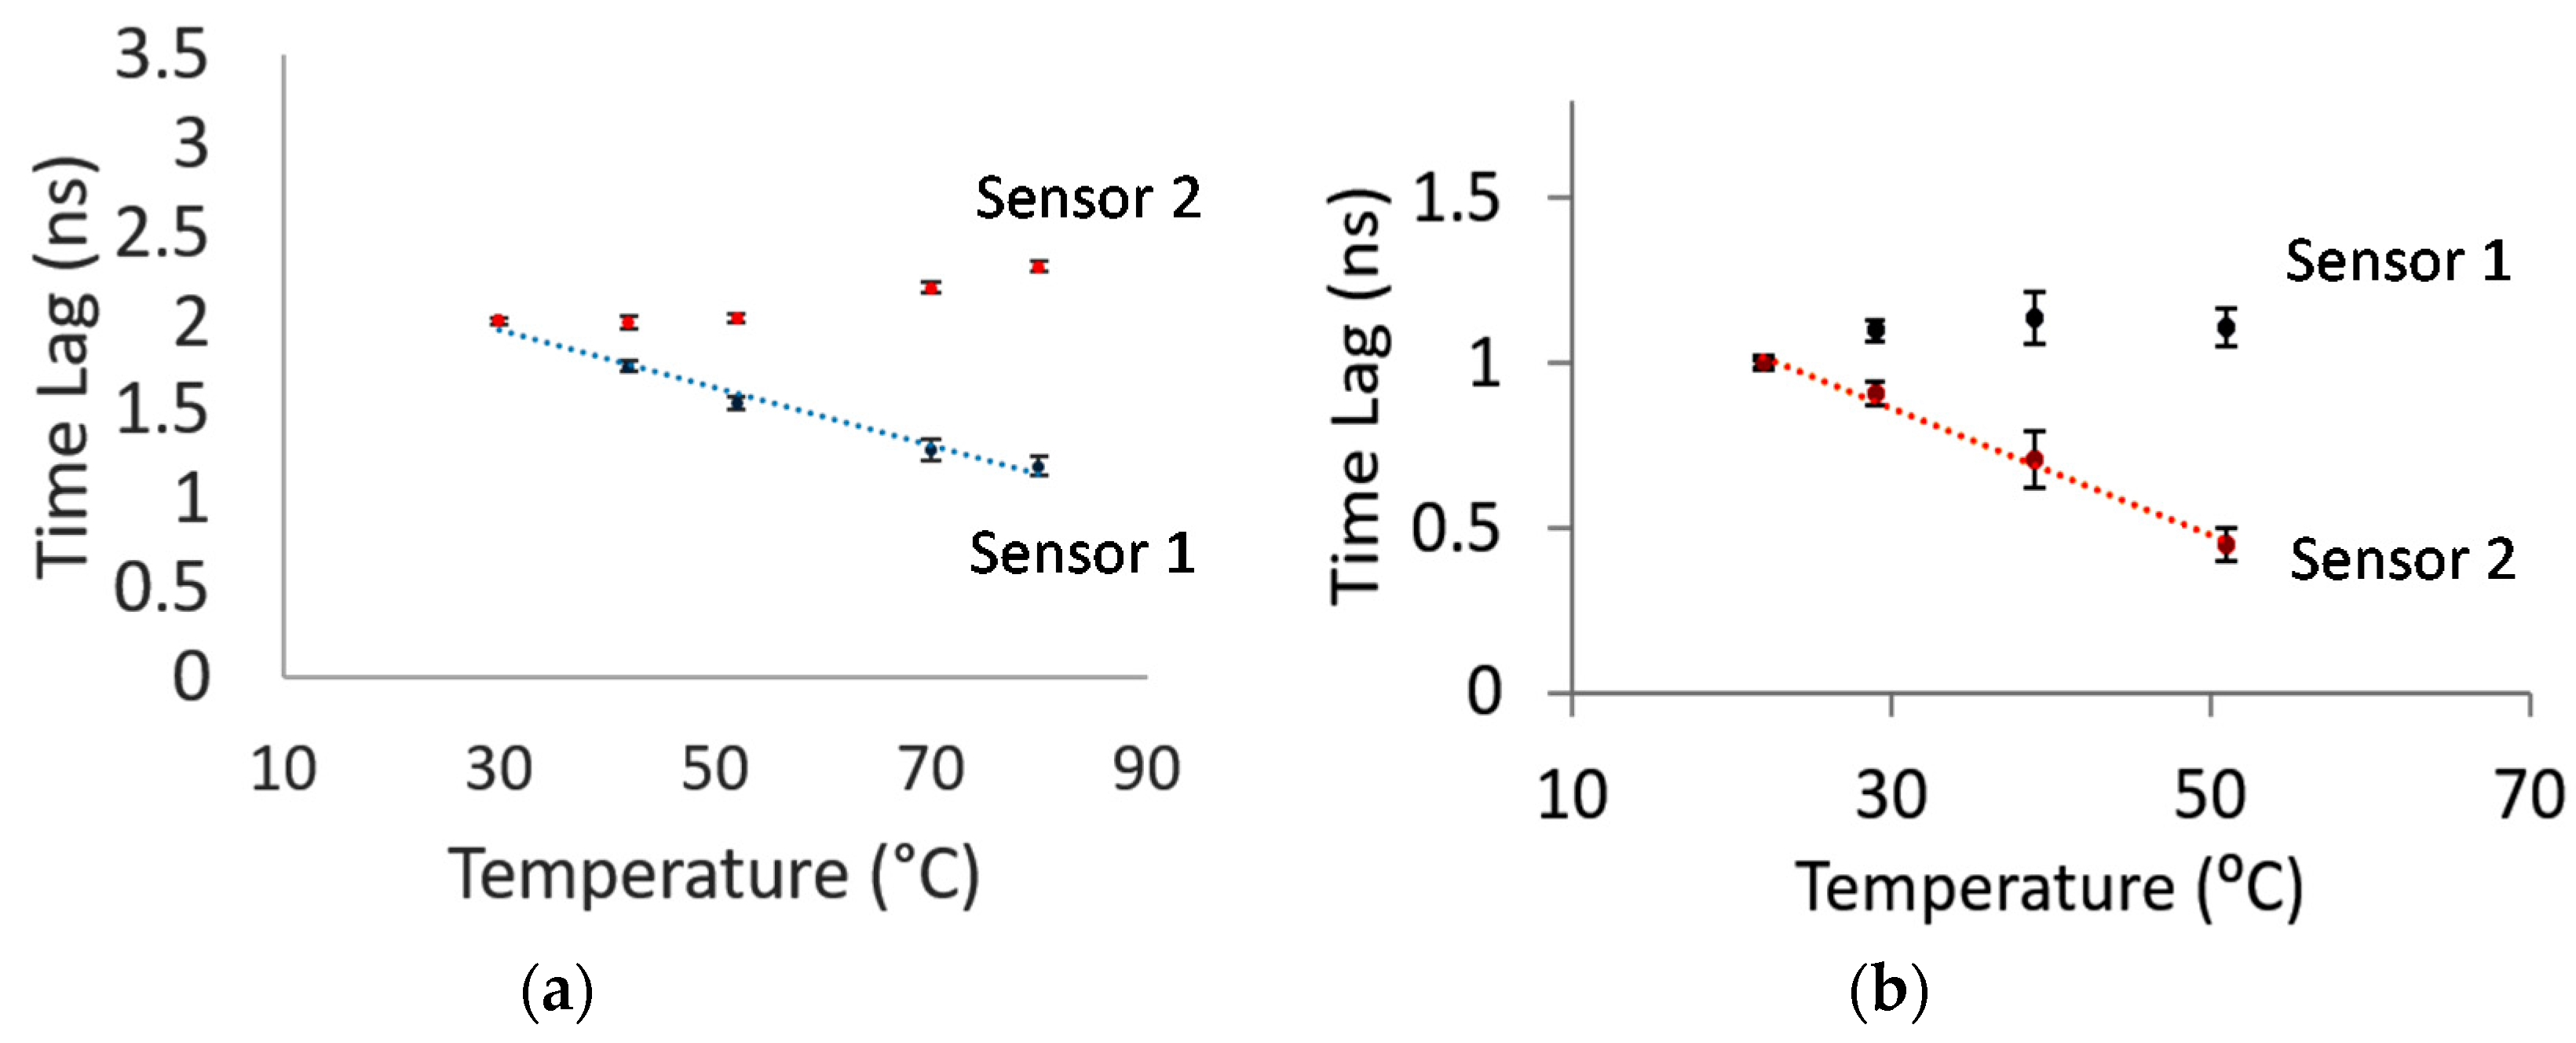
Chirped Microwave Pulse Generation
4. Discussion and Conclusions
Author Contributions
Funding
Conflicts of Interest
References
- Kersey, A.D.; David, M.A.; Patrick, H.J.; LeBlanc, M.; Koo, K.P.; Askins, C.G.; Putnam, M.A.; Friebele, E.J. Fiber grating sensors. J. Lightw. Technol. 1997, 15, 1442–1463. [Google Scholar] [CrossRef]
- Rao, Y.-J. Fiber Bragg grating sensors: Principles and applications. In Optical Fiber Sensor Technology; Grattan, K.T.V., Meggitt, B.T., Eds.; Chapman Hall: London, UK, 1998; pp. 355–379. ISBN 0412782901. [Google Scholar]
- Liu, Z.; Tam, H.-Y. Industrial and medical applications of fiber Bragg gratings. Chin. Opt. Lett. 2016, 14, 120007. [Google Scholar]
- Hu, C.; Bai, W. High-speed interrogation for large-scale fiber Bragg grating sensing. Sensors 2018, 18, 665. [Google Scholar] [CrossRef] [PubMed]
- Fu, H.; Zhang, W.; Mou, C.; Shu, X.; Zhang, L.; He, S.; Bennion, I. High-frequency fiber Bragg grating sensing interrogation system using a Sagnac-loop-based microwave photonic filtering. IEEE Photonics Technol. Lett. 2009, 21, 519–521. [Google Scholar] [CrossRef]
- Fu, H.; Chen, D.; Cai, Z. Fiber sensor systems based on fiber laser and microwave photonic technologies. Sensors 2012, 12, 5395–5419. [Google Scholar] [CrossRef] [PubMed]
- Liu, W.; Li, W.; Yao, J.P. Real-time interrogation of a linearly chirped fiber Bragg grating sensor for simultaneous measurement of strain and temperature. IEEE Photonics Technol. Lett. 2011, 23, 1340–1342. [Google Scholar] [CrossRef]
- Ricchiuti, A.L.; Barrera, D.; Sales, S.; Thevenaz, L.; Capmany, J. Long fiber Bragg grating sensor interrogation using discrete-time microwave photonic filtering techniques. Opt. Express 2013, 21, 28175–28181. [Google Scholar] [CrossRef] [PubMed]
- Yao, J.P. Microwave photonics for high-resolution and high-speed interrogation of fiber Bragg grating sensors. Fiber Integr. Opt. 2015, 34, 230–242. [Google Scholar] [CrossRef]
- Chen, H.; Zhang, S.; Fu, H.; Zhou, B.; Chen, N. Sensing interrogation technique for fiber-optic interferometer type of sensors based on a single-passband RF filter. Opt. Express 2016, 24, 2765–2773. [Google Scholar] [CrossRef] [PubMed]
- Hervás, J.; Richiutti, A.L.; Li, W.; Zhu, N.H.; Fernández-Pousa, C.R.; Sales, S.; Li, M.; Capmany, J. Microwave photonics for optical sensors. IEEE J. Sel. Top. Quantum Electron. 2017, 23, 5602013. [Google Scholar] [CrossRef]
- Comanici, M.I.; Chen, L.R.; Kung, P. Microwave photonic filter-based interrogation system for multiple fiber Bragg grating sensors. Appl. Opt. 2017, 56, 9074–9078. [Google Scholar] [CrossRef]
- Comanici, M.-I.; Hu, J.; Moslemi, P.; Chen, L.R. Simultaneous interrogation of multiple fiber Bragg grating temperature sensors using a microwave photonic approach. Appl. Opt. 2018, 57, 8338–8342. [Google Scholar] [CrossRef]
- Capmany, J.; Ortega, B.; Pastor, D. A tutorial on microwave photonic filters. J. Lightw. Technol. 2006, 24, 201–229. [Google Scholar] [CrossRef]
- Mora, J.; Ortega, B.; Díez, A.; Cruz, J.L.; Andrés, M.V.; Capmany, J.; Pastor, D. Photonic microwave tunable single-bandpass filter based on a Mach-Zehnder interferometer. J. Lightw. Technol. 2006, 24, 2500–2509. [Google Scholar] [CrossRef]
- Yao, J. Photonic generation of microwave arbitrary waveforms. Opt. Commun. 2011, 284, 3723–3736. [Google Scholar] [CrossRef]
- Chen, L.R. Photonic generation of chirped microwave and millimeter wave pulses based on optical spectral shaping and wavelength-to-time mapping in silicon photonics. Opt. Commun. 2016, 373, 70–81. [Google Scholar] [CrossRef]
- Wang, C.; Yao, J. Chirped microwave pulse generation based on optical spectral shaping and wavelength-to-time mapping using a Sagnac loop mirror incorporating a chirped fiber Bragg grating. J. Lightw. Technol. 2009, 27, 3336–3341. [Google Scholar] [CrossRef]
- Moslemi, P.; Chen, L.R.; Rochette, M. Simultaneously generating multiple chirped microwave waveforms using an arrayed waveguide Sagnac interferometer. Electron. Lett. 2017, 53, 1534–1535. [Google Scholar] [CrossRef]
- Arigiris, A.; Konstantaki, M.; Ikiades, A.; Chronis, D.; Florias, P.; Kallimani, K.; Pagiatakis, P. Fabrication of high-reflectivity superimposed multiple-fiber Bragg gratings with unequal wavelength spacing. Appl. Opt. 2002, 27, 1306–1308. [Google Scholar] [CrossRef]
- Moselmi, P.; Rochette, M.; Chen, L.R. Simultaneous generation of WDM chirped microwave waveforms using integrated spectral shapers in silicon photonics. J. Lightw. Technol. 2018, 36, 5498–5504. [Google Scholar] [CrossRef]


© 2019 by the authors. Licensee MDPI, Basel, Switzerland. This article is an open access article distributed under the terms and conditions of the Creative Commons Attribution (CC BY) license (http://creativecommons.org/licenses/by/4.0/).
Share and Cite
Chen, L.R.; Comanici, M.-I.; Moslemi, P.; Hu, J.; Kung, P. A Review of Recent Results on Simultaneous Interrogation of Multiple Fiber Bragg Grating-Based Sensors Using Microwave Photonics. Appl. Sci. 2019, 9, 298. https://doi.org/10.3390/app9020298
Chen LR, Comanici M-I, Moslemi P, Hu J, Kung P. A Review of Recent Results on Simultaneous Interrogation of Multiple Fiber Bragg Grating-Based Sensors Using Microwave Photonics. Applied Sciences. 2019; 9(2):298. https://doi.org/10.3390/app9020298
Chicago/Turabian StyleChen, Lawrence R., Maria-Iulia Comanici, Parisa Moslemi, Jingjing Hu, and Peter Kung. 2019. "A Review of Recent Results on Simultaneous Interrogation of Multiple Fiber Bragg Grating-Based Sensors Using Microwave Photonics" Applied Sciences 9, no. 2: 298. https://doi.org/10.3390/app9020298
APA StyleChen, L. R., Comanici, M.-I., Moslemi, P., Hu, J., & Kung, P. (2019). A Review of Recent Results on Simultaneous Interrogation of Multiple Fiber Bragg Grating-Based Sensors Using Microwave Photonics. Applied Sciences, 9(2), 298. https://doi.org/10.3390/app9020298