Article

Detection and Characterization of Debonding Defects in Aeronautical Honeycomb Sandwich Composites Using Noncontact Air-Coupled Ultrasonic Testing Technique

1
School of Mechanical Engineering and Automation, Beihang University, Beijing 100191, China
2
The Collaborative Innovation Center for Advanced Aero-Engine (CICAAE), Beijing 100191, China
*
Author to whom correspondence should be addressed.
Appl. Sci. 2019, 9(2), 283; https://doi.org/10.3390/app9020283
Submission received: 13 November 2018 / Revised: 20 December 2018 / Accepted: 20 December 2018 / Published: 15 January 2019
(This article belongs to the Special Issue Damage Inspection of Composite Structures)

Abstract

:
The finite models of honeycomb sandwich composite with intact and embedded debonding defects are constructed. The sound pressure in fluid domain and the stress strain problem in solid domain are related by acoustic-structure coupling method, which visually shows the propagation process and modal characteristics of the acoustic wave inside the honeycomb sandwich composite. The simulation results show that the transmission longitudinal wave T1 (transmission initial wave) can effectively characterize debonding defects of honeycomb sandwich composite. However, in the actual detection of honeycomb sandwich composite, there are some problems, such as poor Signal-to-noise ratio (SNR) of received signal, incognizable transmission initial wave. In order to solve these problems, this paper proposes to apply polyphase coded pulse compression technique to air-coupled ultrasonic testing system. The actual test results show that the SNR of received signal is effectively improved, the transmission initial wave can be effectively identified, and the compressed signal has a good response to debonding defect. The air-coupled ultrasonic testing C scan result of honeycomb sandwich composite verifies the rationality and correctness of the theoretical simulation and signal processing technique, which promotes industrial application of air-coupled ultrasonic testing technique in the aerospace field.

Graphical Abstract

1. Introduction

In recent years, honeycomb sandwich composite materials have been widely used in aerospace and aviation industries owing to their excellent physical and mechanical properties, such as high specific strength, high specific stiffness, good sound, and heat insulation property [1,2,3]. In particular, honeycomb sandwich composite materials are used as a structural material in the helicopter rotor, aircraft fuselage, the thermal protective layer of spacecraft, etc. Their performance are directly related to the safety and reliability of an aircraft. Therefore, it is necessary to continue the rigorous quality inspection of honeycomb composite materials.
However, owing to the influence of temperature, pressure, and other factors, honeycomb composite materials often suffer from delamination defects, debond defects, or inclusion defects in the manufacturing and service process [4,5]. These defects significantly reduce the fatigue life and mechanical strength of honeycomb composite materials, and seriously affect the safety and reliability of components. At present, although the preparation process is strictly controlled, production defect cannot be avoided. Therefore, an effective and reliable non-destructive testing technique should be used for the detection of defects in effects in such materials and components to ensure that the physical and mechanical properties of the components meet the requirements.
Currently, the main technologies used for testing honeycomb sandwich composite materials include X-ray, thermography and ultrasonic methods, etc. The detection performance of X-ray digital radiography methods, thermography and ultrasonic C scan for the characterization of typical defects in honeycomb composite has been studied by Baoquan [6] and Taylor [7]. The detectability of core defect of honeycomb structure by ultrasonic C-scan method was studied by Hagemaier [8]. Another on detection of skin-to-core debonding defect in honeycomb structure using lock-in thermography was shown by Huanxue [9]. However, X-ray technology is less sensitive to area-type defects of honeycomb composite materials, because of debond efects, inclusion defects and other area-type defects, which cause small changes in the energy, leading to low imaging contrast. Thermography technology is very effective for the etection of superficial defects, however it still has great difficulty in detecting deep defects, such as, the debond defects of honeycomb sandwich composite materials with thick skin. The immersion ultrasonic technology is restricted by the coupling agent, which can cause pollution and damage to the surface of honeycomb composite materials. Therefore, it is need to explore a kind of testing technology needs to be explored that does not need a coupling agent, is not limited by the depth of defects in materials, and can detect area-type defects.
Air-coupled ultrasonic testing (ACUT) technique is currently a suitable testing technique, which has very significant advantages, such as, non-destructive, completely non-contact, suitable for in itu testing, strong defect characterization, and can avoid the traditional coupling agent (water, gels etc.) pollution and damage to materials [10,11,12,13]. Therefore, the quality evaluation of honeycomb sandwich composite materials has promising applications based on ACUT technique. However, it is difficult to apply this technique for the inspecting inspection of honeycomb sandwich composite. This is because ultrasound will suffer high attenuation [14,15,16] and various noises [17,18] during transmission, resulting in weak transmitted signal and poor signal-to-noise ratio. Hence, using effective methods [19,20,21] to overcome these limiting factors is the key to applying the air-coupled ultrasonic testing technique to the quality inspection of honeycomb sandwich composite materials.
In this paper, the application of air-coupled ultrasonic technology to the non-destructive testing of debonding defects of honeycomb sandwich composites is studied and demonstrated. First, a reasonable two-dimensional finite element model of honeycomb sandwich composite is established by analyzing the three-dimensional structural characteristics of honeycomb sandwich composite. Based on Fluid–Solid coupling wave control equation, the acoustic structure boundary is established, and the visualization of ultrasonic propagation inside honeycomb sandwich composite is achieved. Second, a finite model of honeycomb sandwich composites with pre-embedded debonding defects is established. The simulation results of sound wave propagated in the complete model and the embedded defect model are compared and analyzed, and the effect of sound wave and defect is visualized. Third, aiming at the problem of weak transmission signal and poor signal-to-noise ratio in the actual detection of honey sandwich composite, the P3 polyphase coded pulse compression technology is proposed to enhance the original transmission signal, and the enhanced signal has a good response to the debonding defect. Finally, based on the air-coupled pulse compression signal, the C-scan of honeycomb sandwich composite with embedded debonding defect is carried out, and the accuracy and effectiveness of air-coupled ultrasonic testing technology are verified.

2. Theory and Model

2.1. Finite Element Method

Due to the different physical properties of medium, the modes of ultrasonic wave in different mediums are also different. For example, when ultrasonic wave propagates in air and liquid, only longitudinal wave exist because viscosity is negligible; when ultrasonic wave propagates in solid, due to the effect of shear force, there are both longitudinal wave and transverse wave. However, when there are both solid and air mediums in the process of ultrasonic propagation, the situation will become more complicated. For honeycomb sandwich composite, the ultrasonic propagation in air can be attributed to pressure acoustics problem in fluid field. The ultrasonic propagation in aluminum, glass fiber reinforce polymers (GFRP), epoxy resin adhesive layer can be attributed to stress-strain problem in solid field. The ultrasonic propagation at the fluid–solid coupling interface can be attributed to fluid-solid coupling stress-strain problem under certain continuous conditions. Therefore, it is necessary to analyze and discuss wave equation in fluid mechanics, structural mechanics equation, fluid-solid dynamic coupling equation, and boundary conditions to provide an accurate and reliable theoretical basis for finite element analysis.
The propagation of sound wave in air can be expressed as [22]:
[ M f ] { P f ¨ } + [ K f ] { P f } = { F f }
where [ M f ] is mass matrix of air medium; [ K f ] is stiffness matrix of air medium; { P f } is acoustic pressure vector of unit node in air medium, { F f } is the external force vector.
The propagation of sound wave in aluminum, glass fiber reinforce polymers (GFRP), epoxy resin adhesive layer can be written as [22]:
[ M s ] { U ¨ } + [ K s ] { U } = { F s }
where [ M s ] is mass matrix of olid medium, { F s } is pressure load of solid medium, [ K s ] is stiffness matrix of solid medium, { U } is displacement vector of solid medium.
However, when sound wave reaches the fluid-solid coupling interface, the dynamic interaction between the fluid medium at fluid interface and the solid medium at solid interface need to be considered. Therefore, the discrete form of sound wave control equation of fluid-solid coupling interface [22] can be expressed as:
[ ρ 0 R f T [ M f ] [ M s ] 0 ] { { U ¨ } { P f ¨ } } + [ 0 [ K f ] [ K s ] R ] ] { { U } { P f } } = { { F f } { F s } }
where [ R ] is the coupling matrix at the fluid-solid coupling interface. This equations mean that the nodes at fluid-solid interface are continuous and the nodes both have displacement component and pressure component.

2.2. Finite Element Model

2.2.1. The Development Model

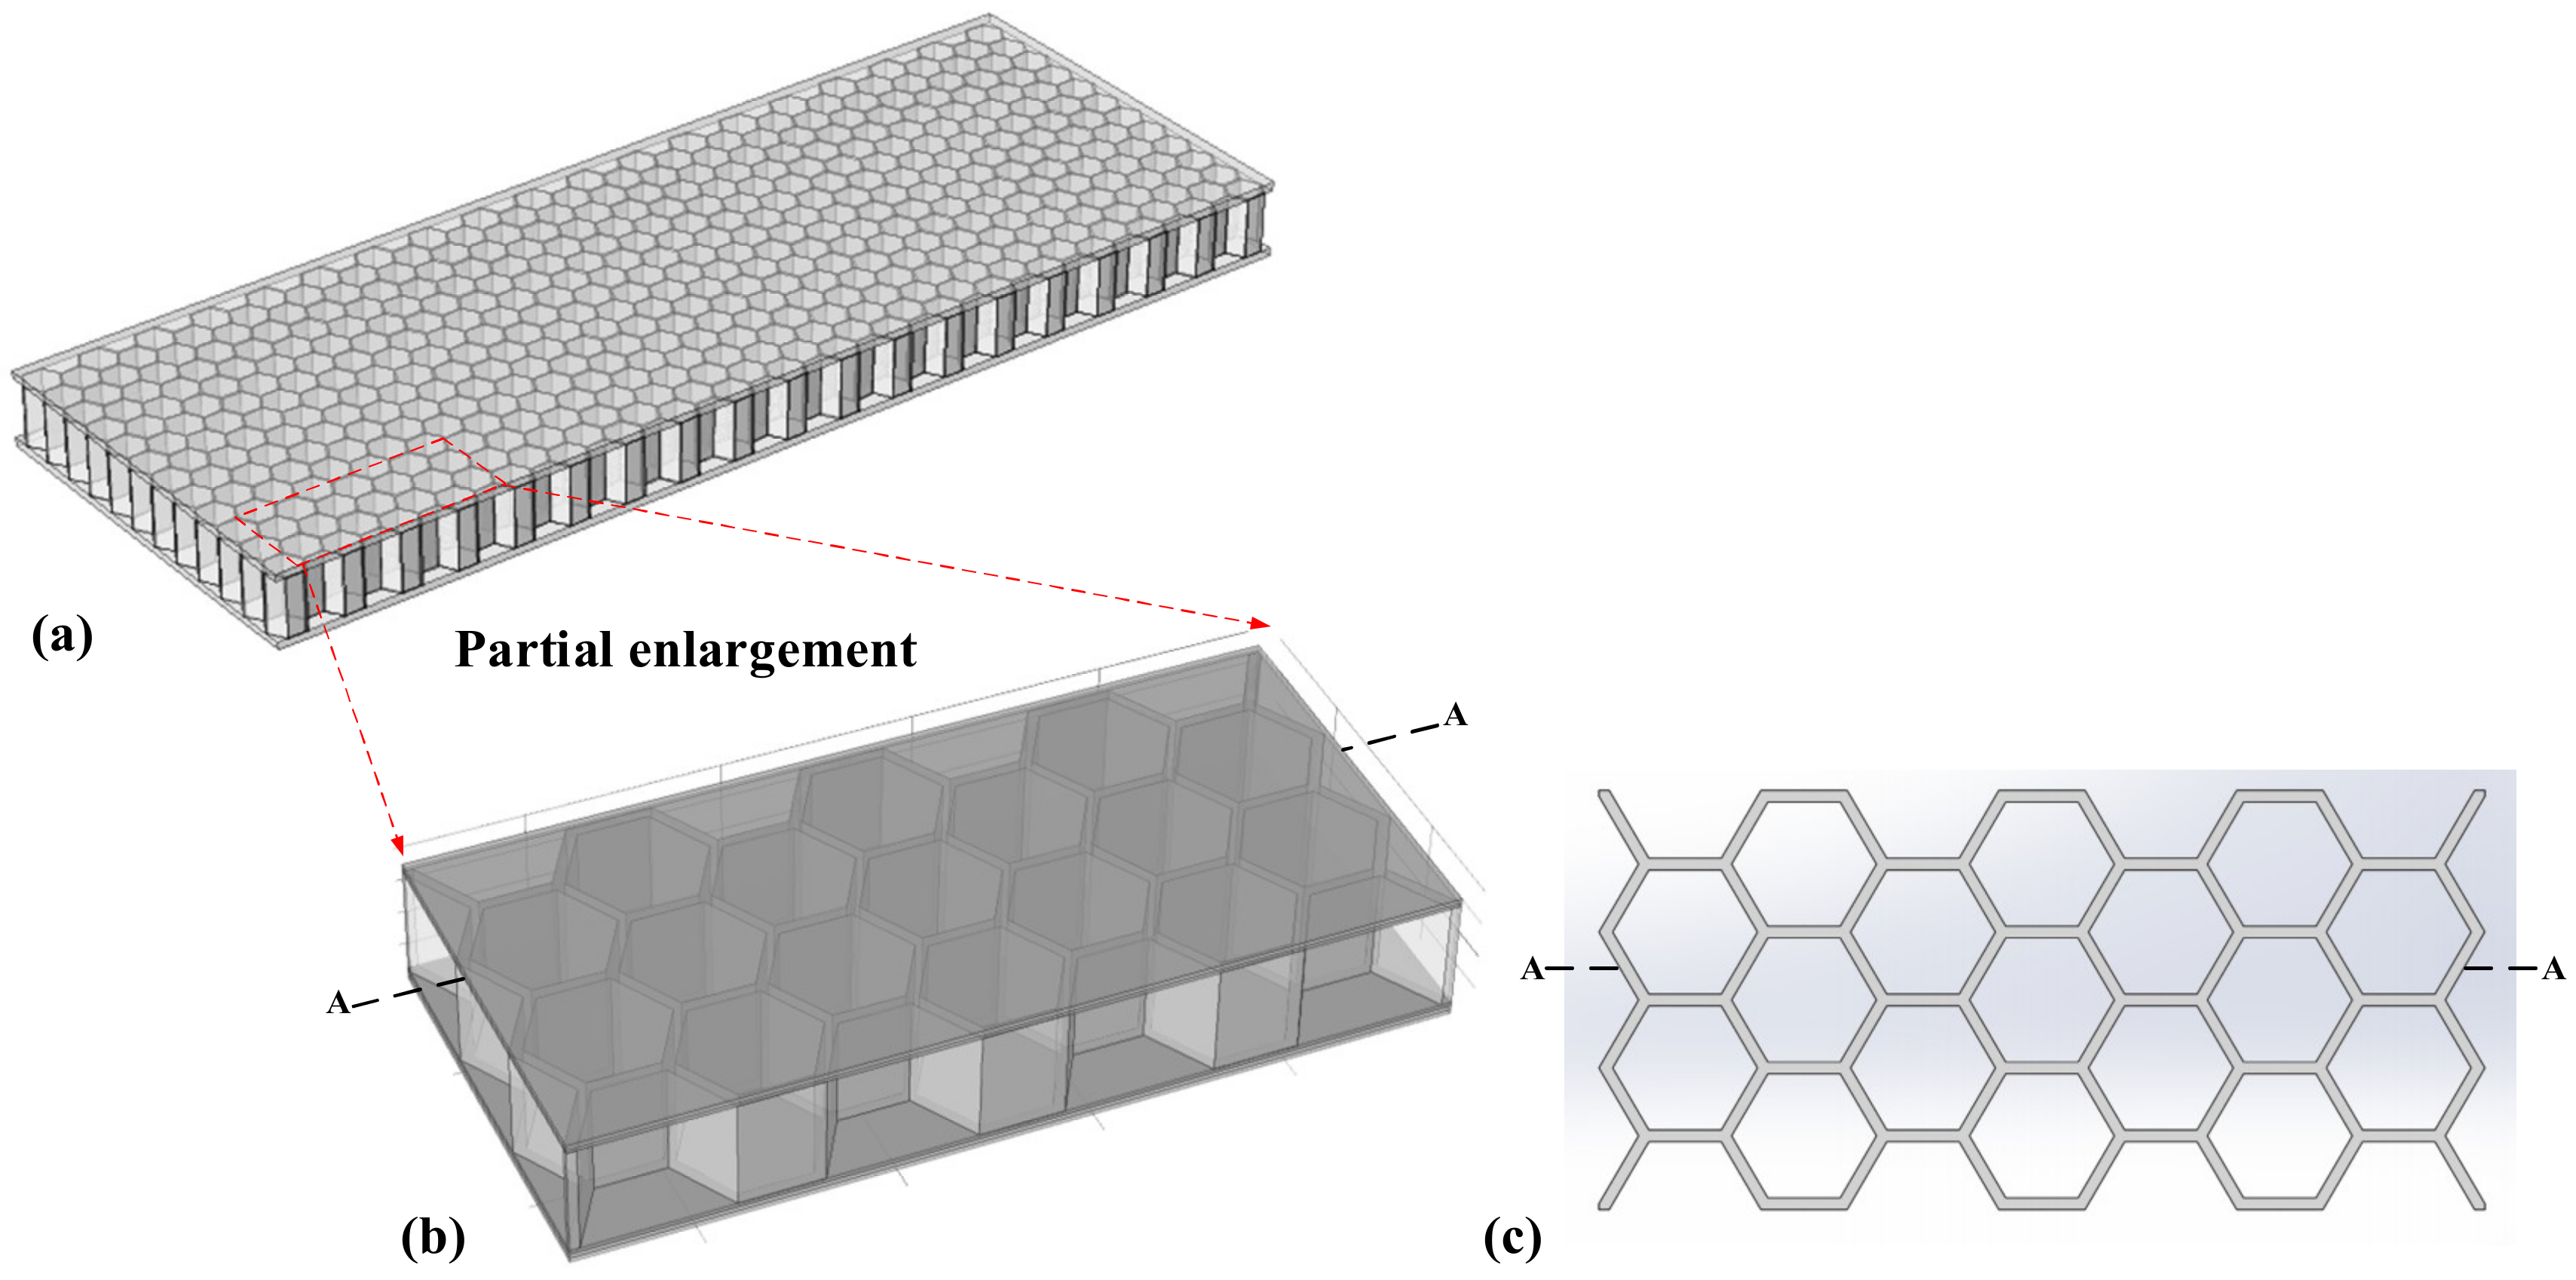
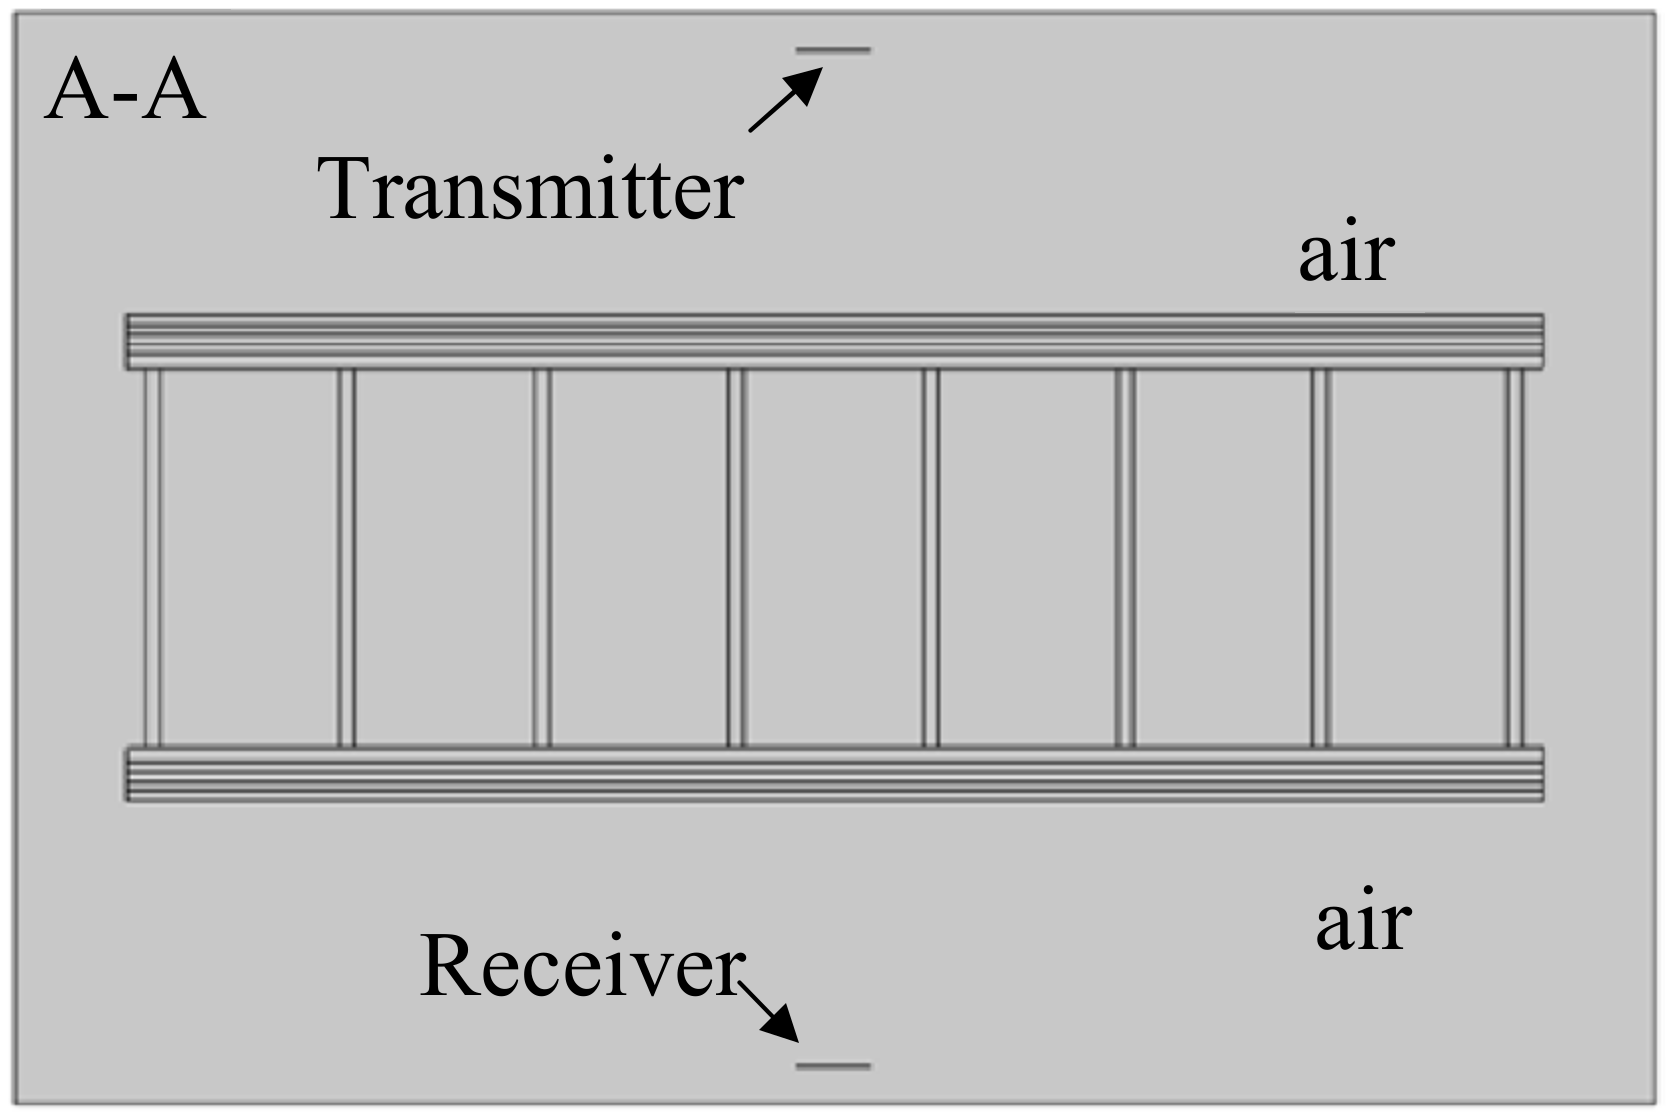
Honeycomb sandwich composite consists of glass fiber reinforced polymer (the four layer structure of the honeycomb sandwich composite skin in this paper is [0°/90°/0°/90°]), aluminum honeycomb core and epoxy resin adhesive layer, as shown in Figure 1. The real model of honeycomb sandwich composite is three-dimensional case. In the actual finite element analysis, there are some problems such as difficulty in modeling, mesh division, high computational complexity, etc. In order to overcome these problems, by analyzing the structural characteristics of honeycomb sandwich composite and the propagation path of acoustic wave in honeycomb sandwich composite [23,24], three-dimensional problem can be simplified into a two-dimensional problem, as shown in Figure 2. Figure 2b is partial enlargement of the honeycomb composite material of Figure 2a. Figure 2c is a cross section of the honeycomb core of Figure 2b. After observing the structural rule of honeycomb core in Figure 2c, it can be found that when vertically dividing along the honeycomb core, there is mainly a case where the dividing is performed in the form of A-A (The simplified two-dimensional model is shown in Figure 3. The spacing between honeycomb core walls in model will be different. Here, taking only vertically dividing at 1/2 honeycomb core wall as example). Therefore, based on this two-dimensional model, it is reasonable to study the propagation rule of acoustic wave inside the honeycomb sandwich composite.
The transient two-dimensional honeycomb sandwich composite model established in this paper is based on Comsol Multiphysics software. A transmitter is arranged in the upper part of air domain in the FEM. In order to maximize the energy of sound source coupled into honeycomb sandwich composite, the distance between honeycomb sandwich composite and sound source is set as the focal length of sound source. A receiver is arranged in the lower part of air domain. The received signal of receiver is synthesized by sound pressure P integral of the discrete points on the line source. The two-dimensional model includes the air domain, honeycomb sandwich composite sample, and radiation sound source, as shown in Figure 3.
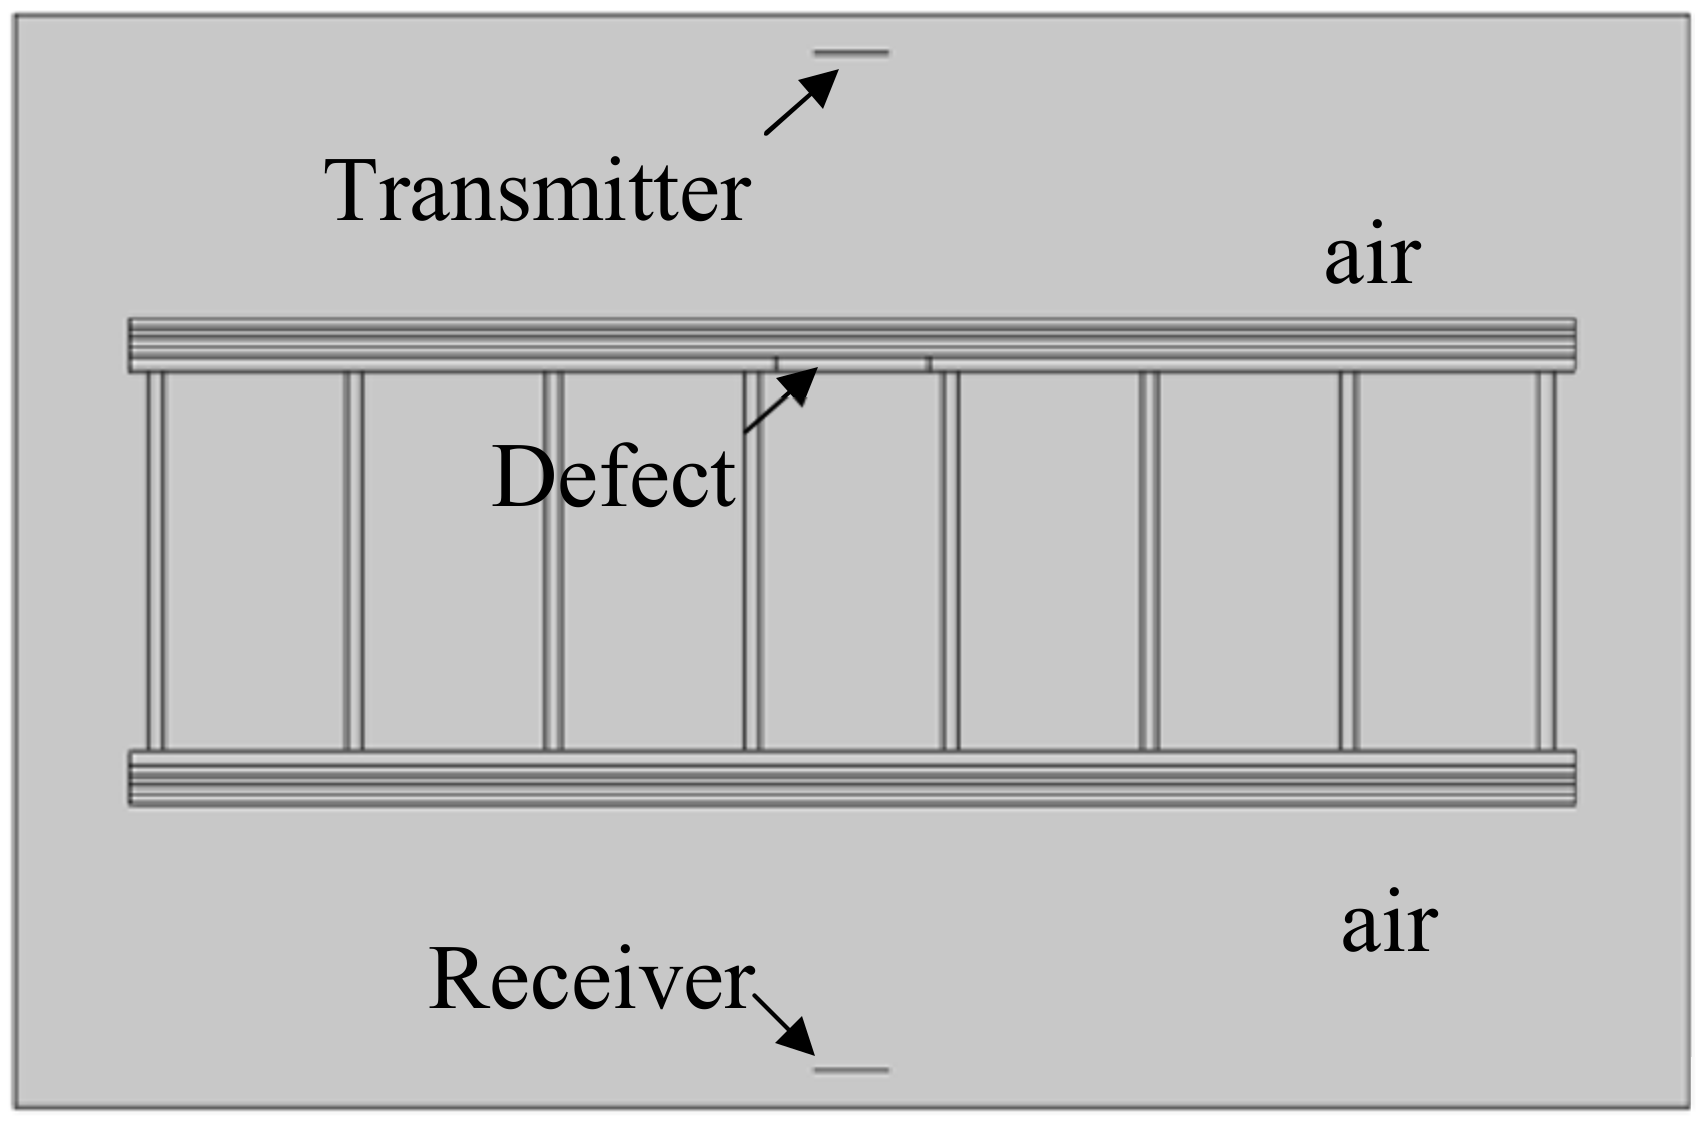
In order to investigate the effect and response of ultrasonic wave to debonding defects of honeycomb sandwich composite, air layer is embedded in the middle of the epoxy resin adhesive layer to simulate the presence of debonding defect in the real adhesive layer, as shown in Figure 4.

2.2.2. Finite Element Mesh and Time Step

In order to accurately invert the propagation of sound wave in medium and take into account the amount of simulation calculation, based on previous research and reference literature [22,25], we deduce that a single wavelength in medium contains at least 10 element meshes. Therefore, the medium meshing needs to satisfy the conditions given by Equation (4).
L mesh 1 10 C f
where C is sound velocity in medium, and f is frequency of sound wave. In the actual experiment, a relatively high-frequency air-coupled transducer (400 kHz) was used to improve the resolution. Therefore, during the simulation, the working frequency of loaded excitation signal is 400 kHz.
And, taking into account the actual conditions of the layers of the honeycomb sandwich composite sample, different mesh sizes are selected for different medium layers. The mesh type is free triangular mesh. The size of largest unit in free triangular of each medium layer is shown in Table 1.
In order to fully display the details of propagation of sound wave, time step was set to 30 ns.
The macroscopic properties of GFRP materials are found to be orthogonal anisotropy, and the physical properties are shown in Table 2. The linear elastic material is used in other solid domain (Aluminum honeycomb core and epoxy resin adhesive layer), and the material properties are shown in Table 3.

3. Specimen and Experimental Setup

3.1. Specimen

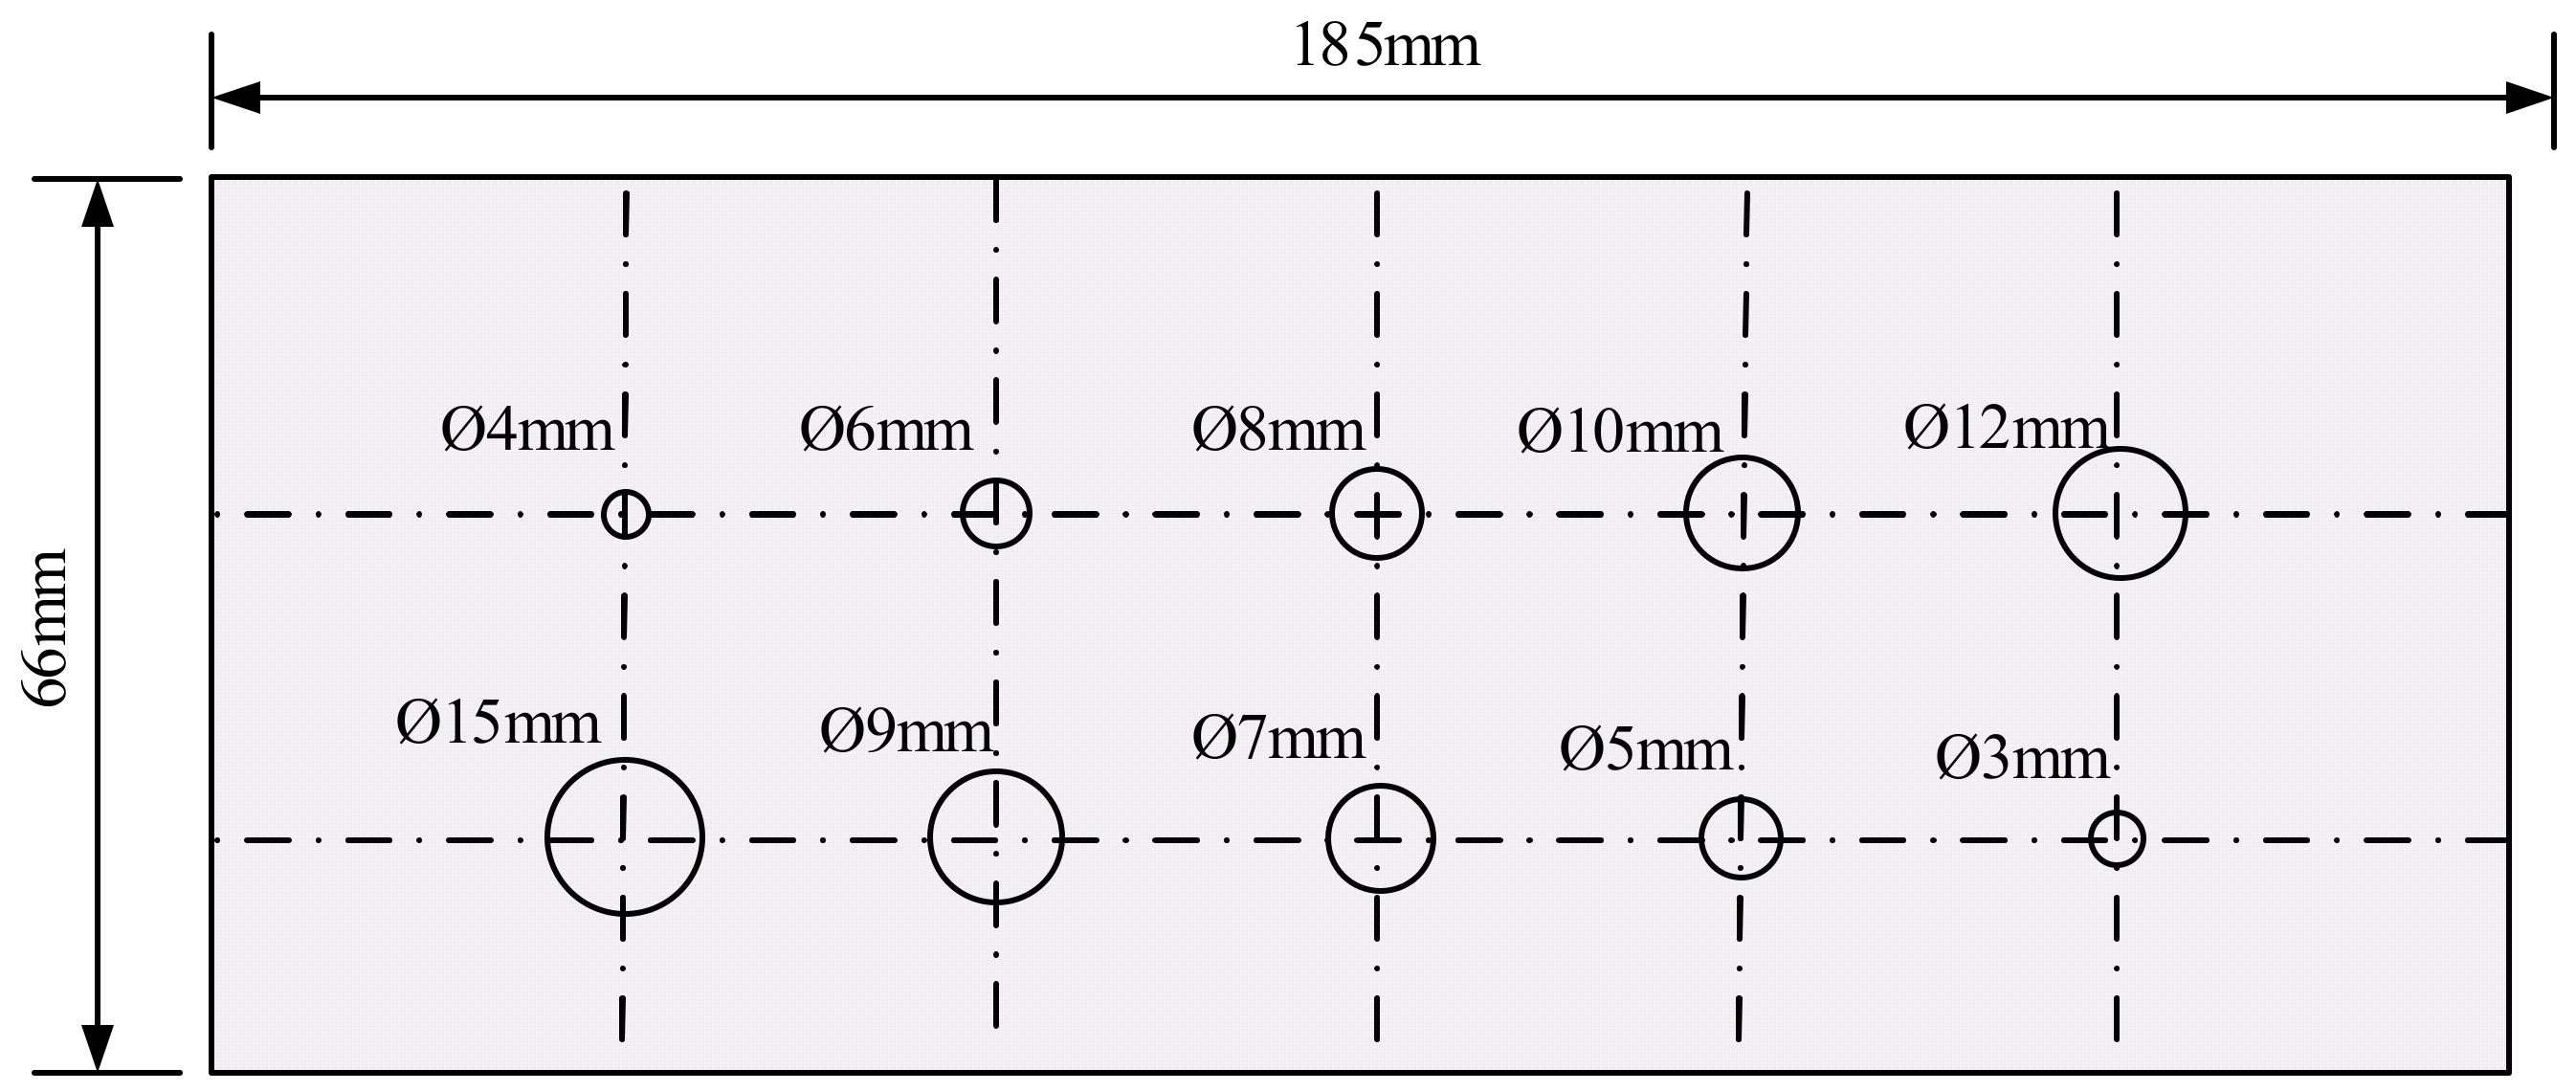
A honeycomb sandwich composite sample was prepared for use in air-coupled ultrasonic testing experiments. The size of the honeycomb sandwich composite sample is 66 mm × 185 mm × 5 mm. The skin of the honeycomb sandwich sample was glass fiber reinforced polymer (GFRP) with a thickness of 0.5mm. The honeycomb core was aluminum with a thickness of 3.6mm. The honeycomb core is regular hexagon with a side length of 0.2 mm and an aperture of 3.46 mm. Ten size of polytetrafluoroethylene (PTFE) with Φ3 mm, Φ4 mm, Φ5 mm, Φ6 mm, Φ7 mm, Φ8 mm, Φ9 mm, Φ10 mm, Φ12 mm, Φ15 mm were preset in the adhesive layer of honeycomb sandwich composite sample to simulate debonding defects, as shown in Figure 5.

3.2. Experimental Setup

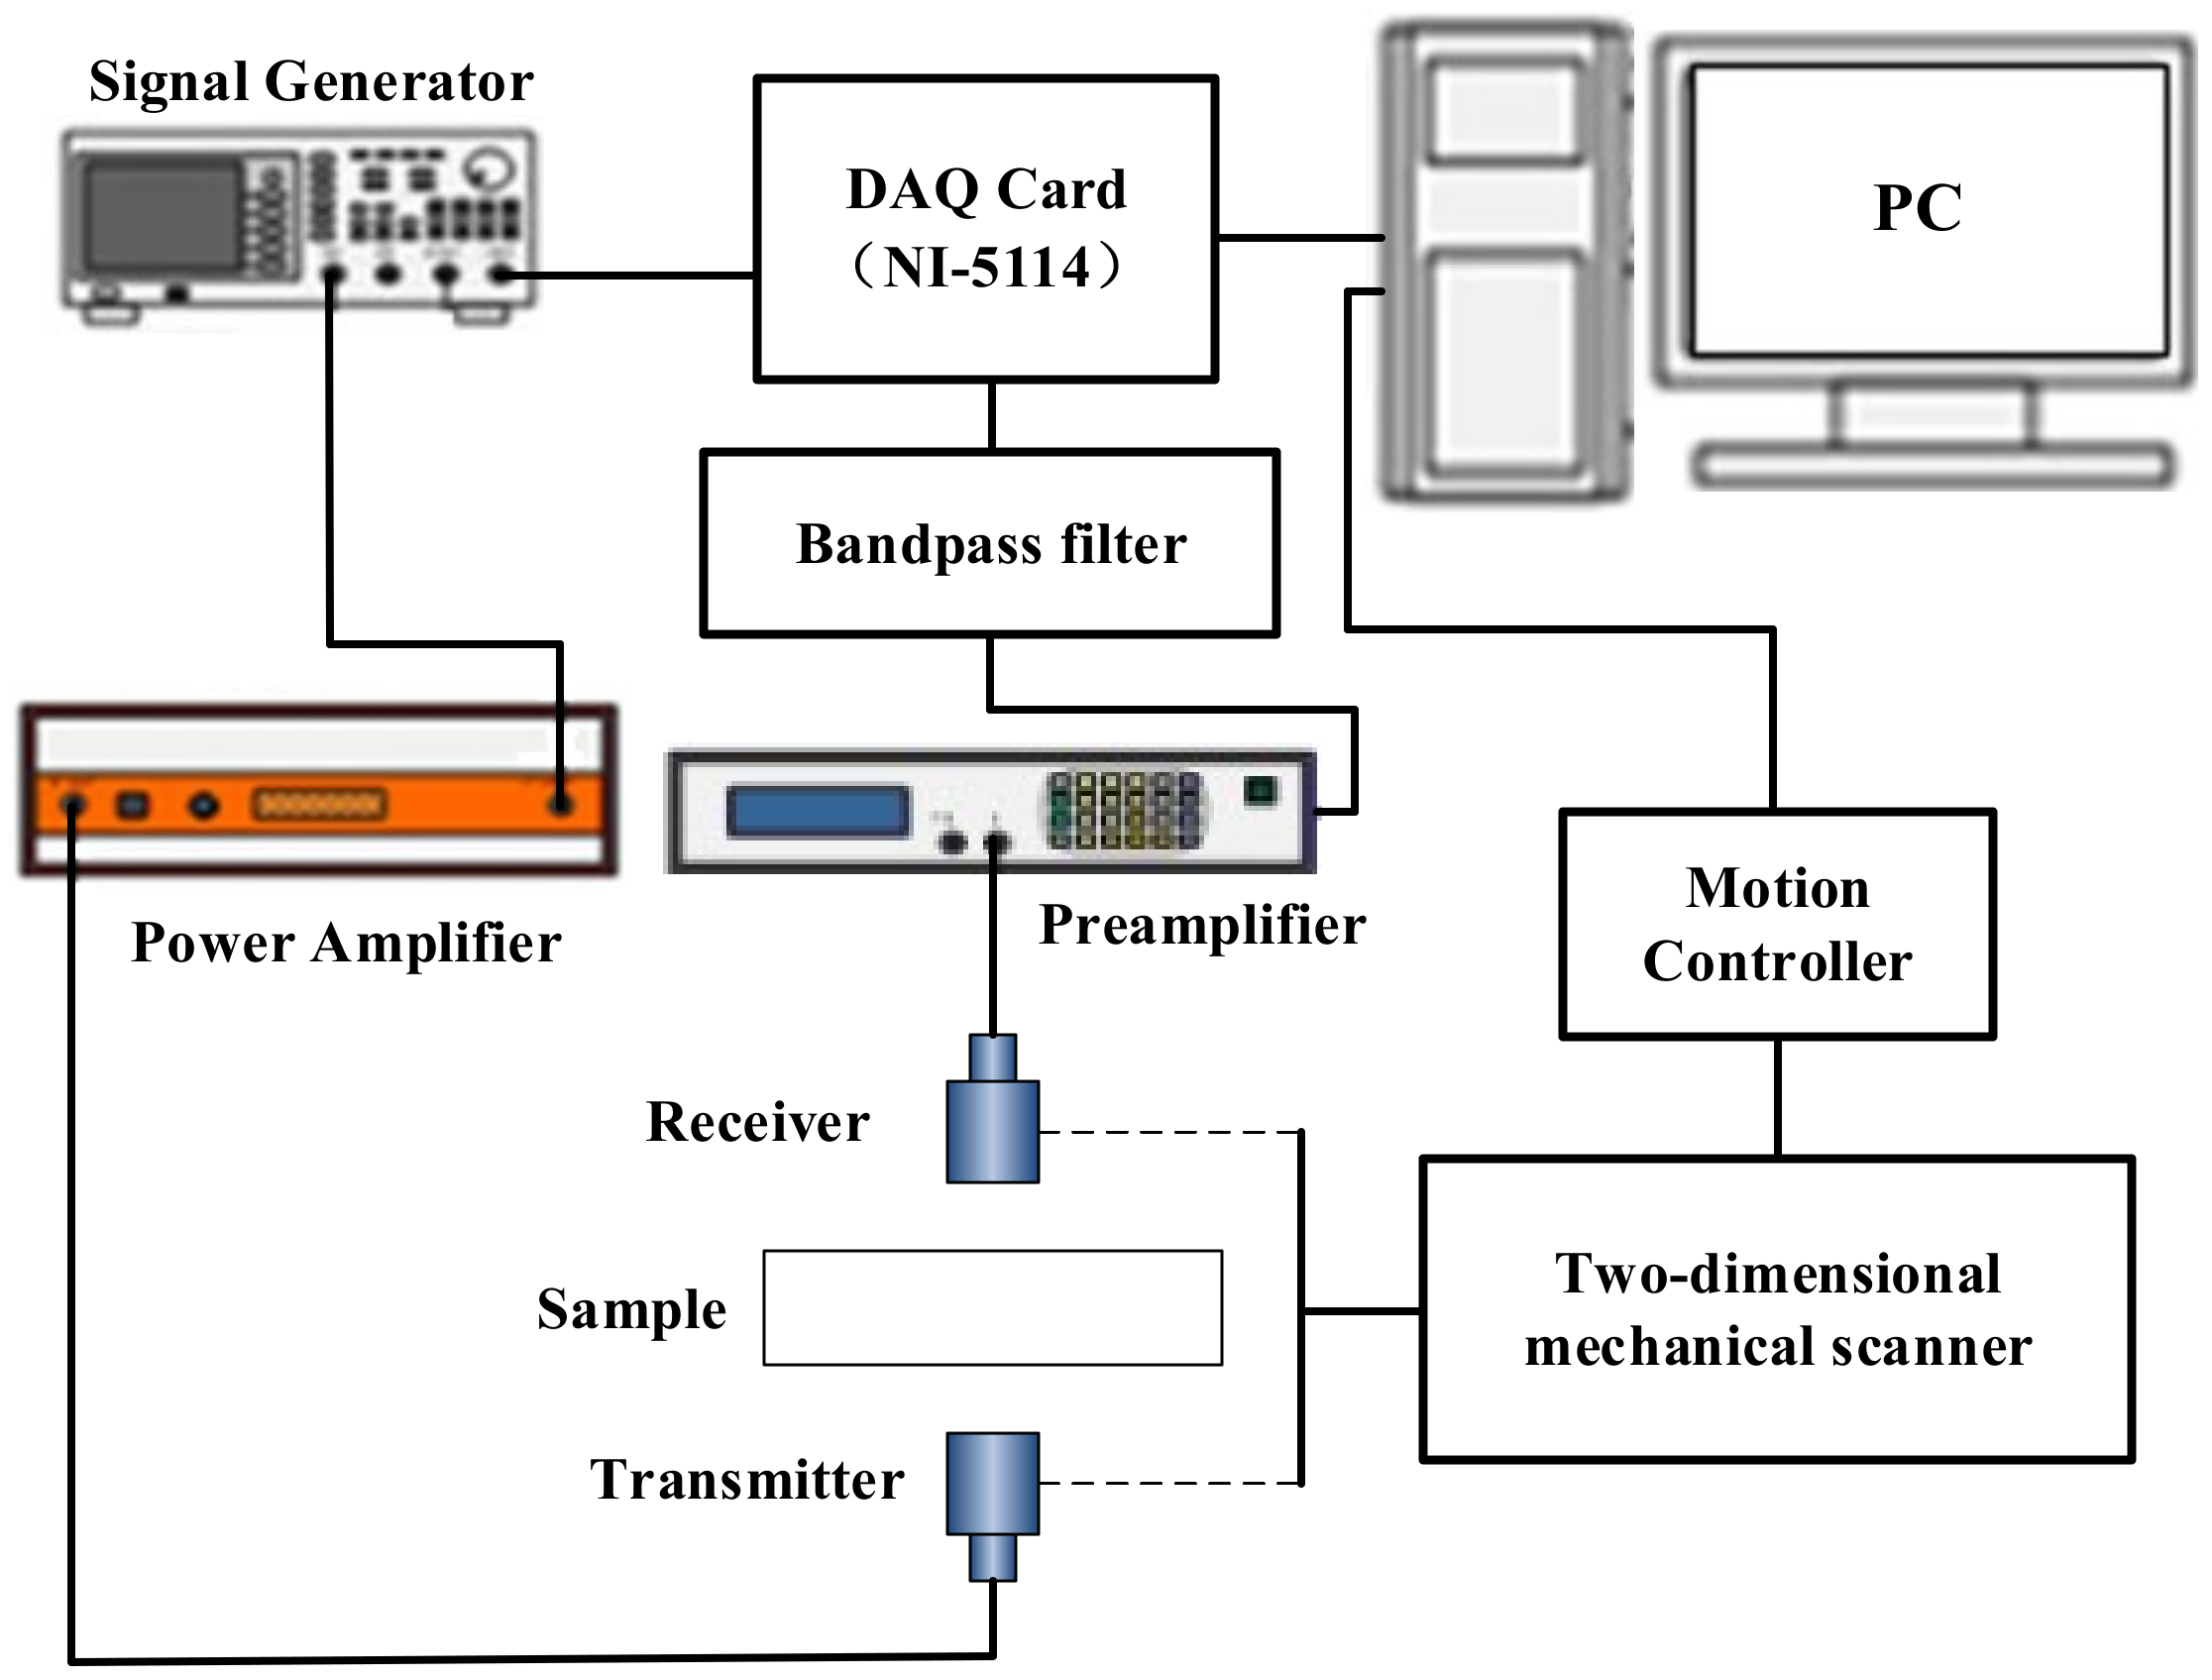
A schematic diagram of the air-coupled ultrasonic testing experimental setup is presented in Figure 6. The Signal generator Tektronix AFG3102 (Tektronix, USA) is used to produce an exciting signal with a specific coded sequence and bandwidth (33-bits P3 polyphse coded sequence with 3-cycles per-pulse and -6dB bandwidth is 138 kHz). Then, the signal is amplified by Power Amplifier (AR-75A250A, AR, USA) to excite Transmitter (YiChao, focused, the resonance frequency is 400 kHz and the diameter is 30 mm, Yichao, Suzhou, China). The excited ultrasonic signal passes through honeycomb sandwich composite sample and is received by Receiver (YiChao, focused). Then, the weak detected signal passes to Gain Amplifier and Bandpass Filter device (Panametrics 5800, Olympus, Japan) for gain compensation and filtering, acquired by an 8 bits, 250 Msps ADC (NI PCI-5114), which is embedded in PC. Then, the acquired data is transmitted to PC for processing operation. In conjunction with mechanical scanning module, including mechanical two-dimensional scanning frame (QMI LS-06), motion controller (QMI MC-ST-02), servo motor, etc., the air-coupled ultrasonic testing system can perform C-scan of honeycomb sandwich composite sample.

4. Results and Discussion

4.1. The Mode of Acoustic Wave in Honeycomb Sandwich Composite

Under air-coupled condition, the acoustic wave radiates to the calculation area, and reflection, transmission, and other acoustic phenomena occur after contact with the honeycomb sandwich composite sample. Based on the two-dimensional honeycomb sandwich composite model, the simulation result of sound field distribution with 19.32 μs is shown in Figure 7. In Figure 7, since part of acoustic wave energy is very low, logarithmic enhancement processing is performed on the simulation result for the convenience of observation. Figure 7 shows that the reflected longitudinal wave (R), edge longitudinal wave (El), transmitted longitudinal wave (T1), transmitted longitudinal wave (T2), and leakage Lamb wave (LL) can be clearly distinguished in air domain; and there are multiple Lamb wave (L) modes in the solid domain. After knowing the existence of acoustic wave type in the model, the effect of acoustic wave and defect can be analyzed accurately and reasonably.

4.2. Defect Characterization Using Air-Coupled Ultrasonic Wave

Based on the acoustic mode in honeycomb sandwich composite, acoustic response of debonding defect of honeycomb sandwich composite is studied, and the air-coupled ultrasonic characterization method of internal debonding defect of honeycomb sandwich composite is established. In order to accurately analyze response of the debonding defect of honeycomb sandwich composite to ultrasonic signal, a model with pre-embedded debonding defect in epoxy resin is established, as shown in Figure 4.
Figure 8 shows the sound field distribution of a intact honeycomb sandwich composite model and a honeycomb sandwich composite model with embedded debonding defect at 20.01 μs. Figure 8a shows the sound field distribution of the intact model at 20.01 μs, and Figure 8b shows the sound field distribution of pre-embedded debonding defect model at 20.01 μs. Comparing with Figure 8a and 8b, it is shown that the lamb wave in aluminum honeycomb core wall in direct contact with the debonding defect is seriously attenuated, and the corresponding leakage lamb wave is hardly visible; the transmitted longitudinal wave T1 is significantly attenuated, and the waveform is not visible, as shown in Figure 8b. Considering that the air-coupled ultrasonic vertical transmission method is used in the actual testing, the debonding defect of honeycomb sandwich composite can be effectively characterized by the transmission longitudinal wave T1.
As can be seen from comparison between Figure 9a,b, the transmitted longitudinal wave T1 can be effectively recognized, and the amplitude of the transmitted longitudinal wave T1 is significantly attenuated in the defect area and the non-defect area. This indicates that the transmission longitudinal wave T1 has a good response to the debonding defect, that is to say, it can effectively characterize the debonding defect based on the transmission longitudinal wave T1. Meanwhile, as can be seen, the A-scan also includes a plurality of multiple model signals, and it is difficult to identify them. However, it can be seen from simulation calculation results of Figure 8 and Figure 9 that the transmission longitudinal wave T1 (transmission initial wave) can effectively characterize the debonding defect of honeycomb sandwich composite material when an air-coupled transmission method is used.

4.3. Actual Detection of Debonding Defect Based on Air-Coupled Ultrasonic Testing

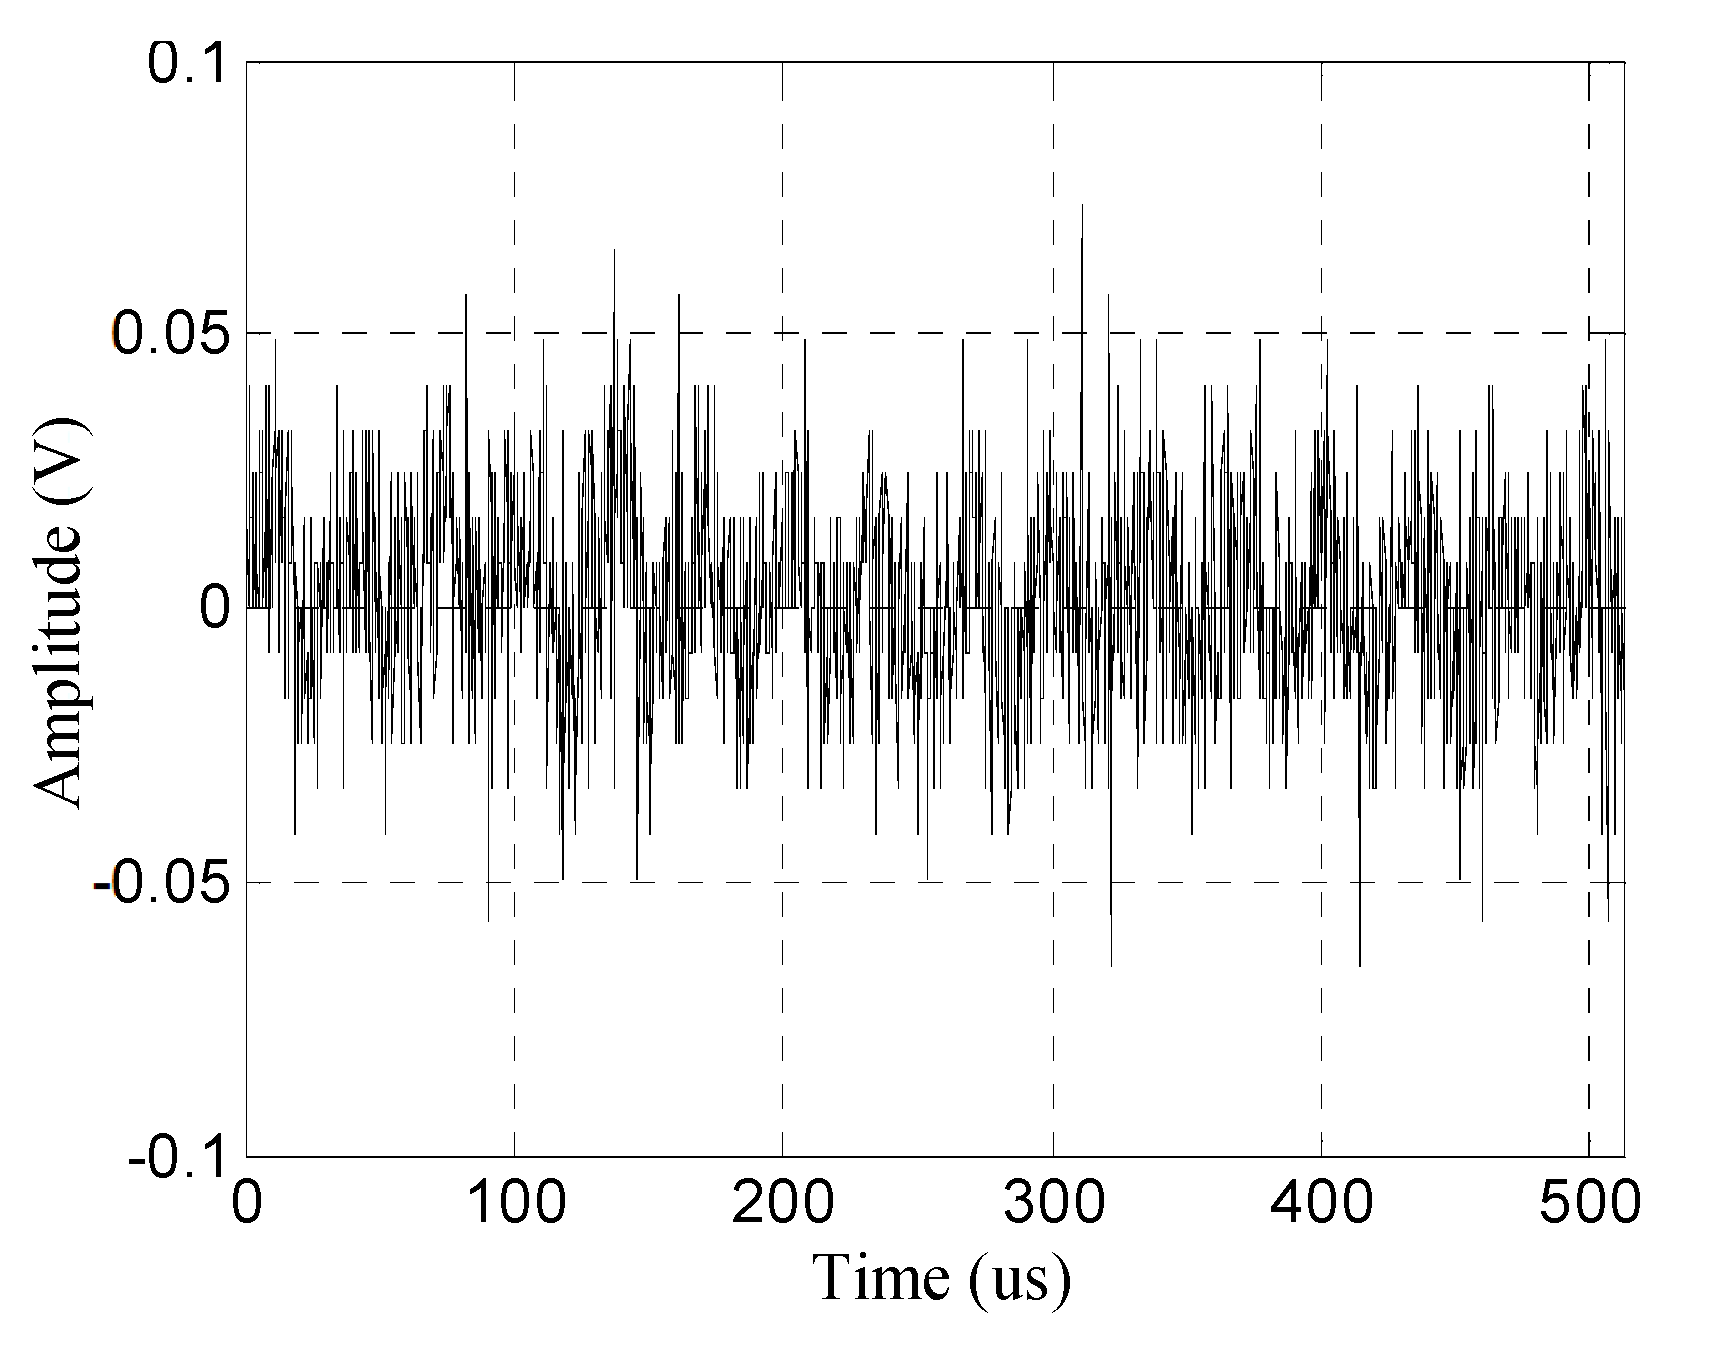
According to the analysis in Section 4.2, based on the finite simulation results, the air-coupled ultrasonic transmitted longitudinal wave T1 can effectively characterize debonding defect, but the effect is unsatisfactory in actual quality evaluation of honeycomb sandwich composite. This is because the ultrasound needs to pass through multiple air-solid coupling interfaces during actual detection, and will be affected by a variety of noise, resulting in serious energy attenuation, high noise level, poor signal-to-noise ratio, and the transmission initial wave cannot be identified (as shown in Figure 10). Therefore, the received signal of Figure 10 could not be used to evaluate the quality of honeycomb sandwich composite.
In order to overcome these problem, pulse compression technique in radar field is introduced into ACUT system. The advantage of this signal processing technology is increase the average transmitted power while still maintaining the range resolution [26,27,28,29]. When pulse compression technique is applied to ACUT system, the problem of poor SNR and weak transmission signal can be significantly improved. This technique is specifically performed by a matched filter, which correlates the received signal with the reference signal. In actual processing, to improve the computational efficiency of correlation algorithm, the pulse compression is usually implemented in frequency domain. The implementation steps are as follows: first, the time-reversed function of reference signal r(t) is processed by the Fast Fourier transform (FFT); second, the Fast Fourier Transform is implemented on received signal z(t); then, the two transformed signals are multiplied in frequency domain; lastly, the multiplication result is processed by Inverse Fast Fourier transform (IFFT), and finally the compressed signal o(t) is output. The above process can be expressed by Equation (5):
o ( t ) = IFFT { FFT { r ( t ) } · FFT { y ( t ) } }
According to the modulation information of ultrasonic signal, this signal processing technique can be divided into phase modulation pulse compression technique (e.g., Barker-coded pulse compression) and frequency modulation pulse compression technique (e.g., non-linear chirp pulse compression technology). This paper focuses on the application of P3 polyphase coded pulse compression technique. The phase angle of P3 polyphase code signal can be expressed as:
θ n = π ( n 1 ) 2 N 2 , n = 1 , , N 2
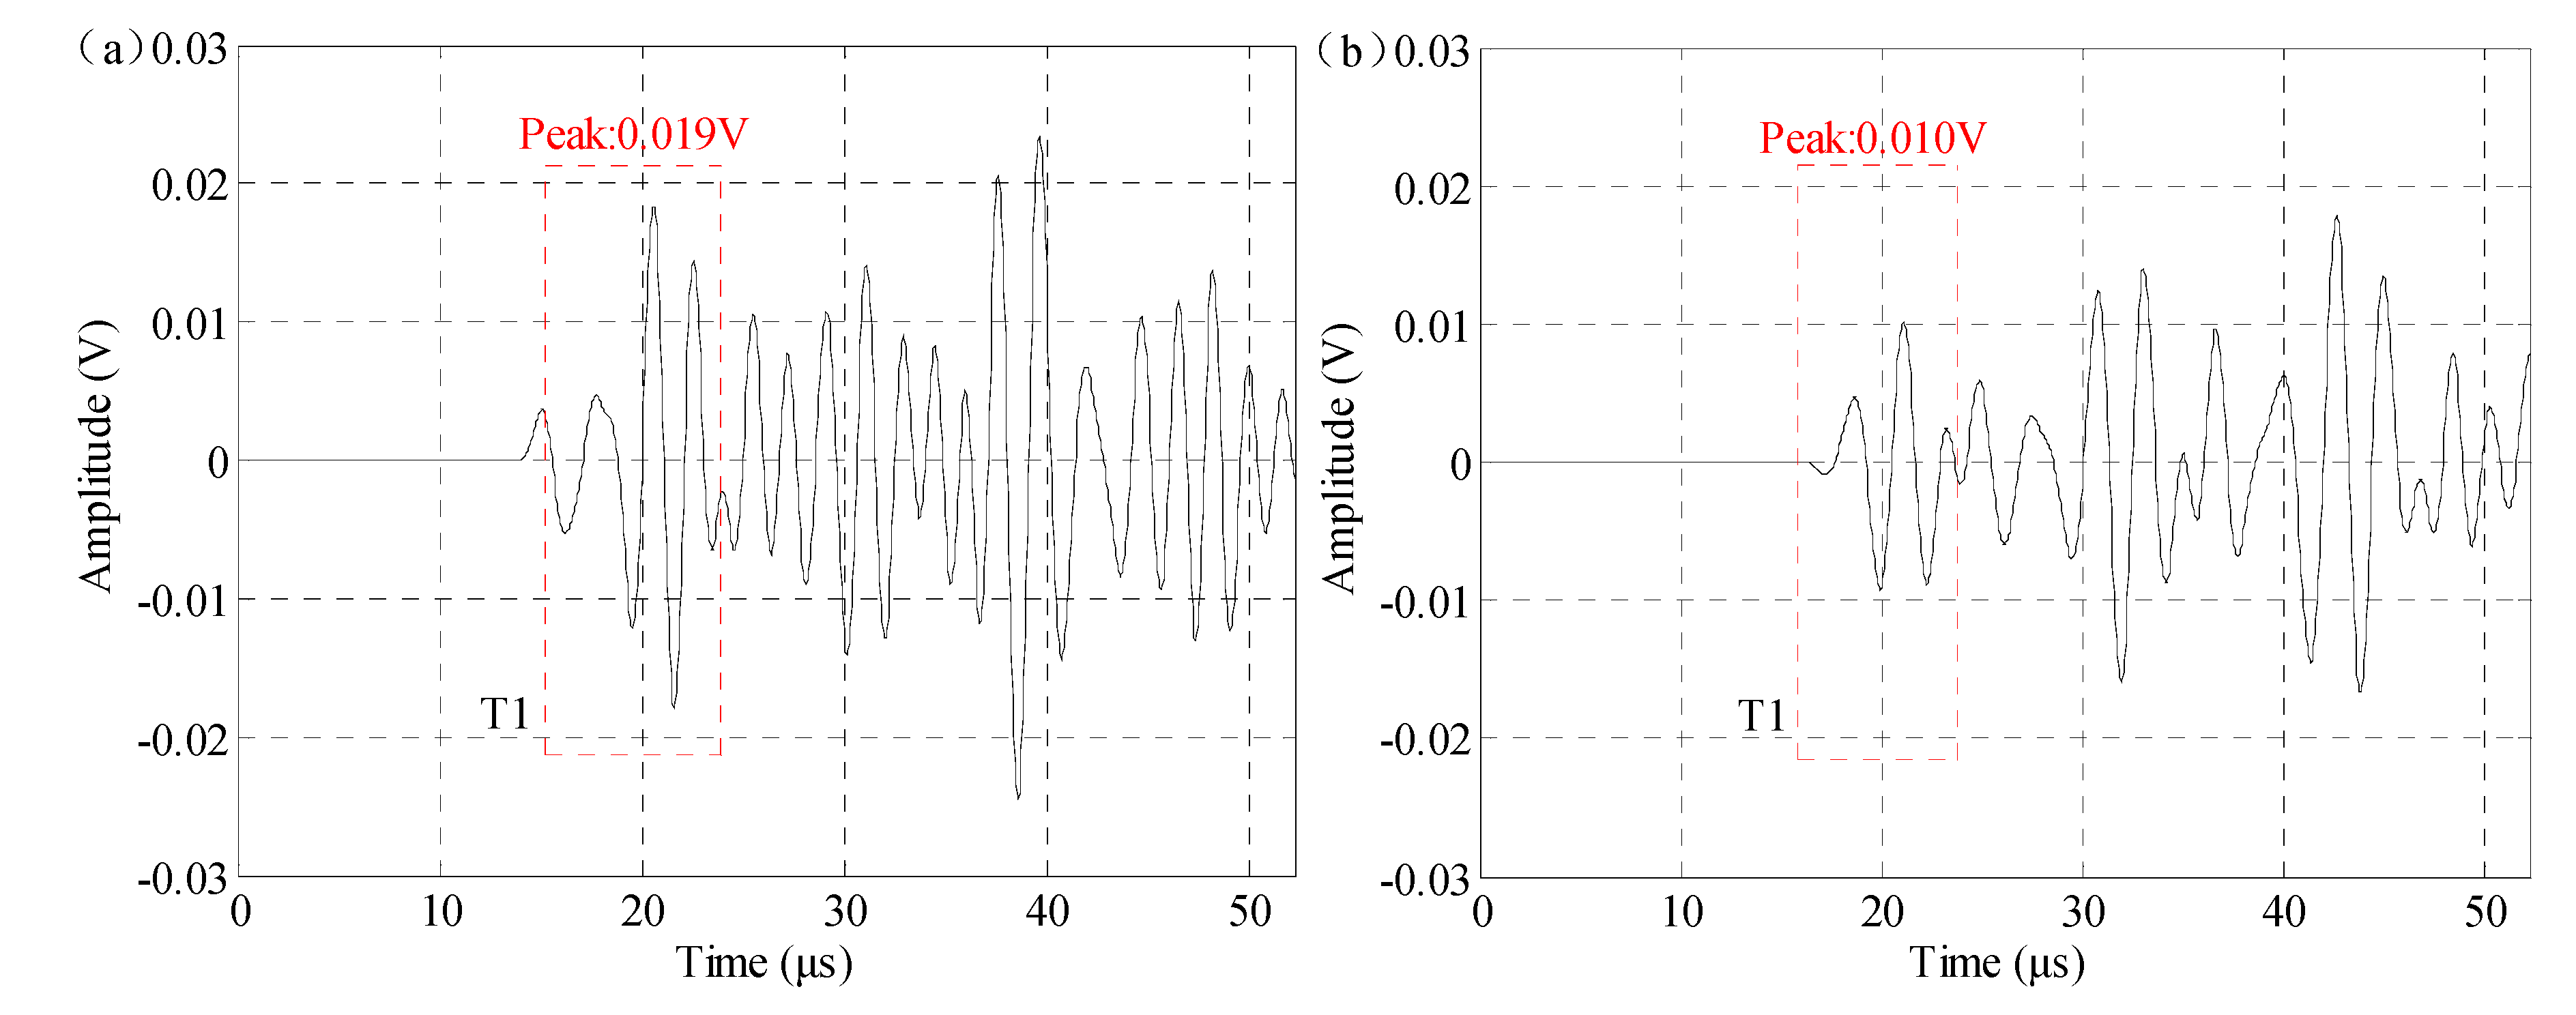
where N is the number of bit. When a value of N is given, the P3 polyphase coded sequence with specific phase angle can be generated. Through previous research [18], it is clear that when P3 polyphase coded signals are applied to actual ACUT, in order to obtain higher SNR and amplitude of transmitted signal, polyphase coded signal with higher bit number and 3-cycles per sub-pulse should be selected, and the length of polyphase coded signals need to meet the hardware requirement of ACUT system (Section 3.2) (that is, when the length of polyphase coded signal exceeds 100 bits, the pulse compression signal will be distorted and the effect of pulse compression will be poor). Therefore, when 33-bits P3 polyphase coded signal with 3-cycles per sub-pulse is selected, good processing effect can be obtained, as shown in Figure 11. The compressed signal of Figure 11a is collected in intact area, and the compressed signal of Figure 11b is collected in defect area. As can be seen from comparison between Figure 10 and Figure 11a, the amplitude level and SNR of transmission signal are greatly improved (the amplitude of transmission signal increased from 0.07 V to 2.08 V, and the SNR (Signal-to-noise ratio) of transmission increased from 1.0 dB to 9.2 dB). Comparing Figure 11a,b, it can be seen that the transmission initial wave of P3 polyphase coded pulse compression signal significantly attenuate in the defect area, which is consistent with the simulation result as shown in Figure 9. In actual detection, the distance between transducer and sample is much larger than that of simulation model, so the transmission initial wave arrives later, but the law and result are consistent, that is, P3 polyphase coded pulse compression signal has a good response to the debonding defect of honeycomb sandwich composite. Therefore, the characterization of debonding defect of honeycomb sandwich composite based on P3 polyphase coded pulse compression signal is reasonable in the actual ACUT detection.

4.4. Image of Debonding Defect with Air-Coupled Ultrasonic Waves

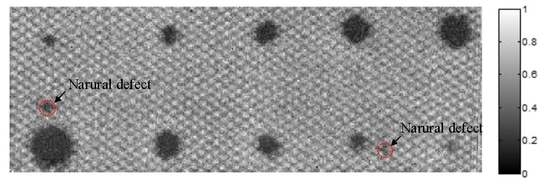
According to the above simulation results and signal processing experimental results, ACUT technique can reasonably evaluate debonding defects of honeycomb sandwich composite. In order to verify the actual detection results, C-scan of honeycomb sandwich composite was carried out. The scanning speed is 15 mm/s, the excitation voltage is 400 V, the gain compensation is 105.9 dB, the operating frequency of air-coupled transducer is 400 kHz, the scanning area is 60 mm × 173 mm, and the scanning step is 0.5 mm. The C-scan result of honeycomb sandwich composite is shown in Figure 12. It can be seen that the result is consistent with the layout of debonding defects shown in Figure 5, and the natural debonding defects in the honeycomb sandwich composite sample are also detected, which further illustrates the correctness of theoretical simulation and actual detection.

5. Conclusions

In the paper, according to three-dimensional structure characteristic of honeycomb sandwich composite, a two-dimensional finite model of honeycomb sandwich composite is constructed. The sound pressure in the fluid domain and the stress-strain problem in solid domain are related by acoustic-structure coupling method, which visually show the propagation process and modal characteristics of the acoustic wave inside the honeycomb sandwich composite.
Based on the two-dimensional finite element of honeycomb sandwich composite, the time domain signal response of debonding defect in the material is analyzed. The simulation result of the two-dimensional finite element model can correctly invert the propagation process of acoustic wave in the honeycomb sandwich composite, the SNR of received signal is good, and the transmitted longitudinal wave T1 can be clearly identified. By comparing and analyzing the sound field distribution of the finite model with or without debonding defect at the same time, it can be clearly found that the debonding defect can be effectively characterized by the transmission longitudinal wave T1 (transmission initial wave), that is, when there is a debonding defect in the finite element model, the transmission longitudinal wave T1 attenuates seriously, and the decrease of sound pressure energy is very obvious. However, in actual ACUT detection, due to the influence of various noises, the noise level of received signal is high, the SNR is poor, and the transmission initial wave cannot be recognized. Therefore, the P3 polyphase coded pulse compression technique (the P3 polyphase coded signal with optimum parameters is 33-bits P3 polyphase coded signal with 3-cycles per sub-pulse) is applied to ACUT system to solve such problems. The actual processing results showed that the received signal is effectively improved (the SNR is good and the transmission initial wave can be effectively identified), and the transmission initial wave has significant energy difference between the defect area and the intact area. Therefore, it is reasonable to evaluate the quality of honeycomb sandwich composite based on P3 polyphase coded signal.
The ACUT C-scan of honeycomb sandwich composite was carried out. The imaging result was consistent with the actual characteristics of the internal defect of honeycomb sandwich composite, and the natural debonding defects in the honeycomb sandwich composite were also detected. This shows the ACUT technique is very effective for detecting debonding defects of honeycomb sandwich composite. This promotes the development of ACUT technique in the field of composite material quality evaluation and expands the application range of ACUT technique in the aerospace field.

Author Contributions

Conceptualization, H.L.; methodology, H.L.; software, H.L.; validation, H.L.; formal analysis, H.L.; investigation, H.L.; resources, H.L.; data curation, H.L.; writing—original draft preparation, H.L.; writing—review and editing, H.L.; visualization, H.L.; supervision, Z.Z.

Conflicts of Interest

The authors declare no conflict of interest.

References

  1. Paik, J.K.; Thayamballi, A.K.; Kim, G.S. The strength characteristics of aluminum honeycomb sandwich panels. Thin-Walled Struct. 1999, 35, 205–231. [Google Scholar] [CrossRef]
  2. Foo, C.C.; Seah, L.K.; Chai, G.B. Low-velocity impact failure of aluminium honeycomb sandwich panels. Compos. Struct. 2008, 85, 20–28. [Google Scholar] [CrossRef]
  3. Cosenza, C.; Kenderian, S.; Djordjevic, B.B.; Green, R.E.; Pasta, A. Generation of narrowband antisymmetric Lamb waves using a formed laser source in the ablative regime. IEEE Trans. Ultrason. Ferroelectr. Freq. Control 2007, 54, 147–156. [Google Scholar] [CrossRef] [PubMed]
  4. Hay, T.R.; Wei, L.; Rose, J.L.; Hayashi, T. Rapid inspection of composite skin-honeycomb core structures with ultrasonic guided waves. J. Compos. Mater. 2003, 37, 929–939. [Google Scholar] [CrossRef]
  5. Blouin, A.; Campagne, B.; Néron, C.; Monchalin, J.P. Detection of skin disbond in honeycombs and coating detachment by a laser acoustic technique. In AIP Conference Proceedings; AIP: Melville, NY, USA, 2007; Volume 894, pp. 1140–1147. [Google Scholar]
  6. Ma, B.; Zhou, Z.; Zhao, H.; Zhang, D.; Liu, W. Characterisation of inclusions and disbonds in honeycomb composites using non-contact non-destructive testing techniques. Insight-Non-Destr. Test. Cond. Monit. 2015, 57, 499–507. [Google Scholar] [CrossRef]
  7. Taylor, J.O.; Dupont, H.M. Thermographic inspection of metallic honeycomb sandwich structures. In Review of Progress in Quantitative Nondestructive Evaluation; Springer: Boston, MA, USA, 1999; pp. 1373–1380. [Google Scholar]
  8. Hagemaier, D.J. NDT of aluminium-brazed titanium honeycomb structure. Non-Destr. Test. 1976, 9, 107–116. [Google Scholar] [CrossRef]
  9. Zhao, H.; Zhou, Z.; Fan, J.; Li, G.; Sun, G. Application of lock-in thermography for the inspection of disbonds in titanium alloy honeycomb sandwich structure. Infrared Phys. Technol. 2017, 81, 69–78. [Google Scholar] [CrossRef]
  10. Döring, J.; Bovtun, V.; Gaal, M.; Bartusch, J.; Erhard, A.; Kreutzbruck, M.; Yakymenko, Y. Piezoelectric and electrostrictive effects in ferroelectret ultrasonic transducers. J. Appl. Phys. 2012, 112, 084505. [Google Scholar] [CrossRef]
  11. Li, H.; Zhou, Z. Air-coupled ultrasonic signal processing method for detection of lamination defects in molded composites. J. Nondestruct. Eval. 2017, 36, 45. [Google Scholar] [CrossRef]
  12. Pallav, P.; Gan, T.H.; Hutchins, D.A. Elliptical-Tukey chirp signal for high-resolution, air-coupled ultrasonic imaging. IEEE Trans. Ultrason. Ferroelectr. Freq. Control 2007, 54, 1530–1540. [Google Scholar] [CrossRef]
  13. Hutchins, D.; Burrascano, P.; Davis, L.; Laureti, S.; Ricci, M. Coded waveforms for optimised air-coupled ultrasonic nondestructive evaluation. Ultrasonics 2014, 54, 1745–1759. [Google Scholar] [CrossRef] [PubMed]
  14. Waag, G.; Hoff, L.; Norli, P. Air-coupled ultrasonic through-transmission thickness measurements of steel plates. Ultrasonics 2015, 56, 332–339. [Google Scholar] [CrossRef] [PubMed] [Green Version]
  15. Chimenti, D.E. Review of air-coupled ultrasonic materials characterization. Ultrasonics 2014, 54, 1804–1816. [Google Scholar] [CrossRef] [PubMed]
  16. Bass, H.E.; Sutherland, L.C.; Zuckerwar, A.J.; Blackstock, D.T.; Hester, D.M. Atmospheric absorption of sound: Further developments. Acoust. Soc. Am. J. 1995, 97, 680–683. [Google Scholar] [CrossRef]
  17. Achim, A.; Bezerianos, A.; Tsakalides, P. Novel Bayesian multiscale method for speckle removal in medical ultrasound images. IEEE Trans. Med. Imaging 2001, 20, 772–783. [Google Scholar] [CrossRef] [PubMed] [Green Version]
  18. Abd-Elmoniem, K.Z.; Youssef, A.B.; Kadah, Y.M. Real-time speckle reduction and coherence enhancement in ultrasound imaging via nonlinear anisotropic diffusion. IEEE Trans. Biomed. Eng. 2002, 49, 997–1014. [Google Scholar] [CrossRef] [PubMed]
  19. Gan, T.H.; Hutchins, D.A.; Billson, D.R.; Schindel, D.W. The use of broadband acoustic transducers and pulse-compression techniques for air-coupled ultrasonic imaging. Ultrasonics 2001, 39, 181–194. [Google Scholar] [CrossRef]
  20. Fowle, E.N.; Carey, D.R.; Vander Schuur, R.E.; Yost, R.C. A pulse compression system employing a linear FM Gaussian signal. Proc. IEEE 1963, 51, 304–312. [Google Scholar] [CrossRef]
  21. Kretschmer, F.F.; Welch, L.R. Sidelobe reduction techniques for polyphase pulse compression codes. In Proceedings of the Record of the IEEE 2000 International Radar Conference, Alexandria, VA, USA, 12–12 May 2000; pp. 416–421. [Google Scholar]
  22. Zhao, Y.; Shen, Z.; Lu, J.; Ni, X. Simulation of leaky Rayleigh wave at air–solid cylindrical interfaces by finite element method. Ultrasonics 2006, 44, e1169–e1172. [Google Scholar] [CrossRef]
  23. Kažys, R.; Demčenko, A.; Žukauskas, E.; Mažeika, L. Air-coupled ultrasonic investigation of multi-layered composite materials. Ultrasonics 2006, 44, e819–e822. [Google Scholar] [CrossRef]
  24. Xu, X.F.; Qiao, P. Homogenized elastic properties of honeycomb sandwich with skin effect. Int. J. Solids Struct. 2002, 39, 2153–2188. [Google Scholar]
  25. Sohn, Y.; Krishnaswamy, S. Mass spring lattice modeling of the scanning laser source technique. Ultrasonics 2002, 39, 543–551. [Google Scholar] [CrossRef]
  26. Lei, X.; Heng, Z.; Shangkai, G. Barker code in TCD ultrasound systems to improve the sensitivity of emboli detection. Ultrasound Med. Biol. 2009, 35, 94–101. [Google Scholar] [CrossRef] [PubMed]
  27. Garcia-Rodriguez, M.; Yañez, Y.; Garcia-Hernandez, M.; Salazar, J.; Turo, A.; Chavez, J.A. Lamb wave generation with an air-coupled piezoelectric array using square chirp excitation. In Proceedings of the 19th International Congress on Acoustics, Madrid, Spain, 2–7 September 2007. [Google Scholar]
  28. Garcia-Rodriguez, M.; Yañez, Y.; Garcia-Hernandez, M.J.; Salazar, J.; Turo, A.; Chavez, J.A. Application of Golay codes to improve the dynamic range in ultrasonic Lamb waves air-coupled systems. NDT E Int. 2010, 43, 677–686. [Google Scholar] [CrossRef]
  29. Li, H.; Zhou, Z. Application of P4 Polyphase codes pulse compression method to air-coupled ultrasonic testing systems. Ultrasonics 2017, 78, 57–69. [Google Scholar] [CrossRef] [PubMed]
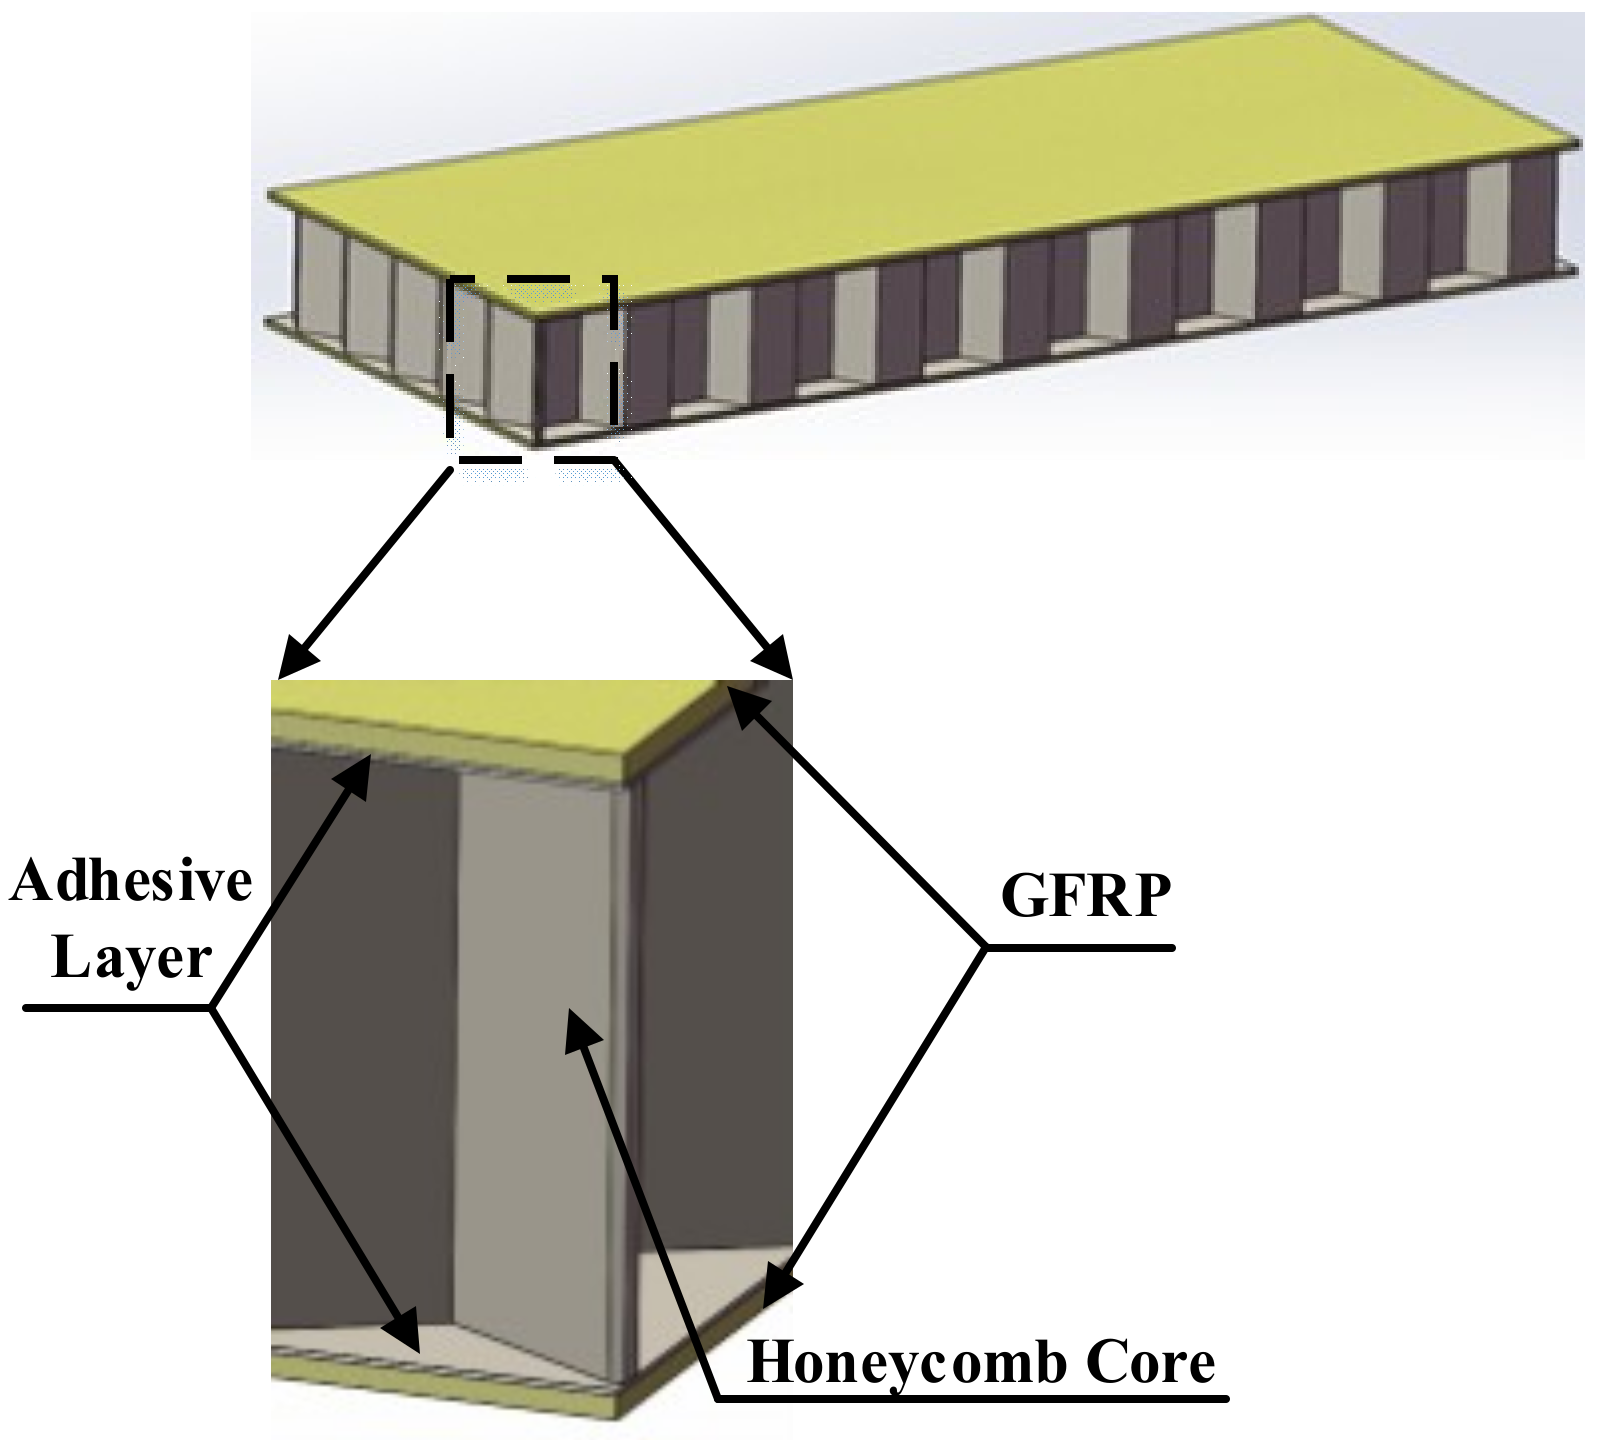
Figure 1. The diagram of honeycomb sandwich composite.
Applsci 09 00283 g001
Figure 2. The honeycomb sandwich composite model simplification process. (b) is the partial enlargement of the honeycomb composite material of (a); (c) is a cross section of the honeycomb core of (b).
Applsci 09 00283 g002
Figure 3. The two-dimensional model of honeycomb sandwich composite.
Applsci 09 00283 g003
Figure 4. The two dimensional model of honeycomb sandwich composite embedded with debonding defect.
Applsci 09 00283 g004
Figure 5. Honeycomb sandwich composite sample and defects layout.
Applsci 09 00283 g005
Figure 6. Schematic diagram of experimental setup; DAQ: Data Acquisition; PC: Personal Computer.
Applsci 09 00283 g006
Figure 7. The simulation result of sound field distribution with 19.32μs in honeycomb sandwich composite.
Applsci 09 00283 g007
Figure 8. The sound field distribution of a intact honeycomb sandwich composite model and a honeycomb sandwich composite model with embedded debonding defect at 20.01 μs; (a) The sound field distribution of an intact honeycomb sandwich composite model at 20.01 μs; (b) The sound field distribution of a honeycomb sandwich composite model with an embedded debonding defect at 20.01 μs. R: reflected longitudinal wave; El: edge longitudinal wave; T1: transmitted longitudinal wave; T2: transmitted longitudinal wave; LL: leakage Lamb wave; L: Lamb wave.
Applsci 09 00283 g008
Figure 9. A-wave signal obtained from the computational simulation of the intact model and the embedded defect model. (a) corresponds to the intact model, and (b) corresponds to the embedded defect model.
Applsci 09 00283 g009
Figure 10. The original signal for detecting honeycomb sandwich composite material.
Applsci 09 00283 g010
Figure 11. The P3 polyphase coded pulse compression signals are collected separately from the defect area and the intact area. (a) is the compressed signal collected in the intact area, and (b) is the compressed signal collected in the defect area.
Applsci 09 00283 g011
Figure 12. The C-scan result of honeycomb sandwich composite.
Applsci 09 00283 g012
Table 1. The actual size information of each component of honeycomb sandwich composite; GFRP: glass fiber reinforce polymers.
MediumLongitudinal Sound Velocity m/sShear Wave Velocity m/sMesh Size/μm
Air340-100
Aluminum honeycomb core62603080100
Epoxy resin adhesive layer2800110050
GFRP2743138050
Table 2. The material properties of GFRP; Ei: Elastic Modulus (i = 1,2,3); Gij: Shear Modulus (i = 1,2,3; j = 1,2,3); Vij: Poisson’s Ratio (i = 1,2,3; j = 1,2,3).
E1/MPa
E3/MPa
E2/MPaG21/MPa
G23/MPa
G13/MPaV12V21
V23
V13
V31
232707750275845800.410.130.15
Table 3. The material properties of solid domain.
Solid MediumElastic Modulus/GPaPoisson’s RatioDensity/(Kg·m−3)
Aluminum6.80.322700
Epoxy resin adhesive10.381180