Article

Radio Planning Considerations in TETRA to LTE Migration for PPDR Systems: A Radioelectric Coverage Case Study

by
Diego del Rey Carrión
1,
Leandro Juan-Llácer
2,* and
José-Víctor Rodríguez
2
1
Dirección General de Seguridad Ciudadana y Emergencias, Consejería de Presidencia y Fomento—Región de Murcia, 30100 Murcia, Spain
2
Universidad Politécnica de Cartagena, 30202 Cartagena, Spain
*
Author to whom correspondence should be addressed.
Appl. Sci. 2019, 9(2), 250; https://doi.org/10.3390/app9020250
Submission received: 28 November 2018 / Accepted: 25 December 2018 / Published: 11 January 2019

Abstract

:
Transitioning a Terrestrial Trunked Radio (TETRA) network to a Long-Term Evolution (LTE) network in public protection and disaster relief (PPDR) systems is a path to providing future services requiring high radio interface throughput and allowing broadband PPDR (BB-PPDR) radio communications. Users of TETRA networks are currently considering how to deploy a BB-PPDR network in the coming years. This study offers several radio planning considerations in TETRA to LTE migration for such networks. The conclusions are obtained from a case study in which both measurements and radioelectric coverage simulations were carried out for the real scenario of the Murcia Region, Spain, for both TETRA and LTE systems. The proposed considerations can help PPDR agencies efficiently estimate the cost of converting a TETRA network to an LTE network. Uniquely in this study, the total area is divided into geographical areas of interest that are defined as administrative divisions (region, municipal areas, etc.). The analysis was carried out using a radio planning tool based on a geographic information system and the measurements have been used to tune the propagation models. According to the real scenario considered, the number of sites needed in the LTE network—for a specific quality of service (90% for the whole region and 85% for municipal areas)—is a factor of 2.4 higher than for TETRA network.

1. Introduction

The conversion of a Terrestrial Trunked Radio (TETRA) network to a Long Term Evolution (LTE) network in public protection and disaster relief (PPDR) systems is a possible solution to provide future services requiring high radio interface throughput and allowing broadband PPDR (BB-PPDR) radio communications [1]. In Report 218, The Electronic Communication Committee (ECC) proposed a roadmap until 2025 for the transition to broadband communication in PPDR systems [2]. This roadmap envisages coexisting TETRA and LTE networks for several years until the LTE system has all the functionalities of the PPDR systems. Therefore, the introduction of LTE for PPDR should complement, not replace, existing TETRA networks, which will continue to be the best choice for short-term mission-critical voice service.
In addition, PPDR users cannot leave their current TETRA systems until a new mobile broadband network is built that is able to provide radioelectric coverage equal to or better than the radioelectric coverage currently provided by TETRA systems. Therefore, before any broadband solution can replace the current TETRA systems, the LTE network should meet all radioelectric coverage requirements currently satisfied by the existing network.
The most plausible future scenarios to deliver the increasingly data-intensive applications demanded by PPDR agencies are expected to rely on the use of both dedicated and commercial LTE networks [3]. For rural areas, the base stations of a radio communication system are located in the mountains, and the radioelectric coverage has ‘dark zones’ (without radioelectric coverage), usually in forests, mountains, rivers, etc. In these zones, operators are not interested in deploying new base stations to offer broadband communications. However, in urban environments, operators have already deployed commercial broadband networks, that could be used by PPDR agencies for broadband communications. Therefore, the possibility of a hybrid model (dedicated network for rural areas and commercial networks for urban areas) could be an interesting solution for BB-PPDR radio communications.
More than 114 countries around the world have deployed TETRA networks (at the regional or national level) in the past years according to The Critical Communications Association (TCCA) [4]. Now, the users of these networks are considering how to proceed to achieve a BB-PPDR network in the coming years. Therefore, PPDR agencies are interested in analyses of the many issues (cost analysis of the resources needed, the expected radioelectric coverage, quality of service, etc.) involved in planning the transition of a TETRA network to an LTE network.
A framework for the modeling and planning of an LTE public safety broadband network has been presented by Rouil et al. [5]. The study was carried out on a nationwide scale, dividing the total area into 20 × 20 km squares and establishing a minimum percentage of radioelectric coverage in each square.
In this study, several radio planning considerations in the TETRA to LTE migration for PPDR networks are offered. In this case, different from Rouil et al.’s work [5], the total area is divided into geographical areas of interest that are defined as administrative divisions (region, municipal areas, natural parks, etc.). To illustrate this proposal, a radioelectric coverage analysis in a rural area with an existing TETRA network that has to transition to an LTE system has been carried out in a real scenario by means of both simulations and measurements. The analysis was performed by taking advantage of the potential of a radio planning tool [6] based on a geographic information system (GIS) [7], and the measurements were performed and used to tune propagation models. The proposed methodology can help PPDR agencies efficiently estimate the cost of transitioning a TETRA network to an LTE network.

2. Radio Planning Aspects
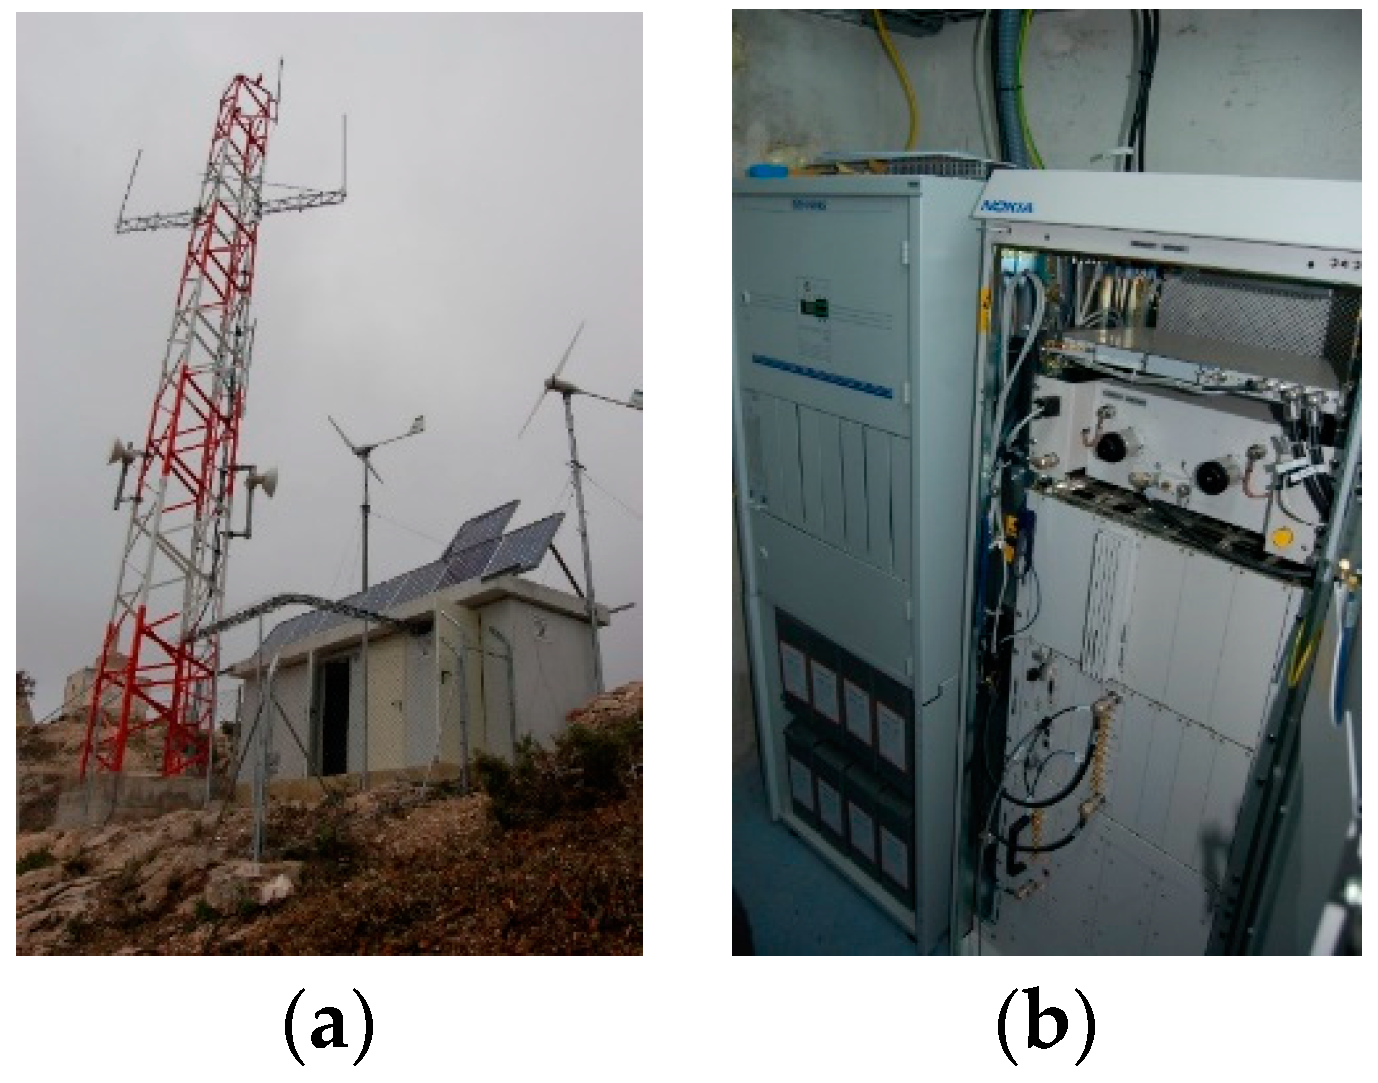
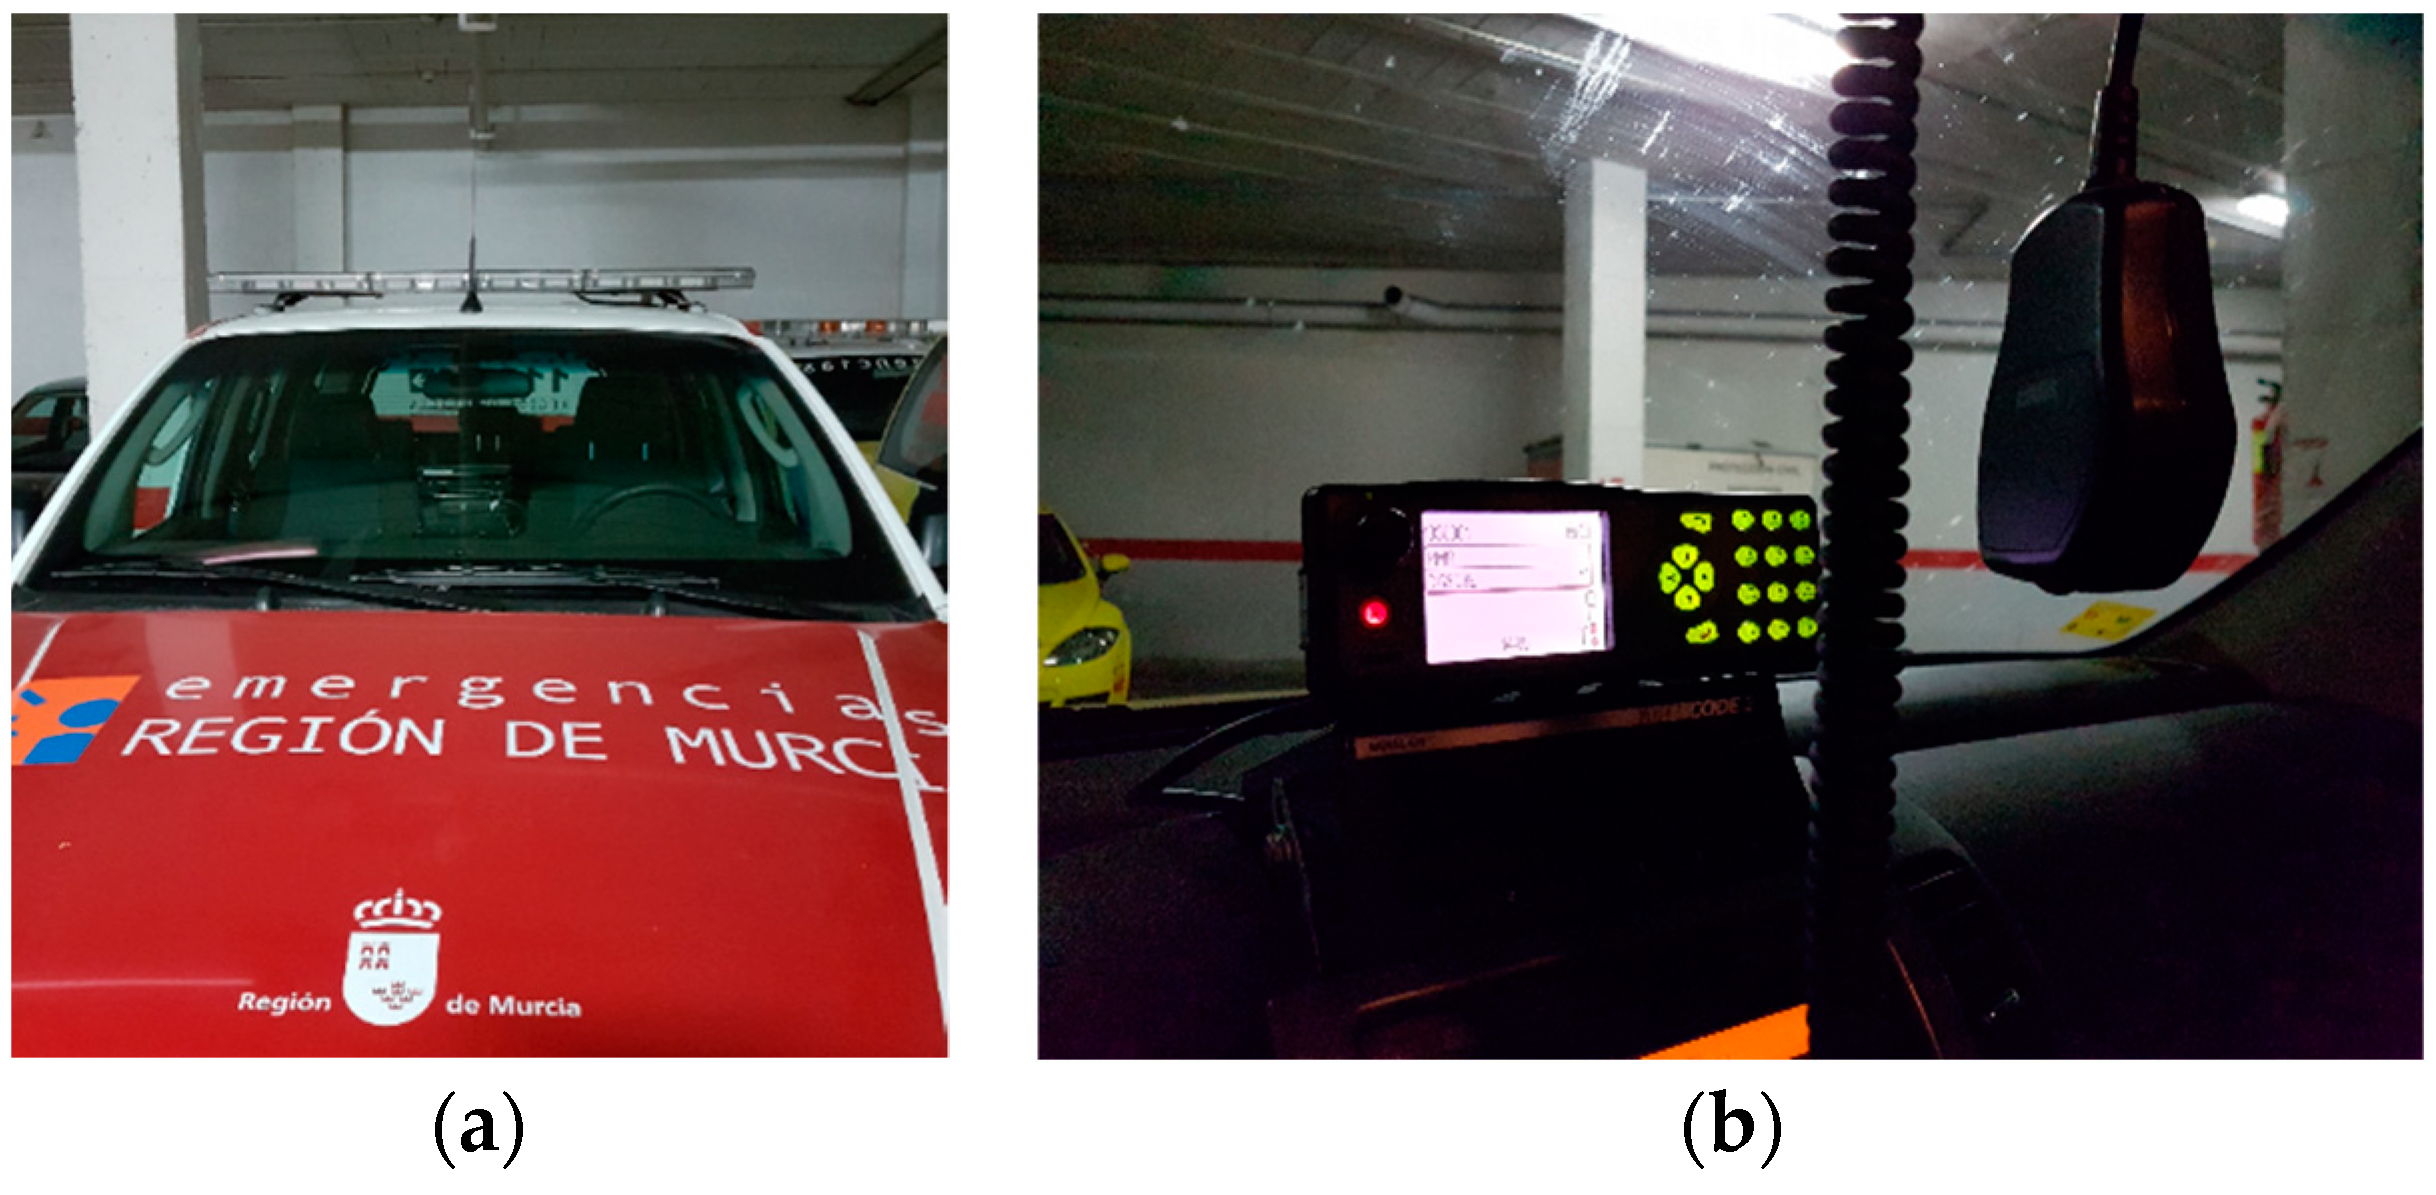
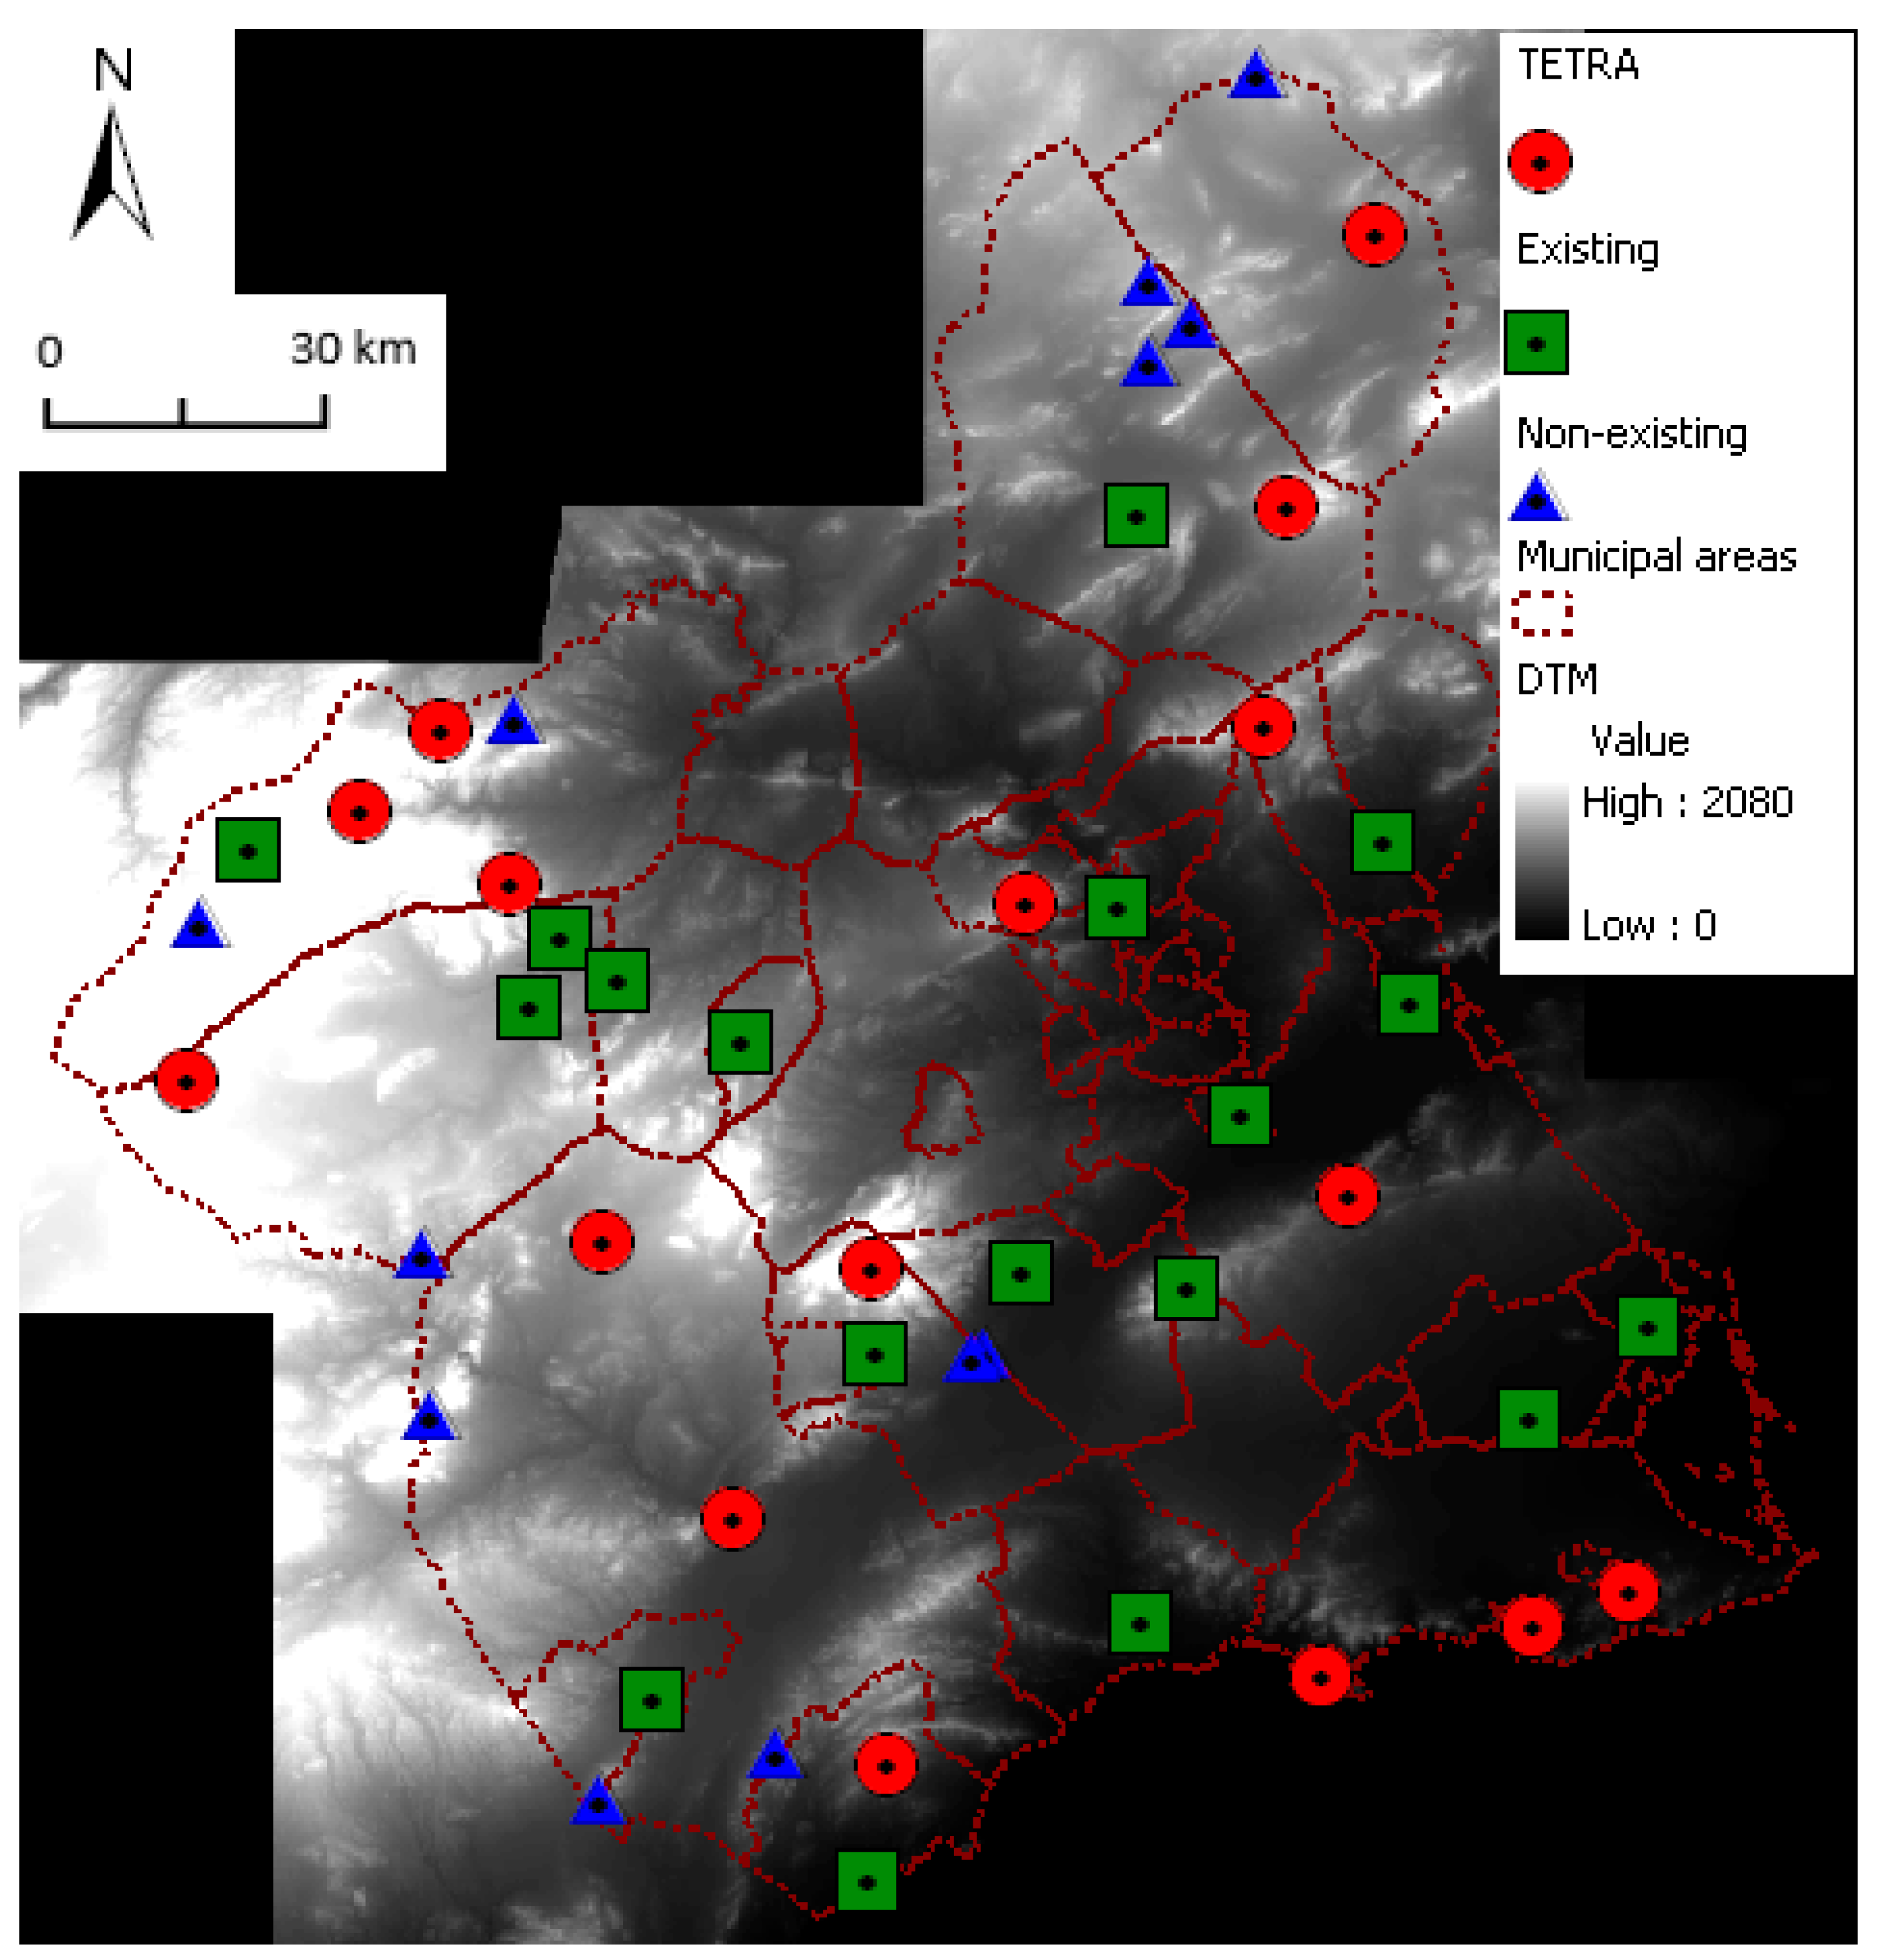
2.1. Scenario

RADIECARM is the TETRA network deployed by the Regional Government of Murcia (Spain) that is used by the emergency and safety services (fire brigade, police, forest police, etc.). All these services are coordinated by the Emergency Coordination Center 112. RADIECARM is a dedicated network with 16 base stations located in mountains and around 2000 terminals. In Figure 1, we can see the typical infrastructure (tower, equipment, etc.) at a site and, in Figure 2, a mobile terminal mounted in a four-wheel drive vehicle. Figure 3 shows the 16 TETRA base stations (red circles).

2.2. Radio Planning Tool

To carry out the radioelectric coverage analysis, the application RADIOGIS [6], which is a tool developed by the authors for the management and calculation of the radioelectric coverage of radio communication systems such as GSM, UMTS, LTE, TETRA, TDT, WiFi, etc., was used. RADIOGIS works on Windows PCs and is integrated with the GIS software ArcGIS 9.1 from ESRI. RADIOGIS has, among others, the following functionalities:
a)
Calculations of power, electric field, or power density radioelectric coverage while being able to select the propagation model to be applied: ITUR-526 [8] and ITUR-1546 [9] for rural environments; Okumura-Hata [10], COST-231 [11] and Walfisch-Bertoni [12] for urban areas.
b)
Percentage threshold calculations using a vector layer containing municipal areas, roads, etc.
c)
Management of databases of sites, power density radioelectric coverage, power systems, measurement campaigns, etc.

2.3. Frequency Bands

For the existing TETRA network, the frequency band for RADIECARM is 380–385 MHz (uplink, UL) and 390–395 (downlink, DL), which is the band reserved for PPDR systems in Europe [13].
For the new LTE network, several possibilities are available for the frequency band. ECC Report 218 [2] develops the necessary conditions to create a harmonized European framework for the implementation of future BB-PPDR systems. This report proposes the concept of ‘flexible harmonization’ to enable an efficient implementation of BB-PPDR systems. The frequency bands identified as candidates for harmonization are:
  • 400 MHz (410–430 MHz and 450–470 MHz)
  • 700 MHz (694–790 MHz)
In our analysis, the frequency bands 699–716 MHz (UL) and 729–746 MHz (DL) were used. These frequency bands meet spectrum regulations for public safety users and broadband services laid out in Spain’s National Table of Frequency Allocations. Moreover, they are E-UTRA operating bands according to the ETSI [14,15].

2.4. Digital Information

The Murcia Region (South-West of Spain) is 11,296 km2. The territory is organized into 45 municipalities, and each municipality delimits an area (municipal area) (see Figure 3). The geographical information has been obtained from the National Geographical Institute of Spain. A digital terrain model (DTM)—in a raster format [7]—with a 100 × 100 m cell size (see Figure 3)—was used for the radioelectric coverage calculations in rural environments, which represents a compromise between accuracy and computation time. We can also observe the municipal areas as a vector layer with an associated attribute table that contains information (name, extension, population, etc.) in Figure 3 [7].

2.5. Quality of Service (QoS)

The signal received in mobile communication presents wide random variations that can be modeled by introducing a statistical correction. This statistical correction defines a fade margin (FM). If the FM is equal to zero, radioelectric coverage is only guaranteed in 50% of the locations in the cell (defined in the DTM). The micro scalar quality is defined by the percentage of locations in the cell in which radioelectric coverage is guaranteed. This quality sets the fade margin that is considered in the link budget.
Assuming a log-normal distribution, the FM can be estimated by:
FM (dB) = K(L)·σL
where σL (dB) is the variability of locations in the cell and K(L) is the normalized distribution abscissas for the percentage of locations (L). The K parameter is related with the inverse function of Gauss G−1(L) by the expression:
K(L) = G−1 (1 − L/100)
For calculations, a typical value for the UHF band in rural environments is a shadowing standard deviation with locations at 6 dB. If we fix a micro scalar quality of 90%, the fade margin is:
FM (dB) = 1.28 6 = 7.7 dB
The macro scalar quality is the percentage of cells with radioelectric coverage within an area. This area could be delimited by a polygon, that represents a municipal or a regional area in our case. In our calculations, we assumed a macro scalar quality of 90% for the regional term and 85% for the municipal term.

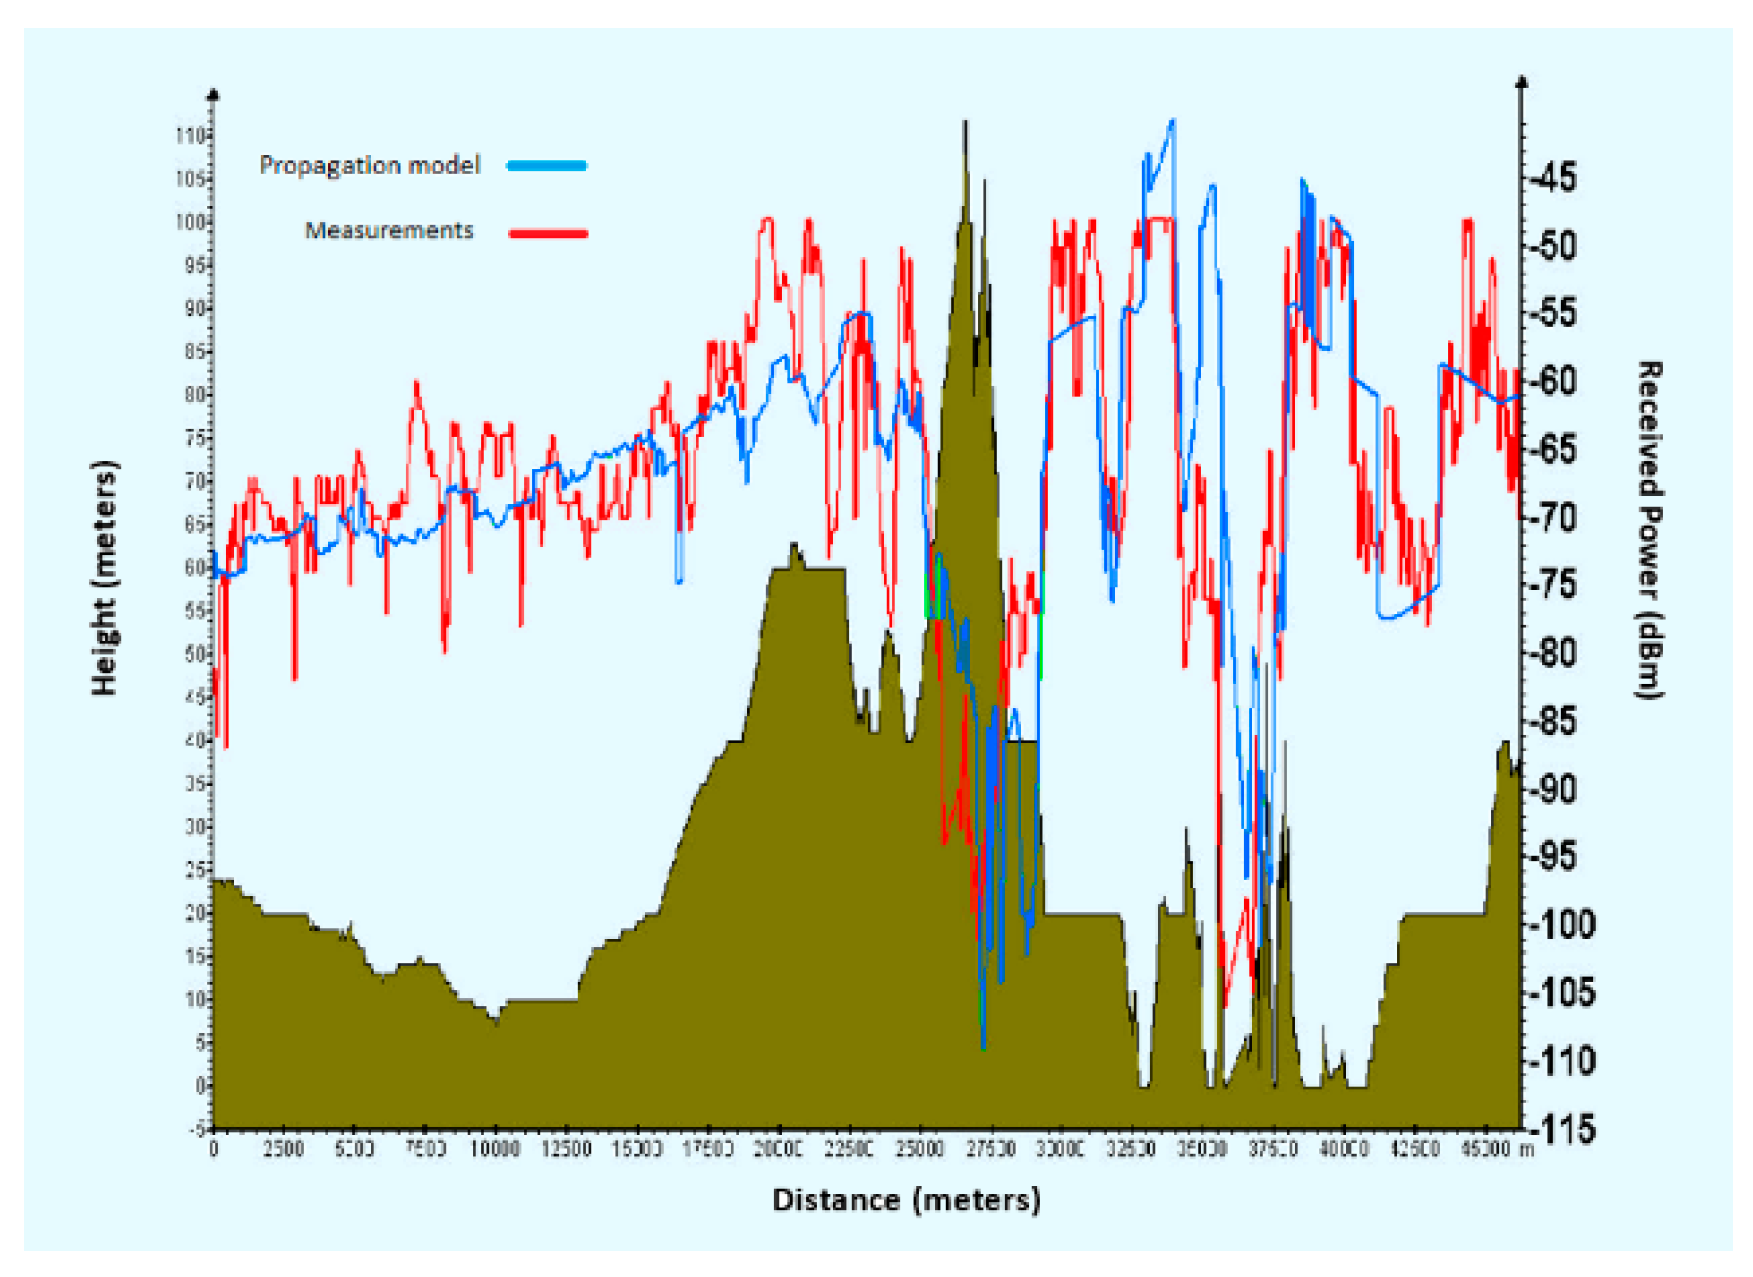
2.6. Propagation Model

Many propagation models, such as the Longley–Rice [16], Bullington [17], Vogler [18], Luebbers [19], and Deygout [20] models, have been used for UHF band radio planning in rural environments in addition to the recommendations of the Radiocommunication Sector of the International Telecommunication Union (ITU-R) [8,9]. All these models estimate the mean value of the received signal in each cell of the DTM, taking into account the terrain profile between the transmitter and the receiver.
In the radio planning tool used, propagation loss is evaluated for each terrain profile by:
L (dB) = L0 + LTerrain irregularities + LClose environment
where LO is the free space loss, that can be calculated by:
L0 (dB) = 33.44 + 20 log f (MHz) + 20 log d (km)
LTerrain irregularities is the diffraction loss caused by obstruction of the terrain. For rural environments, this propagation loss can be estimated using the recommendation ITU-R P.526 [8]. LClose environment is the propagation loss taking into account the multipath phenomenon. This loss is directly related with the morphography in the vicinity of the mobile. In the GIS, a raster was created, with a resolution of 100 × 100 m, in which each cell has a value (in dB) representing the loss due to the type of environment (rural pine forests, suburban environment and urban environment). The Hata model [10] was used to estimate the value for suburban and urban environments. A measurement campaign, for the TETRA system (400 MHz), consisting of five routes, was carried out by the authors within a prototype—which included three base stations—to estimate the path loss for the rural (pine forest) environment. In Table 1, the obtained values for the TETRA system are shown. Moreover, in this table, the values for the LTE system (700 MHz), in which the losses for the rural environment were estimated by considering ITU-R P.833 [21], are also presented. These values were applied to the simulations performed in this study. Figure 4 shows a comparison between the propagation model and the measurements in one of the routes. Table 2 gives the mean error and standard deviation of the difference between the propagation model and the measurements for each route.

2.7. Link Budget

Table 3 gives the link budget for the TETRA and LTE systems and for the downlink (DL) and the uplink (UL). The link budget was calculated for a mobile receiver, in which the antennas are mounted on a vehicle, with a gain of 2 dBi for the TETRA system and 3.5 dBi for the LTE system. Also, in the base station, the antennas have an omnidirectional pattern with a gain of 7 dBi for the TETRA system and a directional pattern with a gain of 15 dBi for the LTE system.
Radioelectric coverage was calculated for a rural environment, so a noise-limited scenario was assumed.
For the LTE system, the sensitivity is calculated by:
S (dBm) = –174 + F + 10 log (Nrb × RB) + SNIR
where F is the noise figure (7 dB for the DL and 2 dB for the UL), Nrb is the number of resource blocks (25 for a bandwidth of 5 MHz for the radio channel), RB is the bandwidth of each resource block (180 kHz), and SNIR is the average signal-to-interference-and-noise ratio (5 dB)
In the proposed UL for LTE, a real throughput of 4.5 Mbps can be achieved with a sensitivity of −100 dBm using a 16 QAM modulation, allowing the transmission of full HD (1920 × 1080) video streaming. The maximum path loss (Lmax) is in agreement with Dunlop et al. [22] for the TETRA system and with Elnashar et al. [23] for the LTE system. As seen in Table 3, for both systems, the worst case is the UL, and the maximum path losses that can be compensated for are 144.8 dB for the TETRA system and 136.3 dB for the LTE system. These values were used in the calculations for both systems.

2.8. Radioelectric Coverage Calculations

Using the radio planning tool, individual radioelectric coverage can be calculated for a site considering the maximum propagation loss allowed by the link budget. Then global radioelectric coverage is calculated taking into account the best server principle (the value of each cell covered by several sites is the best value). Each radioelectric coverage is stored in the GIS using a raster and a vector point layer. The raster had the same resolution as the DTM and the value of each cell was now the received power. The vector point layer also has an associated attribute table containing all the information used in the calculations: transmitter power, transmission loss, antenna gains, frequency, propagation model, etc.). This allows us to use all the facilities of GIS for managing and doing calculations with spatial data.
The percentage of radioelectric coverage can be easily calculated in GIS because the radioelectric coverage has been stored as a raster. The functionality of GIS [7] that allows operation between a raster and vector layer can be used to evaluate the macro scalar quality of service (defined in Section 2.5, using a raster of the global radioelectric coverage and the vector polygon layer of the municipal areas. The map of the macro scalar quality was also stored as a raster and can be represented and managed in the GIS environment.

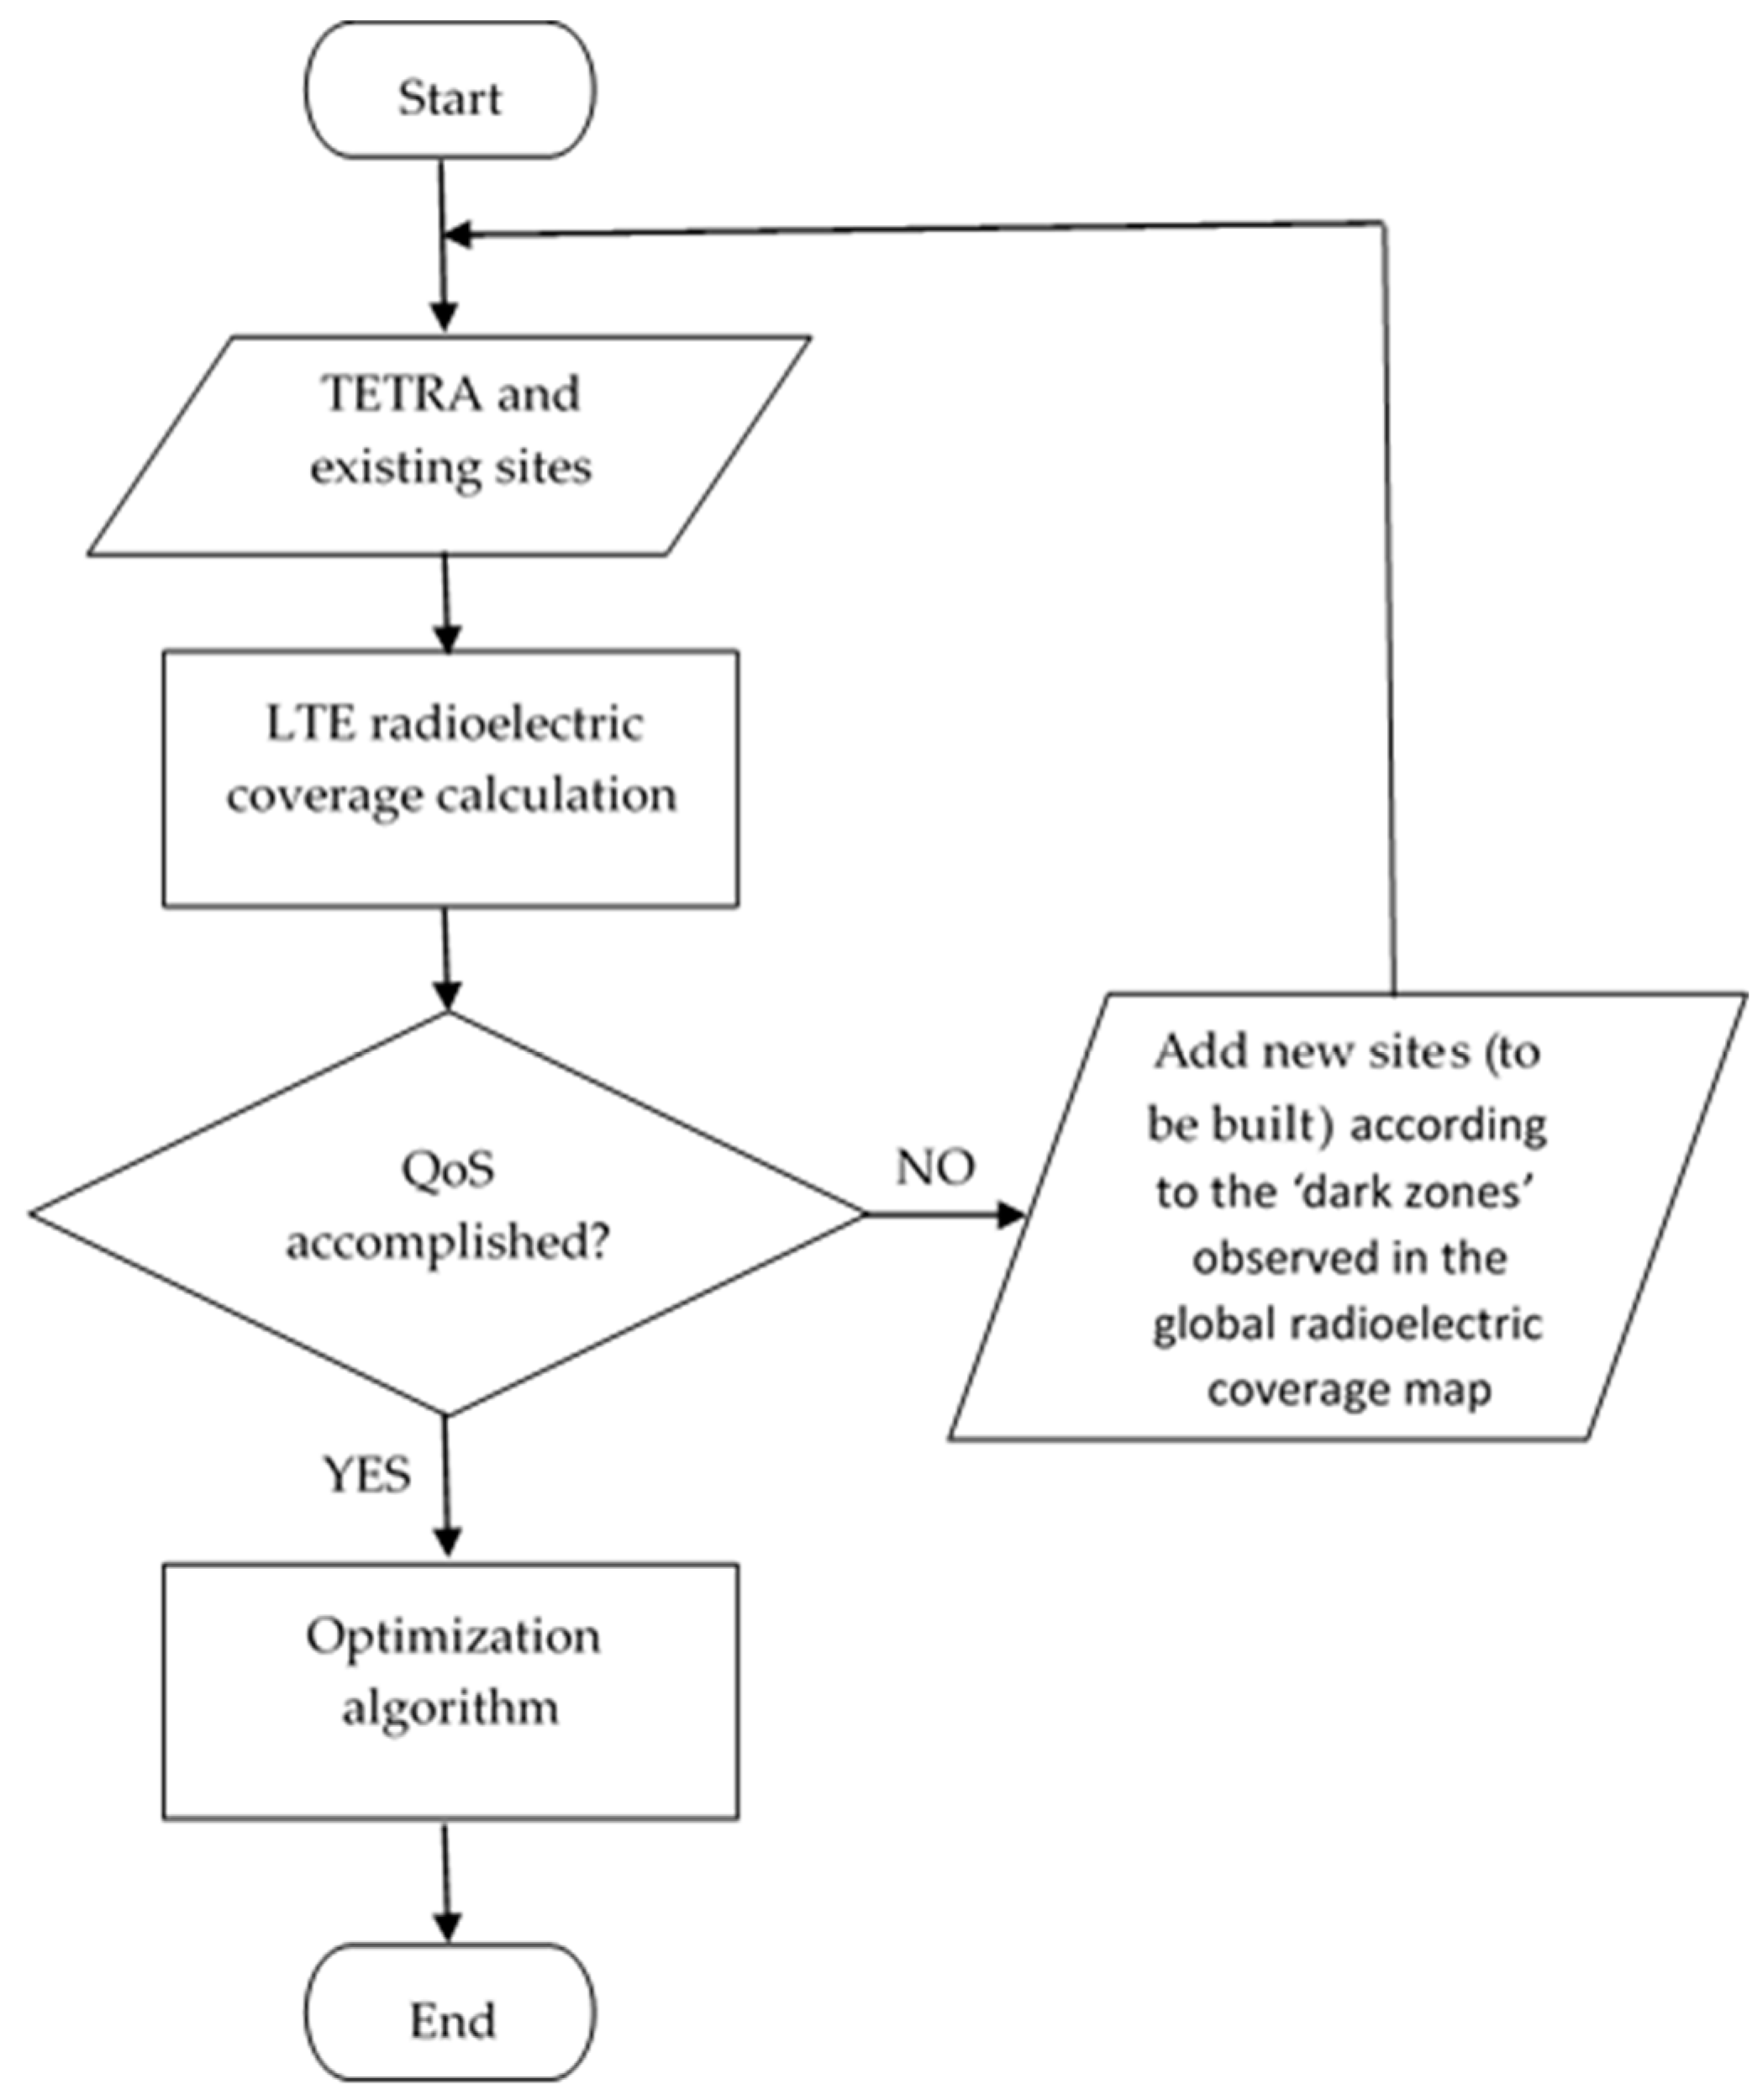
2.9. Methodology for Planning the New LTE Network

The proposed flow-chart to plan the new LTE network can be observed in Figure 5.
First of all, the LTE radioelectric coverage for each municipal area is calculated using the existing TETRA sites and the existing sites with other radiocommunication systems (not TETRA). In our case, this leads to 34 sites in total (16 TETRA base stations and the 18 existing sites) (Figure 3).
-
If the QoS (see Section 2.5) is fulfilled, the following optimization algorithm can be applied: Initially, individual radioelectric coverages were calculated for the available sites and are ordered in a table from the least to the greatest radioelectric coverage. Then, an iterative process for each site was conducted starting with the first element (the one with the least radioelectric coverage) and the same sequential order (from top to bottom). In each iteration, the following steps are carried out:
  • The element of the corresponding table is discarded.
  • The global radioelectric coverage is calculated with the sites not discarded or eliminated.
  • If the macro scalar quality is accomplished for the region and the municipal areas, the site discarded in step 1 is eliminated and, if not, the site is kept in the table.
-
If the QoS is not fulfilled, this fact means that more sites are needed. Therefore, the sites which do not exist yet but can be built with the necessary infrastructure (telecommunication tower, electrical line, stand, etc.)—the location of which is estimated according to the dark zones observed in the global radioelectric coverage map—should be progressively added until the QoS is accomplished. Then, the previously mentioned optimization algorithm can be applied.

3. Results and Discussion

3.1. The Existing TETRA Network

The radioelectric coverage is calculated using the 16 TETRA base stations (Figure 6a). Table 4 gives the percentage of radioelectric coverage for each municipal area. As can be observed, the macro scalar quality is above 90% for the region and 85% for the municipal areas.

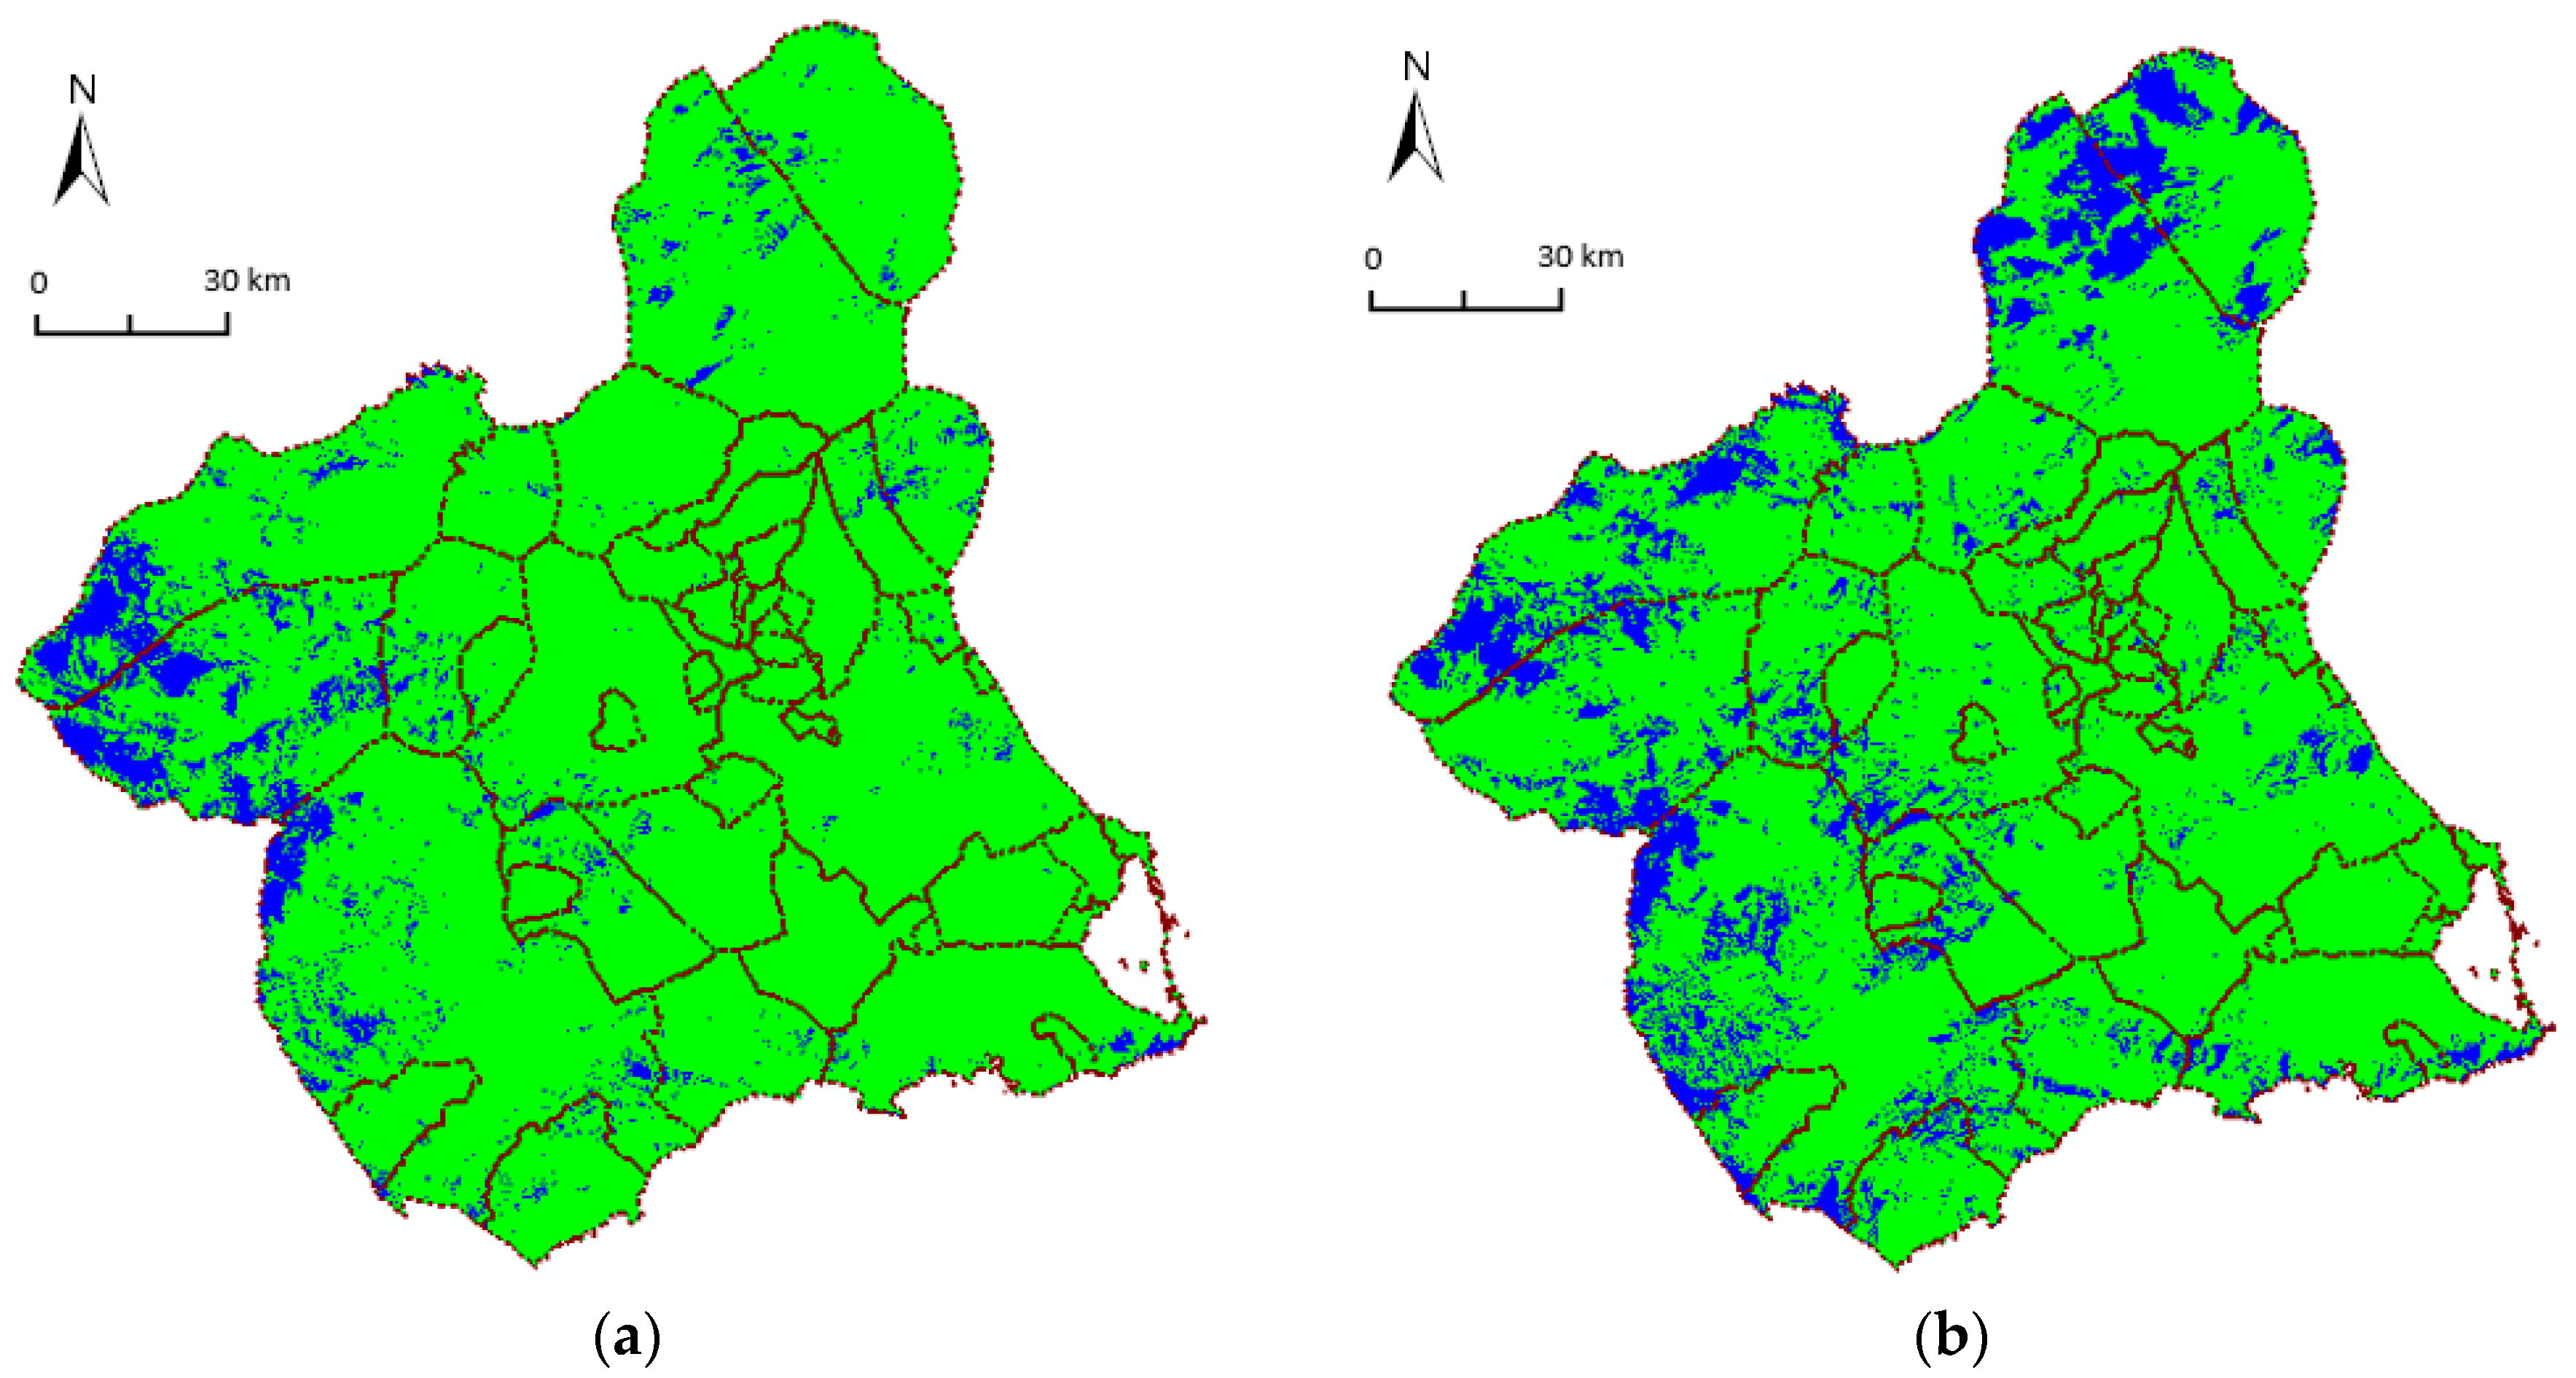
3.2. The New LTE Network

The methodology proposed in Section 2.9 was applied in our case study. First, the radioelectric coverage for the new LTE network which will take into account the mentioned 16 TETRA sites, as well as the 18 existing sites (34 in total), was calculated (see Figure 6b).
It should be noted that the number of ‘dark zones’ (blue color in Figure 6) is greater for the LTE network than for the TETRA network. Table 4 shows the percentage of radioelectric coverage for each municipal area. The macro scalar quality of 85% for the municipal area is exceeded in the majority of cases, except for six municipal areas (Caravaca, Jumilla, Lorca; Moratalla, Totana and Yecla) out of 45. Furthermore, the percentage of LTE radioelectric coverage for the region is 85% (below the actual macro scalar quality of 90% for the TETRA network).
At this point, according to the flow-chart of Figure 5, new sites must be added to improve the radioelectric coverage. With the aid of the GIS, twelve more sites, represented as blue triangles in Figure 3, were found in the detected ‘dark zones’. These new sites would have to be constructed with the necessary infrastructure (telecommunication tower, electrical line, stand, etc.). They were chosen because they are accessible by path, and it is easy for them to receive electric power. The new radioelectric coverage was calculated with the total 46 sites (Table 4). Now, the macro scalar quality of service is accomplished for the municipal areas and for the region, 85% and 90%, respectively.
The next step was to apply an optimization algorithm to see if the same quality of service could be maintained with fewer sites.
As can be observed in Table 4, 39 sites is enough to accomplish the QoS. These results indicate that the number of sites is a factor of 2.4 higher for the LTE network than for the TETRA network if we want to ensure the same macro scalar quality for both systems. Figure 7 shows the LTE radioelectric coverage with 39 sites, in which the dark zones have been reduced with respect to the case with 34 sites (see Figure 6b).
We can also analyze other situations of interest for the PPDR agencies, such as the radioelectric coverage in natural parks (represented as polygons in Figure 7). Table 5 shows the percentage of radioelectric coverage for each natural park. The percentage of LTE radioelectric coverage is less than 85% for 6 of 20 natural parks (assuming either 46 or 39 sites), although the percentage of radioelectric coverage for municipal areas is equal or above 85% (see Table 4). Therefore, we need, in this case, to add several sites to improve the radioelectric coverage in these six natural parks.

4. Conclusions

The conversion of an existing TETRA network operating in the 400 MHz band to a new LTE network operating in the 700 MHz band has been analyzed in a real scenario by means of both simulations and measurements. The latter were used to tune the propagation models employed and, in this sense, the values of the obtained path loss for the different type of environments considered (morphographic correction) are offered for both TETRA and LTE systems. Moreover, the study of special scenarios such as natural parks has also been considered in the analysis.
The results show that, according to the real scenario considered, the number of sites needed in the LTE network—for a specific quality of service (90% for the whole region and 85% for municipal areas), is a factor of 2.4 higher than for the TETRA network.

Author Contributions

Investigation, D.d.R.C., L.J.-L. and J.V.R.

Acknowledgments

This work was supported by the MINECO, Spain under Project TEC2016-78028-C3-2-P.

Conflicts of Interest

The authors declare no conflict of interest.

References

  1. Gruet, C.; Pons-Masbernat, X.; Force, P. The LTE evolution. IEEE Veh. Technol. Mag. 2013, 8, 65–70. [Google Scholar] [CrossRef]
  2. ECC Report 218. Harmonised Conditions and Spectrum Bands for the Implementation of Future European Broadband PPDR Systems. 2015. Available online: http://www.erodocdb.dk/Docs/doc98/official/pdf/ECCREP218.PDF (accessed on 27 November 2018).
  3. Ferrús, R.; Sallent, O.; Baldini, G.; Goratti, L. LTE: The technology driver for future public safety communications. IEEE Commun. Mag. 2013, 51, 154–161. [Google Scholar] [CrossRef]
  4. TCCA, The Critical Communications Association. Available online: https://tcca.info/broadband/tetra-networks-around-the-world/ (accessed on 27 November 2018).
  5. Rouil, R.; Izquierdo, A.; Souryal, M.; Gentile, C.; Griffith, D.; Golmie, N. Nationwide safety. Nationwide modeling for broadband networks services. IEEE Veh. Technol. Mag. 2013, 8, 83–91. [Google Scholar] [CrossRef]
  6. Juan-Llacer, L.; Rodriguez, J.-V.; Molina-Garcia-Pardo, J.-M.; Pascual-García, J.; Martínez-Inglés, M. RADIOGIS: Educational software for learning the calculation of radio electric radioelectric coverage in wireless communication systems. Comput. Appl. Eng. Educ. 2018, 1–16. Available online: https://doi.org/10.1002/cae.22052 (accessed on 27 November 2018). [CrossRef]
  7. Kennedy, M. Introducing Geographic Information Systems with ArcGIS: A Workbook Approach to Learning GIS; John Wiley & Sons: Hoboken, NJ, USA, 2009. [Google Scholar]
  8. Recommendation ITU-R P.526 Propagation by Diffraction. Available online: https://www.itu.int/rec/R-REC-P.526/en. (accessed on 27 November 2018).
  9. Recommendation ITU-R P. 1546 Method for Point-to-Area Predictions for Terrestrial Services in the Frequency Range 30 MHz to 3000 MHz. Available online: https://www.itu.int/rec/R-REC-P.1546/en (accessed on 27 November 2018).
  10. Hata, M. Empirical formula for propagation loss in land mobile radio services. IEEE Trans. Veh. Technol. 1980, 29, 317–325. [Google Scholar] [CrossRef]
  11. Damosso, E.; Correia, L.M.; European Commission. Cost Action 231: Digital Mobile Radio Towards Future Generation Systems: Final Report; European Communities: Brussel, Belgium, 1999. [Google Scholar]
  12. Walfisch, J.; Bertoni, H.L. A theoretical model of UHF propagation in urban environments. IEEE Trans. Antennas Propag. 1988, 36, 1788–1796. [Google Scholar] [CrossRef]
  13. ETSI TR 100 392-15, V1.4.1 (2010-03): Terrestrial Trunked Radio (TETRA); Voice plus Data (V+D); Part 15: TETRA Frequency Bands, Duplex Spacings and Channel Numbering. Available online: http://www.etsi.org/deliver/etsi_ts/100300_100399/10039215/01.04.01_60/ts_10039215v010401p.pdf (accessed on 27 November 2018).
  14. ETSI TS 136 101 V12.7.0 (2015-05): LTE; Evolved Universal Terrestrial Radio Access (E-UTRA); User Equipment (UE) Radio Transmission and Reception (3GPP TS 36.101 Version 14.3.0 Release 14). Available online: http://www.etsi.org/deliver/etsi_ts/136100_136199/136101/14.03.00_60/ts_136101v140300p.pdf (accessed on 27 November 2018).
  15. ETSI TS 136 104 V12.6.0 (2015-02): LTE; Evolved Universal Terrestrial Radio Access (E-UTRA); Base Station (BS) Radio Transmission and Reception (3GPP TS 36.104 Version 12.6.0 Release 12). Available online: http://www.etsi.org/deliver/etsi_ts/136100_136199/136104/12.06.00_60/ts_136104v120600p.pdf (accessed on 27 November 2018).
  16. Longley, A.G.; Rice, P.L. Prediction of Tropospheric Radio Transmission Over Irregular Terrain-A Computer Method-1968; ESSA Tech. Rep. ERL 79-ITS 67; U.S. Gov. Printing Office: Washington, DC, USA, 1968.
  17. Bullington, K. Radio propagation for vehicular communications. IEEE Trans. Veh. Technol. 1977, 26, 295–308. [Google Scholar] [CrossRef]
  18. Vogler, L.E. An attenuation function for multiple knife-edge diffraction. Radio Sci. 1982, 17, 1541–1546. [Google Scholar] [CrossRef]
  19. Luebbers, R.J. Propagation prediction for hilly terrain using GTD wedge diffraction. IEEE Trans. Antennas Propag. 1984, 32, 951–955. [Google Scholar] [CrossRef]
  20. Deygout, J. Correction factor for multiple-knife edge diffraction. IEEE Trans. Antennas Propag. 1991, 39, 1256–1258. [Google Scholar] [CrossRef]
  21. Recommendation ITU-R P.833 Attenuation in Vegetation. Available online: https://www.itu.int/rec/R-REC-P.833/en (accessed on 27 November 2018).
  22. Dunlop, J.; Girma, D.; Irvine, J. Digital Mobile Communications and the TETRA System; John Wiley and Sons: Chichester, UK, 1999. [Google Scholar]
  23. Elnashar, A.; El-saidny, M.A.; Sherig, M. Design, Deployment and Performance of 4GLTE Networks. A Practical Approach; John Wiley and Sons: Chichester, UK, 2014. [Google Scholar]
Figure 1. (a) Telecommunication tower with antennas and stand and (b) TETRA base station equipment.
Applsci 09 00250 g001
Figure 2. (a) Four-wheel drive vehicle with the TETRA antenna and (b) TETRA Mobile station equipment.
Applsci 09 00250 g002
Figure 3. Digital terrain model (raster), sites (vector points) and municipal areas (vector polygons).
Applsci 09 00250 g003
Figure 4. Comparison between measurements and the propagation model.
Applsci 09 00250 g004
Figure 5. The proposed flow-chart to plan the new LTE network.
Applsci 09 00250 g005
Figure 6. Radioelectric coverage for (a) the TETRA system (16 sites) and (b) the LTE system (34 sites).
Applsci 09 00250 g006
Figure 7. LTE optimized radioelectric coverage (39 sites).
Applsci 09 00250 g007
Table 1. Obtained path loss for the different types of environments considered.
Type of EnvironmentLClose environment (dB)
(400 MHz, TETRA)
LClose environment (dB)
(700 MHz, LTE)
No value00
Rural (pine forest)1014.5
Suburban13.7513.76
Urban25.6527.52
Table 2. Mean error and standard deviation of the difference between the propagation model and measurements for each route.
Route NumberMean Error (dB)Standard Deviation (dB)
I1.048.34
II8.969.20
II3.638.45
IV−0.447.58
V10.6512.19
Table 3. Link budget for the TETRA and LTE systems.
TETRALTE
ParameterUnits DLULDLUL
Power TxdBmPtx44403528
Gain TxdBiGtx72153.5
Losses TxdBLtx20.520.5
PIREdBmPtx + GtxLtx5041.54831
Fade MargindBFM (90%)7.77.77.77.7
Gain RxdBiGrx273.515
Losses RxdBLrx0.520.52
Bandwidth BW25 kHz5 MHz
SensitivitydBmS−103−106−95−100
LmaxdBPIREFM + GrxLrxS146.3144.8138.3136.3
Table 4. Percentage of radioelectric coverage in municipal areas.
Municipal Area% TETRA Radioelectric Coverage
(16 Sites)
% LTE Radioelectric Coverage
(34 Sites)
% LTE Radioelectric Coverage
(46 Sites)
% LTE Radioelectric Coverage (39 Sites)
(Optimized)
Abanilla95878787
Abarán97979796
Águilas89878787
Albudeite100949494
Alcantarilla100100100100
Aledo100969895
Alguazas100969696
Alhama94979796
Archena100959595
Beniel10010010096
Blanca99969696
Bullas96969696
Calasparra96919191
Campos del Río100989898
Caravaca93798585
Cartagena95909088
Cehegín90858585
Ceutí100939393
Cieza98929292
Fortuna99939393
Fuente Álamo99989898
Jumilla87759292
Librilla94999999
Lorca90788585
Lorquí100979797
Mazarrón94898988
Molina de Segura100989898
Moratalla86718585
Mula96919191
Murcia96949492
Ojós98959594
Pliego98959595
Puerto Lumbreras91859494
Ricote98979695
San Javier1009910098
San Pedro del Pinatar10010010090
Torre-Pacheco9810010099
Las Torres de Cotillas100979797
Totana92848886
Ulea100989796
La Unión99929292
Villanueva100989898
Yecla90739191
Santomera99949491
Los Alcázares10010010099
Region93859190
Table 5. Percentage of radioelectric coverage in natural parks.
Natural Park% LTE Radioelectric Coverage
(46 Sites)
% LTE Radioelectric Coverage
(39 Sites) (Optimized)
Enclavado85%85%
Sierra Salinas97%96%
Sierra de El Carche88%88%
Sierra de La Pila90%88%
Ribera de Cañaverosa63%63%
Cañón de Almadenes53%44%
Ajauque y Rambla Salada99%99%
Carrascoy y El Valle92%92%
Barrancos de Gebas95%95%
Sierra Espuña81%78%
Salinas y Arenales de San Pedro100%90%
Saladares del Guadalentín100%100%
Cabezo Gordo97%90%
Islas del Mar Menor92%92%
La Muela y Cabo Tiñoso79%79%
Calblanque50%40%
Sierra de las Moreras73%73%
Islas mediterráneo97%93%
Calnegre y Cabo Cope88%88%
Cuatro Calas99%98%
Total86%84%

