Article

An Intelligent and Smart Environment Monitoring System for Healthcare

1
Department of Computer Science & IT, Govt Sadiq College Women University Bahawalpur, Bahawalpur 63100, Pakistan
2
Department of Computer Science & IT, The Islamia University of Bahawalpur, Bahawalpur 63100, Pakistan
3
Faculty of Information and Communication Technology, Balochistan University of IT, Eng. & MS, Quetta 83100, Pakistan
*
Author to whom correspondence should be addressed.
Appl. Sci. 2019, 9(19), 4172; https://doi.org/10.3390/app9194172
Submission received: 16 August 2019 / Revised: 21 September 2019 / Accepted: 24 September 2019 / Published: 5 October 2019
(This article belongs to the Special Issue Artificial Intelligence for Smart Systems)

Abstract

:

Featured Application

Smart device for the patients to monitor wounds for early and timely healing.

Abstract

Skin wound healing is influenced by two kinds of environment i.e., exterior environment that is nearby to wound surface and interior environment that is the environment of the adjacent part under wound surface. Both types of environment play a vital role in wound healing, which may contribute to continuous or impaired wound healing. Although, different previous studies provided wound care solutions, but they focused on single environmental factors either wound moisture level, pH value or healing enzymes. Practically, it is insignificant to consider environmental effect by determination of single factors or two, as both types of environment contain a lot of other factors which must be part of investigation e.g., smoke, air pollution, air humidity, temperature, hydrogen gases etc. Also, previous studies didn’t classify overall healing either as continuous or impaired based on exterior environment effect. In current research work, we proposed an effective wound care solution based on exterior environment monitoring system integrated with Neural Network Model to consider exterior environment effect on wound healing process, either as continuous or impaired. Current research facilitates patients by providing them intelligent wound care solution to monitor and control wound healing at their home.

1. Introduction

The major function of skin is to act as protective barrier between body and environment. Skin injury causes loss of slight or larger skin part, which may cause serious disability and even death. The primary concern of wound treatment is rapid wound repair and prevention from chronic wound (ulcer) [1].
Wound healing is a typical biological process, which consists of three major tasks i.e., inflammatory response, new tissue formation, and, finally, tissue remodeling. Wound healing is influenced by wound microenvironment. Skin–wound microenvironment could majorly classify as interior and exterior. Term “interior microenvironment” refers to environment exterior to wound but in direct contact with skin surface, while exterior microenvironment refers to the environment under wound surface and adjacent to the wound region [2]. Interior and exterior environment constitute a number of factors. Some of which have a major impact on wound healing e.g., humidity, temperature, oxygen tension and infection [3]. Clinical researchers also studied the local and systemic factors which may impair wound healing. i.e., local factors including infection, bacteria and patient age—diabetics and other diseases are included in systemic factors [4].
Therefore, continuous monitoring of wound microenvironment for wound management may result in a better response of wound healing. Different wound types hold different features e.g., acute wounds which occurs suddenly, go through all these wound healing phases in a systematic manner, but chronic wounds did not follow normal healing phases, rather they remain in inflammatory phase for long duration [5]. Therefore, acute wound showed high temperature to promote blood flow at wound site while chronic wound temperature is low due to impaired blood supply. In past, before wound healing investigation work done by Hinman and Maibach, it was widely accepted that dry wound environment boosts wound healing. It has now accepted after lots of investigation that moist wound environment necessary to promote new tissues growth. However, moist balance maintenance is very critical issue, as excessive moist can impair wound healing [6].
An important step in wound local care is wound bed preparation. Wound dressing helps to heal wound faster by providing protection, prevention against harmful external bodies and also helpful in provision of moist balance. Two most common wound dressing are gauze-based dressing and second modern dressings, foams, hydrocolloids, hydro fibers, gels and films which based on principle of occlusive wound healing [7].
Discussion of previous studies revealed that lot of factors are correlated with wound healing, where exterior environment is one of them which is most critical one. Consequently, a comprehensive wound care solutions must investigate most prominent exterior environment factors, as shown in Figure 1. i.e., temperature, humidity, smoke in air and air pollutants. These exterior factors can impact wound healing in given manners.
  • Exterior temperature correlated with skin moisture level, if exterior temperature level is high, human body generates more sweating to maintain body normal temperature, this may cause moisture loss and wound became dry which ultimately result in delay of wound healing.
  • Exterior humidity level correlated with temperature, high humidity cause disturbs body temperature level and cause more sweating which ultimately effect wound hydration and moisture.
  • Exterior environment smoke effected oxygen intake of body, while all living tissues required oxygen and nutrients to grow well. In case of skin injury tissue damage and they required healthy regeneration during healing. So, skin wound demanded suitable amount of oxygen for healthy recovery. T.R. Dargaville et al. [8] also studies in their review about factors role in wound healing and they found that any technique which can measure O2 help to patients who going through hyperbaric oxygen therapy to confirm oxygen presence in blood which is necessary for fast wound recovery [9].
  • Exterior environment pollutants may contain bacteria and microbes which may cause infection, which may turn acute wound to chronic wound.
  • Smoke in exterior environment contains toxic elements e.g., nicotine, carbon monoxide, and hydrogen cyanide. These toxics components e.g., Nicotine causes reduction in nutritional blood flow to the skin, which results in tissue ischemia and impaired healing of injured tissue. Moreover, nicotine also cause reduction in proliferation of red blood cells, fibroblasts, and macrophages. Another smoke components i.e., Carbon monoxide lessens oxygen transport and metabolism. Clinically, it has been observed that smokers with wounds resulting from trauma, disease, or surgical procedures showed slower healing rate [10].
Although previous clinical research showed effect of wet and dry environment on wound healing which provided a base for wound monitoring systems, but with comprehensive previous studies as showed in Table 1 we determined three given stimuluses to design an effective wound monitoring system.
  • Previous Studies focused on investigation of dry and wet environment influence on wound healing.
  • Previous studies of wound healing considered just one environmental factor at a time e.g., Moisture, temperature, oxygen, pH etc.
  • Previous Studies only used one sensor to monitor wound healing i.e., biosensor for uric acid detection.
  • Expensive sensors arrays are mostly used previously in healthcare applications.
  • Intelligent decision making approaches were not used in previous studies e.g., neural network to examine exterior microenvironment for wound healing.
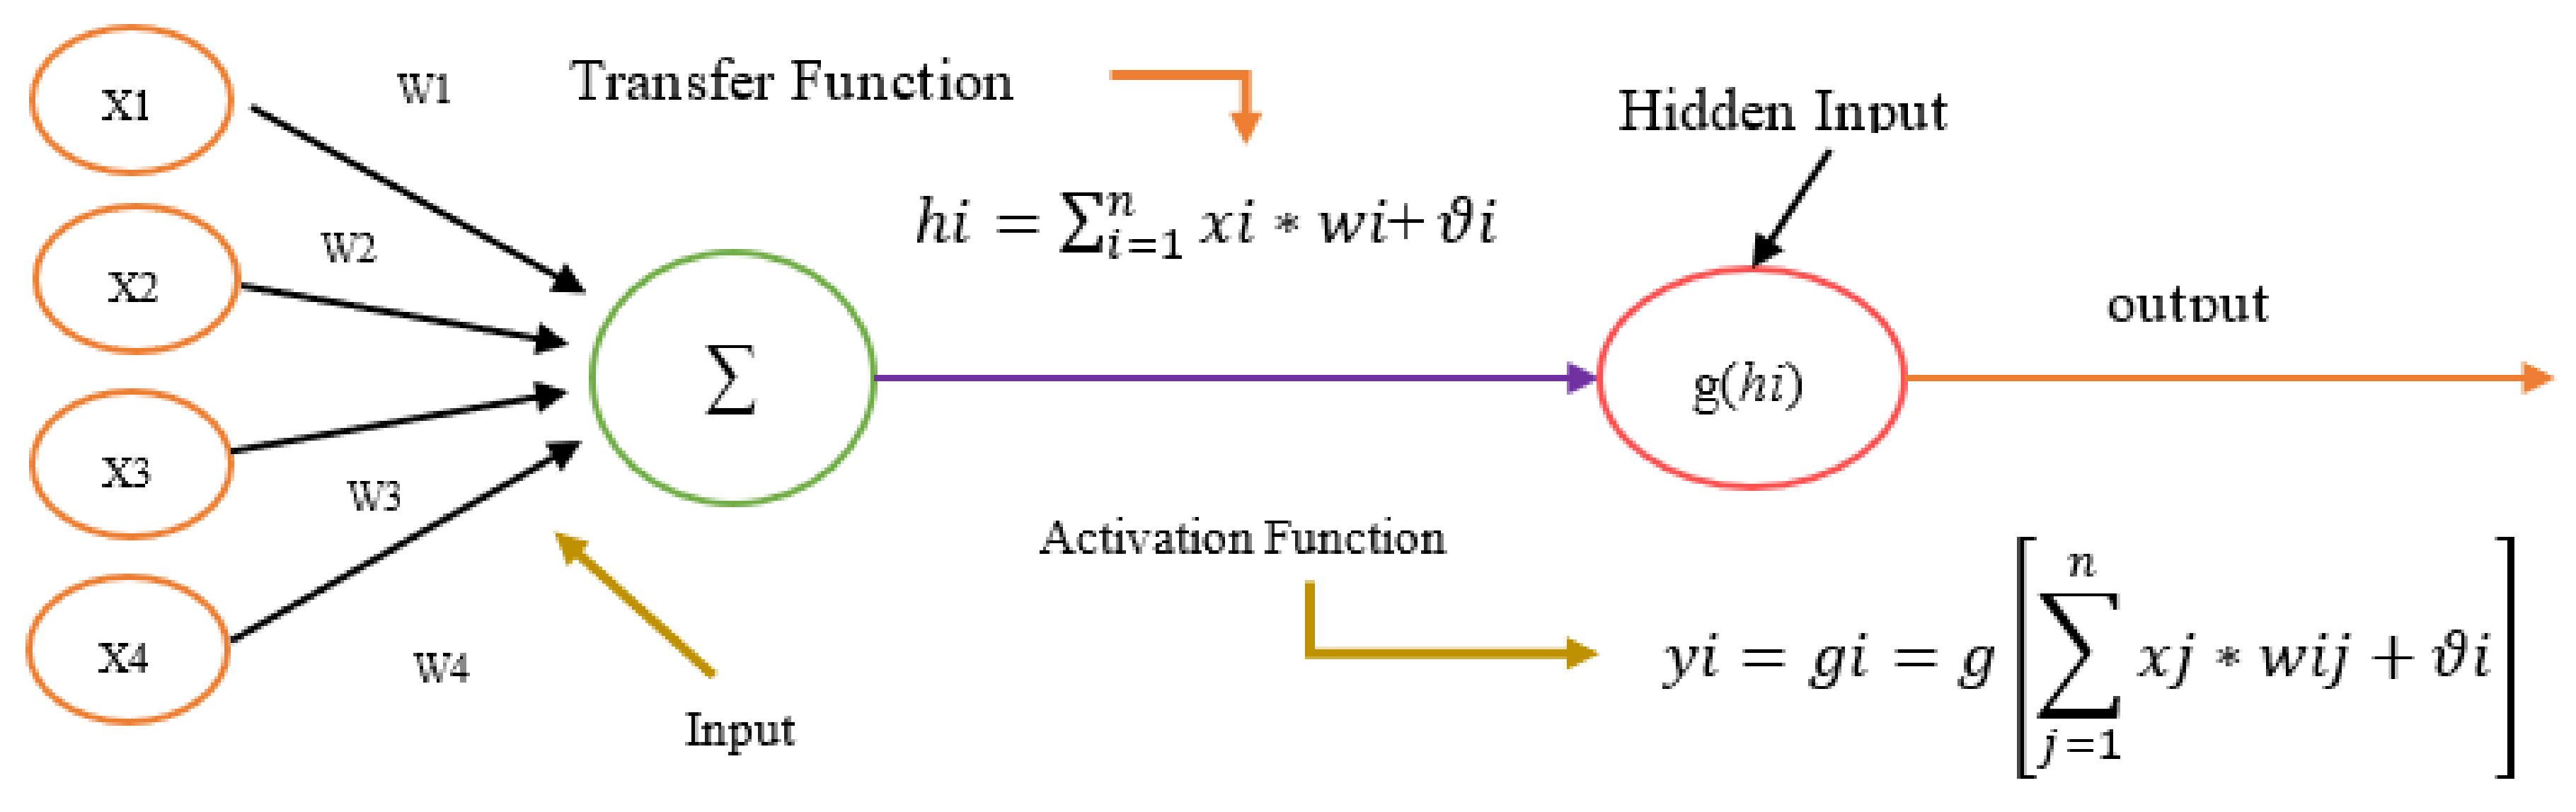
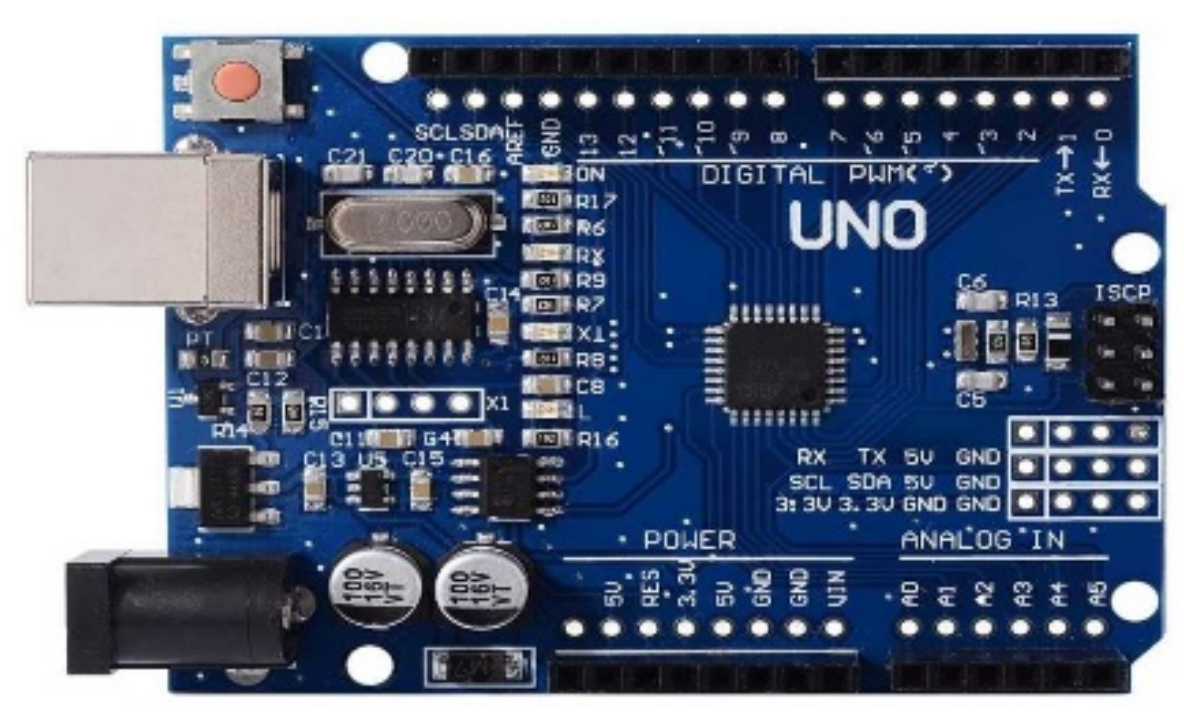
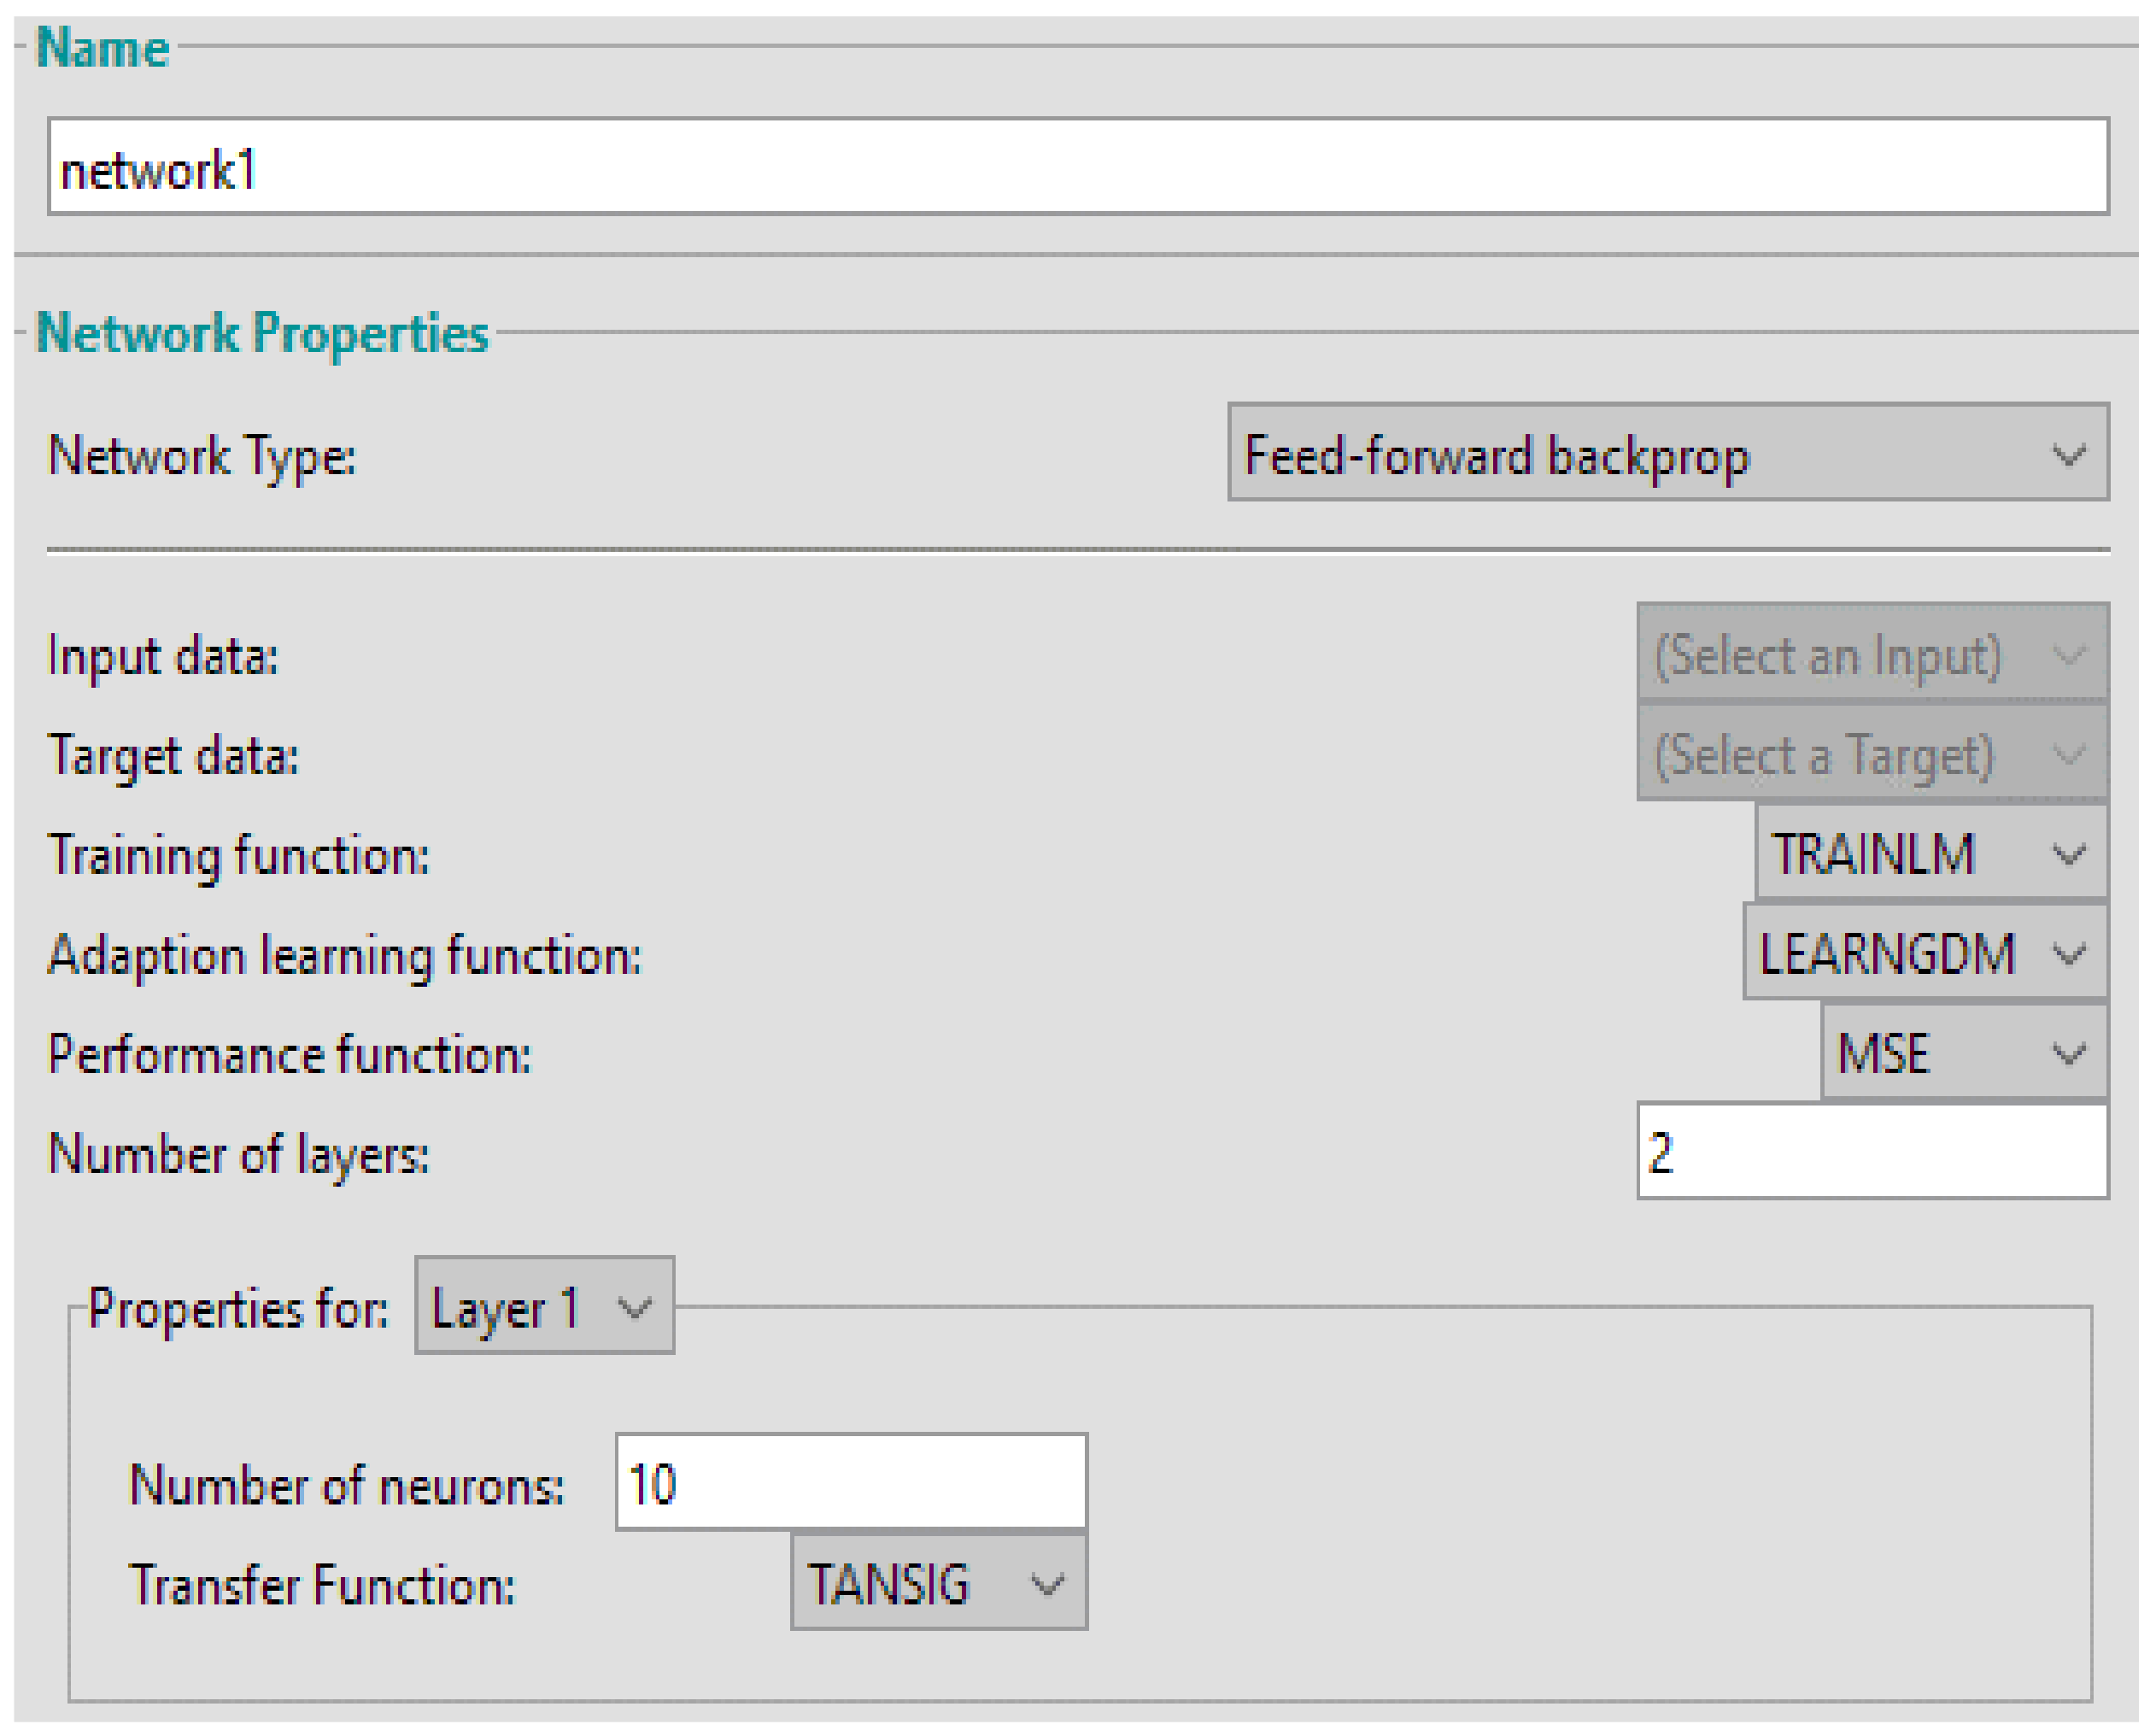
In this paper, we proposed a smart wound care approach based on Exterior environment monitoring System designed by using Arduino UNO microcontroller (Arduino, Somerville, TX, USA) in combination with multi sensors to read exterior environment and then integrated it with MATLAB (The MathWorks, Natick, MA, USA, 2017) for analysis. MATLAB use NN model to investigate real time exterior environment in to continuous or impaired healing class. Experiments showed that EEMS (External Environment Monitoring System) read and record current exterior environment values which can further correctly classify by Neural Network in MATLAB. The proposed approach provides a solution of mentioned four key issues in a robust manner. The four major concerns addressed by the proposed approach discussed below.
  • The proposed approach identifies real time environment feasibility for wound healing process two classes i.e., first one indicates continuous healing and second indicate impaired healing.
  • The proposed approach checks environment feasibility by dealing with multiple environment constituents at a time i.e., temperature, humidity, air quality and dust particles.
  • Our proposed approach used three sensors: a temperature and humidity sensor, a gas sensor and air quality sensor to sense current environment in more efficient manner.
  • Our approach uses an intelligent approach based on a Neural Network Model to decide the current environment feasibility for wound healing either as continuous or impaired type by checking environmental humidity, temperature, Air quality and Dust particles.
The rest of the paper is structured, as follows: Section 2 discusses state of art algorithms and approaches presented in medical healthcare domain which apply sensors and NN to provide solutions of wound or other disease monitoring; Section 3 describes the Architecture of proposed approach and elaborated proposed approach components design i.e., EEMS and NN. Section 4 provides implementation details EEMS and NN with MATLAB by elaboration of experiments design. Section 5 described results and discussions to show the performance testing and outcomes of the presented approach; and, Section 6 presents limitations of proposed approach and Section 7 describe conclusion and Future work of the presented research.

2. Related Work

A lot of research work has been done in the area of skin wound healing. Different researchers studied different factors relevant to wound healing e.g., wet and dry environment effect on different type of skin wound, role of pH in wound healing, role of moisture balance in continuous healing. In the recent past, a few wound care solutions focused on exterior factors effect on wound healing or sensor-based wound care solutions [11,12,13,14,15,16,17,18,19] have been presented, however, the previous methods are only focused on single factor effect at a time and didn’t provide and learning based investigation for wound care, as showed in Table 1.
David McColl et al. [11] did an experimental study to monitor moisture levels of wound dressing. They discussed that appropriate level of moisture between wound dressing and healing site is very necessary for effective healing. If this moisture balance described, then healing process effected due to dry wound surface. They proposed sensor based moisture level monitoring which placed at wound surface/dressing. Their proposed system contains model wound bed and sensor array which filled with fluid to monitor moisture level.
Hyung-Gi Byun et al. [12] proposed an odor recognition system Based on electronic gas sensor array of electronic gas sensors for detection of bacteria types at the early stage of wound infection. Their studies prove that limited set of key volatile products can use to distinguish living bacteria from each other. They use SPME (Solid-Phase MicroExtraction) pre concentration for headspace air in order to increase reliability of bacteria identification. They did evaluation of output parameters for sensor module by processing volatiles emitted from SPME by variable concentrations.
Abdelghani Benharref et al. [13] proposed a system for chronic disease monitoring by using biosensor based health care framework. They used cloud environment intenerated with Service-Oriented Architecture and wireless body sensors. In their proposed system each patient allocated set of sensors depending on his/her chronic disease(s). Their mobile-app based system facilitated patients by using sensors to take health parameter readings. Their system capable to automatically communicates with health care personnel (e.g., physician, nurse, and nutritionist) in order to take advices if necessary.
An android based health care monitoring system proposed by Maradugu Anil Kumar et al. [14]. Their designed this approach to measure patient biological parameters which are more important to assure normal health conditions i.e., heart rate, blood oxygen and temperature. Their proposed android app used web server for measurement and comparison of measured parameters with normal range. The major benefit with this app is all time availability for patient as this app didn’t need doctor to present physically and patient health history stored on web server as well.
The RFID based wound monitoring and healing system proposed by Cecilia Occhiuzzi [15]. In their proposed technique they used RFID sensor tag by integrated it in hydrogel bandage. This intenerated sensor was sensitive to fluid come from wound it could detect change in fluid therefore their proposed system capable to monitor wound. They proposed handheld device for reading temperature with help of microchip embedded in RFID tag. They provided an efficient approach for smart bandage preparation to facilitates in monitoring task of wound healing.
Some researchers suggested pH level as significant factor for wound healing assessment e.g., Rahimi [16] used pH sensor array for designing assessment approach of wound healing. Based on their concept that pH level is major factor to facilitate in wound monitoring that used low cost pH sensor array to present wound assessment approach, they placed this pH sensor array on palette paper. They obtained 0.9734 linear potential in buffer solutions of pH range 4–10 with pH sensor array and sensitivity of 50 mV/pH, this obtained potential and sensitivity matched with their targeted level, which ultimately showed the potential of their approach for integration in wound dressing to detect pH.
An efficient wearable device proposed by Sohini Roy Choudhury et al. [17] for detection of uric acid from wound. Their proposed wearable device used uric acid biosensor. They categorized UA (Uric Acid) as most important biomarker, based on its strong correlation with wounds healing. They used wound fluid volume range of 0.5–50 μL for uric acid detection. They studied different case Studies of wound samples; their results showed an average recovery of 107%.
Shiwen Shen et al. [18] presented hierarchical semantic convolutional neural network for classification of Lung Nodule Malignancy. In their presented approach of a model they provided domain knowledge to NN (Neural Networks) model architecture design, which after training predicted semantic nodule characteristics (calcification, margin, subtlety, texture, and sphericity) and also helpful in nodule malignancy diagnosis. Five semantic features were considered: Mean Square Error. Elias Symeonakis et al. [19] did research on Land Cover Change of Mediterranean environment. They used Landsat TM data between 1995 and 2007 for mapping the land cover change that occurred between in the Mediterranean island of Lesvos (Greece). They solved number of separability issues with classification and the changes identification. They used a multi-layer perceptron neural network model for classification. Their results showed accurate prediction of the quantities of change.

3. Materials and Methods

In this section, we described architectural design of proposed smart wound care solution along with description of used techniques and algorithms.

3.1. Architecture of Smart Wound Care Approach

The proposed smart wound care approach is designed with the capacity for intelligent classification of environment on the basis of exterior environmental factors like Air quality, humidity, temperature and dust particles. Our approach focuses on efficient energy consumption as it does not turn ON all the sensors all the time. An intelligent exterior environment monitoring system handles the effective utilization of sensors to ensure efficient sensing of exterior environment factors.
The proposed approach precisely monitors the wound healing by classifying wound healing as continuous with multilayer NN model. Proposed approach divided into two major components i.e., sensor based module named EEM system for data collection and Neural Network Model for data analysis, mobile app for output display as shown in Figure 2.
Detail working of Proposed SWCA break up in given steps as shown in Figure 3.
  • Data collection by Exterior environment monitoring system (EEMS) based on Arduino Sensors
  • Recording data in system
  • Data analysis by Neural Network Model
  • Displaying the obtain class of wound healing using Android App

3.1.1. Exterior Environment Monitoring Module

First step in proposed approach is sensor based data collection as shown in Figure 3. To do this task, we used three sensors i.e., air humidity and temperature sensor, gas sensor and dust sensor. The proposed system performed data collection task by EEMS that includes all the hardware devices such as sensors, microcontroller and system devices. Figure 3 explains the working of sensors and the process of collection of data and storage at data in system for further analysis.

3.1.2. Neural Network Model for Smart Wound Care Approach

In our proposed approach, we used Neural Networks for classifying current environment to build efficient wound monitoring system. Although, there are many other machine leaning algorithms e.g., SVM, decision tress, KNN etc. which could provide solution of classification problems but, we preferred neural network on other machine learning approaches due to given three reason.
  • NN can handle large amount of training data, as in our proposed scenario training data size may grow in future if other environmental factors (interior factors i.e., patient body temperature, pulse rate etc.) and patient’s personal health profile (other disease i.e., skin, diabetic record) considered in decision making process of proposed system.
  • We preferred NN over other machine leaning algorithms due to its flexibility as new features can be adjusted by increasing training data size which ultimately reflect in output, no extra parametric configuration required in case of any change.
  • Another reason of choosing NN is its ability to outperform other machine learning techniques as its performance can continue to improve by increasing training data size.
  • NN suitable for non-linear problems, as current problem cannot solve by linear separable functions, where two output classes could separate by straight line rather current problem showed convex region, to handle convex region we considered neural network approach.
Artificial Neural Network first developed in 1950, is famous technique of machine learning. ANN can have produced highly accurate results. They have capability of efficient decisions making like human beings therefore suitable to use in medical applications, like prediction and pattern recognition. Most famous applications of neural network in medical domain are clinical diagnosis, image analysis and interpretation, Further, ANN applied in medicine domain for detection of pathological conditions by analysis of blood and urine samples and detection of glucose [20,21]. Neural Networks can address the problem of supervised learning i.e., a data set contains all possible examples of input data with their accurate truth values/output are provided. Neural network learns this data set pattern and could be used to predict class/label of incoming test data set where classes/labels are not known. In general, NN provides a classification layer above stored data. Neural Network consist of three components: input layer, hidden layer, and output layer.
There are many types of NN to use i.e., Conventional Neural Network, Back Propagation, Feed Forward etc. Feed Forward etc. Learning of neural network consists of two steps. First Forward Propagation and then Back Propagation [22,23].

3.2. Proposed Feed Forward Neural Network Design

In our proposed approach, after data collection we did analysis by proposed feed forward neural network, as shown in Figure 4. Proposed Feed forward neural network follows given algorithm steps to work.
  • Start with weights and bias values.
  • Compute weighted sum of all inputs for each node of hidden layer by using transfer function.
  • Compute output of each node in hidden layer by applying activation function.
  • Use hidden layer node output as input for computation of weighted sum of output layer using transfer function.
  • Apply activation function to compute output.

3.2.1. Used Layers

In our proposed, feed forward neural network we take three computational layers i.e., input, hidden and output layer.
  • One input layer X = which contain input data set consist of sensors reading obtained by EEMS. It contains values of Temperature, Humidity, Air Quality and Dust Particles.
  • One Output Layer Y of problem defined are Healing Classes according to EEMS reading are either “continuous” or “impaired”. Output represented by Y.
Y = 0 to denote danger to impaired
Y = 1 to denote Favorable for continuous healing
—one hidden layer
In our proposed approach we did selection of 10 hidden neurons, by using formula given in Equation (1).
N h = N s ( * ( N i + N o ) )
where
  • Nh = number of hidden layers
  • Ns = No of instances in training dataset
  • Ni = No of input neurons
  • No = No of output neurons
  • α = an arbitrary scaling factor usually 2–10
As in our proposed NN value of Ns = 500, Ni = 4, No = 2 and we randomly selected α = 8, by putting values of our proposed NN in given formula we got 10.
Nh = 500/8(4 + 2) = 500/8(6) = 500/48 = 10.41

3.2.2. Used Transfer Function

In our proposed NN model, we have 4 input node, 10 hidden nodes and one output node. We need some mapping mechanism in order to map input values to hidden layer nodes and hidden layer nodes to output node. To accomplish this mapping goal, we used transfer function shown in Equation (2) given by [24].
H i = i = 1 n xi × wi + ϑ i
where
  • Hi = Hidden layer input
  • xi = input value
  • wi = random weight assigned by network and
  • ϑ i = bias   value   choosed   by   network
In our proposed NN model we take xj = x1, x2, x3, x4
Where x1 = temperature, x2 = humidity, x3 = air quality and x4 = dust particles
Transfer function for hidden layer node 1:
x1 × w11 + x2 × w12 + x3 × w13 + x4 × w14 +   ϑ 1
Transfer function for hidden layer node 2:
x1 × w21 + x2 × w22 + x3 × w23 + x4 × w24 +   ϑ 2
this computation repeated up to 10 nodes and final weighted sum then become input for hidden layer of proposed NN model. This input will provide activation function for output of hidden layer which in turn used as input for transfer function applied on mapping between hidden layer and output layer.

3.2.3. Used Activation Function

In our proposed NN model after computation of hidden layer input with transfer function we need some activation function for output prediction of hidden layer. To perform this task, we used activation function described in Equation (3), also used by [25].
Y = Activation ( i = 1 n hi )
Here
  • hi = input of hidden layer i and
  • Y = output
Although, many activation functions available i.e., linear, step, sigmoid, gaussian and Hyperbolic Tangent function. In our proposed feed forward NN, we used hyperbolic tangent (tanh) function given in Equation (4), which is mostly used activation function in MATLAB [26].
tan h ( x ) = 1 e x 1 + e + x
Here x = value computed by transfer function i.e., i = 1 n hi .

3.2.4. Used Error Function

When proposed NN model generate output class different from expected class of output it is considered as error. This difference may vary. To compute error rate of our proposed NN we used given Equation (5), also applied by [27,28].
Error   Rate = Ya Yp
where
  • Ya = Actual Class
  • Yp = Predicted Class of Forward Propagation.

3.2.5. Back Propagation

Proposed NN used given Equation (6), to adjust weights, during back propagation [29] in order to reduce error rate, given by [30].
i = i n wi = wi ( η * σ ( err ) / σ ( wi ) )
where wi = weight; η = learning rate; ( err ) / σ ( wi ) = differential which is measurement of each weight contribution in total error rate.

4. Implementation

The smart wound monitoring system was implemented in MATLAB. The system implemented in lab uses an Arduino UNO controller in connection with three sensors for reading environmental factors. The microcontroller receives data from sensors and forwards it to the Neural Network Model. Following section briefs the details of the hardware used to implement the proposed smart external microenvironment wound monitoring system.

4.1. Used Hardware

Although there are many pollution measurements equipment is presented but they have two major issues they are expensive, and they are present only locally as they are at fixed locations. So, in our proposed approach we design cheap and portable EEMS. In order to read values of under observation environmental factors i.e., Humidity temperature, Smoke, Dust Particles we design Exterior Environment Monitoring Module composed of given components.
  • Arduino UNO
  • DHT22 Humidity and Temperature Sensor
  • MQ2 Gas Sensor
  • PMS5003 Dust Sensor

4.1.1. Arduino UNO

We used an open source microcontroller board (as shown in Figure 5) composed of 14 digital and 6 analog input/output (I/O) pins which can use to communicate with various expansion boards (shields) these pins can have programmed with the Arduino IDE (Integrated Development Environment) by using a type B USB cable.

4.1.2. DHT22 Humidity and Temperature Sensor

In our proposed approach, we used DHT-22 (also known as AM2302) sensor as given in Figure 6, for detection of external environment temperature and Humidity. DHT-22 is a digital-output sensor. DHT-22 use thermistor to measure the surrounding environment and a capacitive humidity sensor. DHT-22 provides more accurate sensing capacity over large range as compare to DHT-11. Technical details of DHT-22 described given.
  • Power—3–5 V
  • Max Current—2.5 mA
  • Humidity—0–100%, 2–5% accuracy
  • Temperature—40 to 80 °C, ±0.5 °C accuracy

4.1.3. MQ2 Gas Sensor

In our proposed system, we used MQ2 gas sensor, as shown in Figure 7 to measure harmful gases in microenvironment. MQ2 is very fast sensor, it can detect LPG, i-butane, methane, alcohol, hydrogen, and smoke. Due to its fast response, measurements can be taken as soon as possible. Its sensitivity is adjustable by the potentiometer. We preferred MQ2 sensor due to it fast response and low cost. Technical details of MQ2 given below.
  • Required Operating Voltage is +5 V
  • MQ2 can measure t LPG, Alcohol, Propane, Hydrogen, CO and even methane
  • Analog output voltage range: 0 V to 5 V
  • Digital Output Voltage range: 0 V or 5 V (TTL Logic)
  • 20 s duration for Preheat
  • It can be used both as Digital and analog sensor

4.1.4. PMS5003 Dust Sensor

In our proposed approach, we used PMS5003 sensor, as shown in Figure 8 to detect PM2.5 dust particles. Mostly air contains two types of particles i.e., PM10 and PM2.5. Diameter of PM10 particles is 10 micrometers or less while PM2.5 holds 2.5 micrometers or less diameter. There Small particles like PM2.5 also called.
PMS5003 is also a digital sensor. It is very efficient in detection of air particles concentration and output them in the form of digital interface. We used this sensor due to its efficiency in detection of PM 2.5 particles, in which we are interested. Technical details of PMS5003 given below.
  • Measurement Range: 0.3~1.0; 1.0~2.5; 2.5~10
  • Counting Efficiency 50% for 0.3 μm and 98% for ≥ 0.5 μm
  • Effective Range (PM2.5 standard): 0~500 μg/m3
  • Maximum Range (PM2.5 standard) ≥1000 μg/m3
  • Resolution 1 μg/m3
  • Working Temperature Range: −10~+60 °C
  • Working Humidity Range: 0~99%
  • Storage Temperature Range −40~+80 °C

4.2. Implementation of Neural Network in MATLAB

After data collection by EEMS, Proposed SWCA performed data analysis by implementation of proposed NN model in MATLAB, by adopting steps depicted in Figure 9.

4.2.1. Training Dataset Design

We implemented proposed system with NN, which required pre-labeled data set for training. In our proposed system we designed dataset for training contained 800 total instances. Complete design of training data set shown in given Table 2 and the detailed description of used training dataset instances of each environmental factors is also shown in Table 3. We consider environmental conditions of different location and prepared dataset as shown in Figure 10, to cover maximum conditions for all kind of environmental conditions.

4.2.2. Designing Neural Network

We implemented NN in MATLAB by using NN toolbox. To design a new NN model in MATLAB NN toolbox we performed given steps, as shown in Figure 10.
1.
Import Training dataset
2.
Import Target dataset
3.
Open NN toolbox
4.
Did necessary network configuration such as
  • Input layer
  • Hidden layer
  • Hidden layer no of nodes
  • Activation function
  • Transfer functions
5.
Start training
6.
Repeat training to gain maximum performance
7.
Export model
8.
Start simulations to check performance
We used command given below to import training dataset as variable in MATLAB workspace.
TrainingData = readtable (‘TrainingData.xlsx’);
This command will open Excel dataset present in current directory and read its values inn TrainingData Variable. This Variable is created in workspace. Next define target variable to save labels of input data on which NN will train. Next, we opened NN toolbox by entering command nntool in command window of MATLAB. This NN tool required input data set and target data set for training. We import both input and test data variables from MATLAB workspace then we add new neural network and set its properties as required by design of proposed NN discussed in Section 3.2.
From configuration window showed in Figure 11 and Figure 12 we did necessary configuration mention in Section 4.2.1, i.e., we select training dataset as input given in Figure 11, target dataset as target, transfer function, performance function no of layers 3 and hidden layer no of neuron. Our designed NN model shown in Figure 13. Proposed model showing 3 layers of model, as defined by our proposed NN in Section 3.2.
  • First layer called input layer composed of 4 input neurons.
  • Second layer called Hidden layer having 10 neurons
  • Third Layer called Output layer having one neuron that is output of provided input dataset.

4.2.3. Training Neural Network

Once designed NN model is ready to use, we started network training mechanism. We trained proposed NN in MATLAB by using NN toolbox, from NN toolbox we opened designed model and from training option we selected previously imported input data set as input of NN and target variable as target label for training and start training of NN as shown in Figure 14.
To achieve maximum accuracy of NN we repeated training round 7 times which ultimately decrease MSE and improve performance of trained NN. with three different input data set recorded by EEMS in three different environment setups. Trained NN model performance depicted with help of its performance graph and regression graphs.

4.2.4. Stimulating Neural Network

In order to validate performance of our proposed NN model, we used to give two techniques.
  • By using stimulation option of NN toolbox
  • By Stimulation Model
To validate performance of proposed NN by toolbox stimulation option we import test dataset as input to trained NN model. This test dataset contained real time values of environmental factors under consideration, which we taken through proposed EEMS. After providing input dataset we set output variable name and start stimulating network, upon completion of network stimulation, we analyzed prediction results by opening output obtained through network stimulation. Output shown inn Figure 15.
We also adopted second method for validation of proposed NN i.e., we prepared stimulation model by using Simulink in MATLAB as shown in Figure 16, we provided 30 test data cases out of them 3 showed in Table 4, as input parameter and start simulation, obtained results of simulation shown in Figure 17.
Simulation results showed the correctness of proposed system, out of 30 cases 24 were correctly predicted and 6 were wrongly predicted, it showed that system correctness level is 80% with designed NN model.

4.2.5. Displaying Output on Android APP

Last step of proposed approach is to connect MATLAB generated neural network model with android app. After training of Network with standard NN toolbox of MATLAB, we used GENSIM command from standard NN toolbox to export trained network to Simulink, then from generated Simulink model we used deploy to hardware option to deploy hardware in android device. After complete configuration settings required for android studio to connect Simulink Model, we export deployed Simulink model of our trained NN and run it to get required output after doing all settings required to build and run Simulink model in android studio.

5. Result and Discussions

The smart wound care approach is an intelligent system that holds capability of the true decision making based on Neural Network model. The use of intelligent approaches for sensor-based wound monitoring is a new idea. The architecture of the proposed system and its implementation details are given in the previous sections. To test the performance of the proposed system, we implanted three types of sensors (temperature and humidity, Gas Sensor and optical Dust sensors) on a three different testing field i.e., Home, Outdoor (park) and highly polluted area. All obtained results of these experiment discussed comprehensively in this section.
  • Test Data set 1 is collected from home Environment;
  • Test Data set 2 is collected from Out-door (park) environment;
  • Test Data set 3 is collected from highly polluted environment (Industrial Area Air).

5.1. EEMS Calibrations

The input data received from the sensors is forwarded to the system and results are shown at an Android application. This system is fully automatic. The four types of sensor data are received from three sensors and the calibrated output is processed using Neural Network Model with the help of classification tables shown below. Table 5 shows three classes (low, normal, high) for various levels of air temperature detected by the DHT22 temperature and Humidity sensor.
Table 6 shows three classes (dry, normal, wet) for various levels of air humidity level detected by the DHT22 temperature and Humidity sensor.
Table 7 shows three classes (normal, alcohol, lighter) for various levels of Smoke detected by the MQ2 gas sensor.
Table 8 shows three classes (very good, moderate, fair, poor) for various levels of air pollution detected by the PMS5003 dust sensor.
Table 9 shows proposed NN output result in two major classes i.e., continuous or impaired, based on calibrations range of three attached sensors in proposed EEMS, if obtained sensors reading are in normal range, NN predictions will be positive, and showed output continuous as favorable exterior environment may lead continuous wound healing but if obtained calibrated data ranges are not in normal ranges then output will negative which suggest that wound healing may impaired due to unfavorable exterior environment.

5.2. Evaluation of Trained Neural Network Model

Machine leaning algorithms have wide application in almost all domains, many machine learning algorithms extensively use for data classification i.e., Naïve Bayes, Support Vectors machines, Decision trees, Neural Networks, etc. Each of these algorithms are suitable for providing solution of different problem scenario. Like SVM have capability to handle larger data set values approximately 2500 Vectors dealing algorithm presented by researchers [31]. Although Support Vector Machines (SVMs) are very accurate modern classifiers that deliver up-to-mark performance in pattern recognition problems of real-world scenario and also preferred to use in data mining applications such as text categorization, hand-written character recognition, image classification and bioinformatics. Although they generate very accurate solutions but, they not preferred in online applications where classification is to be done on large no of vectors and it required in great speed [32]. We used Neural Network Model to predict Environment Type. NN already applied in medical domain for classification of images in order to diagnose disease. To measure Trained Neural Network performance, we use one standard error measure known as Mean Square Error which is simply mean of error squares. Term Error means difference in expected and actual output. Formula for MSE is given below in Equation (7).
MSE = 1 / n i = 1 n ( fi yi ) 2
MSE graph and gradient graph for 1st training round of trained NN shown in Figure 18 and Figure 19 respectively, graph showing total epoch are 84 i.e., NN is trained on all input data samples by 84 passes. Best validation performance is 2.7661 × 10⁻⁸. We repeated training rounds to decrease MSE and achieved maximum Accuracy rate of NN. Each round performance measure and MSE graph are shown in Figure 20. MSE of round 2 and round 6 are shown which depicted that MSE rate decreases in each consecutive round and performance measures verifying that with decrease in MSE performance values showing improvement in NN.

5.2.1. Trained NN Prediction Evaluation Parameters

We evaluated obtained output of trained NN with help of formula, shown in Equation (8) and error rate shown in Equation (9), also used by [32].
A c c u r a c y ( U F ) = C o r r e c t l y   P r e d i c t e d T o t a l   P r e d i c t e d   * 100
E r r o r   R a t e = W r o n g l y   P r e d i c t e d T o t a l   P r e d i c t e d * 100
  • Accuracy Rate for Favorable class; Prediction = 88/89 × 100 = 98%
  • Accuracy Rate for Unfavorable class; Prediction = 116/145 × 100 = 80%
  • Error Rate for Favorable class; Prediction = 1/89 × 100 = 1.122%
  • Error Rate for Unfavorable class; Prediction = 29/145 × 100 = 20%

5.2.2. Analyzing obtained Experimental Results

We used trained NN model to predict Environment Type of three different Data Set obtained by reading Real Time Environment values by EEMS in three different environment setup i.e., In-door(home), Out-Door(park), Highly Polluted (Industrial area). Test Data Set Design shown in Table 10 and Results obtained from Trained NN given below in Table 11. We use statistical measure Precision, Recall and Accuracy to evaluate performance of trained NN model. We used formulas for Precision, Recall and Accuracy given below in Equations (10–12) respectively.
  • True positive TF: NN Predicted Real Favorable class as Favorable;
  • False Favorable FF: NN predicted real Unfavorable class as Favorable;
  • True Unfavorable TUF: NN predicted Real Unfavorable class as Unfavorable;
  • False Unfavorable FUF: NN predicted real Favorable class as Unfavorable;
Precision = TF / ( ( TF + FF ) ) * 100
Recall = TF / ( TF + FUF ) * 100
Accuracy = ( TF + TUF ) / Total * 100
Neural Network Model prediction results for three different data set taken from in-door, park and industrial area are shown in Figure 21, showing that Indoor environment having high precision and accuracy rate compare to other two environment NN predicted more classes for continuous wound healing for home data set with 99% accuracy rate as indoor environment have suitable atmosphere for skin wound healing and promotes continuous wound healing, while outdoor environment like park have negative impact on wound healing and may cause impaired healing, NN showed accuracy rate is 96% for outdoor data, third data set of industrial area have more severe exterior environment, hence showed more chances of impaired wound healing, this dataset showed less precision 92% meaning that it have less positive classes with accuracy rate 96%.

5.3. NN Complexity

As current approach is implemented with NN, which required time and space for execution.

5.3.1. Time Complexity

In order to compute time complexity, we assume that NN training contains no of iteration and time complexity of each iteration depends on network structure i.e., network density. Therefore, for multilayer neural network time complexity computation, we assume all weights and neurons need to process, provided that every neuron has at least one weight w, it could ignore and O(w) where w = total no of weights and for every layer assumed to connected with other layer therefore n*ni. Now complexity for x examples each repeated y times is O(w*x*y).

5.3.2. Space Complexity

Space or memory complexity of an NN is minor as neurons are scattered over particles. So small data structures required to store one neuron as input, that obtain from other neuron ass outputs, along with other parameters and computation model of the neuron also store inn data structure, but all these mutually require slight memory space allocation. This one-dimensional data structure will grow linearly by the number of neurons, which send their outputs as inputs to a given neuron. So, the linear space complexity of one-neuron defines by number of neurons connected to the single neuron. Even if one neuron connected to multiple neurons, then the space complexity is still linear as space complexity computed by with multiplication of single neuron by the number of neurons it connected.

5.4. User Quality Of Experience

We designed proposed system to facilitate patients at their site, therefore it was necessary to check proposed system significance for target users i.e., skin wound patients of different age. We did experiments on human to verify working of proposed system and user’s satisfaction level. We considered four important parameters to verify quality of proposed system i.e., system response time, output accuracy, portability and complexity level [33]. We did experiments with users of different age and obtained results given in Table 12.

6. Advantages and Limitations of Proposed Approach

The proposed system is designed to monitor wound healing process by analyzing environmental factors, proposed approach is very effective for this purpose. There major advantages and few limitations of proposed approach as described in Table 13 and Table 14.
In our proposed healthcare solution, we used NN model for data analysis, there are many other machine learning techniques are present, that could be used for decision making involved in current problem scenario. We did comparative analysis of used NN with other machine learning techniques by using systematic reviews and application of NN in diagnostic [34,35,36,37] and to justify our choice of NN. Table 15 showed results of our analysis. We considered 8 parameters, out of them most important concern for current problem scenario was data size, performance, error and computational power. Table showed that for all these parameters NN can perform well.

7. Conclusions and Future Work

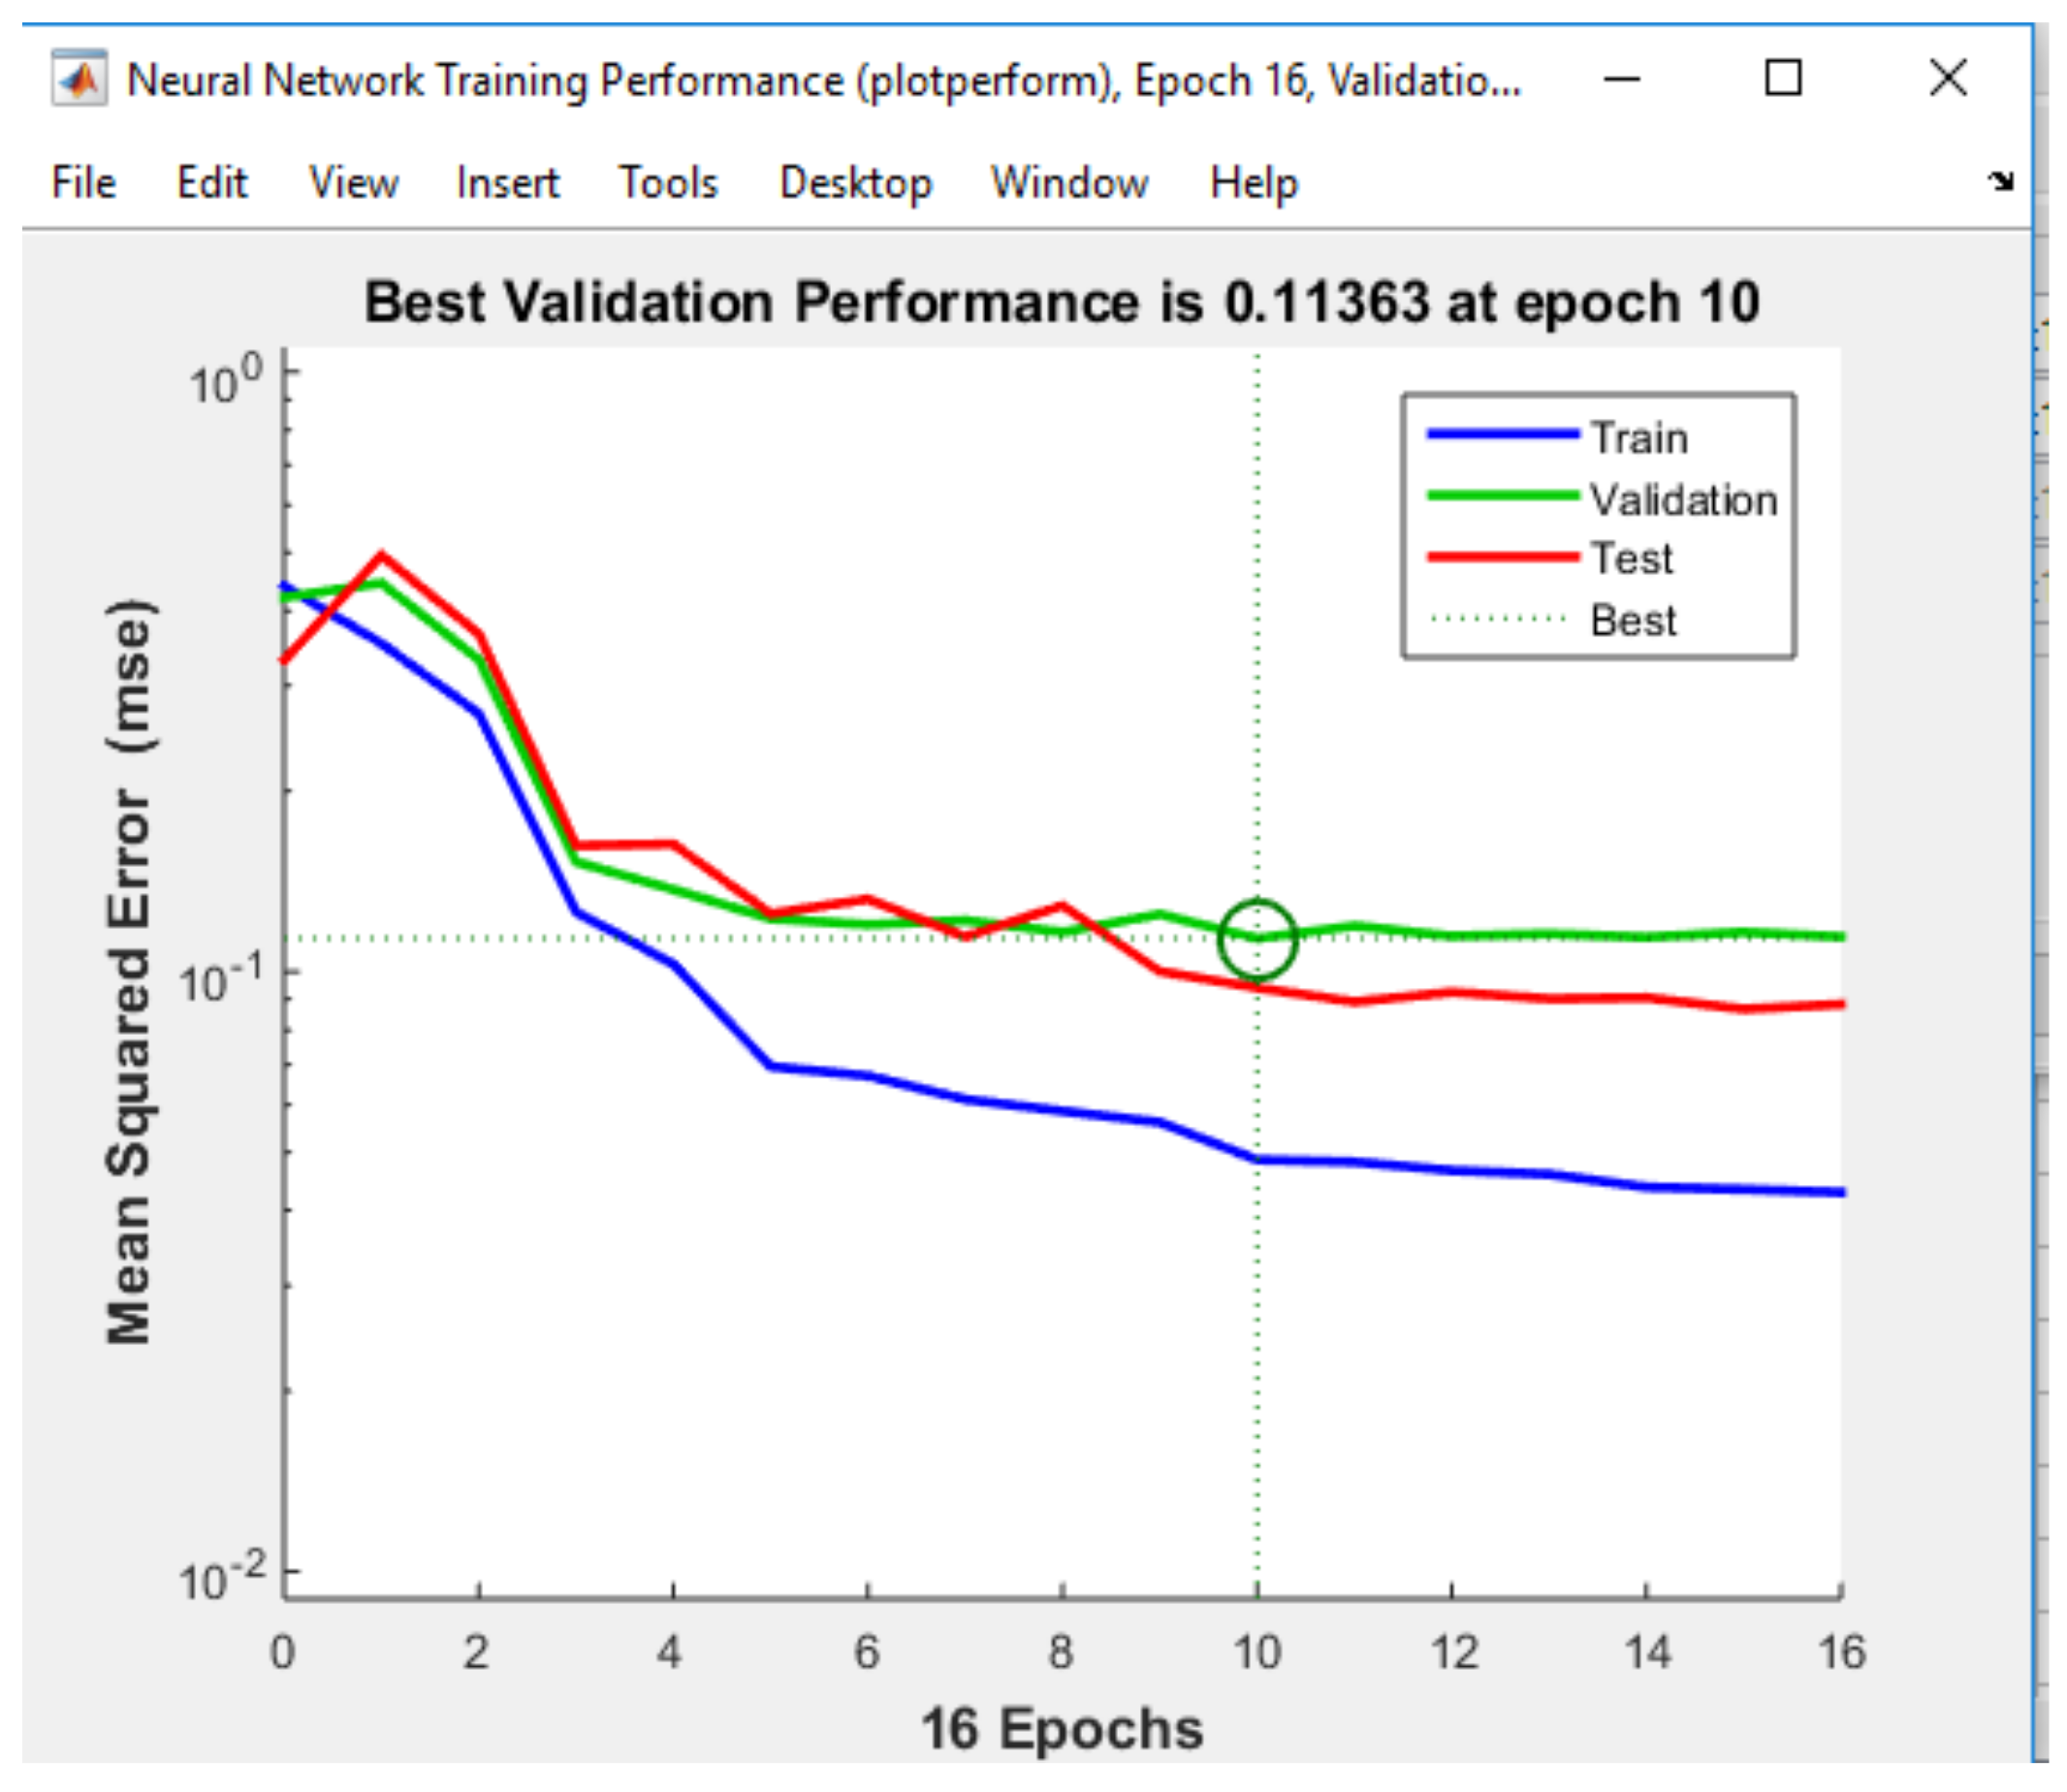
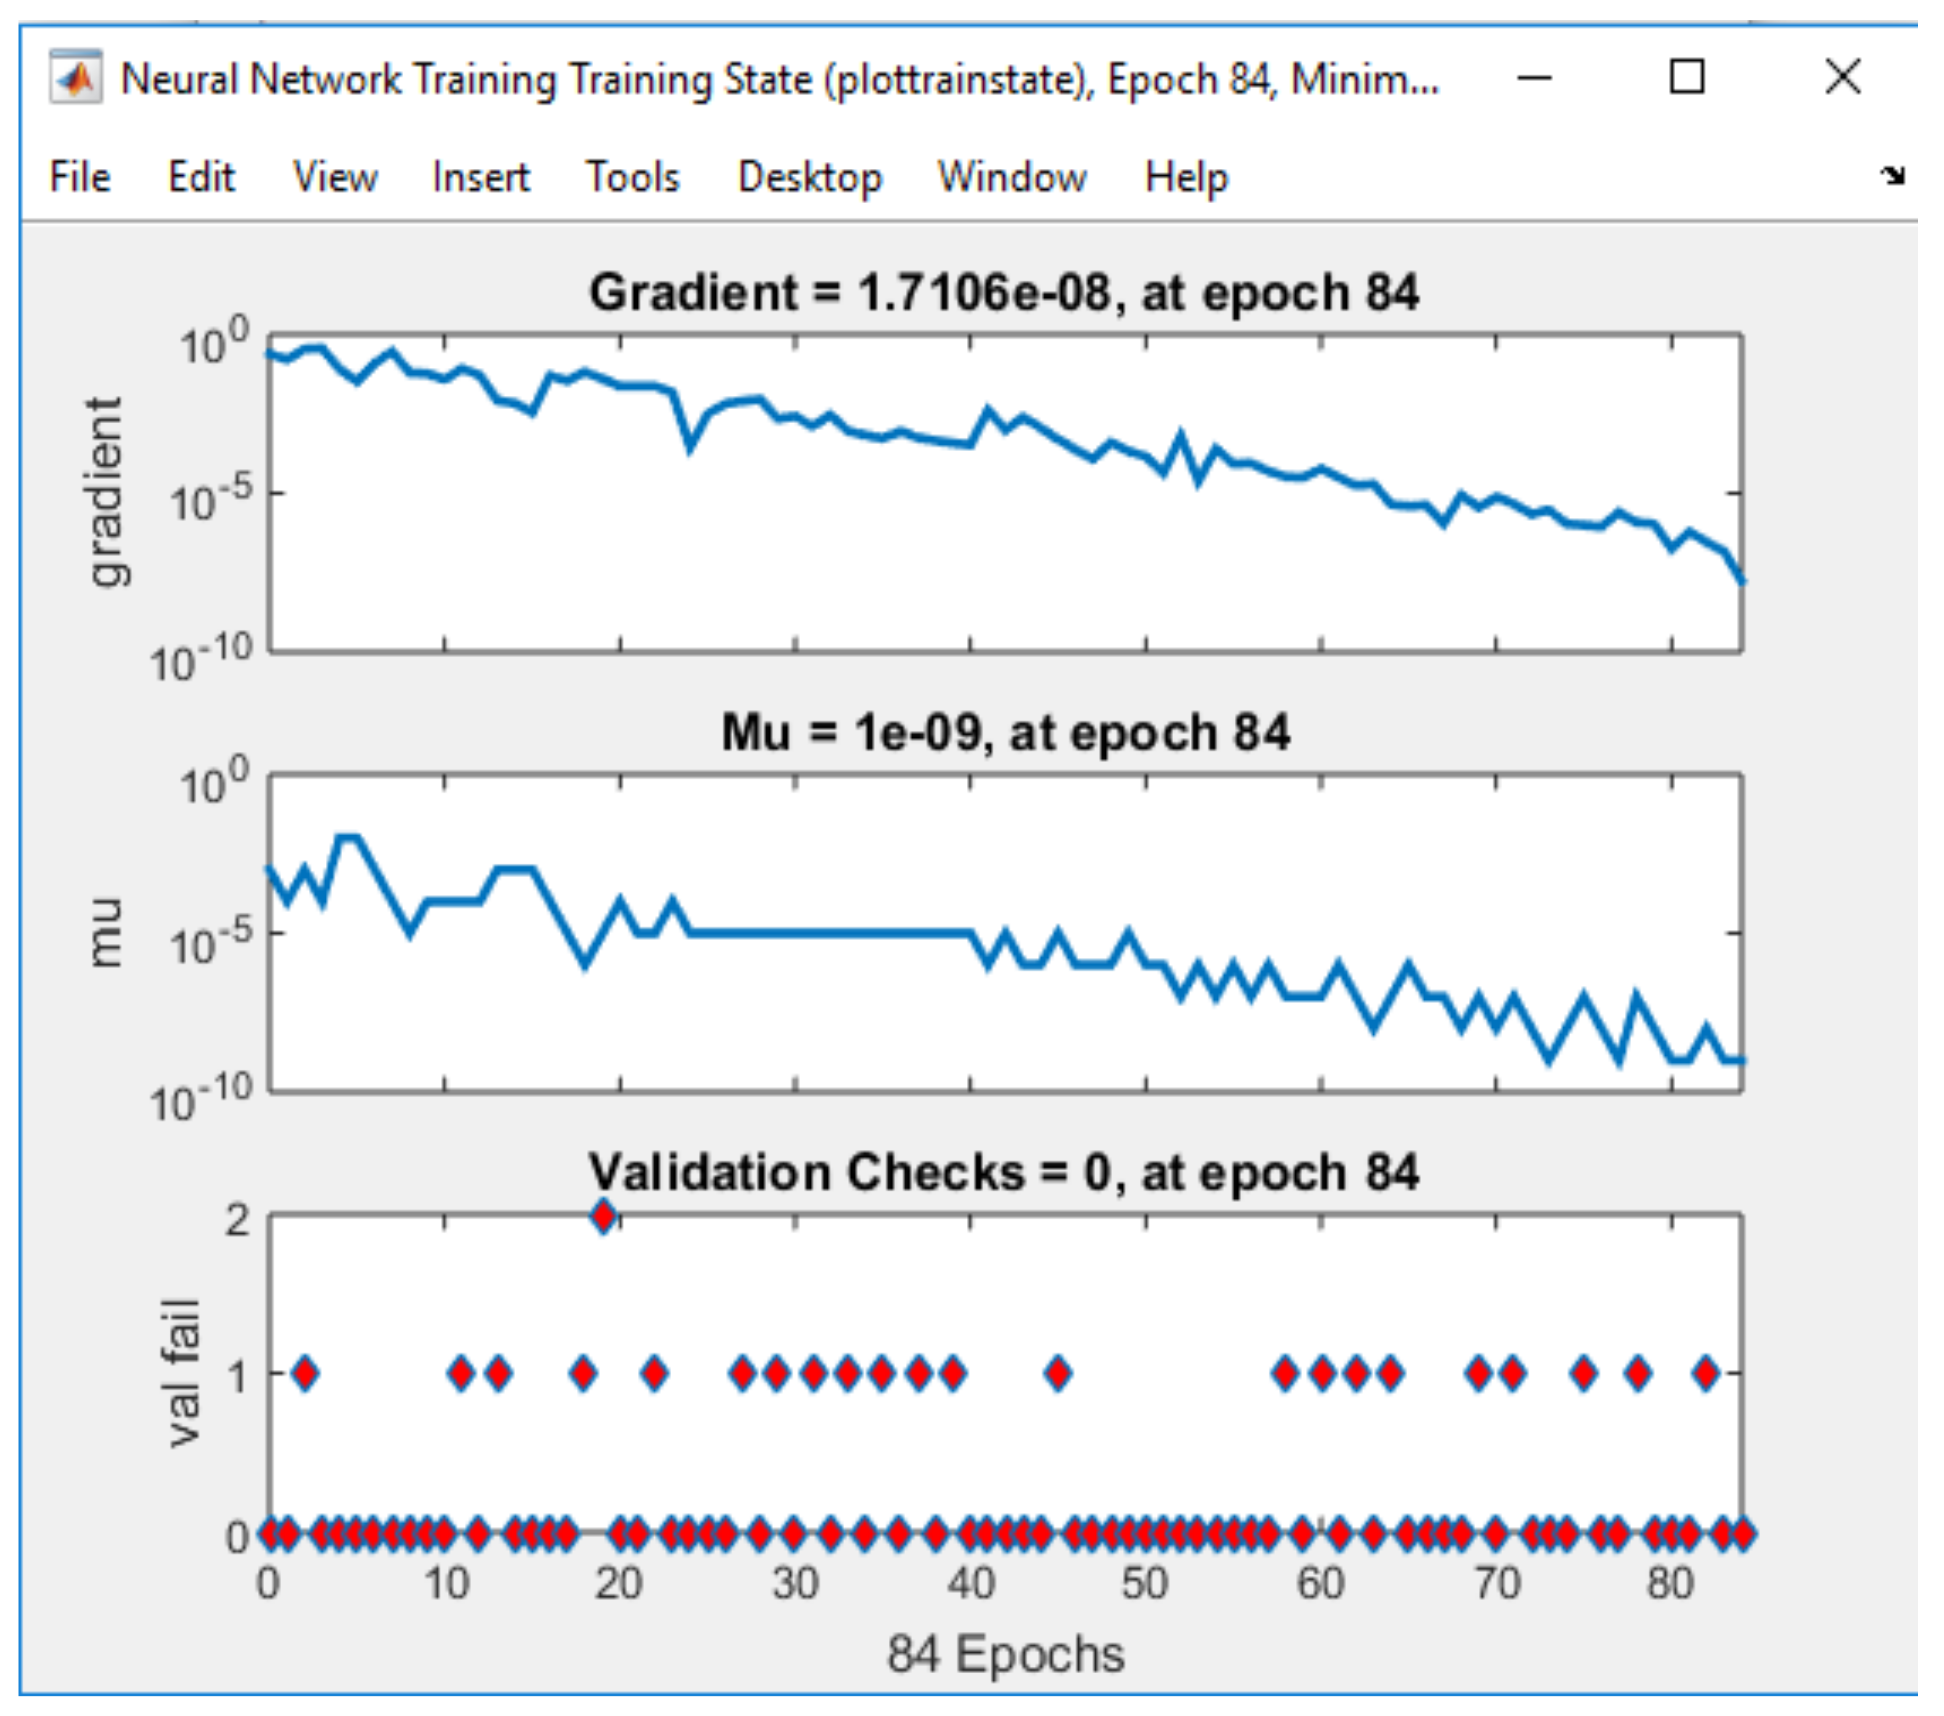
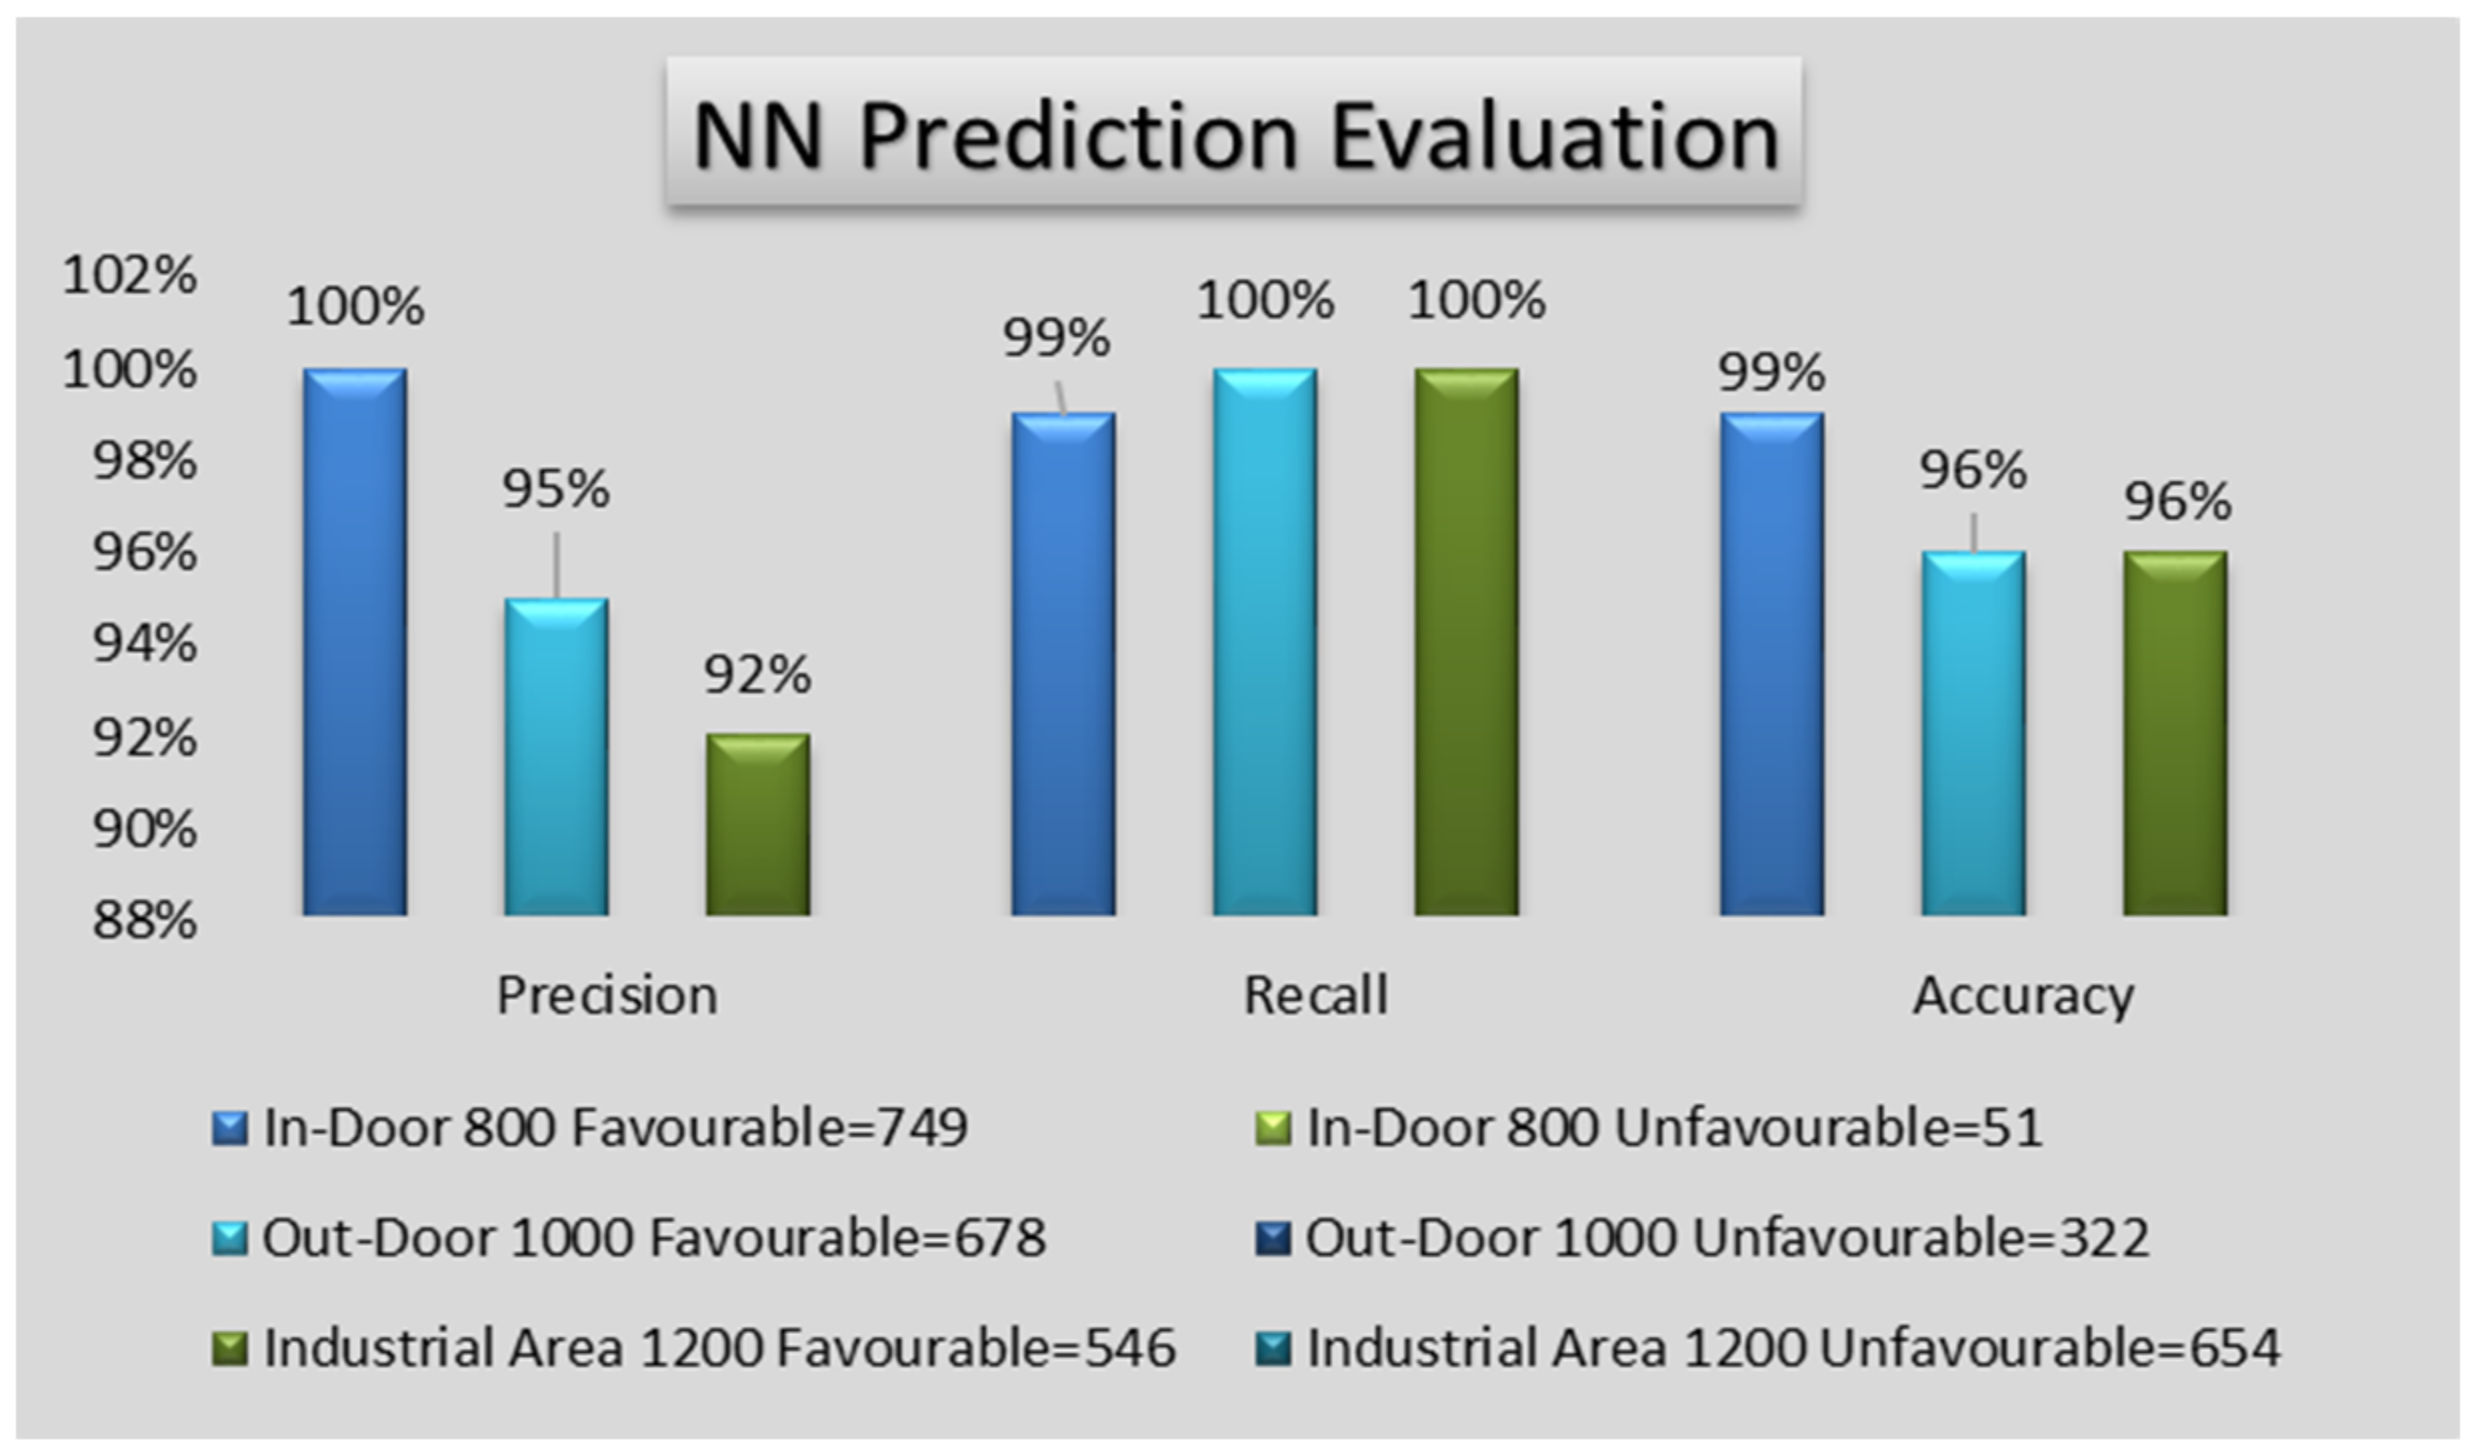
In current research work we proposed an android based wound care solution to detect environmental feasibility level for wound healing, as wound healing effected by many factors, environment is one such factor which play active role in healing. It is necessary to monitor wound environment like other wound characteristic i.e., wound color, size and depth. Like other wound characteristic wound environment may not need clinical visit for assessment. This environmental factor is somehow measurable at patient site, which may enable patient to assure healthy wound environment for speedy recovery. Therefore, we proposed simple wound care solution to monitor current environment feasibility for open skin wound healing. Given solution have two components i.e., EEMS and NN Model. We used Exterior environment monitoring system to record current environment readings with help of Arduino UNO based circuit connected with three sensors DHT22, MQ2 and PMS5003 Dust sensor. We programmed Arduino Controller to record Temperature, humidity, Air quality and dust particles from environment and record the values in Excel. Next component of Presented model used NN trained Model of MATLAB which take designed standard training dataset to train in 7 rounds and the further used this trained NN to predict Environment feasibility of dataset which are taking Real time environment reading by EEMS. We implemented proposed wound monitoring solution in three different environments i.e., home, park and industrial area to check working of proposed EEMS and NN model, results showing that proposed solution predict environmental feasibility for wound at home with 99% accuracy, in parks and industrial area with 96% accuracy rate. We also provided wound monitoring solution to users of different age to verify patient’s quality of experience with proposed solution, results showed that mostly patients of different ages found solution feasible to use. There are many future perspectives of research which could considered for enhancements in proposed healthcare approach.
  • Proposed approach could implement with other machine leaning techniques in future e.g., KNN, Decision Tress, Fuzzy system etc.;
  • In future, current wound monitoring system could reproduce by adding sensors for detection of wound interior microenvironment;
  • Proposed approach could enhance to cover larger patients range by adding patient profile in wound care solution to consider effect of other health concern in wound healing.

Author Contributions

Conceptualization, H.S. and I.S.B.; methodology, I.B and R.U.-A.; software, U.F.; validation, B.K. and R.K.; investigation, H.S.; writing—original draft preparation, H.S., I.S.B.; writing—review and editing, R.U.-A., R.K., W.A.; visualization, R.K.; supervision, I.S.B.

Funding

This research received no external funding.

Acknowledgments

We are thankful to the Hassan at Civil Hospital, Bahawalpur for providing in technical details and helping in testing of the work.

Conflicts of Interest

The authors declare no conflict of interest.

References

  1. Singer, A.J.; Clark, R.A. Cutaneous wound healing. N. Engl. J. Med. 1999, 341, 738–746. [Google Scholar] [CrossRef] [PubMed]
  2. Kruse, C.R.; Nuutila, K.; Lee, C.C.; Kiwanuka, E.; Singh, M.; Caterson, E.J.; Eriksson, E.; Sørensen, J.A. The external microenvironment of healing skin wounds. Wound Repair Regen. 2015, 23, 456–464. [Google Scholar] [CrossRef] [PubMed]
  3. Junker, J.P.; Caterson, E.J.; Eriksson, E. The microenvironment of wound healing. J. Craniofac. Surg. 2013, 24, 12–16. [Google Scholar] [CrossRef] [PubMed]
  4. Harding, K.G.; Morris, H.L.; Patel, G.K. Healing chronic wounds. BMJ 2002, 324, 160–163. [Google Scholar] [CrossRef]
  5. Natarajan, S.; Williamson, D.; Stiltz, A.J.; Harding, K. Advances in wound care and healing technology. Am. J. Clin. Dermatol. 2000, 1, 269–275. [Google Scholar] [CrossRef] [PubMed]
  6. Okan, D.; Woo, K.; Ayello, E.A.; Sibbald, G. The role of moisture balance in wound healing. Adv. Skin Wound Care 2007, 20, 39–53. [Google Scholar] [CrossRef]
  7. Vermeulen, H.; Ubbink, D.; Schreuder, S.; Lubbers, M. Dressings in Surgical Patients with Open Wounds. Wounds 2006, 18, 286–293. [Google Scholar]
  8. Kimmel, H.M.; Grant, A.; Ditata, J. The Presence of Oxygen in Wound Healing. Wounds Compend. Clin. Res. Pract. 2016, 28, 264–270. [Google Scholar]
  9. Dargaville, T.R.; Farrugia, B.L.; Broadbent, J.A.; Pace, S.; Upton, Z.; Voelcker, N.H. Sensors and imaging for wound healing: A review. Biosens. Bioelectron. 2013, 41, 30–42. [Google Scholar] [CrossRef] [Green Version]
  10. Lassig, A.A.D.; Bechtold, J.E.; Lindgren, B.R.; Pisansky, A.; Itabiyi, A.; Yueh, B.; Joseph, A.M. Tobacco exposure and wound healing in head and neck surgical wounds. Laryngoscope 2018, 128, 618–625. [Google Scholar] [CrossRef]
  11. McColl, D.; Cartlidge, B.; Connolly, P. Real-time monitoring of moisture levels in wound dressings in vitro: An experimental study. Int. J. Surg. 2007, 5, 316–322. [Google Scholar] [CrossRef] [PubMed] [Green Version]
  12. Byun, H.G.; Persaud, K.C.; Pisanelli, A.M. Wound-State Monitoring for Burn Patients Using E-Nose/SPME System. ETRI J. 2010, 32, 440–446. [Google Scholar] [CrossRef] [Green Version]
  13. Benharref, A.; Serhani, M.A. Novel cloud and SOA-based framework for E-Health monitoring using wireless biosensors. IEEE J. Biomed. Health Inform. 2014, 18, 46–55. [Google Scholar] [CrossRef] [PubMed]
  14. Kumar, M.A.; Sekhar, Y.R. Android based health care monitoring system. In Proceedings of the 2015 International Conference on Innovations in Information, Embedded and Communication Systems (ICIIECS), Coimbatore, India, 19–20 March 2015; pp. 1–5. [Google Scholar]
  15. Occhiuzzi, C.; Ajovalasit, A.; Sabatino, M.A.; Dispenza, C.; Marrocco, G. RFID epidermal sensor including hydrogel membranes for wound monitoring and healing. In Proceedings of the 2015 IEEE International Conference on RFID (RFID), San Diego, CA, USA, 15–17 April 2015; pp. 182–188. [Google Scholar]
  16. Rahimi, R.; Ochoa, M.; Parupudi, T.; Zhao, X.; Yazdi, I.K.; Dokmeci, M.R.; Tamayol, A.; Khademhosseini, A.; Ziaie, B. A low-cost flexible pH sensor array for wound assessment. Sens. Actuators B Chem. 2016, 229, 609–617. [Google Scholar] [CrossRef] [Green Version]
  17. RoyChoudhury, S.; Umasankar, Y.; Jaller, J.; Herskovitz, I.; Mervis, J.; Darwin, E.; Hirt, P.A.; Borda, L.J.; Lev-Tov, H.A.; Kirsner, R.; et al. Continuous Monitoring of Wound Healing Using a Wearable Enzymatic Uric Acid Biosensor. J. Electrochem. Soc. 2018, 165, B3168–B3175. [Google Scholar] [CrossRef]
  18. Shen, S.; Han, S.X.; Aberle, D.R.; Bui, A.A.; Hsu, W. An Interpretable Deep Hierarchical Semantic Convolutional Neural Network for Lung Nodule Malignancy Classification. Expert Syst. Appl. 2019, 128, 84–95. [Google Scholar] [CrossRef] [PubMed]
  19. Symeonakis, E.; Pappas, I. Modelling Land Cover Change in a Mediterranean Environment Using a Multi-Layer Neural Network Model and Markov Chain Analysis. In Proceedings of the 2016 IEEE International Geoscience and Remote Sensing Symposium (IGARSS), Beijing, China, 15 April 2016; pp. 5464–5466. [Google Scholar]
  20. Kaur, H.; Wasan, S.K. Empirical study on applications of data mining techniques in healthcare. J. Comput. Sci. 2006, 2, 194–200. [Google Scholar] [CrossRef]
  21. Saaty, T.L. The Brain: Unraveling the Mystery of How It Works: The Neural Network Process; Rws Publications: Pittsburgh, PA, USA, 2019. [Google Scholar]
  22. Miikkulainen, R.; Liang, J.; Meyerson, E.; Rawal, A.; Fink, D.; Francon, O.; Hodjat, B. Evolving deep neural networks. In Artificial Intelligence in the Age of Neural Networks and Brain Computing; Academic Press: Cambridge, MA, USA, 2019; pp. 293–312. [Google Scholar]
  23. San, O.; Maulik, R. Neural network closures for nonlinear model order reduction. Adv. Comput. Math. 2018, 44, 1717–1750. [Google Scholar] [CrossRef] [Green Version]
  24. Montavon, G.; Samek, W.; Müller, K.R. Methods for interpreting and understanding deep neural networks. Digit. Signal Process. 2018, 73, 1–15. [Google Scholar] [CrossRef]
  25. Ertuğrul, Ö.F. A novel type of activation function in artificial neural networks: Trained activation function. Neural Netw. 2018, 99, 148–157. [Google Scholar] [CrossRef]
  26. Lau, M.M.; Lim, K.H. Review of Adaptive Activation Function in Deep Neural Network. In Proceedings of the 2018 IEEE-EMBS Conference on Biomedical Engineering and Sciences (IECBES), Sarawak, Malaysia, 3–6 December 2018; pp. 686–690. [Google Scholar]
  27. Tarefder, R.A. Laboratory and Model Prediction of Rutting in Asphalt Concrete. Ph.D. Thesis, The University of Oklahoma, Norman, OK, USA, 2003. [Google Scholar]
  28. Sheela, K.G.; Deepa, S.N. Review on methods to fix number of hidden neurons in neural networks. Math. Probl. Eng. 2013, 2013, 425740. [Google Scholar] [CrossRef]
  29. Leung, M.; Chan, A.H. Control and management of hospital indoor air quality. Med. Sci. Monit. 2006, 12, SR17–SR23. [Google Scholar] [PubMed]
  30. Hertz, J.A. Introduction to the Theory of Neural Computation; CRC Press: Boca Raton, FL, USA, 2018. [Google Scholar]
  31. Mahdavinejad, M.S.; Rezvan, M.; Barekatain, M.; Adibi, P.; Barnaghi, P.; Sheth, A.P. Machine learning for Internet of Things data analysis: A survey. Digit. Commun. Netw. 2018, 4, 161–175. [Google Scholar] [CrossRef]
  32. Khan, S.S.; Madden, M.G. A survey of recent trends in one class classification. In Lecture Notes in Computer Science, Proceedings of the Irish Conference on Artificial Intelligence and Cognitive Science, Dublin, Ireland, 19–21 August 2009; Springer: Berlin/Heidelberg, Germany, 2009; pp. 188–197. [Google Scholar]
  33. Tang, Y.; Zhang, Y.Q.; Chawla, N.V.; Krasser, S. SVMs modeling for highly imbalanced classification. IEEE Trans. Syst. Man Cybern. Part B (Cybern.) 2009, 39, 281–288. [Google Scholar] [CrossRef] [PubMed]
  34. Malik, M.S.; Bajwa, I.S.; Munawar, I.S. An Intelligent and Secure IoT based Smart Watering System using Fuzzy Logic and Blockchain. Computers Electr. Eng. 2019, 77, 109–119. [Google Scholar]
  35. Malik, M.S.; Bajwa, I.S.; Naeem, M.A.; Ramzan, B. Design and Implementation of an IoT System for Smart Energy Consumption and Smart Irrigation of Tunnel Farming. Energies 2018, 11, 3427. [Google Scholar]
  36. Sarwar, B.; Bajwa, I.S.; Ramzan, S.; Ramzan, S.; Kauser, M. Design and Application of Fuzzy Logic Based Fire Monitoring and Warning Systems for Smart Buildings. Symmetry 2018, 10, 615. [Google Scholar] [CrossRef]
  37. Notley, S.; Magdon-Ismail, M. Examining the use of neural networks for feature extraction: A comparative analysis using deep learning, support vector machines, and k-nearest neighbor classifiers. arXiv 2018, arXiv:1805.02294. [Google Scholar]
Figure 1. Exterior Environment Role in Wound Healing.
Applsci 09 04172 g001
Figure 2. Architecture of Wound Care Solution.
Applsci 09 04172 g002
Figure 3. Hardware components integration design of smart wound monitoring system.
Applsci 09 04172 g003
Figure 4. Proposed feed forward NN model.
Applsci 09 04172 g004
Figure 5. Arduino UNO Microcontroller.
Applsci 09 04172 g005
Figure 6. DHT22 Humidity and Temperature Sensor.
Applsci 09 04172 g006
Figure 7. MQ2 Gas Sensor.
Applsci 09 04172 g007
Figure 8. PMS5003 Dust Sensor.
Applsci 09 04172 g008
Figure 9. NN Implementation Flowchart.
Applsci 09 04172 g009
Figure 10. Used Training Dataset.
Applsci 09 04172 g010
Figure 11. Training Dataset Variable in MATLAB.
Applsci 09 04172 g011
Figure 12. Preparing Neural Network Model.
Applsci 09 04172 g012
Figure 13. Designed Neural Network Model.
Applsci 09 04172 g013
Figure 14. NN Training.
Applsci 09 04172 g014
Figure 15. NN Prediction Results.
Applsci 09 04172 g015
Figure 16. Stimulation Model.
Applsci 09 04172 g016
Figure 17. Stimulation Results, (a) case 1 and 2, (b) case 3.
Applsci 09 04172 g017
Figure 18. MSE graph of Trained NN.
Applsci 09 04172 g018
Figure 19. Gradient graph of 1st training round NN.
Applsci 09 04172 g019
Figure 20. Training Round 2 and 6 MSE with performance values.
Applsci 09 04172 g020
Figure 21. NN prediction Evaluation Chart.
Applsci 09 04172 g021
Table 1. Features of Previously Presented Wound Care Techniques.
Work YearSensor/Technique UsePurpose
[11] 2007Sensors arrayMoisture level monitoring
[12] 2010Gas sensor arrayinfection detection of wound
[13] 2014Wireless biosensorsMonitoring application for healthcare
[14] 2015Web server and androidHealth monitoring
[15] 2015RFID (Radio Frequency ID) Epidermal SensorWound Monitoring and Healing
[16] 2016pH sensor arraypH level Detection for wound
[17] 2018Uric acid Biosensormonitor wound healing
[18] 2019convolutional neural networkLung Disease Identification
[19] 2019Multilayer Neural NetworkLand Environment monitoring
Table 2. Dataset Design.
LocationInstancesClass
Home→300180Continuous
120Impaired
Park→250120Continuous
130Impaired
Hospital→10070Impaired
30Continuous
Industry→15070Impaired
80Continuous
Table 3. Training Dataset Instances Description.
InstanceHumidityTemperatureAir QualityDust Level
Home 300Dry30Low32Lighter36Good123
Normal245Normal248Normal260Normal168
Wet25High20Alcohol04poor09
Park 250Dry90Low42Lighter39Good35
Normal120Normal88Normal163Normal68
Wet40High120Alcohol48poor147
Industrial Area 150Dry30Low19Lighter06Good05
Normal30Normal22Normal07Normal13
Wet90High109Alcohol137poor132
Hospital 100Dry21Low08Lighter11Good15
Normal44Normal88Normal74Normal68
Wet35High04Alcohol14poor17
Table 4. Test Cases.
Input FactorCase 1Case 2Case 3
Temperature7060162
Humidity2918109
Air Quality109105201
Dust Density0.620.992.62
Expected Output010
Simulation Output110
Table 5. Temperature Levels.
Temperature/°CClassWeather
16 °C–18 °C NormalWinter
<16 °C LowWinter
20 to 23.5 °C Normal Summer
>23.5 °C High Summer
Table 6. Humidity Levels.
Humidity (M3·M−3)Class
0–20% Dry
20–60%Normal
60–100%Wet
Table 7. Smoke Levels.
Air Quality ppmClass
100–150Normal
700Alcohol
750Lighter
Table 8. Air Pollutant Levels.
PM2.5 Particles ΜG/M3Class
0–8.9Very Good
9.0–25.9Moderate
26.0–39.9Fair
40.0–106.9Poor
Table 9. Calibration of Sensor Data for Neural Network Decision Making.
Sr. NoTemp/°CHumidity/%Air Quality/PPMDust Particles/Mg/M3NN/Decision
1LowDryAlcoholVery GoodImpaired
2LowWetNormalVery GoodContinuous
3NormalNormalNormalModerateContinuous
4NormalWetLighterPoorImpaired
5NormalWetNormalVery GoodContinuous
6HighWetLighterFairImpaired
7HighWetLighterPoorImpaired
8HighDryNormalVery GoodContinuous
9NormalNormalAlcoholModerateImpaired
10NormalWetLighterFairContinuous
Table 10. Three Test Data Design.
Test Data SetTotal ReadingsFavorable (Continuous)Unfavorable (Impaired)
Home80074951
Park1000678322
Industrial Area1200546654
Table 11. Performance Measure Results of Trained NN implementation.
Test Data SetTotal ReadingsTrue ClassTFFFTUFFUFPrecisionRecallAccuracy
Home8001 = 749
0 = 51
7490447100%99%99%
Park10001 = 678
0 = 322
67834288095%100%96%
Industrial Area12001 = 546
0 = 654
54643611092%100%96%
Table 12. Users Experience Level.
UsersComplexityTimeAccuracyPortable
Children80%82%85%98%
Adults90%89%92%97%
Old Age70%75%73%89%
Table 13. Advantages of Proposed Approach.
FeatureAdvantages
CostProposed approach provide low cost solution to patients as all used sensors are cheap and designed circuit is affordable for patients.
AvailabilityProposed approach provided solution which is always available for wound monitoring while medical experts not always available to monitor environmental factors.
LocationProposed solution is patient centric which increases patient wound monitoring trend and ultimately help to enhance wound healing rate.
Table 14. Limitations of Proposed Approach.
IssueLimitation
WeatherProposed approach considered weather conditions of normal zone, extreme weather conditions didn’t consider for analysis by proposed system.
Skin DiseasesProposed approach analyzes environment effect without considering skin special characteristics i.e., Skin disease
Classification ApproachProposed approach apply classification by NN, it didn’t compared working of other classifier.
Table 15. Comparison with Machine Learning Techniques.
Comparison FactorNeural NetworkMachine Learning Techniques
Data SizeAbility to handle large data setsSuitable to handle small data sets.
PerformanceShow improvement in performance with large training dataConsistent performance
ConfigurationNN didn’t have parameters so easy to configure input, layers and outputParameter adjustment required.
Computational powerNN consider more powerful as NN have ability to handle larger dataComputationally less powerful algorithms as compare to NN
Problem TypeCan handle non-linear problems Linear and non-linear
ErrorAs NN is non-parametric so it didn’t face error of parametric estimationError could occur in parametric estimation.
Learning typeBlack box, it cannot interpret relationship between input and outputHave capability to interpret input relationship with output.
Working FocusSuitable for output centric problems.Some may focus on input output relationship rather than just output.

