Article

The Effect of Voltage Dataset Selection on the Accuracy of Entropy-Based Capacity Estimation Methods for Lithium-Ion Batteries

1
Department of Energy Technology, Aalborg University, 9220 Aalborg, Denmark
2
School of Automation, Northwestern Polytechnical University, Xi’an 710072, China
*
Author to whom correspondence should be addressed.
Appl. Sci. 2019, 9(19), 4170; https://doi.org/10.3390/app9194170
Submission received: 4 September 2019 / Revised: 29 September 2019 / Accepted: 1 October 2019 / Published: 4 October 2019
(This article belongs to the Section Energy Science and Technology)

Abstract

:

Featured Application

High accuracy of the entropy-based capacity estimation will be achieved when the battery state of charge enters into the polarization zone and the approximate entropy or sample entropy is selected. The proposed dataset selection method can be used to improve the accuracy of the capacity estimation for batteries in electric vehicles and energy storage system applications.

Abstract

It is important to accurately estimate the capacity of the battery in order to extend the service life of the battery and ensure the reliable operation of the battery energy storage system. As entropy can quantify the regularity of a dataset, it can serve as a feature to estimate the capacity of batteries. In order to analyze the effect of voltage dataset selection on the accuracy of entropy-based estimation methods, six voltage datasets were collected, considering the current direction (i.e., charging or discharging) and the state of charge level. Furthermore, three kinds of entropies (approximate entropy, sample entropy, and multiscale entropy) were introduced, and the relationship between the entropies and the battery capacity was established by using first-order polynomial fitting. Finally, the interaction between the test conditions, entropy features, and estimation accuracy was analyzed. Moreover, the results can be used to select the correct voltage dataset and improve the estimation accuracy.

1. Introduction

Lithium-ion batteries have started to be considered for electric vehicles [1] and various energy storage applications such as grid support, grid integration of renewables, or micro-grids [2,3,4,5]. One of the biggest concerns in the aforementioned applications is their limited lifetime because their performance deteriorates with usage. A battery management system can efficiently treat the dynamics of the energy storage process in the battery and maintain the optimal operation of the batteries [6]. In order to improve the performance and prolong the battery’s life, accurate knowledge of the state of health (SOH) for battery management system is essential and SOH is often expressed as the ratio between the present capacity and the nominal capacity [7]. As batteries are complex electrochemical systems, the capacity loss is difficult to measure in time and the accurate estimation of the battery’s capacity is still an issue [7,8].
The most straightforward way to estimate the capacity is by measuring the charge transferred through the battery during either charging and/or discharging [9]. However, the long time needed to measure the battery current and the requirement of high-precision current sensors decrease the practicality of this method in real applications. Based on electrochemical models or electrical models, state observers such as the multi-scale extended Kalman filter [10] and multi-scale nonlinear predictive filter [11] have been designed for the joint estimation of battery state of charge (SOC) and capacity. Due to the complex internal principles and uncertain working conditions, it is difficult to establish a battery model that can exhibit the battery dynamic characteristics accurately. Data-driven methods do not need knowledge of the battery model, and only depend on the training data. Moreover, with the development of big data technology, real-time monitored parameters like voltage, current, and temperature will be stored and processed, which also decreases the requirements of the microcontroller, and improves the estimation accuracy and robustness. Various data driven methods have been used to predict the battery SOH such as support vector machine [8], relevance vector machine [12], neural network [13], Gaussian process regression [14], etc.
Since the information inside the features determines the effectiveness of the data driven estimator, the features should contain plentiful information about the battery degradation [15]. The incremental capacity peak and valley and their corresponding voltage values in the incremental capacity curve were used as features in [16]. Differential geometric analysis [17] and importance sampling [18] were used to extract features from the terminal voltage of the constant current charging test. In [19], the cycling data (voltage, temperature and time) were clustered into several groups, and the regression estimator was trained by support vector machine based on the classification results.
Entropy is also used as a feature for capacity estimation because it can capture the variation of voltage, current, and temperature during the battery aging process. Li et al. predicted the battery capacity by combining particle filter with the sample entropy (SE) feature of voltage in the full discharging process [20]. In their later work [21], the SE of the charging temperature, charging capacity, and rest time were considered simultaneously, and the relationship between multi-variable factors and discharge capacity was established. In [22], support vector machine and relevance vector machine were used to estimate the SOH based on the SE of the voltage in the full discharging process. Compared with the full charging or full discharging test, the hybrid pulse power characterization test is more efficient for the entropy-based estimator because it takes only a few seconds [23,24]. Polynomial fitting method [23] and sparse Bayesian predictive modeling [24] were proposed to establish the relationship between the SE and the capacity, respectively.
Although several entropy-based methods have been proposed for capacity estimation, the performance of these estimators have not been compared when different voltage datasets are used as input. Considering that the voltage response varies under different test conditions, the influence of voltage datasets needs to be evaluated. In this paper, the hybrid pulse power characterization profile was divided into two single pulses (i.e., one for charging and another for discharging) that were performed on a LiFePO4/C battery cell at three SOC levels. Therefore, six test conditions (TCs) considering the current direction and SOC were studied. Approximate entropy (AE), SE, and multiscale sample entropy (MSE) were chosen as features, and the relationship between them and the battery capacity was established based on a first-order polynomial fitting. The accuracy of these capacity estimation methods under different TCs was compared. The rest of this paper is organized as follows. Section 2 presents the experimental battery aging test and the particularities of the current pulse test applied to the battery. The theory of the AE, SE, and MSE algorithm is introduced in Section 3. Section 4 compares the accuracy of the capacity estimation considering the voltage datasets and the type of entropy. Finally, conclusions are drawn in Section 5.

2. Experimental Test

The parameters of the tested LiFePO4/C battery are listed in Table 1. Figure 1 shows the process of the whole tests. The battery was aged using a primary frequency regulation mission profile for a period of 38 weeks. After each week of aging, the capacity of the battery was measured. A set of current pulse tests under different TCs were performed to generate the voltage datasets. The detailed process of the experiment is presented in the following subsection. During the battery aging test and the performance check-up, the battery was placed in a climatic chamber with a temperature set point of 25 °C [25] and the sample period of one second was adopted.

2.1. Aging Test and Capacity Fade Curve Acquisition

A LiFePO4/C battery cell was aged with a mission profile from the energy storage system providing the primary frequency regulation service for the grid [25]. As seen in Figure 2, the mission profile had a length of one week, and the SOC varied from 10 to 90%. One full equivalent cycle (FEC) was defined as one fully charging plus one fully discharging. For the tested 2.5 Ah battery, 5 Ah went through the battery after each FEC. There was a total 4560 FEC during the overall aging process. In order to determine the capacity of the LiFePO4/C battery during its lifespan, the capacity test was performed following the one-week aging test. The capacity test consisted of a full charging process using a constant current (1C-rate)–constant voltage (3.6 V) method and a full discharging process with a 1C-rate current. The cut-off voltage for charging and discharging was 3.6 V and 2 V, respectively. The capacity obtained during the discharging test was considered as the capacity value. As shown in Figure 3, the capacity decreased from 2.57 Ah to 2.14 Ah, and the aging test was stopped because the battery reached its end-of-life when the capacity faded by 20% [26].

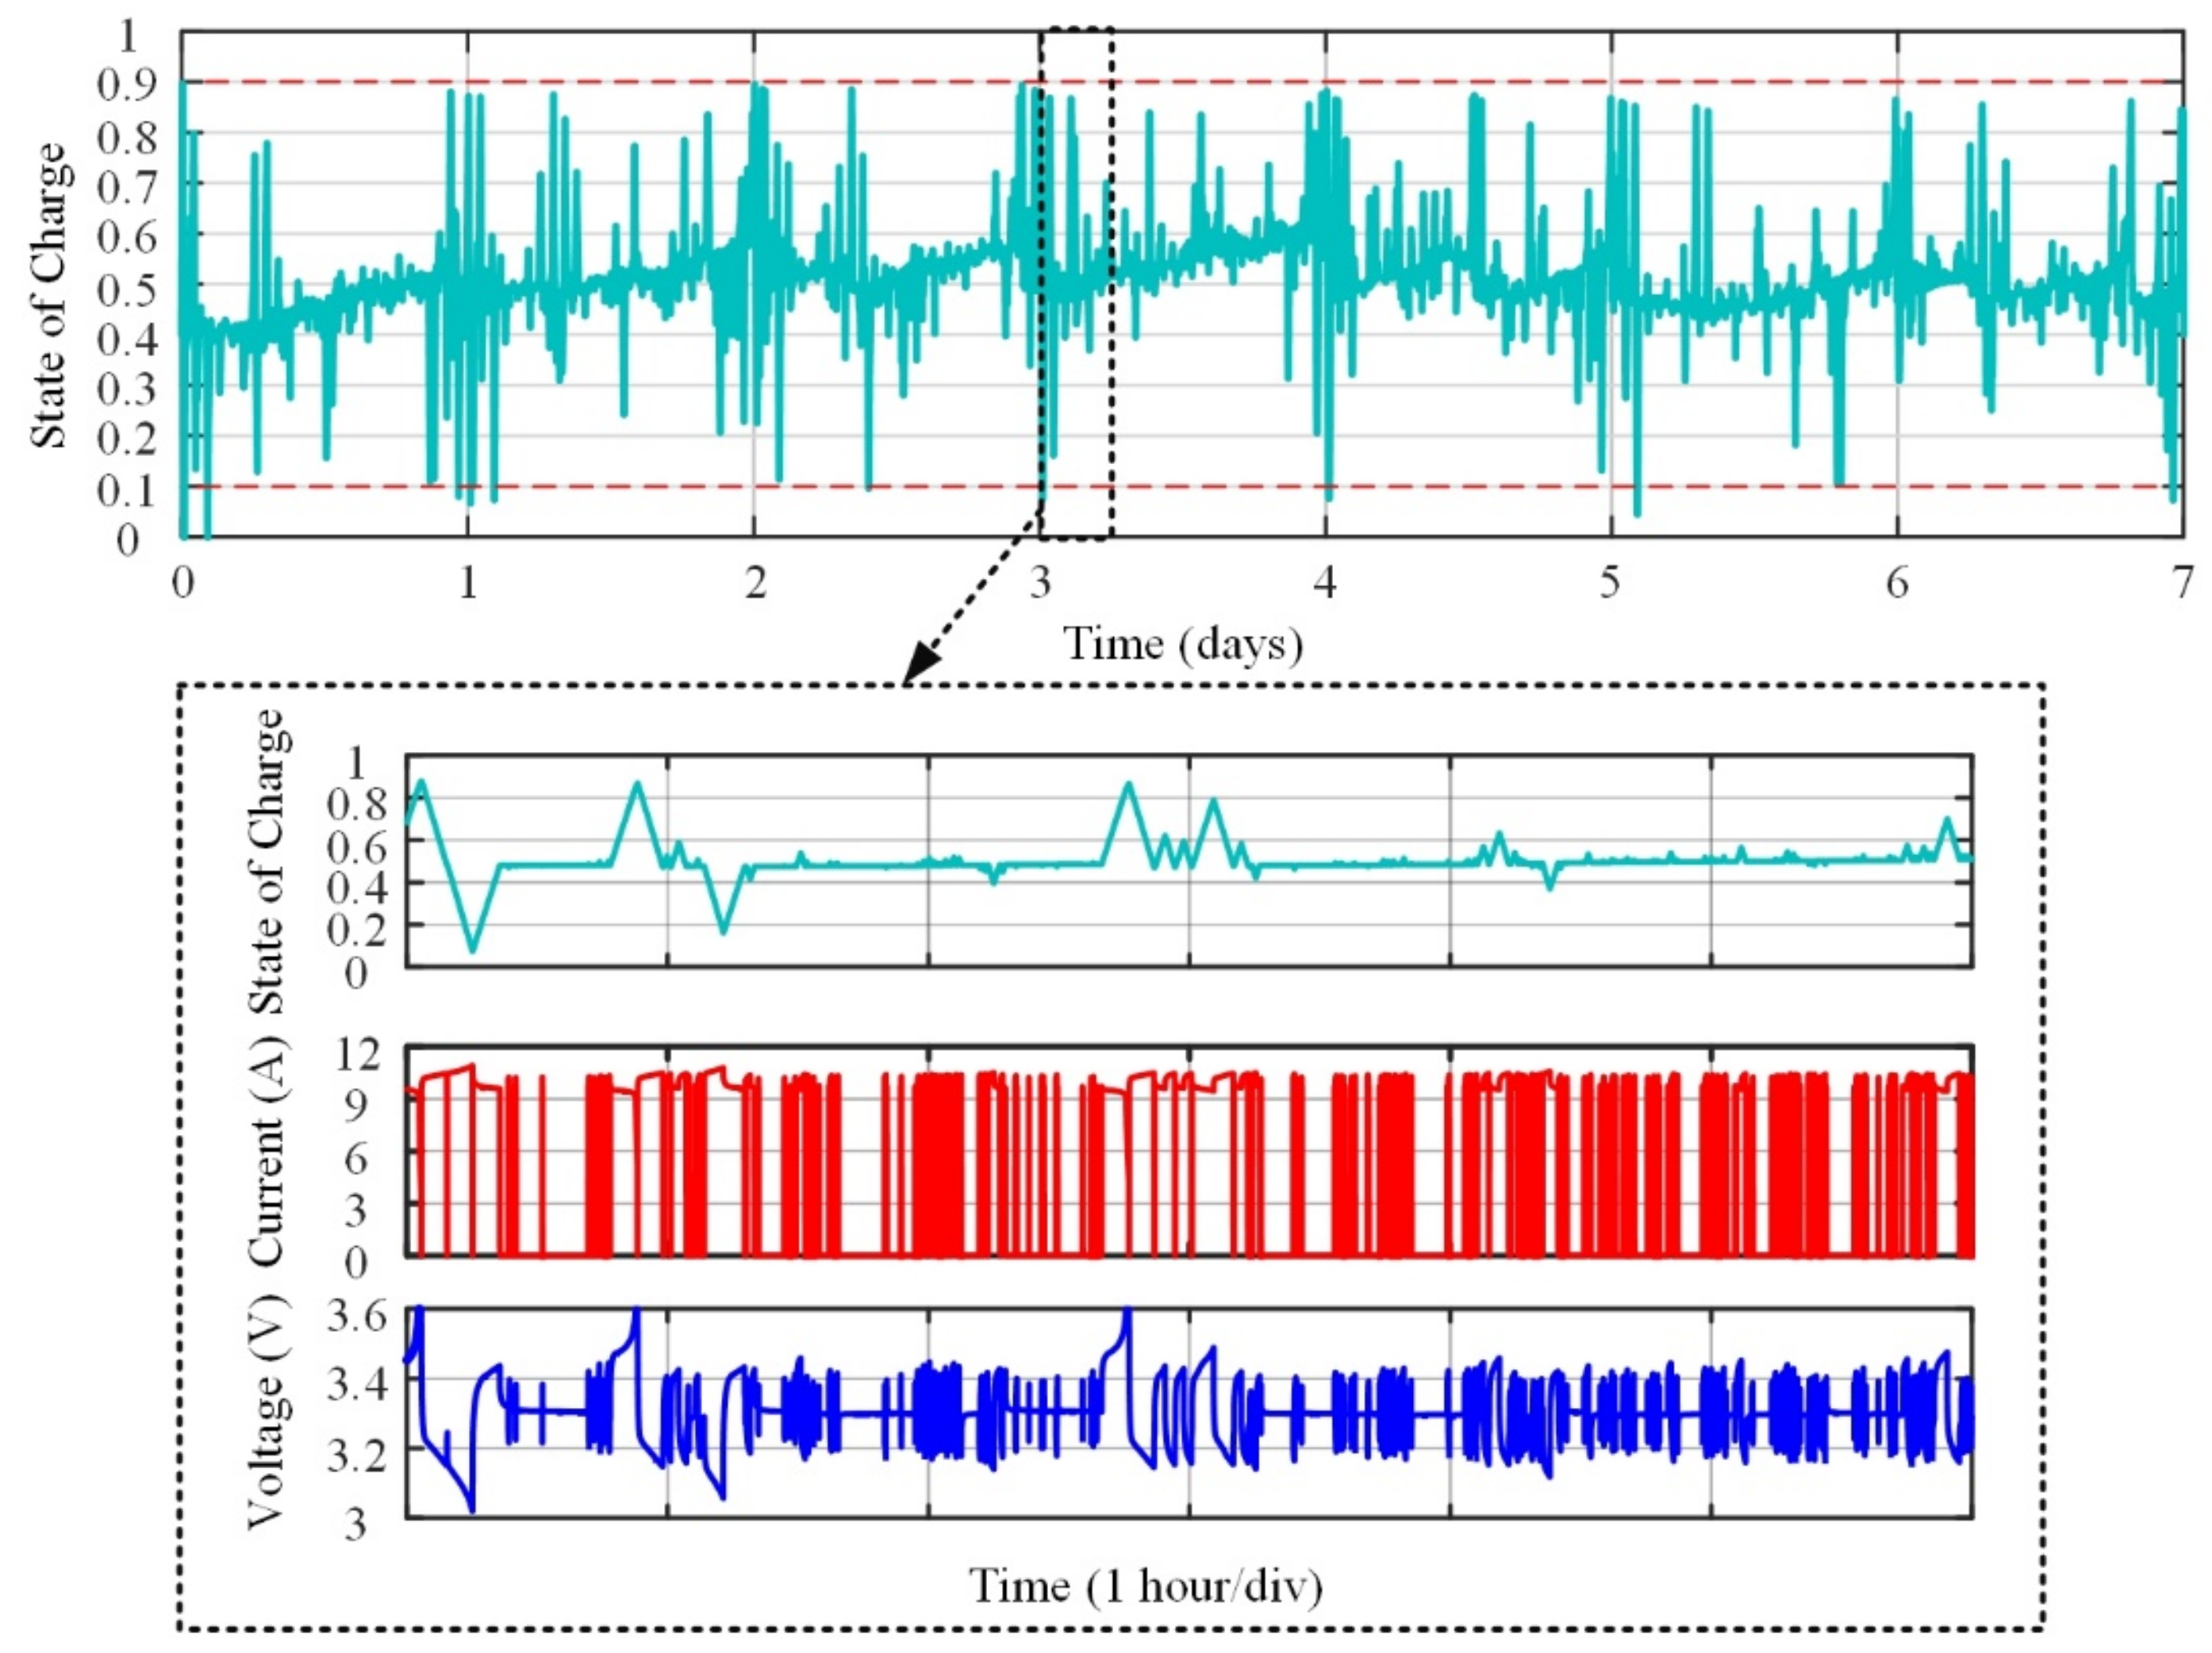
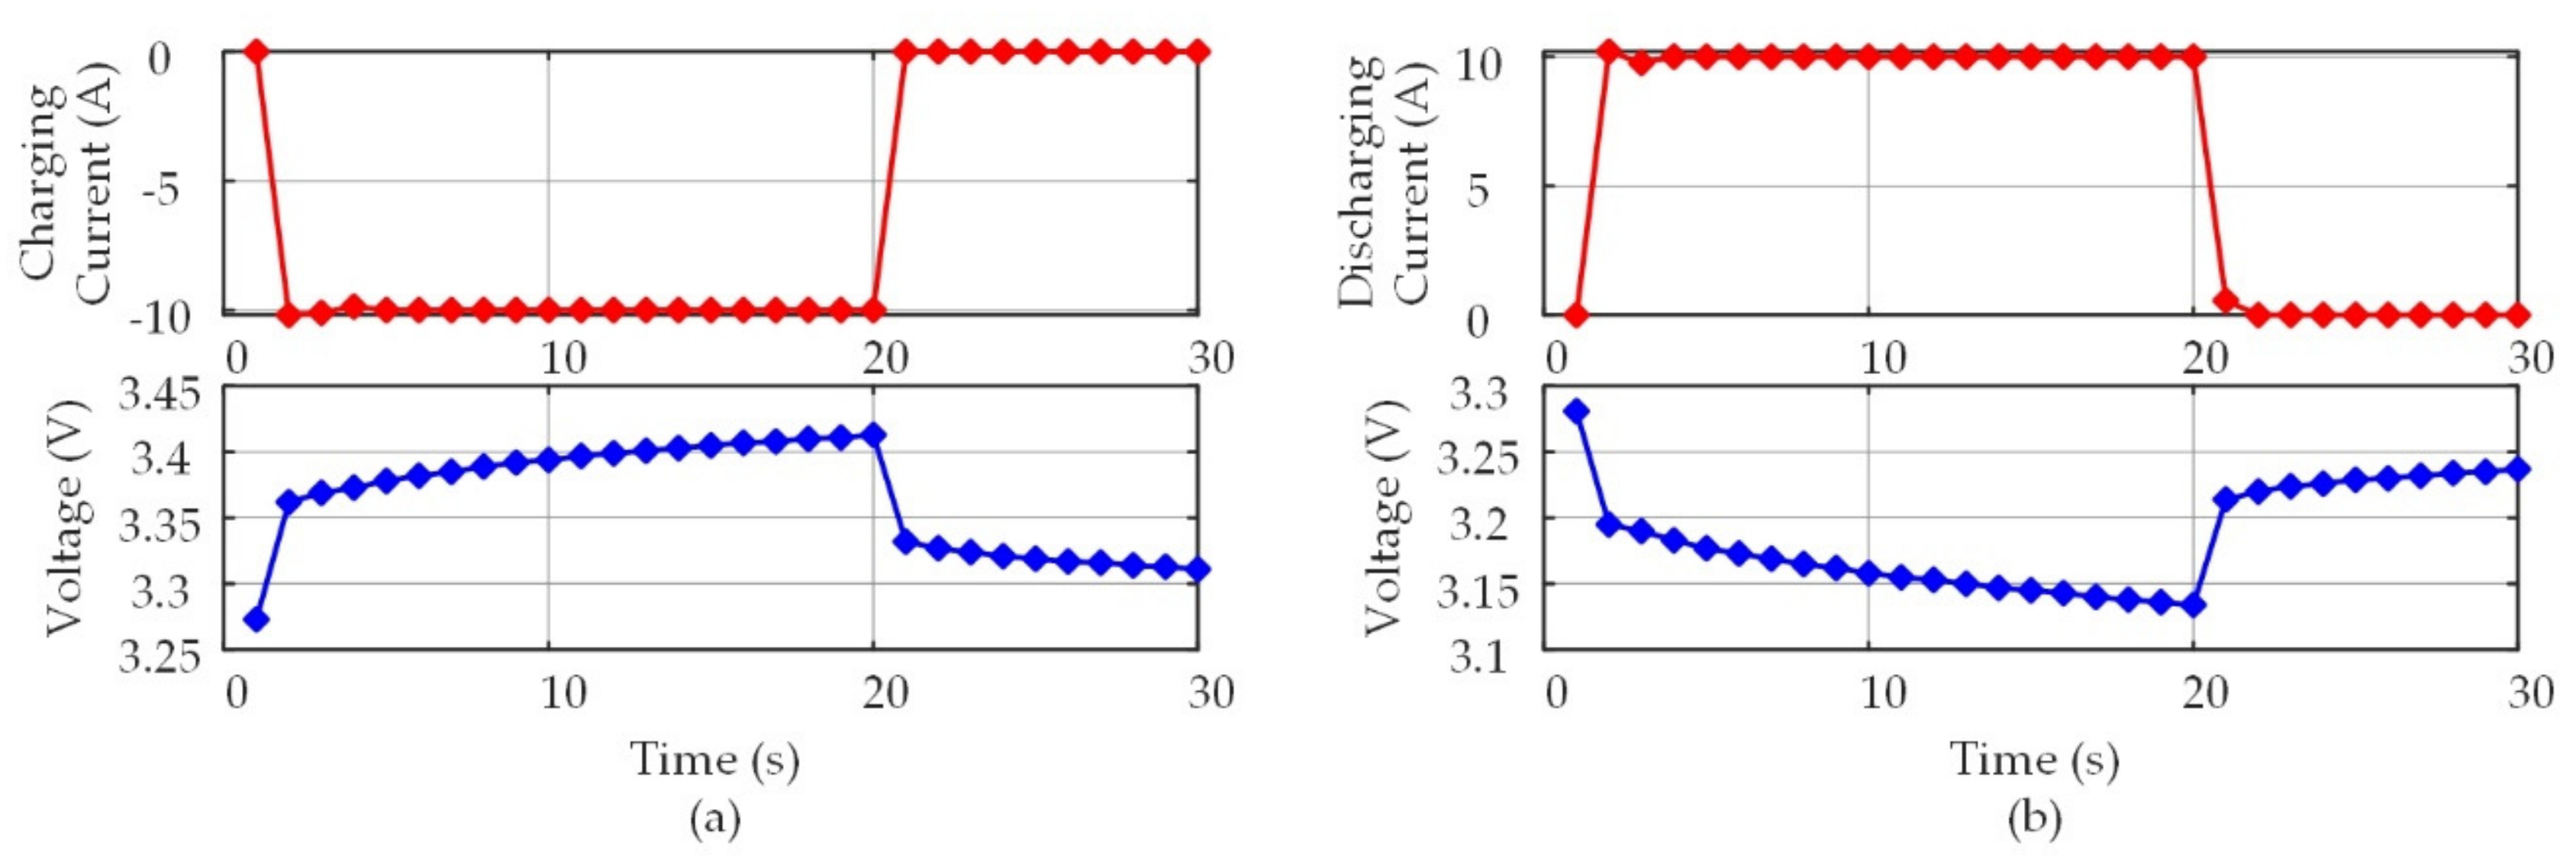
2.2. Current Pulse Test

Two impact factors (i.e., the SOC and the direction of pulse current) were considered in the current pulse test. Thus, a test matrix composed of six TCs was developed, as listed in Table 2. After each round of the capacity test, the LiFePO4/C battery was charged by the 1C-rate constant current until its SOC reached three pre-set SOC levels (i.e., 20% SOC, 50% SOC, and 80% SOC). At each SOC level, two single current pulses (a charging pulse and a discharging pulse) were performed on the battery cell. Both pulses were applied with a 4C-rate current (i.e., 10 A) and each of them lasted for 20 s. Between the pulses, a relaxation time of 15 min was considered in order to allow the cell to reach electrochemically stability. The current excitation and voltage response in the pulse test are shown in Figure 4. The voltage response was collected considering the 20 s of a single pulse and the first 10 s of relaxation.

3. The Theory of Entropy Algorithm

3.1. Approximate Entropy Algorithm

AE was proposed to measure the probability of generating a new pattern in a signal [27]. The AE can be expressed as AE(m, r, N), where N is a given total number of data; r (a positive real number) is the tolerance for accepting matrices; and m (a positive integer) is the dimension of vectors. The AE algorithm is summarized as follows:
Step 1: For a given series {v(1), v(2),…, v(N)}, the Nm + 1 vectors Vm(i) is formed as
V m ( i ) = v ( i ) ,   v ( i + 1 ) ,   , v ( i + m 1 ) ,     for   i = 1   to   N m + 1
Step 2: The distance between vector Vm(i) and Vm(j) is defined as the maximum absolute difference of their scalar elements:
d [ V m ( i ) , V m ( j ) ] = max v ( i + k ) v ( j + k ) ,   for   i , j = 1   to   N m + 1 ,   k = 0   to   m 1
Step 3: The conditional probability Cim(r) can be calculated as:
C i m ( r ) = 1 N m + 1 W m ( i ) ,   for   i = 1   to   N m + 1
where r is the given value and Wm is the number of d[Vm(i), Vm(j)] ≤ r.
Step 4: The expression of the probability of matching points is defined as:
Φ m ( r ) = 1 N m + 1 i = 1 N m + 1 log C i m ( r )
Step 5: Similarly, m is replaced with m + 1, and step 1 through step 4 are repeated, and the function Cim+1(r) and Φm+1(r) can be expressed as:
C i m + 1 ( r ) = 1 N m W m + 1 ( i ) ,   for   i = 1   to   N m
Φ m + 1 ( r ) = 1 N m i = 1 N m log C i m + 1 ( r )
where Wm+1 is the number of d[Vm+1(i), Vm+1(j)] ≤ r, and Φm(r) and Φm+1(r) are the probabilities that two sequences match for the m and m + 1 points, respectively.
Step 6: By fixing m and r, AE can be obtained
AE ( m , r , N ) = lim N Φ m ( r ) Φ m + 1 ( r )
As the length of the data is always limited, the AE is then estimated by the statistic
AE ( m , r , N ) = Φ m ( r ) Φ m + 1 ( r )

3.2. Sample Entropy Algorithm

SE is also a useful statistic for quantitatively analyzing the complexity and predictability degree of the time series [28]. It is the negative natural logarithm of the conditional probability (CP) and vectors are not compared to themselves. The first two steps of the SE algorithm are the same as the AE, and the remaining steps are summarized below. Bim(r) and Aim(r) are defined as:
B i m ( r ) = 1 N m 1 W m ( i ) ,   for   i = 1   to   N m
A i m ( r ) = 1 N m 1 W m + 1 ( i ) ,   for   i = 1   to   N m
The expression of the probability of matching points is defined as:
B m ( r ) = 1 N m i = 1 N m B i m ( r )
A m ( r ) = 1 N m i = 1 N m A i m ( r )
where Bm(r) and Am(r) are the probabilities that two sequences match for the m and m + 1 points, respectively. The expression of SE is given as
SE ( m , r , N ) = ln B m ( r ) A m ( r )
The flow chart of the AE and SE algorithm is shown in Figure 5.
Typically, the parameter m is suggested to be set at 2 or 3, and r is to be set between 0.1 and 0.25 times the standard deviation of the data [27]. As these suggestions do not always demonstrate the best results for all kinds of datasets, the AE and SE algorithm can be tested using a range of parameter combinations (m = 2 and 3, r ranging from 0.1–0.3 times the standard deviation of the data) [29]. Then, the parameter can be chosen based on the minimization of the maximum sample entropy relative error [30]. In the strategy for the optimal selection of r, the standard approximation is used and its expression is
σ g ( C P ) g ( C P ) σ C P
where g(CP) = −log(CP). Then,
σ g ( SE ) g ( S E ) σ C P = σ C P log ( C P ) C P
σ g ( C P ) g ( C P ) σ C P = σ C P C P
where σg(SE) and σg(CP) are the relative errors of the SE and CP estimates, respectively. The parameter r can be selected by minimizing the quantity
max σ C P log ( C P ) C P ,     σ C P C P

3.3. Multiscale Sample Entropy Algorithm

The idea of coarse graining is introduced to calculate the multiscale entropy and it can describe the degree of irregularity of a complex time series [31,32]. For a given time series {v(1), v(2), …, v(N)}, it is first divided into non-overlapping windows of length τ. Then, the average value of the data points inside each window is calculated. Thus, the consecutive coarse-grained time series {y(1), y(2), …, y(N/τ)} can be constructed according to Equation (18).
y ( j ) = 1 τ i = ( j 1 ) τ + 1 j τ v ( i ) ,   1 j N / τ
where τ is the scale factor. The diagram of the coarse-grained procedure is shown in Figure 6.

4. Comparison Results

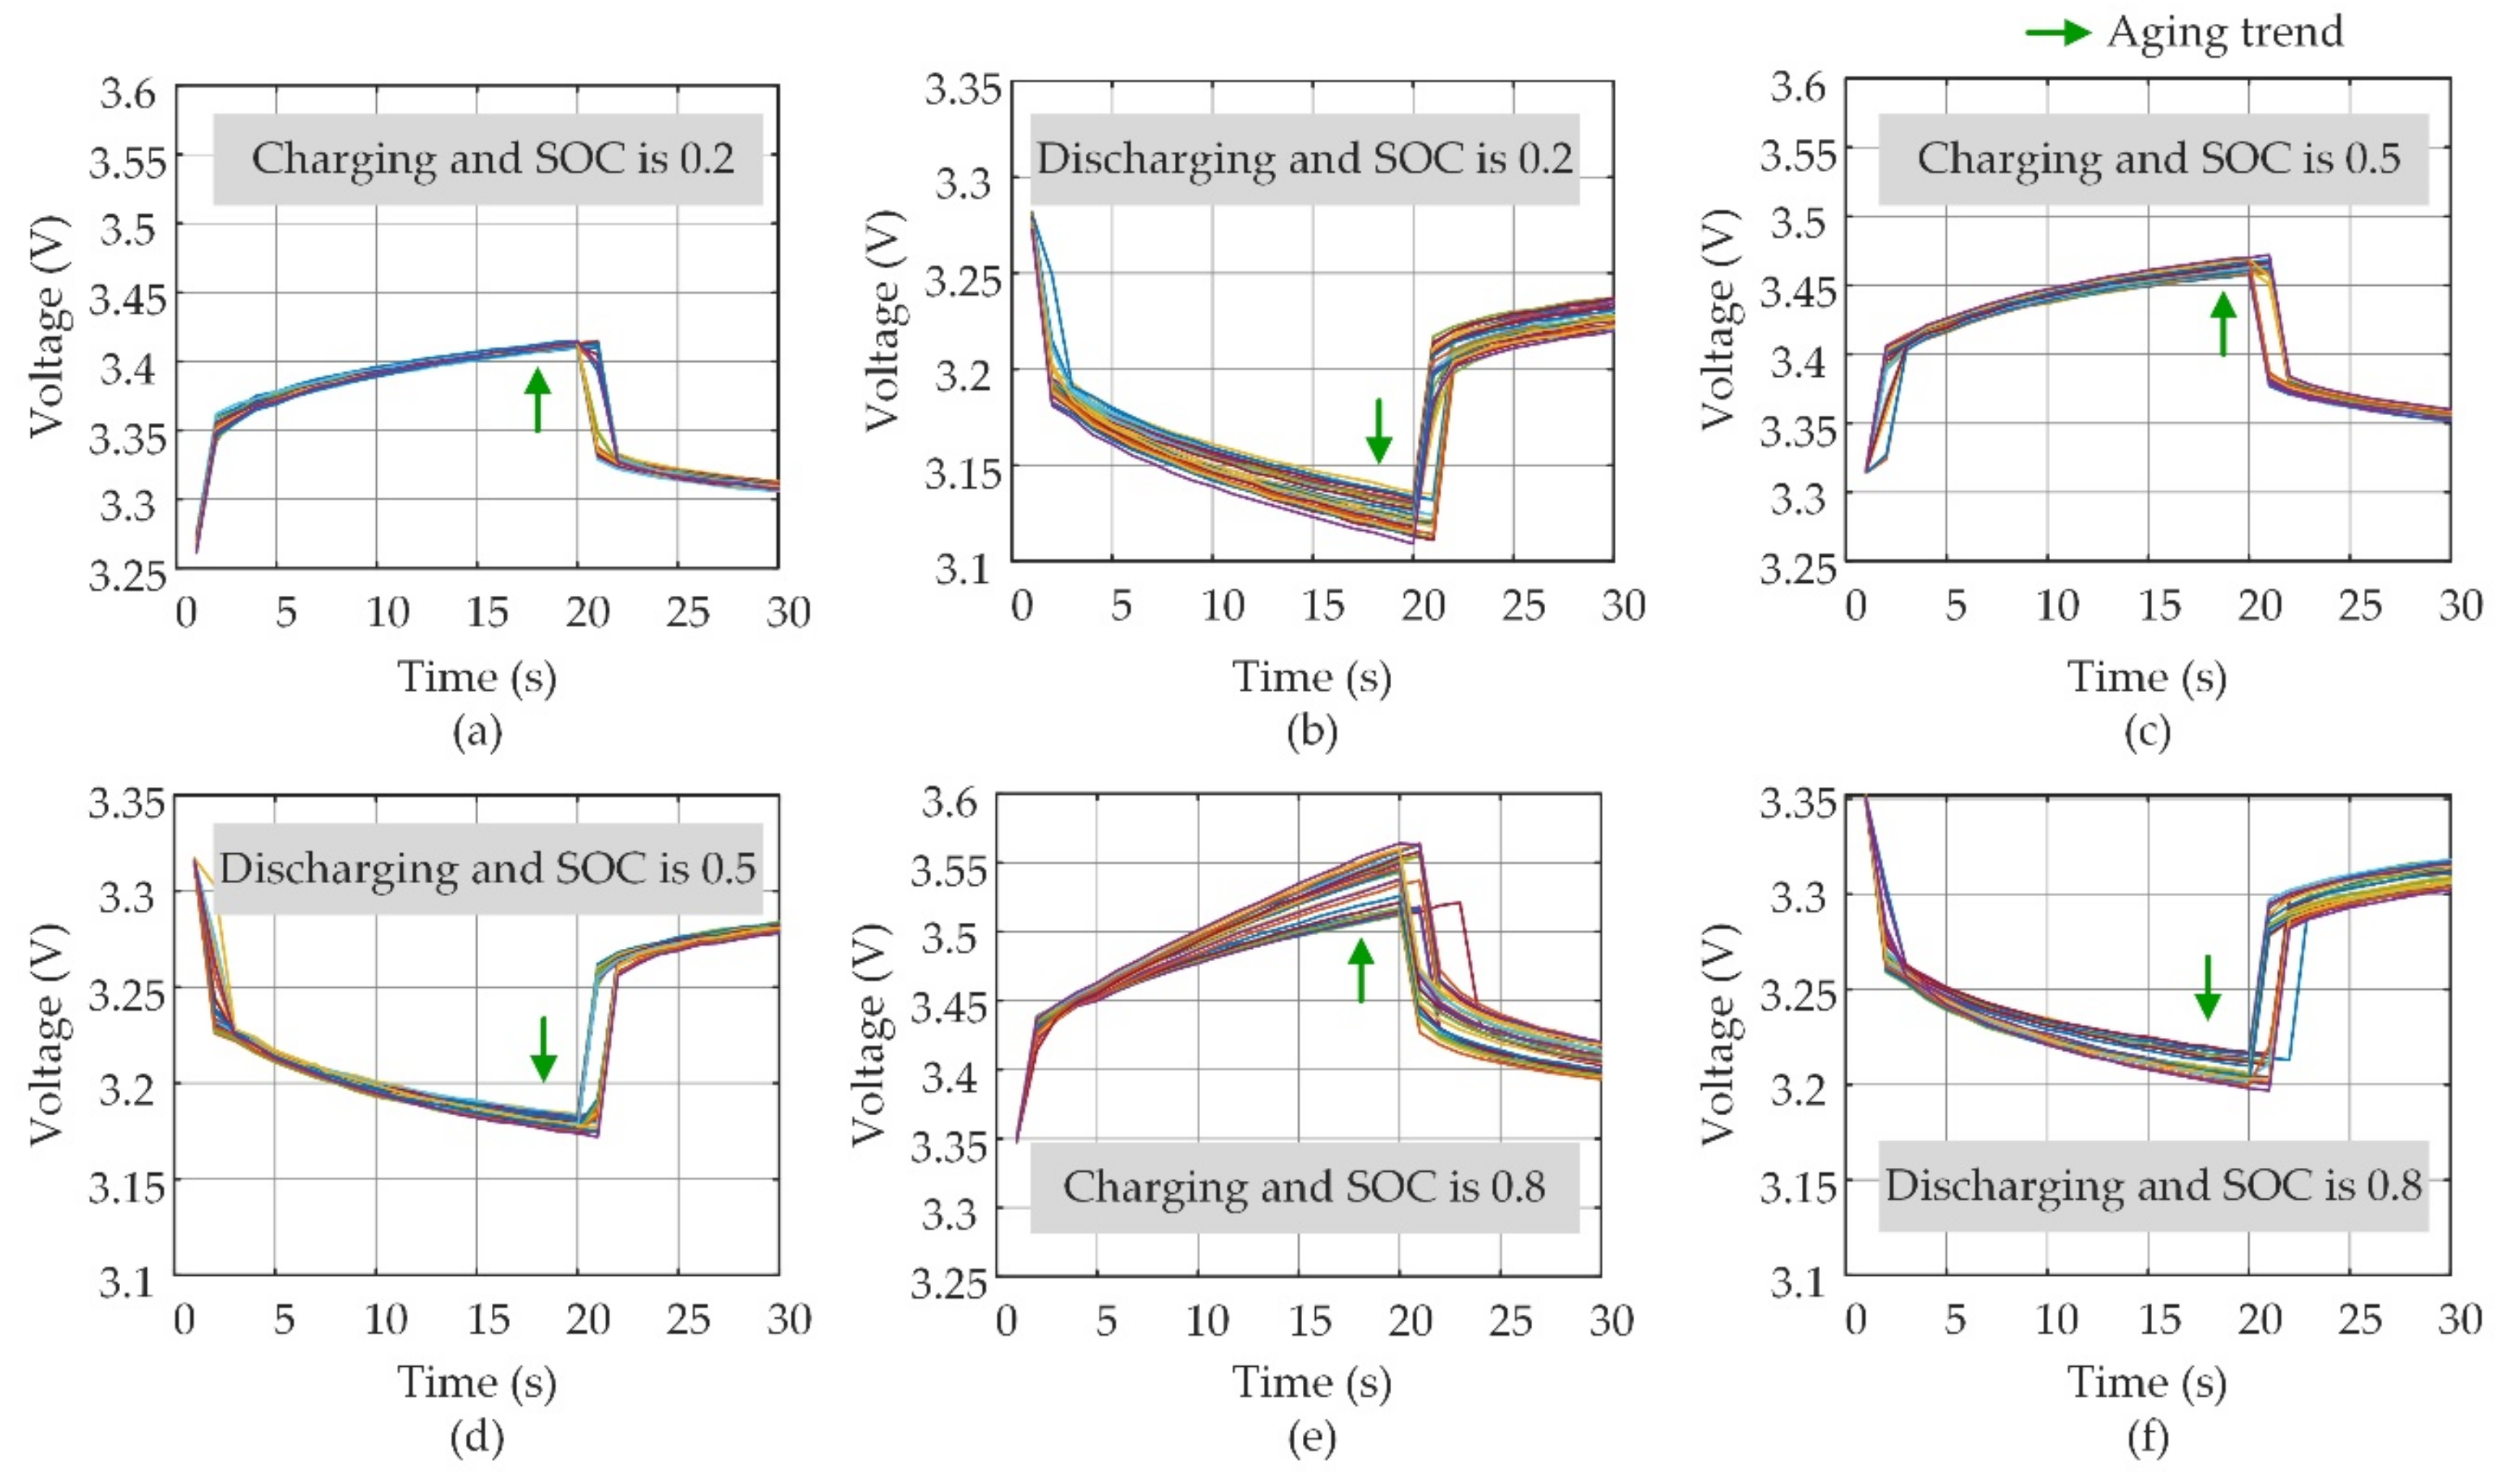
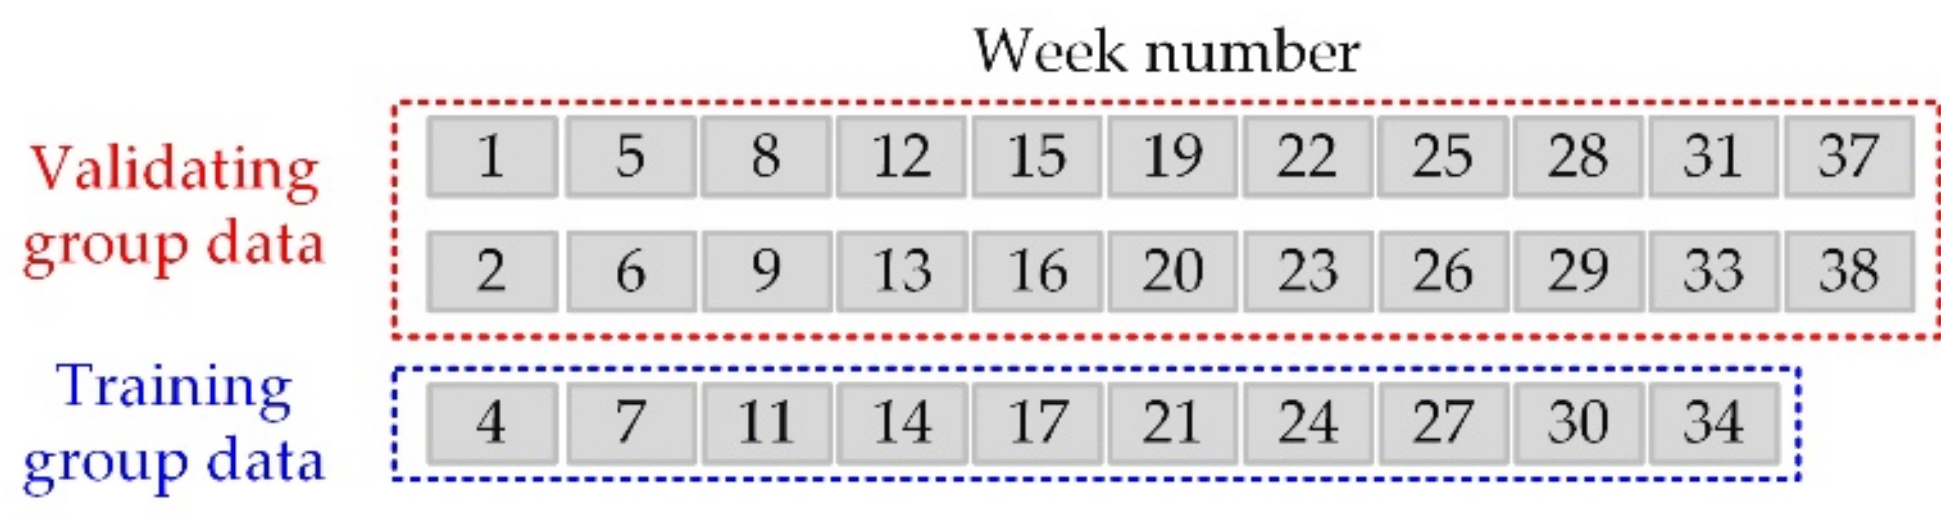
4.1. Datasets Analysis

The obtained six voltage datasets during the current pulse tests are shown in Figure 7, and each dataset contained 32 voltage time series. As the whole test lasted for 38 weeks and some voltage profile were lost during the experiment, six voltage series were excluded. Figure 8 shows the terminal voltage curve and its slope under the 1C-rate constant current full charging test. The slope of voltage is expressed as
V s l o p e i = V ( j + i ) - V ( j )   t ( j + i ) - t ( j ) ,   i = 1 ,   10 ,   20
here Vslope1, Vslope10, and Vslope20 is the slope for the 1 s, 10 s, and 20 s intervals, respectively. The trend of the slope curve shows that the polarization of the battery cell is serious at the depleted state (polarization zone) and the variation of battery voltage in mid-SOC range is flat (flat zone) [33]. This is why the voltage datasets under TC2, TC5, and TC6 varied more rapidly than that under other TCs.

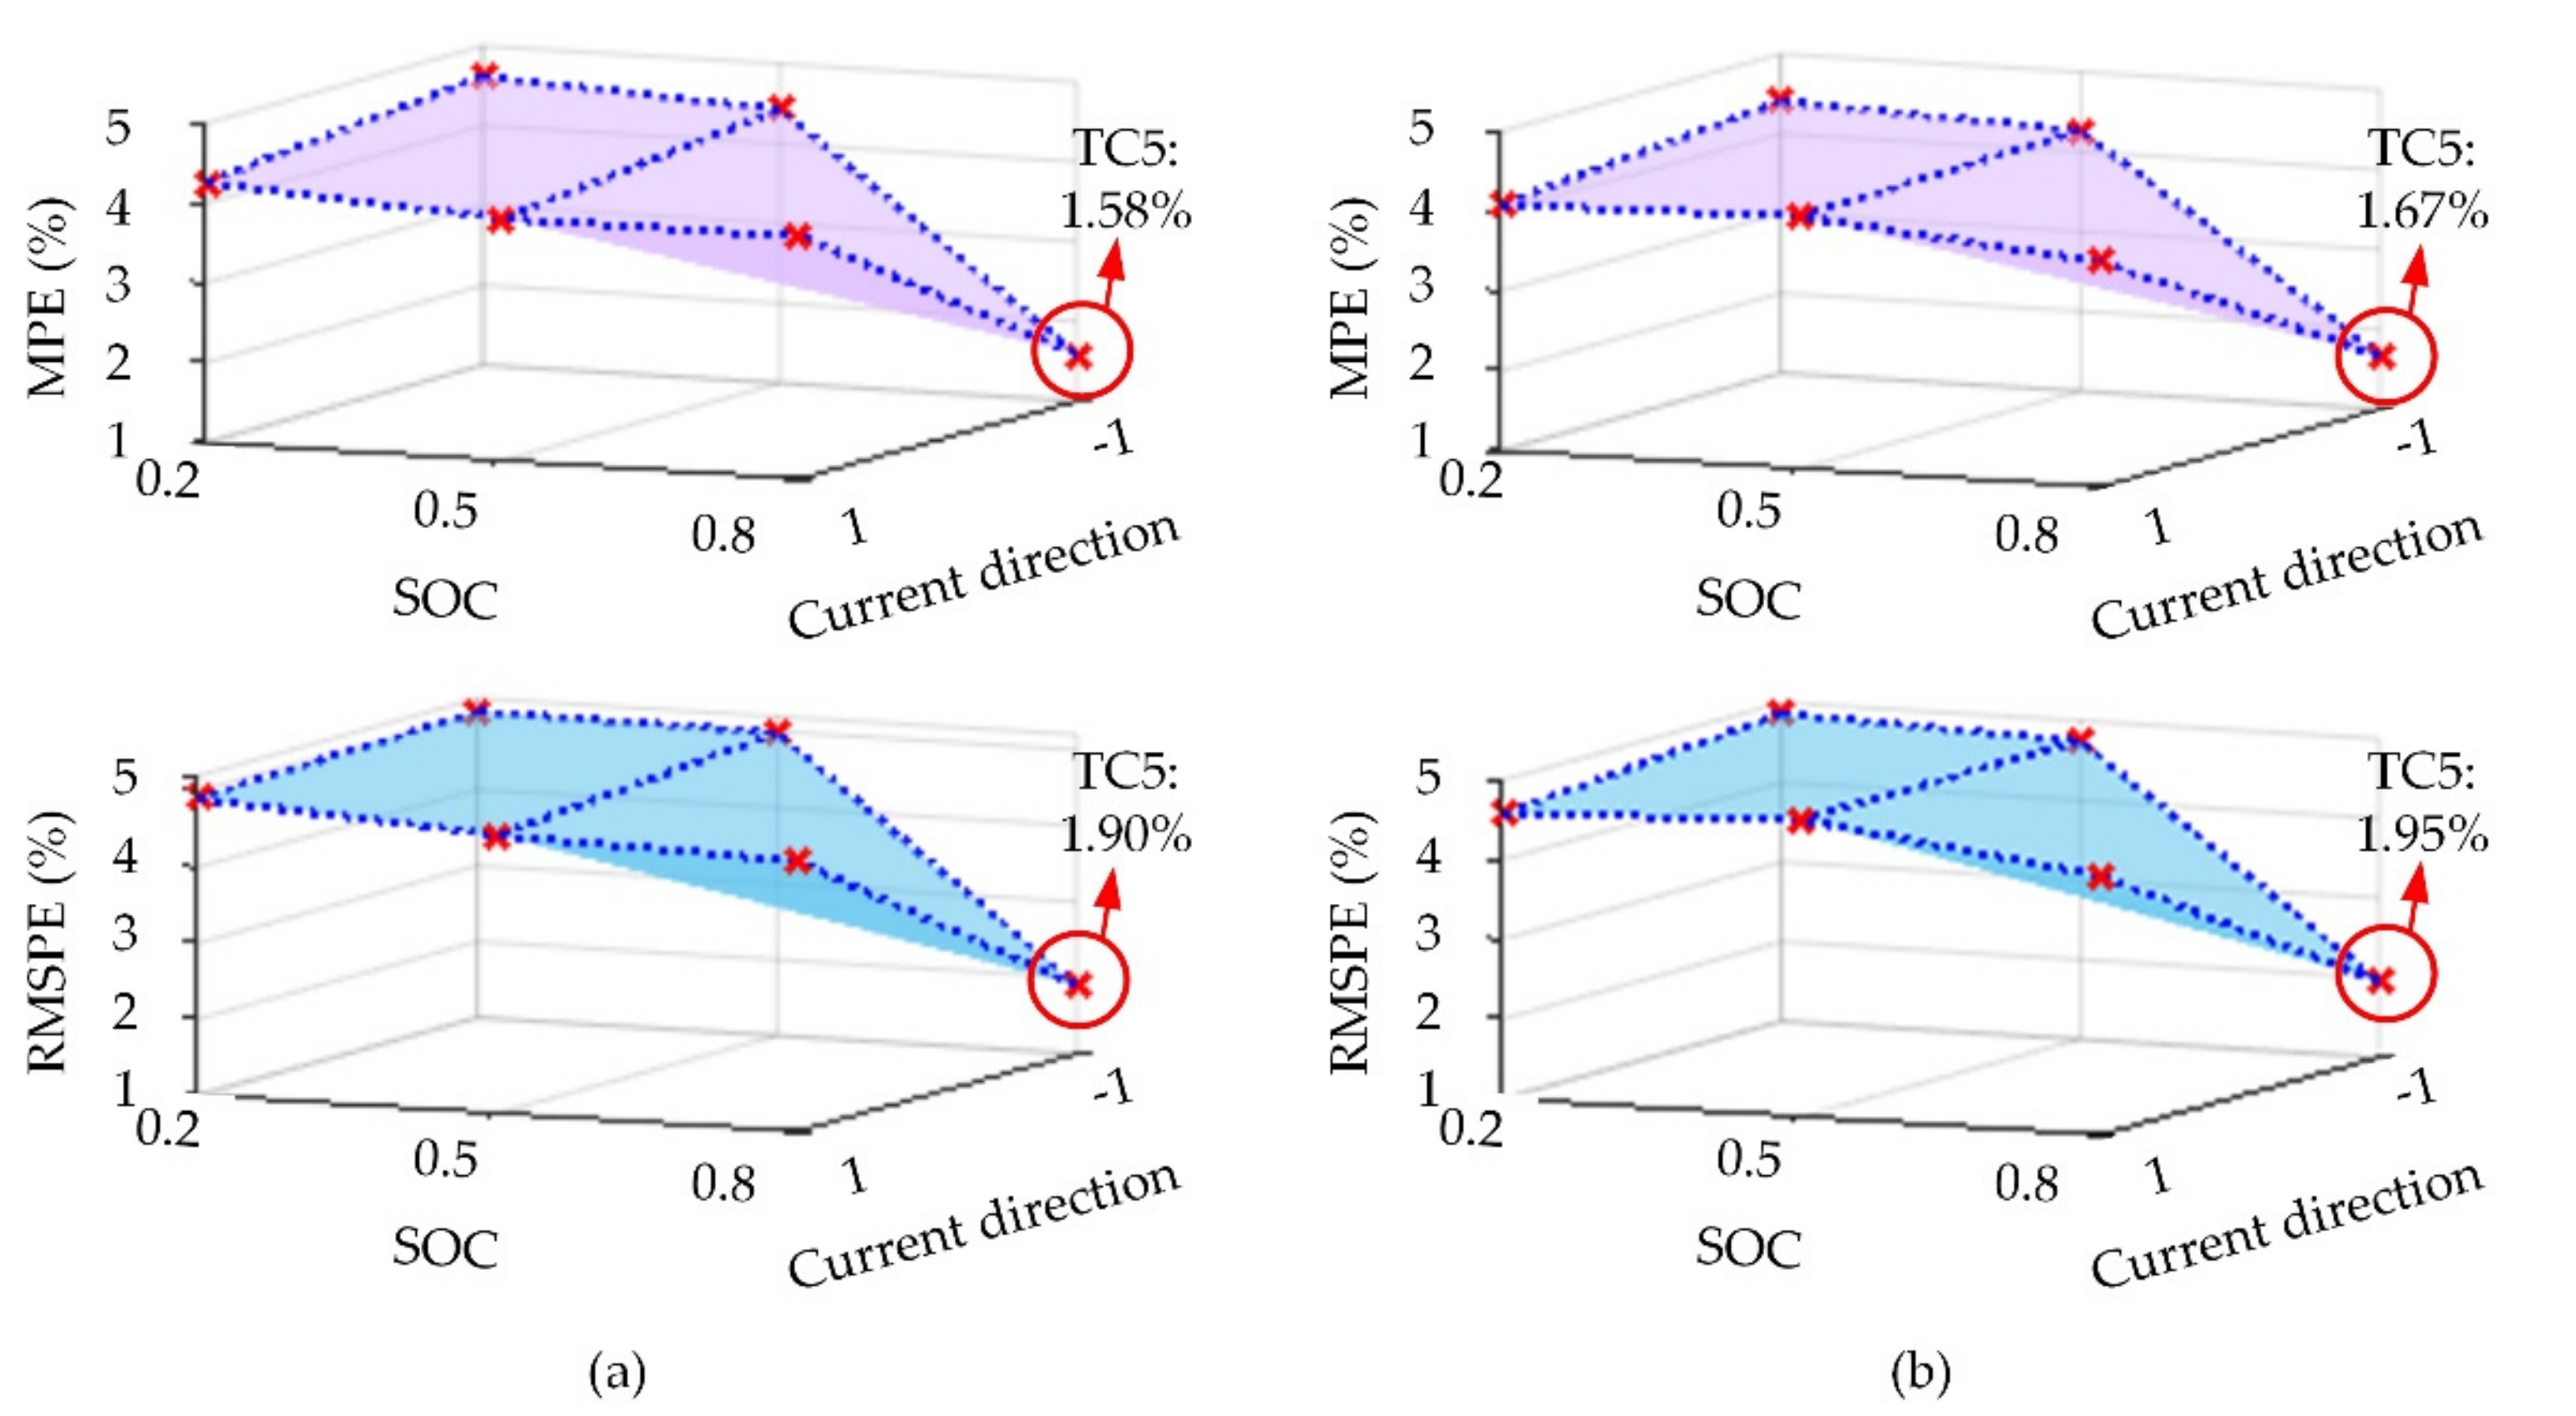
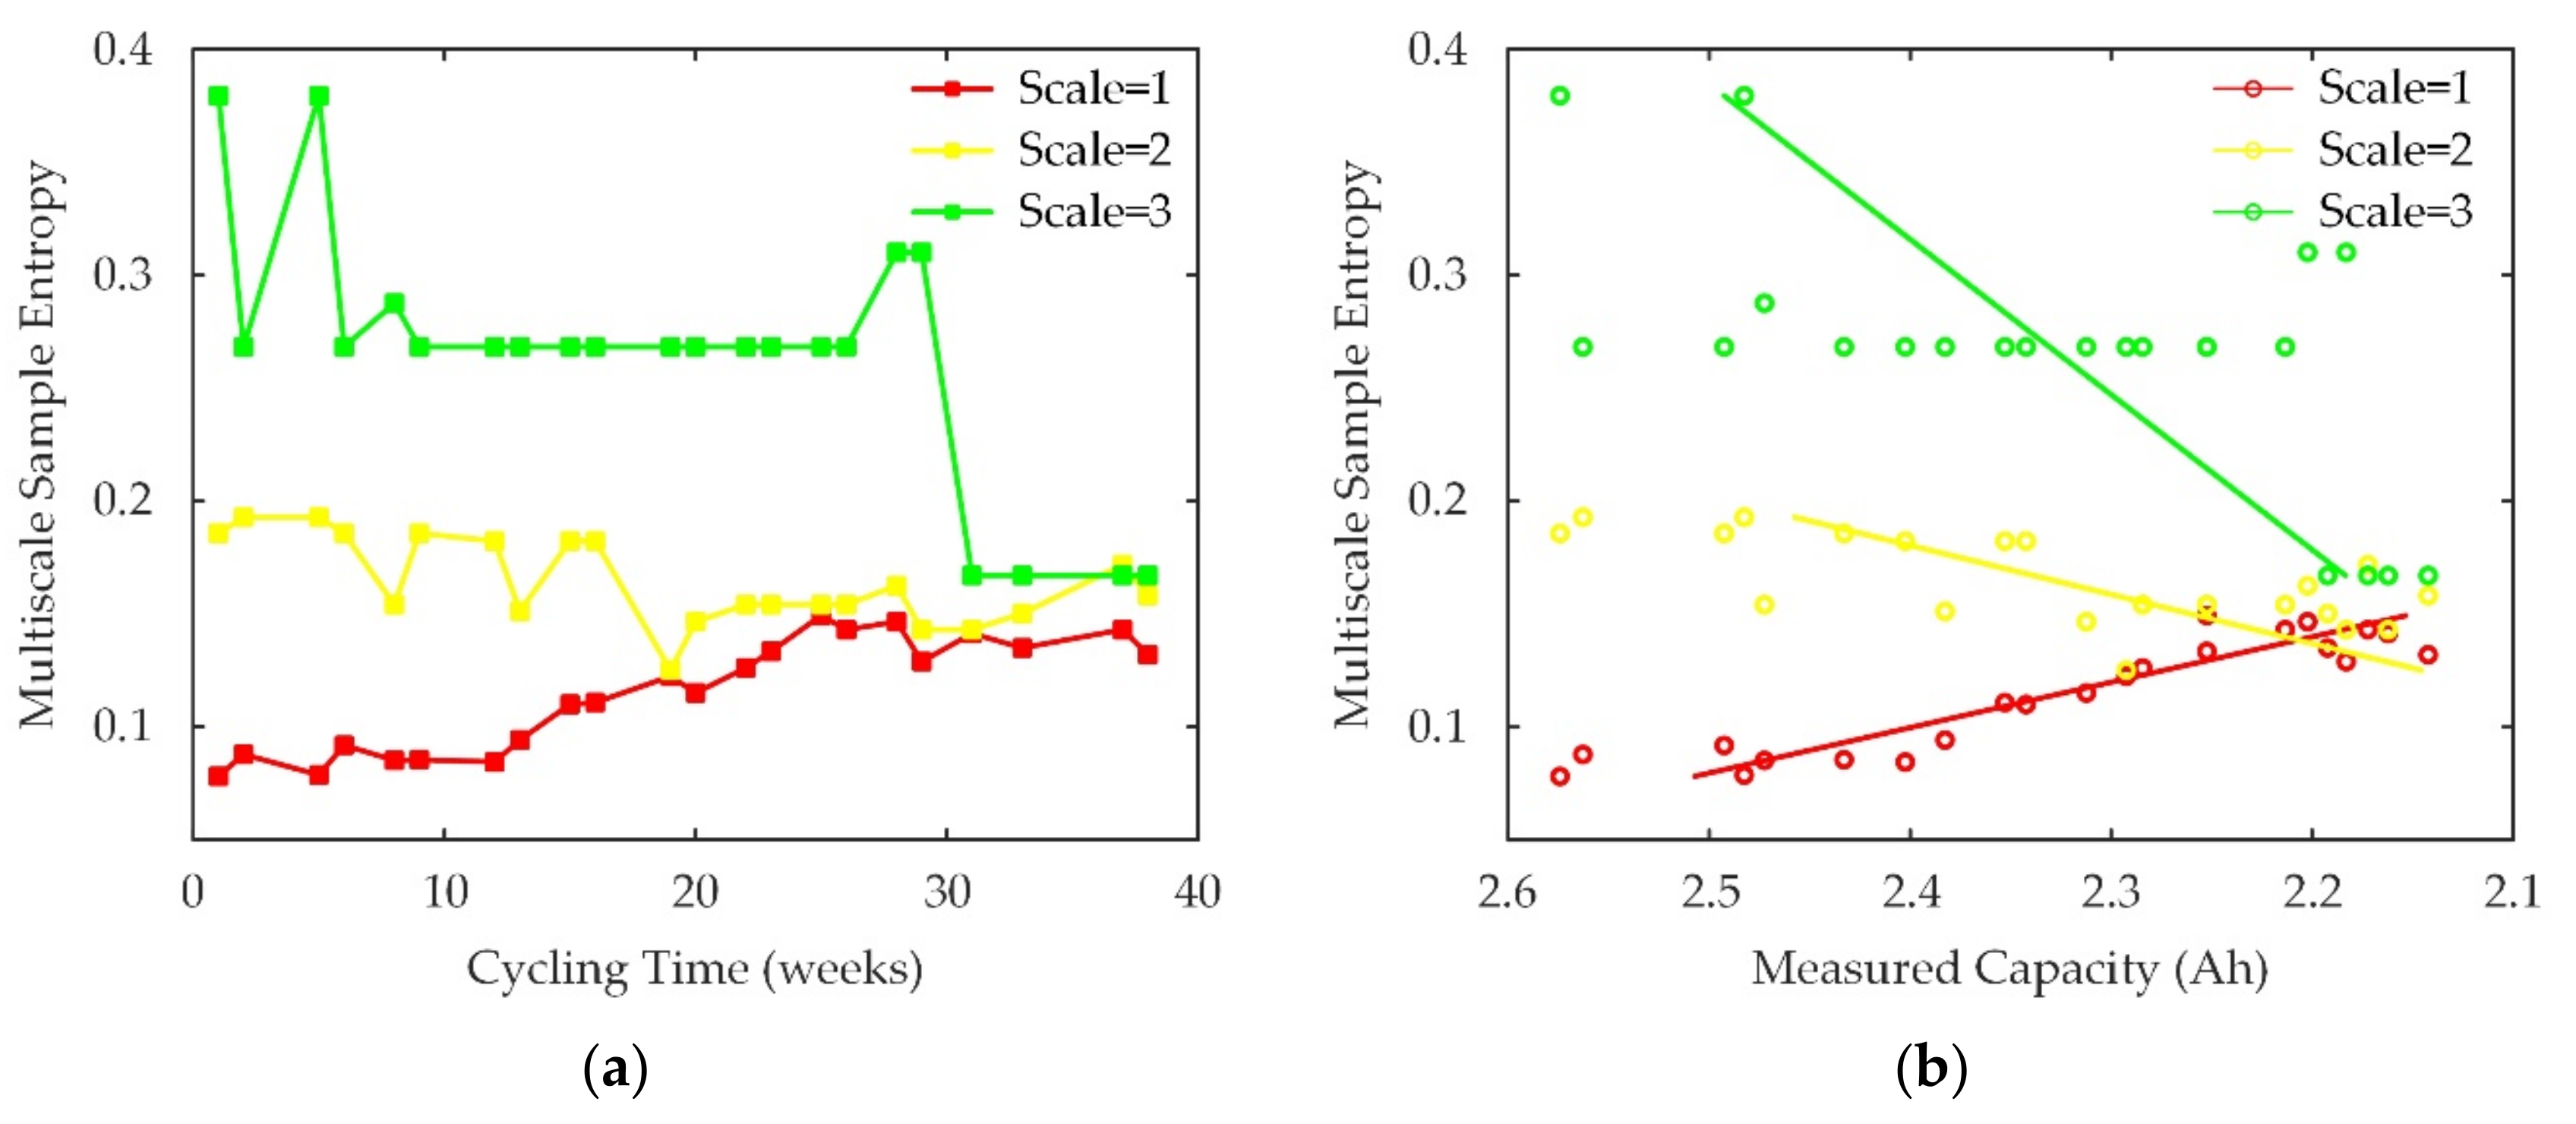
4.2. Accuracy Comparison

The overview of the proposed analyzing method is illustrated in Figure 9. The AE and SE were computed using the voltage datasets and the first-order polynomial fitting was chosen to explore the entropy-capacity mapping [23]. By comparing the accuracy of both estimators, the best suitable TC can be selected. In order to select the best suitable scale, three MSE-based estimators (scale 1, 2, 3) were constructed based on the selected TC.
The datasets were divided into the validating group data and training group data, as shown in Figure 10, and the training group data were used to establish the relationship between the battery capacity and entropy. The accuracy of the estimators was verified by the validating group data. Based on the optimal selection strategy of the minimization of the maximum sample entropy relative error, the parameters of m, r, N of the entropy algorithm were taken as 3, 0.04, and 30, respectively. The accuracy of the capacity estimators was evaluated using the mean percentage error (MPE) and the root-mean-squared percentage error (RMSPE), and their expressions are
M P E = 1 N T i = 1 N T P E i
R M S P E = 1 N T i = 1 N T P E i 2
P E i = C ^ i C i   C i × 100 %
where C i is the reference capacity measured after each round of aging; C ^ i is the estimated capacity; NT is the total number of test points; and PEi is the percentage error of the ith test point.
It can be seen from Figure 11 that the AE feature and SE feature under TC5 changed more obviously than that under other TCs. As the value of SOC under TC5 will enter the polarization zone in the future, quick changes of the voltage response at high SOC level will lead to large differences in entropy. In contrast, the SOC will become smaller for TC6 and it is away from the depleted state. Hence, TC6 cannot be used to estimate the capacity, and the results agreed with the previous analysis of polarization characteristics in Section 4.1. The relationships between the AE/SE feature and the capacity were acquired based on the first-order polynomial fitting. As shown in Figure 12, the variation of entropy over the capacity was flat under other TCs (except TC5), which will lead to a large estimation error.
Consequently, as shown in Figure 13, the percentage error under TC5 was lower than that under other TCs in most ranges of the cycling time. The three-dimensional diagram of MPE and RMSPE with respect to two impact factors is shown in Figure 14. When the SOC was 0.2 and 0.5, the estimation errors were relatively high regardless of what the current direction was because the battery state was in the flat zone. The best accuracy for the AE-based and SE-based estimators was achieved under TC5 as a result of polarization. Similarly, a low SOC level (i.e., smaller than 0.1) can also lead to high accuracy as a result of the polarization; however, this case was not considered in the experiment. In addition, both AE-based and SE-based methods showed very similar estimation errors. Based on these results, it can be concluded that the combined action of the SOC level and the current direction has the main effect on the capacity estimation accuracy. Only if the battery state enters into the polarization zone will high accuracy be achieved.
As the SE-based method in TC5 showed the best performance in terms of MPE and RMSPE, the MSE-based method was selected as a case study to analyze the effect of scale on the capacity estimation accuracy. The voltage dataset measured from TC5 was used for the MSE feature calculation, and the scale had the value of 1, 2, and 3, respectively. It can be seen from Figure 15a that no linear relationships between the MSE and the cycling time existed when the scale was larger than one. As a result, as seen in Figure 15b, the slope of the first-order polynomial function was negative, which will lead to a large estimation error. The estimation results in Figure 16 indicate that the percentage error of the MSE-based method decreased with the reduction in the scale. Table 3 shows more clearly that the MSE-based method with scale 1 had the highest accuracy. In this case, MPE and RMSPE were 1.67% and 1.95%, respectively. It can be concluded that MSE feature is not suitable for battery capacity estimation, because enlarging the scale factor means a reduction in sample points and eventually causes a drop in estimated accuracy.

5. Conclusions

The effect of voltage dataset selection on the accuracy of three entropy-based capacity estimation methods for LiFePO4/C battery was studied in this work. Six types of voltage datasets were collected considering the current direction and the SOC level. A first-order polynomial fitting was utilized to establish the relationship between the entropy feature (i.e., AE, SE, and MSE) and the capacity. The experimental results showed that the combined action of the SOC level and the current direction plays a main role in the capacity estimation accuracy. Only if the battery SOC enters into the polarization zone (SOC larger than 0.8 or smaller than 0.1) will a high accuracy of the capacity estimation be achieved. In addition, both AE-based and SE-based methods showed very similar estimation errors. In this work, MSE was not suitable as a feature because large scales lead to information loss and eventually causes a drop in the estimated accuracy; nevertheless, higher voltage sampling (e.g., 100 ms) could improve the accuracy of this method.

Author Contributions

X.S. conceived this paper, analyzed the data, and also wrote this paper; D.-I.S. designed and performed the experiments; S.H. provided guidance in programming and paper revision; J.M. and R.T. supervised the findings of this work; D.-I.S., X.H., and R.T. revised the paper and provided some valuable suggestions.

Funding

This research received no external funding.

Conflicts of Interest

The authors declare no conflicts of interest.

References

  1. Chen, X.; Shen, W.; Vo, T.T.; Cao, Z.; Kapoor, A. An overview of lithium-ion batteries for electric vehicles. In Proceedings of the 10th International Power and Energy Conference (IPEC), Ho Chi Minh City, Vietnam, 12–14 December 2012; pp. 230–235. [Google Scholar]
  2. Świerczyński, M.; Stroe, D.I.; Lærke, R.; Stan, A.I.; Kjær, P.C.; Teodorescu, R.; Kær, S.K. Field experience from Li-ion BESS delivering primary frequency regulation in the Danish energy market. ECS Trans. 2014, 61, 1–4. [Google Scholar] [CrossRef]
  3. Li, X.; Hui, D.; Lai, X. Battery energy storage station (BESS)-based smoothing control of photovoltaic (PV) and wind power generation fluctuations. IEEE Trans. Sustain. Energy 2013, 4, 464–473. [Google Scholar] [CrossRef]
  4. Stroe, D.I.; Knap, V.; Swierczynski, M.; Stroe, A.I.; Teodorescu, R. Operation of a grid-connected lithium-ion battery energy storage system for primary frequency regulation: A battery lifetime perspective. IEEE Trans. Ind. Appl. 2016, 53, 430–438. [Google Scholar] [CrossRef]
  5. Larcher, D.; Tarascon, J.M. Towards greener and more sustainable batteries for electrical energy storage. Nat. Chem. 2015, 7, 19. [Google Scholar] [CrossRef] [PubMed]
  6. Rahimi-Eichi, H.; Ojha, U.; Baronti, F.; Chow, M. Battery management system: An overview of its application in the smart grid and electric vehicles. IEEE Ind. Electro. Mag. 2013, 7, 4–16. [Google Scholar] [CrossRef]
  7. Xiong, R.; Li, L.; Tian, J. Towards a smarter battery management system: A critical review on battery state of health monitoring methods. J. Power Sour. 2018, 405, 18–29. [Google Scholar] [CrossRef]
  8. Meng, J.; Cai, L.; Luo, G.; Stroe, D.I.; Teodorescu, R. Lithium-ion battery state of health estimation with short-term current pulse test and support vector machine. Microelectron. Reliab. 2018, 88, 1216–1220. [Google Scholar] [CrossRef]
  9. Ng, K.S.; Moo, C.S.; Chen, Y.P.; Hsieh, Y.C. Enhanced coulomb counting method for estimating state-of-charge and state-of-health of lithium-ion batteries. Appl. Energy 2009, 86, 1506–1511. [Google Scholar] [CrossRef]
  10. Zou, C.; Manzie, C.; Nešić, D.; Kallapur, A.G. Multi-time-scale observer design for state-of-charge and state-of-health of a lithium-ion battery. J. Power Sour. 2016, 335, 121–130. [Google Scholar] [CrossRef]
  11. Hua, Y.; Cordoba-Arenas, A.; Warner, N.; Rizzoni, G. A multi time-scale state-of-charge and state-of-health estimation framework using nonlinear predictive filter for lithium-ion battery pack with passive balance control. J. Power Sour. 2015, 280, 293–312. [Google Scholar] [CrossRef]
  12. Li, H.; Pan, D.; Chen, C.L.P. Intelligent prognostics for battery health monitoring using the mean entropy and relevance vector machine. IEEE Trans. Syst. Man Cybern. Syst. 2014, 44, 851–862. [Google Scholar] [CrossRef]
  13. Lin, H.; Liang, T.; Chen, S. Estimation of battery state of health using probabilistic neural network. IEEE Trans. Ind. Inform. 2013, 9, 679–685. [Google Scholar] [CrossRef]
  14. Yang, D.; Zhang, X.; Pan, R.; Wang, Y.; Chen, Z. A novel Gaussian process regression model for state-of-health estimation of lithium-ion battery using charging curve. J. Power Sour. 2018, 384, 387–395. [Google Scholar] [CrossRef]
  15. Honkura, K.; Takahashi, K.; Horiba, T. Capacity-fading prediction of lithium-ion batteries based on discharge curves analysis. J. Power Sour. 2011, 196, 10141–10147. [Google Scholar] [CrossRef]
  16. Stroe, D.I.; Schaltz, E. SOH estimation of LMO/NMC-based electric vehicle lithium-ion batteries using the incremental capacity analysis technique. In Proceedings of the 2018 IEEE Energy Conversion Congress and Exposition (ECCE), Portland, OR, USA, 23–27 September 2018; pp. 2720–2725. [Google Scholar]
  17. Wu, J.; Wang, Y.; Zhang, X.; Chen, Z. A novel state of health estimation method of Li-ion battery using group method of data handling. J. Power Sour. 2016, 327, 457–464. [Google Scholar] [CrossRef]
  18. Wu, J.; Zhang, C.; Chen, Z. An online method for lithium-ion battery remaining useful life estimation using importance sampling and neural networks. Appl. Energy 2016, 173, 134–140. [Google Scholar] [CrossRef]
  19. Patil, M.A.; Tagade, P.; Hariharan, K.S.; Kolake, S.M.; Song, T.; Yeo, T.; Doo, S. A novel multistage Support Vector Machine based approach for Li ion battery remaining useful life estimation. Appl. Energy 2015, 159, 285–297. [Google Scholar] [CrossRef]
  20. Li, J.; Wang, L.; Lyu, C.; Luo, W.; Ma, K.; Zhang, L. A method of remaining capacity estimation for lithium-ion battery. Adv. Mech. Eng. 2013, 5, 154831. [Google Scholar] [CrossRef]
  21. Li, J.; Lyu, C.; Wang, L.; Zhang, L.; Li, C. Remaining capacity estimation of Li-ion batteries based on temperature sample entropy and particle filter. J. Power Sour. 2014, 268, 895–903. [Google Scholar] [CrossRef]
  22. Widodo, A.; Shim, M.C.; Caesarendra, W.; Yang, B.S. Intelligent prognostics for battery health monitoring based on sample entropy. Expert Syst. Appl. 2011, 38, 11763–11769. [Google Scholar] [CrossRef]
  23. Hu, X.; Li, S.E.; Jia, Z.; Egardt, B. Enhanced sample entropy-based health management of Li-ion battery for electrified vehicles. Energy 2014, 64, 953–960. [Google Scholar] [CrossRef]
  24. Hu, X.; Jiang, J.; Cao, D.; Egardt, B. Battery health prognosis for electric vehicles using sample entropy and sparse Bayesian predictive modeling. IEEE Trans. Ind. Electron. 2016, 63, 2645–2656. [Google Scholar] [CrossRef]
  25. Stroe, D.I. Lifetime Models for Lithium-Ion Batteries Used in Virtual Power Plants. Ph.D. Thesis, Department of Energy Technology, Aalborg University, Aalborg, Denmark, September 2014. [Google Scholar]
  26. Dubarry, M.; Liaw, B. Identify capacity fading mechanism in a commercial LiFePO4 cell. J. Power Sour. 2009, 194, 541–549. [Google Scholar] [CrossRef]
  27. Pincus, S.M. Approximate entropy as a measure of system complexity. Proc. Natl. Acad. Sci. USA 1991, 88, 2297–2301. [Google Scholar] [CrossRef]
  28. Richman, J.S.; Moorman, J.R. Physiological time series analysis using approximate entropy and sample entropy, Amer. J. Physiol. 2000, 278, H2039–H2049. [Google Scholar]
  29. Yentes, J.M.; Hunt, N.; Schmid, K.K.; Kaipust, J.P.; McGrath, D.; Stergiou, N. The appropriate use of approximate entropy and sample entropy with short data sets. Ann. Biomed. Eng. 2013, 41, 349–365. [Google Scholar] [CrossRef]
  30. Lake, D.E.; Richman, J.S.; Griffin, M.P.; Moorman, J.R. Sample entropy analysis of neonatal heart rate variability. Am. J. Physiol. Regul. Integr. Comp. Physiol. 2002, 283, R789–R797. [Google Scholar] [CrossRef] [Green Version]
  31. Costa, M.; Goldberger, A.L.; Peng, C.K. Multiscale entropy analysis of complex physiologic time series. Phys. Rev. Lett. 2002, 89, 1–18. [Google Scholar] [CrossRef]
  32. Costa, M.; Goldberger, A.L.; Peng, C.K. Multiscale entropy analysis of biological signals. Phys. Rev. E. 2005, 71, 1–4. [Google Scholar] [CrossRef]
  33. Jiang, J.; Liu., Q.; Zhang, C.; Zhang, W. Evaluation of acceptable charging current of power Li-ion batteries based on polarization characteristics. IEEE Trans. Ind. Electron. 2014, 61, 6844–6851. [Google Scholar] [CrossRef]
Figure 1. The flowchart of the test schedules.
Applsci 09 04170 g001
Figure 2. State of charge variation in the aging mission profile and the current and voltage response in the zoomed part.
Applsci 09 04170 g002
Figure 3. Capacity test of the tested battery cell.
Applsci 09 04170 g003
Figure 4. Pulse current and voltage response in the current pulse test. (a) Charging; (b) Discharging.
Applsci 09 04170 g004
Figure 5. Flowchart of the approximate entropy (blue) and the sample entropy (red) algorithm.
Applsci 09 04170 g005
Figure 6. The diagram of the coarse-graining procedure.
Applsci 09 04170 g006
Figure 7. Voltage datasets under different test conditions (TCs) during the battery aging process. (a) TC1; (b) TC2; (c) TC3; (d) TC4; (e) TC5; (f) TC6.
Applsci 09 04170 g007
Figure 8. Terminal voltage and its slope curve under the 1C-rate constant current full charging test.
Applsci 09 04170 g008
Figure 9. The overview of the proposed analysis method.
Applsci 09 04170 g009
Figure 10. Schematic diagram of the validating dataset and training dataset.
Applsci 09 04170 g010
Figure 11. Curve of the calculated entropy during the cycling of the tested battery cell. (a) Approximate entropy-based method; (b) Sample entropy-based method.
Applsci 09 04170 g011
Figure 12. First-order curving fitting result. (a) Approximate entropy-based method; (b) Sample entropy-based method.
Applsci 09 04170 g012
Figure 13. Estimation results under six test conditions. (a) Approximate entropy-based method; (b) Sample entropy-based method.
Applsci 09 04170 g013
Figure 14. The diagram of the mean percentage error and root-mean-squared percentage error considering the state of charge level and current direction (minus one indicates the charging direction and plus one indicates the discharging direction). (a) Approximate entropy-based method; (b) Sample entropy-based method.
Applsci 09 04170 g014
Figure 15. Curve of the multiscale sample entropy and their polynomial fitting results. (a) Curve of the calculated multiscale sample entropy during the cycling of the tested battery cell; (b) First-order polynomial fitting results between the calculated multiscale sample entropy and measured capacity.
Applsci 09 04170 g015
Figure 16. Estimation results using the multiscale sample entropy-based method.
Applsci 09 04170 g016
Table 1. The datasheet of the LiFePO4/C battery.
ItemValue
Nominal capacity2.5 Ah
Nominal voltage3.3 V
Charge voltage3.6 V
Cut-off voltage2.0 V
Maximum continuous charge current10 A (4C)
Maximum continuous discharge current50 A
Table 2. Test matrix for obtaining the voltage dataset for training the entropy-based capacity estimator.
SOC Level0.20.50.8
Current Direction
Pulse chargingTC1TC3TC5
Pulse dischargingTC2TC4TC6
Table 3. The mean percentage error and root-mean-squared percentage error of the multiscale sample entropy-based method.
MPE (%)RMSPE (%)
Scale = 11.671.95
Scale = 23.033.68
Scale = 32.994.35

