Abstract
Wind-power generation is one of the fundamental sources of renewable energy. However, due to the increasing size of wind turbines, they cause unwanted interference with radar systems for civic protection, especially for on-shore locations. This paper presents parameter studies performed on different wind-turbine models, with a focus on differences of the aerodynamical shape of the rotor blades. Numerical simulation is employed to estimate the influence of different wind-turbine design parameters, with the aim of deriving strategies to minimize wind-turbine influence on radar systems for civic protection. Due to the complex nature of the aerodynamic shape of the blade, a general model cannot be derived from the studies. However, further steps to eventually achieve this goal are outlined.
1. Introduction
For more than 20 years, wind power use is expanding in Germany and other countries in order to increase the regenerative and, therefore, sustainable production of electricity. In Germany, the goal is to produce 80% of the total electrical power by means of regenerative sources, with a focus on wind power [1]. In addition to large off-shore locations, further allotments of on-shore locations as well as “repowering” activities (i.e., replacing older wind turbines by newer ones with increased performance and efficiency) will be necessary in order to fulfil the goals of reducing the carbon footprint as prescribed by the German Climate Protection Plan [2].
Increasing density of wind parks, especially on-shore, however, is an issue for radar systems, as the large wind turbine rotors cause “radar clutter”, i.e., unwanted signal return, most notably for aviation safety radars and weather radars. The “Deutsche Wetterdienst” (DWD, German Meteorological Service) generally requires a clearance of at least 5 km around its radar installations as well as a height limit for surrounding wind turbines in order to limit wind-turbine influences. An additional field of conflict is the fact that radar systems and wind turbines have overlapping requirements for their location: places that are good for radar installations usually are also well-suited for wind turbines [3,4]. This is also true for radars for aviation safety, where air traffic surveillance radar is also negatively influenced by wind-turbine clutter [5,6].
The aim of the study presented in the following is to qualify and quantify the influence of different constructive parameters of idealized and typical wind turbines with respect to their radar cross section (RCS). This number represents a compounded virtual “area” of the radar target. It is directly linked to detectability: larger RCS means better detectability. As weather radars also include polarimetric measurements [7], dependence on polarization is also investigated.
The phenomenon of radar disturbance has been studied in many measurement campaigns for wind parks [8,9,10,11] as well as for single turbines [12,13,14]. The aspect of modifications of the aerodynamic parameters, to the author’s best knowledge, has not yet been investigated separately. Therefore, special focus is put on the aerodynamic parameters of the rotor blades.
2. Method
In this section, the assumptions and input parameters of the study are presented.
2.1. Frequency Bands Overview
National and international regulations reserve several frequency bands for air-traffic surveillance radars (see Reference [15] for a complete list). Among them are the bands from 1250–1260 and from 1340–1350 . In Germany, several frequency bands in the lower range (46–48 ) up to nearly 10 (9300–9600 ) are reserved for meteorological purposes (international allocations also in Reference [15]). The World Meteorological Organization describes the use of weather radars in the frequency range from 3–10 in detail in Reference [16].
2.2. Wind Turbines
A wind turbine’s principal assemblies are tower; nacelle (containing the generator and supporting machinery, e.g., the transmission); and rotor, consisting of hub and rotor blades. Table 1 gives an overview of the average sizes of wind turbines installed in Germany in 2015 and 2018. The next generation of wind turbines will most likely feature rotor blade lengths of 60 and beyond and a nacelle height of more than 150 , resulting in a foot-to-tip height of more than 200 .

Table 1.
Average sizes of on-shore wind turbines installed in Germany [21,22].
The tower is made of thick steel plates, while the nacelle and rotor hub are made of a steel frame cased with a thinner sheeting of either metal or fiber-reinforced plastic (FRP). Modern rotor blades are lightweight-design products, usually made of fiber-reinforced plastic (FRP) or carbon-reinforced plastic (CRP) [17], following the design rules for airfoils [18,19]. They also contain trimming elements, such as chambers filled with lead, usually located at about 2/3 of the blade’s total length. For lightning protection, the tips are made of metal, usually aluminum [20]. Thick conductors are installed inside the blade, which are connected to the metallic hub flange’s lightning protection rings.
Wind turbines come in several shapes and forms, specific to product and manufacturer. The tower is usually a truncated cone. Some manufacturers also use a tapered shape. While the rotor hub is almost always teardrop shaped, which is optimal regarding aerodynamics, the nacelle rarely “completes” the teardrop shape. Box shapes, with or without rounded corners, are much more usual, albeit a worse choice from an aerodynamics point of view.
Dielectric Material Properties of FRP
Material measurements of fiber-reinforced plastic samples were performed in the laboratory on a sample taken from a glider wing spar in order to determine the FRP’s dielectric permittivity as an input parameter for the simulations. The measurements were performed with a sample fitted in an RF waveguide, using the methods described in [23,24] in the frequency range of 8.25–12.4 . The measured value of the relative dielectric permittivity yielded and a low loss tangent . Literature on measurements of FRP [25,26], which were performed at much lower frequencies and considered general theory on permittivity [27], suggest that the measured values can be used for lower frequencies down to about 1 .
2.3. Radar Cross Section
In order to characterize the features to investigate, the radar cross section (RCS), is employed. It is defined by the radar equation [28]:
with subsript r for terms belonging to the receiver (Rx), subscript t for terms belonging to the transmitter (Tx), P for powers (in W), G for antenna gains (no unit), R for distances (in m), and der wavelength of the transmitted and received electromagnetic wave (in m). Looking at the units of Equation (1), one sees that the unit of is : an area (for a more detailed explanation, see Reference [29]). If the sender and receiver are identical, is called monostatic RCS. is used to characterize and classify radar targets. The monostatic RCS of aircrafts is usually recorded for an azimuth plane cut, which can be referred to in order to identify the aircraft type. However, by just knowing the RCS value, no conclusions can be drawn about the actual shape of the investigated object. For the RCS prediction of regular shapes, several approximations and hybrid numerical approaches can be employed (see Reference [30] for an in-depth treatment). Prediction of the RCS of an object of arbitrary shape, however, is possible only by numerical simulation. In References [31,32], numerical methods for the computation of the RCS of wind turbines are compared with regard to computational feasibility as well as plausibility and quality of results.
2.4. Wind-Turbine Parameters Influencing the RCS
The parameters influencing a wind turbine’s RCS can be classified by material:
- Electromagnetic properties of the blade’s construction material: fiber-reinforced plastic (FRP) is an isolator, while carbon-reinforced plastic (CRP) is a conductor [33,34].
- Surface treatment, e.g., lacquer/varnish to protect against UV radiation, rain, or moss growth.
It can be classifed by constructive design parameters:
- Tower/nacelle height.
- Rotor diameter, blade length.
- Blade wall thickness.
- Aerodynamic shape.
- Position and size of lightning protection equipment.
- Inner structure: hollows, trimming weight location, and spar size and location.
Also, it can be classied by parameters of operation:
- Rotational speed (turns per minute): This is an important parameter for all Doppler radars, as the movement causes a Doppler shift in the signal, which can be misinterpreted (e.g., Reference [6]).
- Blade pitch angle: the blade’s angle relative to the airflow (“angle of attack” in context of aircraft).
- Wind turbine azimuth angle: the “look direction” angle, i.e., the angle facing the wind.
The rotor’s elevation angle is usually fixed at about 2 upwards.
Additionally, considering weather radars, polarimetric measurements are used to infer the shape of rain drops [7]; polarization studies should therefore be included.
2.5. CAD Models
Figure 1 shows the CAD models used for simulation. Two tower models were used as shown in Figure 1a,b with different constructive parameters as presented in Table 2. The truncated cone shape is the most common shape, while exponentially tapered towers are noteworthy exceptions.
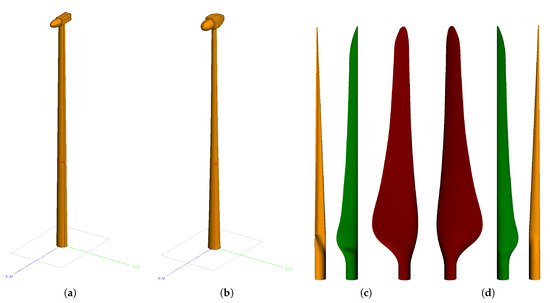
Figure 1.
CAD models of the investigated wind-turbine components, with increasing complexity: (a) WT v1: tower, nacelle, and hub; (b) WT v2: tower, nacelle, and hub; (c) blades: bottom; and (d) blades: top.

Table 2.
Parameters of the wind-turbine tower models.
The top and bottom sides of the investigated wind-turbine rotor blades are shown in Figure 1c,d; Blade v1 is in yellow, Blade v2 is in green, and Blade v3 is in red. Blade v1 is the simplest model, made from a single aerodynamic profile, tapered towards the wing tip, and with a straight leading edge. Blade v2 also features a straight leading edge but is composed of different aerodynamic profiles along the span towards the end and also wing twist (“washout” in context of aircraft), i.e., a decreasing angle of attack from root to tip. The profiles are taken from the NACA and DU Series catalogs [35,36,37]. Blade v3 was originally created as an experimental platform for textile-based sensors by TU Dresden’s Institute of Textile Machinery and High Performance Material Technology [38]. It also features different airfoil profiles, and in addition to blade v2, it has a curved leading edge. Blade v1 is 58 m in length; blades v2 and v3 are 63 m. This corresponds to the size of current wind turbines with 3–4 nominal power output and rotor diameters of about 125 m.
2.6. Simulation Setup
Taking into account the factors and limitations given above, the simulation setup was planned. The simulation frequency was chosen to be , the center of an air traffic surveillance radar frequency band. This choice presents a balance between computational effort, computational method, and desired radar target size. Higher frequencies cause super-linear increase in computation time and memory consumption, which is beyond the limit of available computational resources. For the parts made of metal, the material was chosen as “Perfect Electric Conductor” (PEC), a virtual material with zero electrical resistance, a common simplification for high-frequency problems when the resistance’s influence is negligible in practice.
For the turbine blades, several materials and combinations were investigated. PEC material was chosen as an approximation for CRP. This might not be ideal, as the carbon fiber used in lightweight construction is usually chosen for its fitness of the construction purpose (not by its electrical material properties), but it can serve as a baseline because the fiber strings will be placed so close to one another that electromagnetic penetration into the turbine blade will be unlikely, which is also the case for PEC. For FRP, the dielectric permittivity was chosen (see Section 2.2.1 above). In lightweight construction, a “sandwich” layering is usually employed: a layer of very stiff foam is placed between two layers of FRP or CRP. Therefore, different layering setups were also investigated. For the foam, a relative permittivity was assumed. Other surface coating was neglected, as the layers are very thin () compared to the wavelength at . The blades were assumed to be hollow in oder to limit the investigated parameters to the aerodynamic shape of the blades, and the material thickness was assumed to be constant along the blade.
Where only PEC was used, a Fast Multipole Method [39] (FMM) with the combined-field integral equation (CFIE) was used where computationally feasible. The FMM is a variation of the Method of Moments (see Reference [40] for a derivation from Maxwell’s equations). It delivers exact results (within numerical precision) at the price of a huge demand in computational resources, especially memory.
The numerical method of “Geometrical Optics/Ray Launching” (GORL) was chosen for all simulation setups containing materials other than PEC. It is derived and described in depth in Reference [41] as the “shooting and bouncing rays” (SBR) method. This method considers multiple propagation paths but, due to its discrete “rays”, might underreport signal return. This method has a significantly lower memory demand than the FMM. The method of Physical Optics (PO) [42] was not considered, as it neglects multiple reflections and penetration into the investigated object. This will make the simulated RCS value lower than expected in reality [32].
In all cases, the radar source was assumed to be an incident plane wave with an elevation angle of 0 (i.e., the direction of propagation is parallel to the x-y plane). Both methods are available in the Altair FEKO [43] software suite, which was used for this study.
3. Results
3.1. RCS of Nonrotating Components
Figure 2 shows the RCS of the nonrotating components of both investigated wind turbines. As the tower is rotationally symmetrical, Figure 2a displays the multistatic RCS in the x-y-plane. The black arrow denotes the direction of incidence of the electromagnetic wave. It can be seen that WT v2’s tower has a significantly higher monostatic RCS compared to WT v1’s tower (i.e., reflection in direction of incidence), while the multistatic RCS is a little smaller. There is no polarization dependence. The differences can be explained by the tapered shape of WT v2’s tower, as it is the only significant difference between the two models.
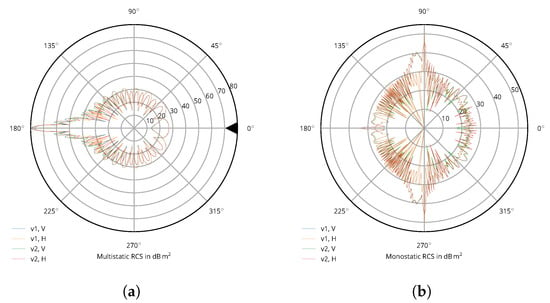
Figure 2.
Comparison of the radar cross section (RCS) (in ) of the nonrotating components of WT v1 and WT v2. The different tower shapes cause significant changes in the RCS, especially in the monostatic case (at 0) with more than 10 difference. This is also the case for the tower with nacelle and hub, where the flat shape of WT v1 causes very strong peaks into a single direction. (a) Multistatic RCS: tower only; (b) monostatic RCS: tower with nacelle and rotor hub.
Figure 2b shows the monostatic RCS of the ensemble of tower, nacelle, and rotor hub. As can be seen, there are distinctive differences to the sides (at 90 and 270). WT v1 causes a very strong single peak, which is not as pronounced with WT v2. WT v2 in turn displays a spread of stronger echoes to directions further backwards. This is caused by WT v1’s simple box shape, which also causes a strong peak at 180 compared to WT v2’s rounded teardrop-like shape. Polarization is different, too. While WT v1 shows little polarization dependence if at all, with WT v2, the H polarization shows oscillations in the front hemisphere which are not present in the V polarization.
3.2. RCS of the Rotor Blades
The results of the parameter studies in the following serve to investigate the influence of construction parameters on their radar cross section. The blades were placed in the simulation domain with the leading edge parallel to the z axis, with the same orientation: with the leading edge facing 0, the top side 90, the trailing edge 180, and the profile’s lower facing 270. The blade’s tip points towards +z, and the root is placed at the origin.
In Figure 3a, the rotor blades in their default configuration, modelled with PEC material, are presented. As can be seen, common characteristics are hard to make out. There is usually a stronger signal return at the leading edge: upwards between 50–90 and downwards between 230–260. Blade v1 features strong peaks at 70 and 235, while blade v2 shows those at 80 and 350 and blade v3 shows those at 90 and 245. Polarization sensitivity is low overall.
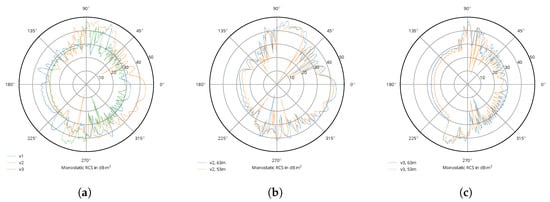
Figure 3.
Monostatic RCS (in ) of the blades made of perfect electric conductor (PEC) material. Continuous lines: V polarization; dashed lines: H polarization. The different blades show very different characteristic RCS signatures. An increase of the physical size of the blades causes a small shift of the characteristic locations as well as a small increase of the RCS. The polarization of the incident field has no effect on the RCS. (a) Blades v1, v2, and v3; (b) blade v2, scaled; and (c) blade v3, scaled.
In order to quantify blade-size influence, blades v2 and v3 were simulated after being scaled to 53 and 63 . The results are displayed in Figure 3b,c. As can be seen, the chance in size leads to a slight increase in RCS of about 3 and to small movement of the characteristic peaks.
Figure 4 shows the different blade’s RCS, with FRP, assumed to be lossless, in different thicknesses, and the PEC simulation (see Figure 3a) as reference. The thickness was varied from 5–20 in 5-mm steps [44]. Larger values of up to 10 cm are reported in References [45,46], which are considered for the multilayered panels presented below. A common feature is the increase of signal return with thickness increase. For blades v1 (Figure 4a) and v3 (Figure 4c), the signal return with FRP is only rarely greater than with PEC, although differences between the polarizations are clearly visible. However, blade v2 in Figure 4b shows significant differences depending on polarization: the H polarization shows an entirely new backside lobe at 135–200, which is just as strong as the main front lobe at 350. Introducing dielectric losses with a loss tangent introduces only minimal changes, as shown in Figure 5.
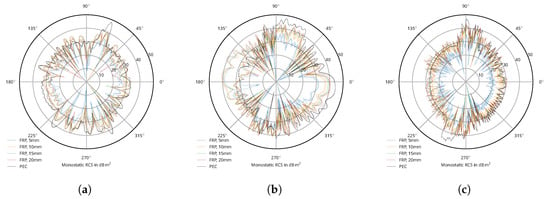
Figure 4.
Monostatic RCS (in ) of the blades made of lossless fiber-reinforced plastic (FRP) of different thickness. Continuous lines: V polarization; dashed lines: H polarization. The polarization of the incident field has noticeable effects on the RCS, especially for blade v2, where the signal return is stronger than for a pure PEC model for H polarization. (a) Blade v1; (b) blade v2; and (c) blade v3.
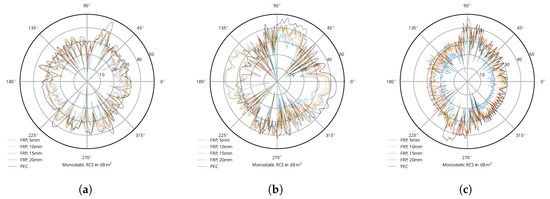
Figure 5.
Monostatic RCS (in ) of the blades made with lossy FRP () of different thicknesses. Continuous lines: V polarization; dashed lines: H polarization. The introduction of material losses does not cause significant changes compared to Figure 4. (a) Blade v1; (b) blade v2; and (c) blade v3.
The panel in Figure 6 shows a parameter study where a layer of foam () of varying thickness (5–20 in 5-mm steps) was placed below FRP of varying thickness (10–50 in 10-mm steps). From row to row downwards, the thickness of the FRP increases by 5 . The trend towards higher RCS with thicker FRP is also present here. As above, blade V2 shows significant differences depending on polarization. The RCS of the dual-layer model is only rarely larger than that of the single-layer FRP model, with the differences never larger than 3 .
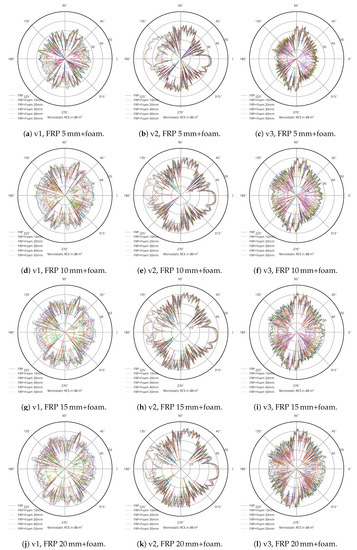
Figure 6.
Monstatic RCS (in ) of the rotor blades (left to right) composed of a layer of FRP of different thickness (downwards) and a layer of foam of different thicknesses.
Figure 7 shows a parameter study with an FRP sandwich: a layer of foam encased between two layers of FRP, one on the bottom as well and one on the top side. As in Figure 6, the thickness of the FRP increases by 5 from row to row downwards. Here, the estimate of a single-layer FRP-only model as a worst-case assumption for the RCS does not hold anymore. This is caused by the fact that layered structures work as resonators, which, depending on their thickness and composition, add interference, either constructive or destructive in nature.
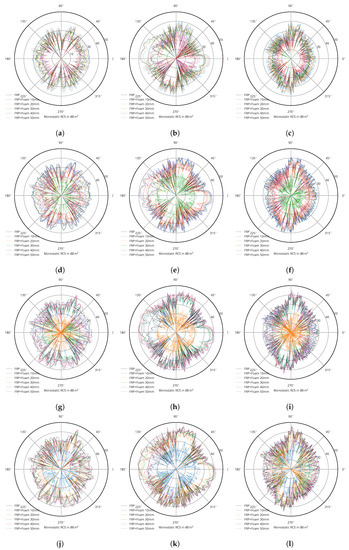
Figure 7.
Monstatic RCS (in ) of the rotor blades (left to right) composed of a sandwich setup of FRP, foam, FRP, with variable thicknesses. (a) v1, FRP 5 mm, foam, FRP 5 mm; (b) v2, FRP 5 mm, foam, FRP 5 mm; (c) v3, FRP 5 mm, foam, FRP 5 mm; (d) v1, FRP 10 mm, foam, FRP 10 mm; (e) v2, FRP 10 mm, foam, FRP 10 mm; (f) v3, FRP 10 mm, foam, FRP 10 mm; (g) v1, FRP 15 mm, foam, FRP 15 mm; (h) v2, FRP 15 mm, foam, FRP 15 mm; (i) v3, FRP 15 mm, foam, FRP 15 mm; (j) v1, FRP 20 mm, foam, FRP 20 mm; (k) v2, FRP 20 mm, foam, FRP 20 mm; and (l) v3, FRP 20 mm, foam, FRP 20 mm.
4. Discussion
With the goal of increasing the compatibility of wind turbines with radar systems for civil protection and defense, such as weather radars (especially those for severe weather detection) and air-traffic surveillance radars, some conclusions can be drawn, which shall be presented in the following.
4.1. Nonrotating Parts
Regarding the tower: although aesthetically more pleasant, the tapered truncated cone has a larger RCS than the simpler truncated cone design, so the simpler design should be given preference.
Regarding the nacelle, the box shape causes significant signal return when the flat sides are oriented perpendicularly towards a radar installation. This issue can already be dealt with in current radar system’s signal processing. It could also be resolved by coordination with local radar installations: operation data can be exchanged online, so that the wind turbine can avoid assuming or passing through a critical angle while the radar system is “looking” in this direction. Future wind-turbine nacelle designs might also prefer rounded shapes, which spread the reflected energy over a bigger solid angle or a bevelling of the sides, which will deflect the radar beam, either downwards or upwards.
Special radar-absorbing coating, e.g., varnish or paint, can also be applied to reduce the radar echo.
4.2. Rotor Blades
Regarding the rotor blades, the issue is more complicated. As can be seen in Figure 3a, even very simple aerodynamic shapes cause patterns that cannot be predicted by simpler means other than a complete numerical simulation. An RCS peak to the leading edge, towards the top and slightly forward as well as towards the bottom and slightly backwards, is common between the investigated models. If this can be generalized, however, is a question that needs to be investigated. In the meantime, RCS analysis of rotor blades should be part of the type-approval process.
Due to the electrically conductive properties of CRP, a PEC model can serve as a baseline prediction of the expected RCS.
The same, unfortunately, cannot be stated for FRP. While the PEC models do not exhibit polarization dependence, the FRP models do, sometimes significantly (see, e.g., Figure 4b). Furthermore, the sandwich structure common in lightweight construction cannot be omitted from the simulations as the layered structure causes interference, both constructive or destructive, depending on the angle of incidence. Simulations with dielectric losses considered showed no significant change. This makes finding a baseline “upper bound”/worst-case estimate for the RCS infeasible. It is to be assumed that features present in the FRP simulations but not in the PEC models are subject to change as more details of the internal structure (e.g., spar and trimming elements) are added. This might be alleviated in the future, as CRP is currently gaining market share in all domains of lightweight construction.
Considering the RCS values, the signal return of all investigated rotor blades is quite high, ranging from about 20 dBm2 in average to 50 dBm2 in peaks.
As with the nonrotating parts, using special radar-absorbing coating should be considered in order to reduce the radar backscattering.
4.3. Further Considerations
Exchange of operational parameters (via internet or cellular network) between radar installations and wind farms in order to reduce negative mutual influence (e.g., by communicating “forbidden positions” for the azimuth angle to the wind turbines or by communicating current azimuth angles/pitch angles/rotational speed to the radar installation for inclusion in their signal processing) could be considered. If severe weather can reasonably be expected (by forecast), weather radar installations should be given preference. This approach would probably require the least amount of investments into existing wind parks but would negatively influence the wind farm’s yield (i.e., generated electricity).
An issue of radar-absorbing materials is their quite narrow-band absorptive behavior. Applying coating for several frequencies could, therefore, very well be cost prohibitive in practice.
Additionally, using radar-absorbing material or coatings reduces the RCS of wind turbines, and rotor blades do not alleviate the problem of causing “blind zones” behind them (relative to the radar source). This issue will be of greater importance in the future, as tower heights and rotor diameters grow, with total heights reaching more than 200 m. Therefore, a wind-turbine clearance zone around radar systems for civic protection should be upheld. Where new on-shore wind parks are constructed, an analysis of the expected radar shadowing should be performed. If “blind zones” accumulate, additional radar installations should be considered.
5. Conclusions
In this paper, a parameter study of a wind-turbine components, rotating and nonrotating, was presented with the aim of deriving strategies to minimize wind-turbine influence on radar systems for civic protection, which can be employed with currently existing installations.
Unfortunately, given the complexity of the interaction of radar waves with the rotor blades, a “general” model of a wind-turbine blade cannot be derived from the presented studies. Further research, as proposed below, has the potential to improve the situation for coming generations of wind turbines.
An exchange of operational data between radar installations and wind parks could be a simple way to coordinate operations so that negative mutual influence can be reduced. However, this means additional investment with the risk of increased downtime or lower yield, which is not very desirable from an economic point of view.
From a wind-turbine manufacturer’s point of view, preference should be given to rounded-off shapes for the nacelle. This will distribute the reflected radar beam over a wider angle and thereby reduce the disturbance a single monostatic radar installation will experience. For the most sensitive frequency bands (depending on the wind turbine site), using radar-absorbing material should be considered for all of the wind turbine’s parts.
As a general recommendation regarding regulatory procedures, it seems advantageous that turbine blades are subjected to an RCS analysis in a type-approval process. This analysis can be performed by numerical simulation. A numerical method which includes the effects of multiple reflections and penetrations into the object should be chosen when dealing with nonmetallic/CRP objects, e.g., SBR/GORL. Different polarizations need to be considered. For metallic objects, using the Physical Optics (PO) method is usually sufficient.
Further Work
In order to more rapidly predict radar backscattering of wind-turbine rotors, research should be undertaken to derive a simplified model. This model should be able to compute the RCS from the used airfoil profiles, their length along the rotor blade, and the angle of incidence. These models will need to be verified with model-scaled laboratory measurements.
Further research in improved signal processing algorithms for weather radar data should also be considered.
The topic of influence on Doppler radar systems has not been discussed in this paper. However, it deserves mention. A feasible research approach could be model-scaled measurements at higher frequencies (beyond 100 ), in a rotating setup. Given the trend towards CRP, metal-coated 3-D printed rotor blades could be used.
Author Contributions
Conceptualization, S.H. and D.P.; Methodology, S.H. and D.P.; Validation, S.H. and D.P.; Investigation, S.H. and D.P.; Data Curation, S.H.; Writing-Original Draft Preparation, S.H.; Writing-Review & Editing, S.H. and D.P.; Visualization, S.H.; Funding Acquisition, D.P.
Funding
This research was funded by the German Federal Ministry for Economic Affairs and Energy (“Bundesministerium für Wirtschaft und Energie”) under grant number 0325727B. Open Access Funding by the Publication Fund of the TU Dresden.
Acknowledgments
Simulations were performed on the “taurus” cluster at the Center for Information Services and High Performance Computing (ZIH) at TU Dresden. We thank our colleagues at the Institute of Textile Machinery and High Performance Material Technology for providing a CAD model of an investigated rotor blade (blade v3).
Conflicts of Interest
The authors declare no conflict of interest.
Abbreviations
The following abbreviations are used in this manuscript:
| CAD | computer-aided design |
| CRP | carbon-reinforced plastic |
| DU | Delft University |
| FRP | fiber-reinforced plastic |
| NACA | National Advisory Committee for Aeronautics, predecessor of NASA |
| RCS | radar cross section |
| RF | radio frequency |
| WT | wind turbine |
References
- Das Energiekonzept und seine Beschleunigte Umsetzung, Stand Oktober 2011; Technical Report; Bundesministerium für Umwelt, Naturschutz und Reaktorsicherheit: Berlin, Germany, 2011.
- Klimaschutzplan 2050—Klimaschutzpolitische Grundsätze und Ziele der Bundesregierung; Technical Report; Bundesministerium für Umwelt, Naturschutz und nukleare Sicherheit: Berlin, Germany, 2016.
- Friedrich, A.; Lux, G. Messinstrumente Der Meteorologie—Wetterradar in Deutschland; Technical Report; Deutscher Wetterdienst: Offenbach, Germany, 2013.
- Kirsche, U. Windenergieanlagen verfälschen Messungen des Wetterradars: Unwetterwarnungen oder Strom aus Windenergie? Technical Report; Deutscher Wetterdienst: Offenbach, Germany, 2015.
- Brenner, M.; Cazares, S.; Intern, I.; Cornwall, M.J.; Dyson, F.; Eardley, D.; Horowitz, P.; Long, D.; Sullivan, J.; Vesecky, J.; et al. Wind Farms and Radar; Technical Report JSR-08-126; MITRE Corporation: McLean, VA, USA, 2008. [Google Scholar]
- The Effects of Wind Turbine Farms on ATC Radar; Technical Report; UK Ministry of Defence: London, UK, 2005.
- Zrnić, D.S. Weather Radar Polarimetry–Trends Toward Operational Applications. Bull. Am. Meteorol. Soc. 1996, 77, 1529–1534. [Google Scholar]
- Norin, L.; Haase, G. Doppler Weather Radars and Wind Turbines; InTech: West Palm Beach, FL, USA, 2012. [Google Scholar] [CrossRef]
- Angulo, I.; de la Vega, D.; Cascón, I.; Cañizo, J.; Wu, Y.; Guerra, D.; Angueira, P. Impact Analysis of Wind Farms on Telecommunication Services. Renew. Sustain. Energy Rev. 2014, 32, 84–99. [Google Scholar] [CrossRef]
- Rudd, R.; Rhandawa, B. RCS Measurement of Wind Turbines. In Proceedings of the 3rd European Conference on Antennas and Propagation, Berlin, Germany, 23–27 March 2009; pp. 3642–3644. [Google Scholar]
- Mishra, K.V.; Chandrasekar, V. Signal Analysis and Modeling of Wind Turbine Clutter in Weather Radars. In Proceedings of the IEEE International Geoscience and Remote Sensing Symposium, Honolulu, HI, USA, 25–30 July 2010; pp. 3561–3564. [Google Scholar]
- Etayo, I.; Satrustegui, A.; Yabar, M.; Falcone, F.; Lopez, A. Analysis of the Frequency and Time Variation of Radio Signals Scattered by a Wind Turbine. In Proceedings of the Fourth European Conference on Antennas and Propagation, Barcelona, Spain, 12–16 April 2010; pp. 1–3. [Google Scholar]
- Muñoz-Ferreras, J.; Peng, Z.; Tang, Y.; Gómez-García, R.; Li, C. Doppler-Radar-Based Short-Range Acquisitions of Time-Frequency Signatures from an Industrial-Type Wind Turbine. In Proceedings of the IEEE Topical Conference on Wireless Sensors and Sensor Networks (WiSNet), Phoenix, AZ, USA, 15–18 January 2017; pp. 5–7. [Google Scholar]
- Kent, B.M.; Hil, K.C.; Buterbaugh, A.; Zelinski, G.; Hawley, R.; Cravens, L.; Tri-Van; Vogel, C.; Coveyou, T. Dynamic Radar Cross Section and Radar Doppler Measurements of Commercial General Electric Windmill Power Turbines Part 1: Predicted and Measured Radar Signatures. IEEE Antennas Propag. Mag. 2008, 50, 211–219. [Google Scholar] [CrossRef]
- ITU Radio Regulations; Technical Report; International Telecommunications Union: Geneva, Switzerland, 2016.
- Radar Measurements. In Chapter 7—Radar Measurements; World Meteorological Organization: Geneva, Switzerland, 2016.
- Mishnaevsky, L.; Branner, K.; Petersen, H.; Beauson, J.; McGugan, M.; Sørensen, B. Materials for Wind Turbine Blades: An Overview. Materials 2017, 10, 1285. [Google Scholar] [CrossRef] [PubMed]
- Manwell, J.F.; McGowan, J.G.; Rogers, A.L. Wind Energy Explained: Theory, Design and Application; John Wiley & Sons, Ltd.: Chichester, UK, 2009. [Google Scholar] [CrossRef]
- Schubel, P.J.; Crossley, R.J. Wind Turbine Blade Design. Energies 2012, 5, 3425–3449. [Google Scholar] [CrossRef]
- Wiesinger, J.; Neumann, T. Blitzschutz für Windenergieanlagen. BINE Informationsdienst. 2000. Available online: http://www.bine.info/fileadmin/content/Publikationen/Projekt-Infos/2000/Projekt-Info_12-2000/projekt_1200internetx.pdf (accessed on 25 September 2019).
- Status des Windenergieausbaus an Land in Deutschland 2015; Technical Report; Deutsche WindGuard GmbH: Berlin, Germany, 2016.
- Bundesverband WindEnergie: Zahlen und Fakten (Facts and Figures). 2019. Available online: https://www.wind-energie.de/fileadmin/_processed_/4/8/csm_Factsheet_-_Windenergie_in_Deutschland_2018_d3ab9e66ea.jpg (accessed on 25 September 2019).
- Weir, W.B. Automatic Measurement of Complex Dielectric Constant and Permeability at Microwave Frequencies. Proc. IEEE 1974, 62, 33–36. [Google Scholar] [CrossRef]
- Baker-Jarvis, J.; Vanzura, E.J.; Kissick, W.A. Improved Technique for Determining Complex Permittivity with the Transmission/Reflection Method. IEEE Trans. Microw. Theory Tech. 1990, 38, 1096–1103. [Google Scholar] [CrossRef]
- Mumby, S.; Johnson, G.; Anderson, E. Dielectric Properties of Some PTFE-Reinforced Thermosetting Resin Composites. In Proceedings of the 19th Electrical Electronics Insulation Conference, Chicago, IL, USA, 25–28 September 1989; pp. 263–267. [Google Scholar]
- Krivda, A.; Page, S.; Meier, G.; Wright, S. Dielectric Spectroscopy of Fiber-Reinforced Epoxy Materials. In Proceedings of the 2004 IEEE International Conference on Solid Dielectrics, Toulouse, France, 5–9 July 2004; pp. 474–477. [Google Scholar]
- von Hippel, A.R. Dielectrics and Waves; Artech House: Boston, MA, USA; London, UK, 1954. [Google Scholar]
- Balanis, C.A. Antenna Theory: Analysis and Design, 3rd ed.; Wiley-Interscience: Hoboken, NJ, USA, 2005. [Google Scholar]
- Fuhs, A.E. Radar Cross Section Lectures; Naval Postgraduate School: Monterey, CA, USA, 1982. [Google Scholar]
- Ufimtsev, P.Y. Fundamentals of the Physical Theory of Diffraction; John Wiley & Sons, Inc.: Hoboken, NJ, USA, 2007. [Google Scholar] [CrossRef]
- Raza, M.B.; Fickenscher, T.H. Investigating the Radar Returns of a Wind Turbine; PIERS Proceedings; The Electromagnetics Academy: Taipei, Taiwan, 2013; pp. 730–733. [Google Scholar]
- Hegler, S.; Wolf, K.; Statz, C.; Neumann, N.; Plettemeier, D. Investigation of the RCS of Wind Turbine Rotor Blades. In Proceedings of the International Applied Computational Electromagnetics Society Symposium (ACES), Denver, CO, USA, 25–29 March 2018. [Google Scholar] [CrossRef]
- Ezquerra, T.A.; Connor, M.T.; Roy, S.; Kulescza, M.; Fernandes-Nascimento, J.; Baltá-Calleja, F.J. Alternating-Current Electrical Properties of Graphite, Carbon-Black and Carbon-Fiber Polymeric Composites. Compos. Sci. Technol. 2001, 61, 903–909. [Google Scholar] [CrossRef]
- Haynes, W.M. CRC Handbook of Chemistry and Physics, 97th ed.; CRC Press: Leiden, The Netherlands, 2016. [Google Scholar]
- Jacobs, E.N.; Ward, K.E.; Pinkerton, R.M. The Characteristics of 78 Related Airfoil Sections from Tests in the Variable-Density Wind Tunnel; Technical Report; Rockville, MD, USA, 1933. Available online: https://ntrs.nasa.gov/search.jsp?R=19930091108 (accessed on 25 September 2019).
- Bertagnolio, F.; Sørensen, N.; Johansen, J.; Fuglsang, P. Wind Turbine Airfoil Catalogue; Technical Report Risø-R-1280 (EN); Risø National Laboratory: Roskilde, Denmark, 2001. [Google Scholar]
- Timmer, W.A.; van Rooij, R.P.J.O.M. Summary of the Delft University Wind Turbine Dedicated Airfoils. J. Sol. Energy Eng. 2003, 125, 488–496. [Google Scholar] [CrossRef]
- Haentzsche, E.; Mueller, R.; Ruder, T.; Nocke, A.; Cherif, C. Integrative Manufacturing of Textile-Based Sensors for Spatially Resolved Structural Health Monitoring Tasks of Large-Scaled Composite Components. Mater. Sci. Forum 2015, 825–826, 571–578. [Google Scholar] [CrossRef]
- Gibson, W.C. The Method of Moments in Electromagnetics, 2nd ed.; Chapman and Hall/CRC: Boca Raton, FL, USA, 2014. [Google Scholar]
- Chen, W.K. The Electrical Engineering Handbook; Elsevier Academic Press: Amsterdam, The Netherlands, 2005. [Google Scholar]
- Ling, H.; Chou, R.C.; Lee, S.W. Shooting and Bouncing Rays: Calculating the RCS of an Arbitrarily Shaped Cavity. IEEE Trans. Antennas Propag. 1989, 37, 194–205. [Google Scholar] [CrossRef]
- Balanis, C.A. Advanced Engineering Electromagnetics, 2nd ed.; Wiley: Hoboken, NJ, USA, 2012. [Google Scholar]
- FEKO Electromagnetic Simulation Software|Altair Feko. Available online: https://altairhyperworks.com/product/FEKO (accessed on 25 September 2019).
- Appleton, S.G. Design and Manufacture of Radar Absorbing Wind Turbine Blades; Technical Report; QinetiQ: Farnborough, UK, 2005. [Google Scholar]
- Ohs, R.R.; Skidmore, G.J.; Bedrosian, G. Modeling the Effects of Wind Turbines on Radar Returns. In Proceedings of the MILCOM 2010 Military Communications Conference, San Jose, CA, USA, 31 October–3 November 2010; pp. 272–276. [Google Scholar]
- Gardiner, G. Wind Blade Manufacturing: Are Thermoplastic Composites the Future? Compositesworld: Cincinnati, OH, USA, 2008; Available online: https://www.compositesworld.com/articles/wind-blade-manufacturing-part-ii-are-thermoplastic-composites-the-future (accessed on 25 September 2019).
© 2019 by the authors. Licensee MDPI, Basel, Switzerland. This article is an open access article distributed under the terms and conditions of the Creative Commons Attribution (CC BY) license (http://creativecommons.org/licenses/by/4.0/).