Featured Application
This work provides an effective approach to reconstruct optical coherence tomography (OCT) images using two-dimensional (2D) down-sampled data, and the reconstructed images have spatially invariant lateral resolution over the entire imaging depth. The proposed method has significant potential applications in high resolution and real-time imaging of large-sized samples.
Abstract
Combining the advantages of compressive sensing spectral domain optical coherence tomography (CS-SDOCT) and interferometric synthetic aperture microscopy (ISAM) in terms of data volume, imaging speed, and lateral resolution, we demonstrated how compressive sampling and ISAM can be simultaneously used to reconstruct an optical coherence tomography (OCT) image. Specifically, an OCT image is reconstructed from two-dimensional (2D) under-sampled spectral data dimension-by-dimension through a CS reconstruction algorithm. During the iterative process of CS algorithm, the deterioration of lateral resolution beyond the depth of focus (DOF) of a Gaussian beam is corrected. In the end, with less spectral data, we can obtain an OCT image with spatially invariant lateral resolution throughout the imaging depth. This method was verified in this paper by imaging the cells of an orange. A 0.7 × 1.5 mm image of an orange was reconstructed using only 50% × 50% spectral data, in which the dispersion of the structure was decreased by approximately 2.4 times at a depth of approximately 5.7 Rayleigh ranges above the focus. This result was consistent with that obtained with 100% data.
1. Introduction
Spectral domain optical coherence tomography (SD-OCT) is a powerful and efficient imaging modality for the diagnosis and treatment of diseases in a variety of tissues, especially the skin and eyes [,,,]. In SD-OCT, imaging speed and lateral resolution are significant imaging performance indicators. The imaging speed depends mainly on the scanning speed of sample arm and the acquisition time of the spectrometer, and the lateral resolution is determined by the size of the focal spot of the light beam incident on the sample.
Compressive sensing SD-OCT (CS-SDOCT) has emerged as an increasingly popular research topic with a view to reducing the imaging time and data volume [,,,,]. In our previous works and most other studies on CS-SDOCT, the image is reconstructed using a fraction of the wavenumber k domain data required by the Nyquist theory, i.e., the under-sampling is only done in each A-scan [,,]. Undoubtedly, if the B-scan and C-scan data are also under-sampled, the data volume can be further compressed and the imaging time can be further shortened. Therefore, two-dimensional (2D) and three-dimensional (3D) CS-SDOCT have been widely studied, in which under-sampling is conducted in two or three directions of the spectral volume [,,]. Although the CS algorithm is time consuming, the acquisition speed is greatly increased, which is advantageous for the imaging of moving objects such as the eyes. For example, in order to obtain a 3D reconstruction of the anterior segment during lens adjustment, blinking, and pupillary responses to light stimulation, an optical coherence tomography (OCT) system with up to 135,000 A-scans per second was designed with a data volume greater than 1 G []. An expensive, large array, high speed camera with a high sampling rate is need in this case. In addition, transferring and processing large amounts of data is also challenging. Therefore, it is necessary and meaningful to explore CS-OCT.
In common Gaussian beam-based SD-OCT systems, there is an inherent trade-off between the lateral resolution and imaging depth. Therefore, in consideration of the imaging depth, a Gaussian beam with a large depth of focus (DOF) and a large focal spot is usually used for imaging, thus leading to a low lateral resolution. Interferometric synthetic aperture microscopy (ISAM) which provides 3D object structure by solving the inverse scattering problem [], is a method that can achieve focal-plane lateral resolution throughout the imaging depth [,,,]. Therefore, the use of the ISAM method allows for both high lateral resolution and large imaging depth. At present, short wavelength OCT systems have been demonstrated to achieve high resolution, and we can predict that the use of ISAM can achieve a spatially invariant high lateral resolution over the entire imaging depth in short wavelength OCT systems [].
In this study, we combine the advantages of 2D CS-SDOCT and ISAM in terms of data volume, imaging speed, and lateral resolution to obtain high-quality OCT images with less data volume. A typical SD-OCT dataset consists of an array of interference spectra measured at thousands of linearly spaced wavenumbers (A-scan) for each transverse scanning position (B-scan). First, the selected A-scans in each B-scan are reconstructed from their under-sampled k-space measurements individually through the one-dimensional (1D) compressive sensing (CS) reconstruction algorithm. Then, the reconstruction algorithm is applied to each selected B-scan row-by-row, followed by correcting the lateral resolution using ISAM theory. Finally, an OCT image with spatially invariant lateral resolution throughout the imaging depth is reconstructed from 2D under-sampled data. Our proposed method and CS reconstruction strategy were first verified by simulation, and then an OCT image of the acinar cells of an orange with improved lateral resolution was obtained using under-sampled 2D data (sampling rate of 50% × 50%). It should be noted that since the recovery strategy of the lateral slow scanning (C-scan) data is the same as that of the B-scan data, only 2D reconstruction was studied in this work, but the method is still applicable to 3D reconstruction.
2. Methods
2.1. Interferometric Synthetic Aperture Microscopy (ISAM)
A schematic diagram illustrating the interaction between incident light beam and tissue is shown in Figure 1a []. The Gaussian beam generated from a focused lens is incident on the green plane z = z0 shown in Figure 1a. The incident field entering the tissue interacts with the scatterer at the position of to produce a scattered field, and this scattered field can be expressed as on the basis of the first-order Born approximation, where is scattering potential function of sample. The secondary source can now be propagated through space using the Green’s function based on Huygens theory. The scattered field is then collected by a detection lens at the position of , and the focused detection field is defined as . Consequently, the signal collected by the detection lens is given by []
where A(k) is the power spectrum function of the light source. If the detection lens is chosen to be the same as the illumination lens, the Ei and Eb are the same pattern of Gaussian function. After applying a fast Fourier transform (FFT) over the lateral direction and making some modifications, Equation (1) can be transformed into []
in which . Equation (2) relates the spectral data at the lateral spatial frequency and wavenumber k to the 3D FFT of of tissue.
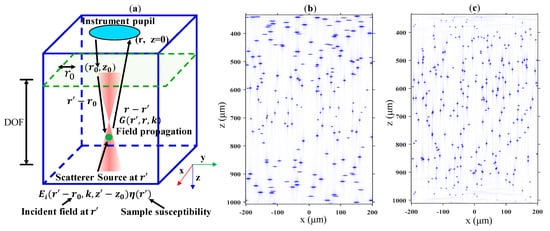
Figure 1.
(a) The three-dimensional (3D) schematic diagram illustrating the interaction between the incident field and sample. The coordinates (, z0), (, z′), and (, z) represent the incident position of the beam, the position of the scattered particle, and the position at which the scattered field is detected, respectively. The green dot in (a) represents a scattering particle. (b,c) Simulation results of Spectral domain optical coherence tomography (SD-OCT) and interferometric synthetic aperture microscopy (ISAM) applied to a scattering particle sample, respectively.
In traditional SD-OCT, the detected scattered signal at each lateral position is considered to be independent and one-dimensional, which can be expressed as
where C is a parameter related to the system. Taking the 2D FFT of with respect to the lateral components of , Equation (3) now becomes
Comparing Equation (2) and Equation (4), it can be easily found that the point (, k) in the collected spectral data is assumed to correspond to the point (, −2k) in the 3D Fourier representation of the object. This assumption in SD-OCT causes the spot to diffuse heavily as the distance from the focus increases. ISAM is a technology for correcting (, −2k) to (, −2kz (/2)), which results in the correction of lateral resolution in the whole depth range.
To illustrate more clearly the advantages of ISAM in terms of lateral resolution, numerical simulations were performed for both SD-OCT and ISAM. The simulation method has been introduced in our previous published work, as well as in many other studies [,,,]. The simulation steps are briefly summarized as follows: First, the object matrix was defined; then, the detection signal S was generated on the basis of Equation (1) and Equation (2); finally, for SD-OCT, the inverse fast Fourier transform (IFFT) was applied directly to S to obtain the spatial structure signal, while for ISAM, the axial spatial frequency was corrected before the IFFT was applied. In the simulation, the center wavelength of light source was 1.3 μm, the spectral resolution was 0.1 nm, and the bandwidth was 80 nm. The Gaussian beam used in the simulation had a DOF of approximately 200 μm and a focal spot with a diameter of approximately 10 μm. Figure 1b,c show the results of SD-OCT and ISAM, respectively, when imaging randomly distributed isotropic point scatterers with a diameter of 2 μm. We can see that the ISAM image had spatially invariant lateral resolution over the entire depth compared to the SD-OCT image, whose lateral resolution was degraded away from the focus. It was measured that the full width at half maxima (FWHM) of each scattering particle was the same throughout the depth, as shown in Figure 1c.
2.2. 2D Compressive Sensing Spectral Domain Optical Coherence Tomography
In this section, we detail the basic principle and procedures of 2D CS-SDOCT, and simulate the reconstruction of the 2D image of the two mirror surfaces p1 and p2 for a more vivid explanation. The simulation results are shown in Figure 2e–h, and Figure 2a–d shows the recovery process of the spectral pattern. The processes represented by the green arrows in Figure 2i illustrate the reconstruction steps of 2D CS-SDOCT.
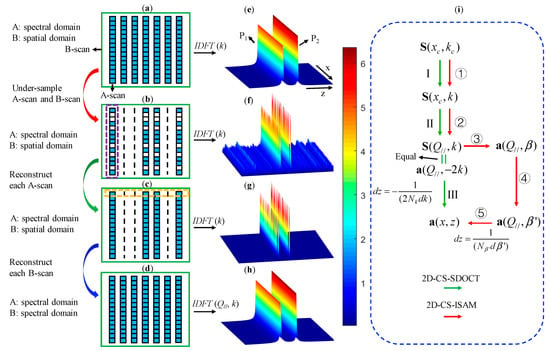
Figure 2.
Schematic demonstration of the compressive sensing reconstruction strategy. (a)–(d) The patterns of the data matrixes, (e)–(h) the simulation results of two mirror surfaces, (i) processing steps of the method combining compressive sensing spectral domain optical coherence tomography (CS-SDOCT) and ISAM. In (i), .
According to CS theory, CS reconstructs signal a by solving the following constrained optimization problem []:
where T is the measurement matrix, y is the measured data, ψ is the sparse operator that transforms a to a sparse representation, and ε is the parameter that controls the fidelity of the signal in the measurement domain. and are the l1 norm and l2 norm, respectively.
In SD-OCT, after removing the DC term and the self-coherent signal of the sample, the 2D under-sampled spectral data can be formulated as a digital signal as follows []:
where represents the complete sparse structural signals in the spatial domain; F represents the 1D discrete Fourier transform (DFT); Mk and Mx are the sampling masks in wavenumber k domain and lateral spatial domain, respectively; and a parameter with the subscript ‘c’ indicates that it is compressed. According to Equation (3), we know z′ = −z/2. The pattern of is shown in Figure 2b, and the corresponding structural image shown in Figure 2f was obtained by performing inverse discrete Fourier transform (IDFT) on the k-domain of . The 2D CS reconstruction is to restore Figure 2f to Figure 2e dimension-by-dimension.
For CS reconstruction of the axial direction, i.e., each A-scan, measurement matrix T is Mk F. Because the structural signal a to be recovered is considered sparse in SD-OCT [], ψ is chosen as the identity matrix []. Therefore, based on Equation (5), we reconstruct A-scans data by solving the following constrained optimization problem:
After solving Equation (7), structural signal and data matrix are obtained, which are shown in Figure 2g and Figure 2c, respectively. This process corresponds to step I shown in Figure 2i.
For CS reconstruction of the lateral direction, i.e., B-scan, sparse machine ψ cannot be identity matrix since the measurement domain cannot be the same as the sparse domain []. In this paper, we select the sparse machine ψ as F [], then Equation (5) becomes
in which = F. After solving the optimization problem in Equation (8), structural signal and data matrix are obtained. This process corresponds to step II shown in Figure 2i. After the is recovered, the signal a (x, z’) can be reconstructed as FH, where FH represents IDFT. Then the vertical axis of a (x, z’) is scaled by -2 to get complete structural signal a (x, z). a (x, z) can also be obtained by implementing a 2D IDFT along the lateral and axial directions of spectral matrix , wherein the scaling of the vertical axis is reflected in the coordinate transformation formula between the spatial coordinates and the spectral coordinates. Nk and dk are the number and spacing of the elements of coordinate k, respectively. This process corresponds to step III shown in Figure 2i. Figure 2h and Figure 2d show the final reconstructed complete structural image and data matrix, respectively. In the CS algorithm, unsampled points are set to zero in the spectral data.
2.3. Reconstruction Procedures of 2D Compressive Sensing Interferometric Synthetic Aperture Microscopy
The detailed processing steps of method combining 2D CS-SDOCT with ISAM are summarized as follows []:
1. Reconstruct from (step ① shown in Figure 2i).
- (1) Initialization: residual signal r_n = , reconstructed signal , and measurement matrix T = Mk F.
- (2) Apply IDFT to r_n to get spatial-domain signal S1.
- (3) Find signal peaks with intensity higher than preset value I1 in S1.
- (4) Update residual signal r_n and reconstructed signal using the least squares method [].
- (5) Repeat step (2) for the updated r_n and .
- (6) Repeat step (3) and use a lower light intensity threshold I2 to find smaller signals.
- (7) Repeat steps above until the ε is less than the set value, and then obtain the reconstructed signals , from which we can get and .
2. Reconstruct from (step ② shown in Figure 2i).
- (1) Initialization: residual signal r_n = , reconstructed signal , and measurement matrix T = Mx FH.
- (2) Repeat steps 1. (2)–(7) to get reconstructed signal , from which we can get complete spectral matrix .
3. Apply a filter to to get [] (step ③ shown in Figure 2i).
4. Interpolate the β domain of to get the sample function uniform in β domain. (step ④ shown in Figure 2i).
In Step 5, the coordinate transformation formula between the spatial coordinates and the spectral coordinates is , where Nβ’ and dβ’ are the number and spacing of the elements of coordinate β’, respectively.
2.4. Experimental Setup for SD-OCT
To benchmark the performance of the proposed method in terms of imaging speed, data volume, and lateral resolution, a 1301 nm SD-OCT system was built, as shown in Figure 3.
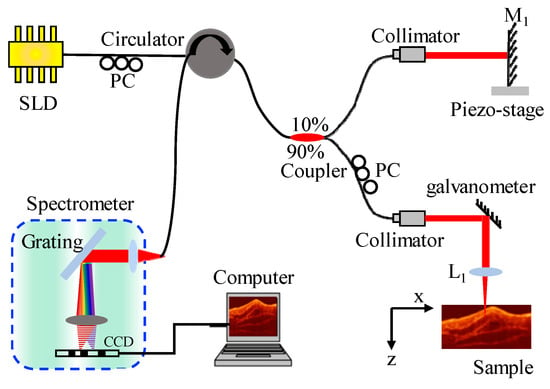
Figure 3.
Schematic diagram of the SD-OCT system. L1: focused lens; PC: fiber polarization controller; M1: mirror.
A super luminescent diode (SLD1021S, Thorlabs, Newton, NJ, USA) provided the broadband illumination. The bandwidth of the source was 85 nm, with a 6 mW output power. The light passing through the circulator was divided by a 90:10 fiber-optic coupler (TW1300R2A1, Thorlabs, Newton, NJ, USA) into sample light and reference light for interference measurements. The reference arm contained a piezo-stage (P-752.1CD, Physik Instrumente GmbH & Co. KG, Karlsruhe, Germany) to achieve phase shifting, so as to remove conjugated images and fundamental frequency noise. In the sample arm, the focused lens had a focal length of 19 mm, a spot size of approximately 10 μm, and a DOF of approximately 193 μm. The focused lens was an achromatic lens. The reference light reflected from the mirror interfered with the backscattered light of the sample arm, and the interference signals were collected by a spectrometer with a spectral resolution of approximately 0.13 nm at 1300 nm wavelength. In the spectrometer, a 1200 line/mm transmission grating was used for splitting, and a linear charge-coupled device (CCD) camera operating at a center wavelength of approximately 1300 nm (SU-LDV-512LX-1.7T1-0500, Goodrich, 512 pixels, pixel size 50 μm × 50 μm, 14-bits) was used to acquire spectra. The spectrometer had a spectral range of 1262.2 nm to 1338.4 nm. The sample was scanned in the x-direction using a one-dimension galvanometer scanner (TSH8310, Sunny Technology, Beijing, China) to obtain a 2D image. The rotating axis of the scanning mirror was at the focus of the focused lens to form a telecentric optical path. The interval between two lateral scanning points was 10 μm. Further details about the system configuration can be found in Table 1.

Table 1.
The parameters of the SD-OCT system.
The theoretical maximum imaging depth is the imaging depth calculated using the resolution of the spectrometer at the center wavelength, without considering the attenuation of the tissues.
3. Results and Discussion
3.1. Simulation Results
The results of numerical simulation used to verify the reconstruction method described in Section 2.3 are shown in Figure 4. The software used for the simulation was MATLAB and the data accuracy was 64 bits. In order to clarify the performance of the method combining 2D CS-SDOCT with ISAM, we directly simulated steps 2–5 described in Section 2.3. The simulated sample consisted of a row of scattering particles with diameters of 2 μm, which were evenly arranged laterally at the depth of 500 μm from the focus, as shown in Figure 4a. The other simulation conditions were the same as those used in Figure 1b,c.
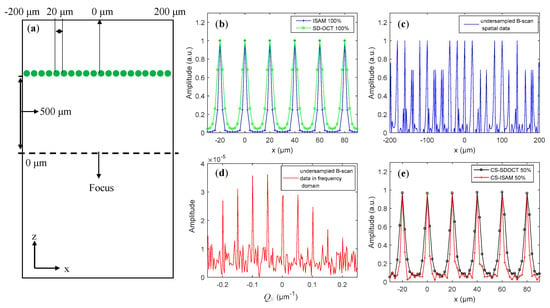
Figure 4.
(a) Schematic diagram of the simulated sample, (b) the reconstructed structural signals of the SD-OCT and ISAM obtained by 100% B-scan data, (c) under-sampled B-scan data in spatial domain with a sampling rate of 50%, (d) under-sampled B-scan data in the lateral spatial frequency Q// domain, and (e) reconstructed structural signals of ISAM and SD-OCT using 50% data.
Curves in Figure 4b–e are lateral distribution of signals at the depth of 500 μm. The green and blue curves in Figure 4b are the reconstructed structural signals of the SD-OCT and ISAM using 100% B-scan data, respectively, as can be seen in the lateral resolution being significantly improved in signals of ISAM. It should be noted that only the results in the range of are displayed in Figure 4b,e to clearly show the correction effect of the ISAM on the lateral resolution. Figure 4c shows the under-sampled B-san spatial signal with a sampling rate of 50%. The signal in Figure 4d was obtained by performing the DFT on the lateral component xc of , namely = . It can be seen that the signal in the Q//-domain had better compressibility, i.e., sparser, than the signal in the spatial domain. The red curve in Figure 4e is the result after proceeding steps 2–5 including step 4, while the black curve is the result of not performing step 4. We found that the lateral resolution of the result plotted with the red curve was improved by approximately 2 times, and the improvement effect was similar to that of the results obtained with 100% data shown in Figure 4b.
Consequently, it can be concluded that the feasibility of the proposed method of combining 2D CS-SDOCT with ISAM is verified by the simulations.
3.2. Experiment Results
The applicability of the proposed approach to tissue imaging was investigated on the basis of the results for an onion and the acinar cells of an orange, as shown in Figure 5 and Figure 6, respectively. In Figure 5 and Figure 6, one pixel in the x direction represents 10 μm.
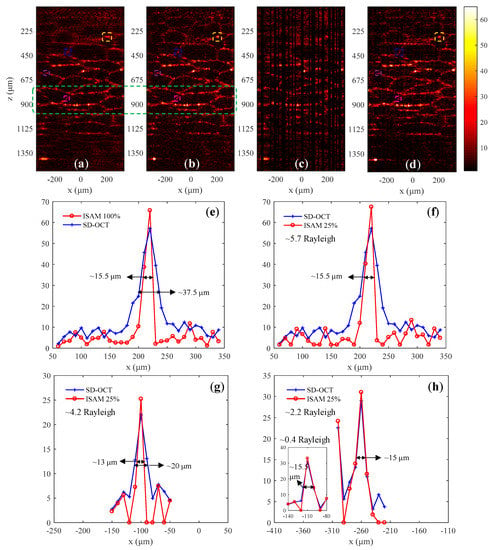
Figure 5.
Experiment results of the acinar cells of an orange. The images in (a,b) are results of SD-OCT and ISAM obtained by complete spectral data, respectively; (c) shows the image in which the selected A-scans were reconstructed, and (d) shows the reconstructed 2D image using 50% × 50% data. The depth range within the green dashed box in (a,b) is the theoretical range of depth of focus (DOF). (e) Lateral distribution of the structures within the yellow dashed boxes in (a,b); (f) lateral distribution of the structures within the yellow dashed boxes in (a,d); (g,h) lateral distribution of the structures within the blue and purple dashed boxes in (a,d).

Figure 6.
Experiment results of the onion. The images in (a,b) are results of SD-OCT (100% data) and CS-ISAM (25% data), respectively. (c) Lateral distribution of the structures within the yellow dashed boxes in (a,b).
Figure 5a,b are the structural images of SD-OCT and ISAM, respectively, reconstructed from the complete spectral data. We can find that the lateral resolution of the ISAM image is improved compared to the SD-OCT image, especially in the depth range away from the DOF. The blue and red curves in Figure 5e show the lateral distribution of the structures within the yellow dashed boxes at a depth of 550 μm from the focal plane, respectively, in Figure 5a,b. Figure 5c is the image after reconstruction of the selected A-scans from 50% × 50% spectral data. The 2D image shown in Figure 5d was reconstructed after performing steps 2–5 introduced in Section 2.3, and its lateral resolution was improved compared to the SD-OCT image shown in Figure 5a. The blue and red curves in Figure 5f show the lateral distribution of the structures within the yellow dashed boxes in Figure 5a,d, respectively. The result of Figure 5f indicates that the diffusion of the structure was reduced by approximately 2.4 times at a depth of approximately 5.7 Rayleigh ranges above the focus plane, which was consistent with that obtained with 100% data shown in Figure 5e. The structures in the blue, purple, and pink dashed boxes are located at depths of 410 μm (approximately 4.2 Rayleigh), 217 μm (approximately 2.2 Rayleigh), and 41 μm (approximately 0.4 Rayleigh) from the focal plane, respectively. The curves in Figure 5g and Figure 5h show the lateral distribution of the structures within the blue and purple dashed boxes in Figure 5a,d, respectively. The distribution of structures at the depth of 0.4 Rayleigh range is plotted in Figure 5h. Although the lateral widths of the structures at different depths for comparison in Figure 5f–h are not identical, it is still demonstrated that the dispersion of structures outside the Rayleigh range can be reduced to the level within the Rayleigh range using the CS-ISAM method. There is an issue that needs to be explained. For comparison, the range of the abscissa of Figure 5g,h was set to 300 μm, but the portion without the signal was invalid.
For a 0.7 × 1.5 mm orange image, the time to acquire spectral data volume was 2.1 and 0.8 s, respectively, at full sampling (70 depth scans and 512 spectral sampling points per depth scan) and 25% sampling rate (35 depth scans and 256 spectral sampling points per depth scan). Therefore, CS-ISAM is advantageous in terms of imaging speed, especially when imaging large moving objects.
Figure 6 shows the imaging results for the onion tissue. Figure 6a,b are structural images of SD-OCT obtained using 100% data and structural image of CS-ISAM obtained using 25% data, respectively. The blue and red curves in Figure 6c show the lateral distribution of the structures within the yellow dashed boxes at the depth of 500 μm from the focal plane in Figure 6a,b, respectively. The result of Figure 6c indicates that the diffusion of the structure was reduced by approximately 2.2 times at a depth of approximately 5.2 Rayleigh ranges above the focus plane, which verifies the effectiveness of CS-ISAM.
Consequently, both simulation and experiment results show that the improvement effect of ISAM and CS-ISAM on lateral resolution was almost the same, which proves the effectiveness of the method used in this paper. We also tried to reconstruct the image using much less than 25% data. However, because of the low signal to noise ratio (SNR) of the image and the limitations of the CS reconstruction algorithm used in this paper, the results were not perfect. However, we believe that 25% data compression rate is enough to prove the practical significance of this method. In the following work, we will explore the impact of different CS reconstruction algorithms on this method to improve the speed and performance of reconstruction.
4. Conclusions
In summary, on the basis of 2D CS-SDOCT technology, the correction of lateral resolution using ISAM method was added in this work. We first introduced the principles of ISAM and 2D CS-SDOCT, and then detailed how to apply them simultaneously to reconstruct images with spatial-invariant lateral resolution using compressed data. This method was verified by simulation results and the experiment results of imaging the orange cells. A 0.7 × 1.5 mm image of an orange was reconstructed using only 50% × 50% spectral data, in which the diffusion of the structure was reduced by approximately 2.4 times at a depth of approximately 5.7 Rayleigh ranges above the focus. This result was consistent with that obtained with 100% data, thus demonstrating the effectiveness of the method used in this paper.
Author Contributions
Conceptualization, L.Y.; formal analysis, L.Y.; methodology, L.Y. and L.S.; software, L.Y., X.G., and B.H.; supervision, L.S.; validation, L.Y. and L.S.; writing—original draft, L.Y.; writing—review and editing, L.S., X.G., and B.H.
Funding
This research received no external funding.
Acknowledgments
L.Y., X.G., and B.H. acknowledge the State Key Laboratory of Precision Measurement Technology and Instruments, Department of Precision Instruments, and Tsinghua University for support through a PhD studentship.
Conflicts of Interest
The authors declare no conflict of interest.
References
- Fercher, A.F.; Hitzenberger, C.K.; Kamp, G.; El-Zaiat, S.Y. Measurement of intraocular distances by backscattering spectral interferometry. Opt. Commun. 1995, 117, 43–48. [Google Scholar] [CrossRef]
- Nassif, N.; Cense, B.; Park, B.; Pierce, M.; Yun, S.; Bouma, B.; Tearney, G.; Chen, T.; de Boer, J. In vivo high-resolution video-rate spectral-domain optical coherence tomography of the human retina and optic nerve. Opt. Express 2004, 12, 367–376. [Google Scholar] [CrossRef] [PubMed]
- Leitgeb, R.; Hitzenberger, C.; Adolf, F. Performance of fourier domain vs. time domain optical coherence tomography. Opt. Express 2003, 11, 889–894. [Google Scholar] [CrossRef] [PubMed]
- Yun, S.; Tearney, G.; Bouma, B.; Park, B.; Johannes, D.B. High-speed spectral-domain optical coherence tomography at 1.3 mum wavelength. Opt. Express 2003, 11, 3598. [Google Scholar] [CrossRef] [PubMed]
- Daguang, X.; Namrata, V.; Yong, H.; Kang, J.U. Modified compressive sensing optical coherence tomography with noise reduction. Opt. Lett. 2012, 37, 4209–4211. [Google Scholar] [CrossRef]
- Xuan, L.; Kang, J.U. Compressive SD-OCT: The application of compressed sensing in spectral domain optical coherence tomography. Opt. Express 2010, 18, 22010–22019. [Google Scholar] [CrossRef]
- Luo, S.; Qiang, G.; Hui, Z.; Xin, A.; Li, H. Noise Reduction of Swept Source Optical Coherence Tomography via Compressed Sensing. IEEE Photonics J. 2017, 10, 1. [Google Scholar] [CrossRef]
- Daguang, X.; Yong, H.; Kang, J.U. GPU-accelerated non-uniform fast Fourier transform-based compressive sensing spectral domain optical coherence tomography. Opt. Express 2014, 22, 14871–14884. [Google Scholar] [CrossRef][Green Version]
- Fang, L.; Li, S.; Nie, Q.; Izatt, J.A.; Toth, C.A.; Farsiu, S. Sparsity based denoising of spectral domain optical coherence tomography images. Biomed. Opt. Express 2012, 3, 927–942. [Google Scholar] [CrossRef]
- Yi, L.; Sun, L. Full-depth compressive sensing spectral-domain optical coherence tomography based on a compressive dispersion encoding method. Appl. Opt. 2018, 57, 9316–9321. [Google Scholar] [CrossRef]
- Daguang, X.; Yong, H.; Kang, J.U. Real-time compressive sensing spectral domain optical coherence tomography. Opt. Lett. 2014, 39, 76–79. [Google Scholar] [CrossRef]
- Evgeniy, L.; Mackenzie, P.J.; Sarunic, M.V.; Mirza Faisal, B. Rapid volumetric OCT image acquisition using compressive sampling. Opt. Express 2010, 18, 21003–21012. [Google Scholar]
- Xu, D.; Huang, Y.; Kang, J.U. Volumetric (3D) compressive sensing spectral domain optical coherence tomography. Biomed. Opt. Express 2014, 5, 3921. [Google Scholar] [CrossRef] [PubMed]
- Mei, Y.; Lebed, E.; Jian, Y.; Mackenzie, P.J.; Beg, M.F.; Sarunic, M.V. Real-time high-speed volumetric imaging using compressive sampling optical coherence tomography. Biomed. Opt. Express 2011, 2, 2690–2697. [Google Scholar]
- Ireneusz, G.; Michalina, G.; Maciej, S.; Iwona, G.; Daniel, S.; Susana, M.; Andrzej, K.; Maciej, W. Anterior segment imaging with Spectral OCT system using a high-speed CMOS camera. Opt. Express 2009, 17, 4842–4858. [Google Scholar]
- Marks, D.L.; Ralston, T.S.; Boppart, S.A.; Scott, C.P. Inverse scattering for frequency-scanned full-field optical coherence tomography. J. Opt. Soc. Am. A 2015, 24, 1034–1041. [Google Scholar] [CrossRef] [PubMed]
- Ralston, T.S.; Marks, D.L.; Carney, P.S.; Boppart, S.A. Interferometric synthetic aperture microscopy. Nat. Phys. 2007, 3, 129–134. [Google Scholar] [CrossRef]
- Davis, B.J.; Schlachter, S.C.; Marks, D.L.; Ralston, T.S.; Boppart, S.A.; Scott, C.P. Nonparaxial vector-field modeling of optical coherence tomography and interferometric synthetic aperture microscopy. J. Opt. Soc. Am. A 2007, 24, 2527. [Google Scholar] [CrossRef]
- Yang, X.; Kai Benjamin, C.X.; Adie, S.G.; Boppart, S.A.; Scott, C.P. Multifocal interferometric synthetic aperture microscopy. Opt. Express 2013, 22, 16606–16618. [Google Scholar]
- Xu, Y.; Liu, Y.Z.; Boppart, S.A.; Scott, C.P. Automated interferometric synthetic aperture microscopy and computational adaptive optics for improved optical coherence tomography. Appl. Opt. 2016, 55, 2034. [Google Scholar] [CrossRef]
- Wachulak, P.; Bartnik, A.; Fiedorowicz, H. Optical coherence tomography (OCT) with 2 nm axial resolution using a compact laser plasma soft X-ray source. Sci. Rep. 2018, 8, 8494. [Google Scholar] [CrossRef] [PubMed]
- Yi, L.; Sun, L.; Ding, W. Multifocal spectral-domain optical coherence tomography based on Bessel beam for extended imaging depth. J. Biomed. Opt. 2017, 22, 106016. [Google Scholar]
- Davis, B.J.; Marks, D.L.; Ralston, T.S.; Carney, P.S.; Boppart, S.A. Interferometric Synthetic Aperture Microscopy: Computed Imaging for Scanned Coherent Microscopy. Sensors 2008, 8, 3903–3931. [Google Scholar] [CrossRef] [PubMed]
- Candes, E.J.; Romberg, J.; Tao, T. Robust uncertainty principles: Exact signal reconstruction from highly incomplete frequency information. IEEE Trans. Inf. Theory 2006, 52, 489–509. [Google Scholar] [CrossRef]
© 2019 by the authors. Licensee MDPI, Basel, Switzerland. This article is an open access article distributed under the terms and conditions of the Creative Commons Attribution (CC BY) license (http://creativecommons.org/licenses/by/4.0/).