Article

Characteristics and Processing of Hydrogen-Treated Copper Powders for EB-PBF Additive Manufacturing

1
Center for Additive Manufacturing and Logistics, Edward P. Fitts Department of Industrial and Systems Engineering, North Carolina State University, Raleigh, NC 27695, USA
2
RadiaBeam, Santa Monica, CA 90404, USA
3
SLAC National Accelerator Laboratory, Technology Innovation Directorate, Menlo Park, CA 94025, USA
4
Center for Additive Manufacturing and Logistics, Department of Mechanical and Aerospace Engineering, Consortium on the Properties of Additive Manufactured Copper, North Carolina State University, Raleigh, NC 27695, USA
*
Authors to whom correspondence should be addressed.
Appl. Sci. 2019, 9(19), 3993; https://doi.org/10.3390/app9193993
Submission received: 16 August 2019 / Revised: 12 September 2019 / Accepted: 19 September 2019 / Published: 24 September 2019

Abstract

:
The fabrication of high purity copper using additive manufacturing has proven difficult because of oxidation of the powder feedstock. Here, we present work on the hydrogen heat treatment of copper powders for electron beam powder bed fusion (EB-PBF), in order to enable the fabrication of high purity copper components for applications such as accelerator components and vacuum electronic devices. Copper powder with varying initial oxygen contents were hydrogen heat-treated and characterized for their chemistry, morphology, and microstructure. Higher initial oxygen content powders were found to not only reduce surface oxides, but also reduce oxides along the grain boundaries and form trapped H2O vapor inside the particles. The trapped H2O vapor was verified by thermogravimetric analysis (TGA) and residual gas analysis (RGA) while melting. The mechanism of the H2O vapor escaping the particles was determined by in-situ SEM heated stage experiments, where the particles were observed to crack along the grain boundaries. To determine the effect of the EB-PBF processing on the H2O vapor, the thermal simulation and the validation of single melt track width wafers were conducted along with melting single layer discs for chemistry analysis. A high speed video of the EB-PBF melting was performed in order to determine the effect of the trapped H2O vapor on the melt pool. Finally, solid samples were fabricated from hydrogen-treated copper powder, where the final oxygen content measured ~50 wt. ppm, with a minimal residue hydrogen content, indicating the complete removal of trapped H2O vapor from the solid parts.

1. Introduction

Applications including particle accelerators and vacuum electronic devices (VEDs) require materials with the highest electrical and thermal conductivity, as well as ultra-high vacuum compatibility. The copper used in these applications approaches the theoretical maximum achievable quality in terms of the purity, density, and metallurgical properties, such as crystallographic texture and grain size. These applications also require intricate designs and extensive metallurgical processing routes, followed by the assembly and brazing or welding of multiple components into a final part. The consolidation of the component assemblies into complex monolithic parts, and the potential for novel designs achievable through additive manufacturing (AM), is desired in order to reduce the cost and improve the component performance and reliability [1,2,3,4,5]. The underlying challenges associated with the AM of high-purity copper, particularly for electron beam powder bed fusion (EB-PBF) and laser powder bed fusion (L-PBF), have been discussed in several recent studies [1,6,7,8,9,10,11]. The high thermal conductivity of copper rapidly removes heat from the melt pool, promoting high local and global thermal gradients; residual stress accumulation; and distortion, which is exacerbated by the significant difference in thermal conductivity between the consolidated material and the surrounding powder bed [12,13,14]. The resulting rapid solidification of the melt pool, coupled with the low viscosity of molten copper, also tends to retain defects such as keyhole porosity [15]. Additionally, the low absorptivity of copper for the lasers used in many commercial L-PBF systems (~1060 nm wavelength) necessitates the use of high-power lasers increasing the recoil pressure, vaporization, spatter, and related defects [16]. However, even with these challenges, several promising results have been reported with densities ranging above 99.95% for non-electronic grade copper [1,7,8,9] for EB-PBF, and 96.6% for Nd:YAG fiber laser AM processing [17,18,19,20,21,22,23].
Despite the progress, achieving the high purity requirements for copper using AM has remained a significant challenge. For accelerator applications, copper typically needs to meet or exceed that of ASTM F68 for Class 1 oxygen free electronic (OFE) copper, which is 0.15176 ohms g/m2 or 101.0% of the minimum International Annealed Copper Standard (IACS) at 20 °C [24]. The maximum oxygen content for OFE copper is 0.0005 wt% (5 wt. ppm). The negative influence of oxygen contamination on the electrical, thermal, and mechanical properties of copper is small, but not insignificant. The incoherent Cu2O found along the grain boundaries has an effect similar to porosity, and less of an influence on electron scattering than the solute contamination that strains the copper lattice. For instance, electrolytic tough pitch (ETP) copper has an oxygen content of ~0.04% (400 ppm) and typically exceeds 100–101% IACS [24,25,26]. Much more significant is the adverse effect of embrittlement in the copper components caused by an excessive oxygen content during the downstream hydrogen brazing processes [27]. It should be noted that the copper AM literature has either resulted in specimens with a high oxygen content (similar to ETP Cu), or has not reported an oxygen content in the fabricated samples. Of chief concern is the powder feedstock purity. The powder feedstock commonly used in AM is subject to oxygen contamination during handling, screening, loading, and transport after atomization. At ambient conditions, the oxygen solubility in pure copper is less than 2 wt. ppm [24,28], where the excess oxygen reacts to form cuprous oxide, Cu2O, as a non-passivating surface film or along the grain boundaries. At higher temperatures (>300 °C), cupric oxide (CuO) and other variants may also form [29,30].
This poses a unique obstacle for the copper powder used in AM, which is typically produced by nitrogen gas atomization, and quickly oxidizes if exposed to ambient conditions at any point in the powder fabrication and handling process. Because of the very high surface area of these small diameter particles, the relative contribution of oxygen from the surface oxide film typically causes the feedstock to exceed 400–600 wt. ppm oxygen. For example, in their study on the EB-PBF fabrication of copper, Raab et al. [7], Lodes et al. [8], and Guschlbauer et al. [9] utilize copper powder feedstocks with reported purities of 99.90 wt%, 99.94 wt%, and 99.95 wt%, respectively, while Frigola et al. [1] and Ramirez et al. [10] used powders with 99.99 wt% and 99.80 wt% purity, respectively. In our preliminary studies, a chemical analysis conducted directly after the powder atomization process, and after the screening, indicates that much of the oxygen pickup in the copper powder occurs during the handling, screening, and packaging processes, which are typically carried out in ambient atmosphere.
Preserving even these oxygen contents during the AM melting and solidification process is extremely challenging, and requires near perfect conditions, as imperfect inert or vacuum atmospheres, moisture absorption, complex thermal cycles, powder recycling, and storage exacerbate oxygen pickup. Frigola et al. [1] showed a significant oxidation of feedstock powders after several EB-PBF reuse cycles. Once the oxygen contamination is present in the powder feedstock as oxide films or grain boundary particles, the contamination is directly transferred to the fabricated AM components [11]. This combination of factors hinders the fabrication of quality copper components by most powder bed AM processes.
Reduction processes may be employed in order to improve the copper feedstock purity for AM processing. Hydrogen, carbon monoxide, and ethanol are commonly employed reducing agents of Cu2O and CuO in thin films [31,32,33]. El-Wardany et al. [6] treated copper powders for L-PBF in a heated forming gas atmosphere (4% H2 + Ar bal.), theorizing that the hydrogen would reduce the surface Cu2O films into Cu + H2O, however, no quantitative data on the composition of the powders or solid samples produced were provided [6]. In addition, this study only considered the reduction of oxides from the surface of the Cu powders, and did not address the possibility that hydrogen also reduces the internal oxides. Previous work has shown that the diffusivity of hydrogen in copper is high at elevated temperatures (e.g., ~9.58 m/s2 at 400 °C) [34], and that at temperatures above about 400 °C, hydrogen reduces the grain boundary oxides, forming H2O gas. The larger H2O molecules do not diffuse, and the resulting pressure forms high pressure steam pores along the grain boundaries [28,35,36]. This well-known embrittlement mechanism is considered detrimental for most traditional copper powder processing routes because of their significant impacts on downstream processing, such as swelling, porosity, and embrittlement, through plastic deformation, work hardening, the reduction of grain boundary area, and material failure at elevated temperatures [28,36,37,38], as Lin and Hwang demonstrated with the swelling and cracking of copper powders during the sintering of copper heat pipes [36].
On the other hand, PBF processes utilize thin layers of powder, which are spread over a substrate and selectively melted by a focused energy source. In the present work, we hypothesize that this localized processing can be leveraged to liberate the retained H2O from the hydrogen heat-treated copper powder during melting on a layer-by-layer basis. This results in a significantly higher copper purity, without the detrimental effects of embrittlement observed in traditional powder metal processes.
Here, the mechanisms for H2O removal from copper powders is identified through a series of experiments, one building upon the next. First, copper powders of varying initial oxygen contents were treated in a hydrogen atmosphere at elevated temperatures. The temperature that H2O escapes from these copper powders was determined using thermogravimetric analysis. The powder cracking during H2O released at these temperatures was observed directly using a scanning electron microscope (SEM) equipped with a heated stage. We confirm the release of H2O in a single layer melt in a custom EB-PBF setup using residual gas analysis (RGA), and the subsequent chemical analysis of the melted layers. The single melt pool wide thin walled wafers produced with multiple layers of varying hatch spacings confirm the H2O release from the copper powder in the heated affected zone of the melt pool, and high-speed videos of these melt pools also show that a proportion of this H2O escapes from the molten during melting. The efficacy of this approach is validated with the fabrication of fully dense parts, and multi-layer samples with a very low oxygen content, with RGA monitoring of H2O outgassing on a layer by layer basis.

2. Materials and Methods

The experiments were performed in order to understand the influence of a hydrogen heat treatment on copper powder feedstocks of varying initial oxygen contents. We evaluated three levels of oxygen content, with and without hydrogen heat treatment. To generate these six conditions, the following methodology was used.
Two separate batches of nitrogen gas atomized copper powder were acquired. For the purposes of this discussion, the powders were categorized based on the initial measured oxygen content. The lowest oxygen content powder received was between 100–200 wt. ppm oxygen, and is referred to as low oxygen copper (LO-Cu). The second powder batch with 400–700 wt. ppm oxygen is referred to as medium oxygen content powder (MO-Cu). A selected amount of the received MO-Cu powder was intentionally oxidized to above 1000 wt. ppm oxygen, and is referred as high oxygen content copper (HO-Cu).

2.1. Feedstock Preparation

Spherical MO-Cu powder was received with a nominal 15–53 µm particle size distribution (d10–d90), smaller than what is typical for other materials used in EB-PBF (e.g., Ti6Al4V). Nevertheless, it is consistent with previous studies in copper AM by our group [4], and compared to early work by our group and others, also results in a significantly reduced surface roughness [1]. In order to maintain a comparatively low oxygen content in the LO-Cu powder, special consideration was given to the packaging, handling, and screening steps post atomization. This powder was received in the as-atomized (−250 µm) condition, directly from the manufacturer, and screened to a nominal 15–53 µm particle size distribution within an argon glove box. To generate the HO-Cu powder, a methodology similar to that of Nieh and Nix [28,30] was utilized. A portion of MO-Cu was treated at 150 °C for 1 h in one atmosphere of air, and cooled at a rate of 5 °C per minute. The temperature was kept lower in the current study, compared with the 800 °C used by Nieh and Nix, to prevent the sintering of the small powder size distribution. Given that the diffusion of oxygen in copper is 2e−11 m2/s at 400 °C [39], the oxygen penetration depth exceeded the particle diameters used in this study during the 2-h treatment, which is confirmed by subsequent focused ion beam (FIB) sectioning of individual powder particles.
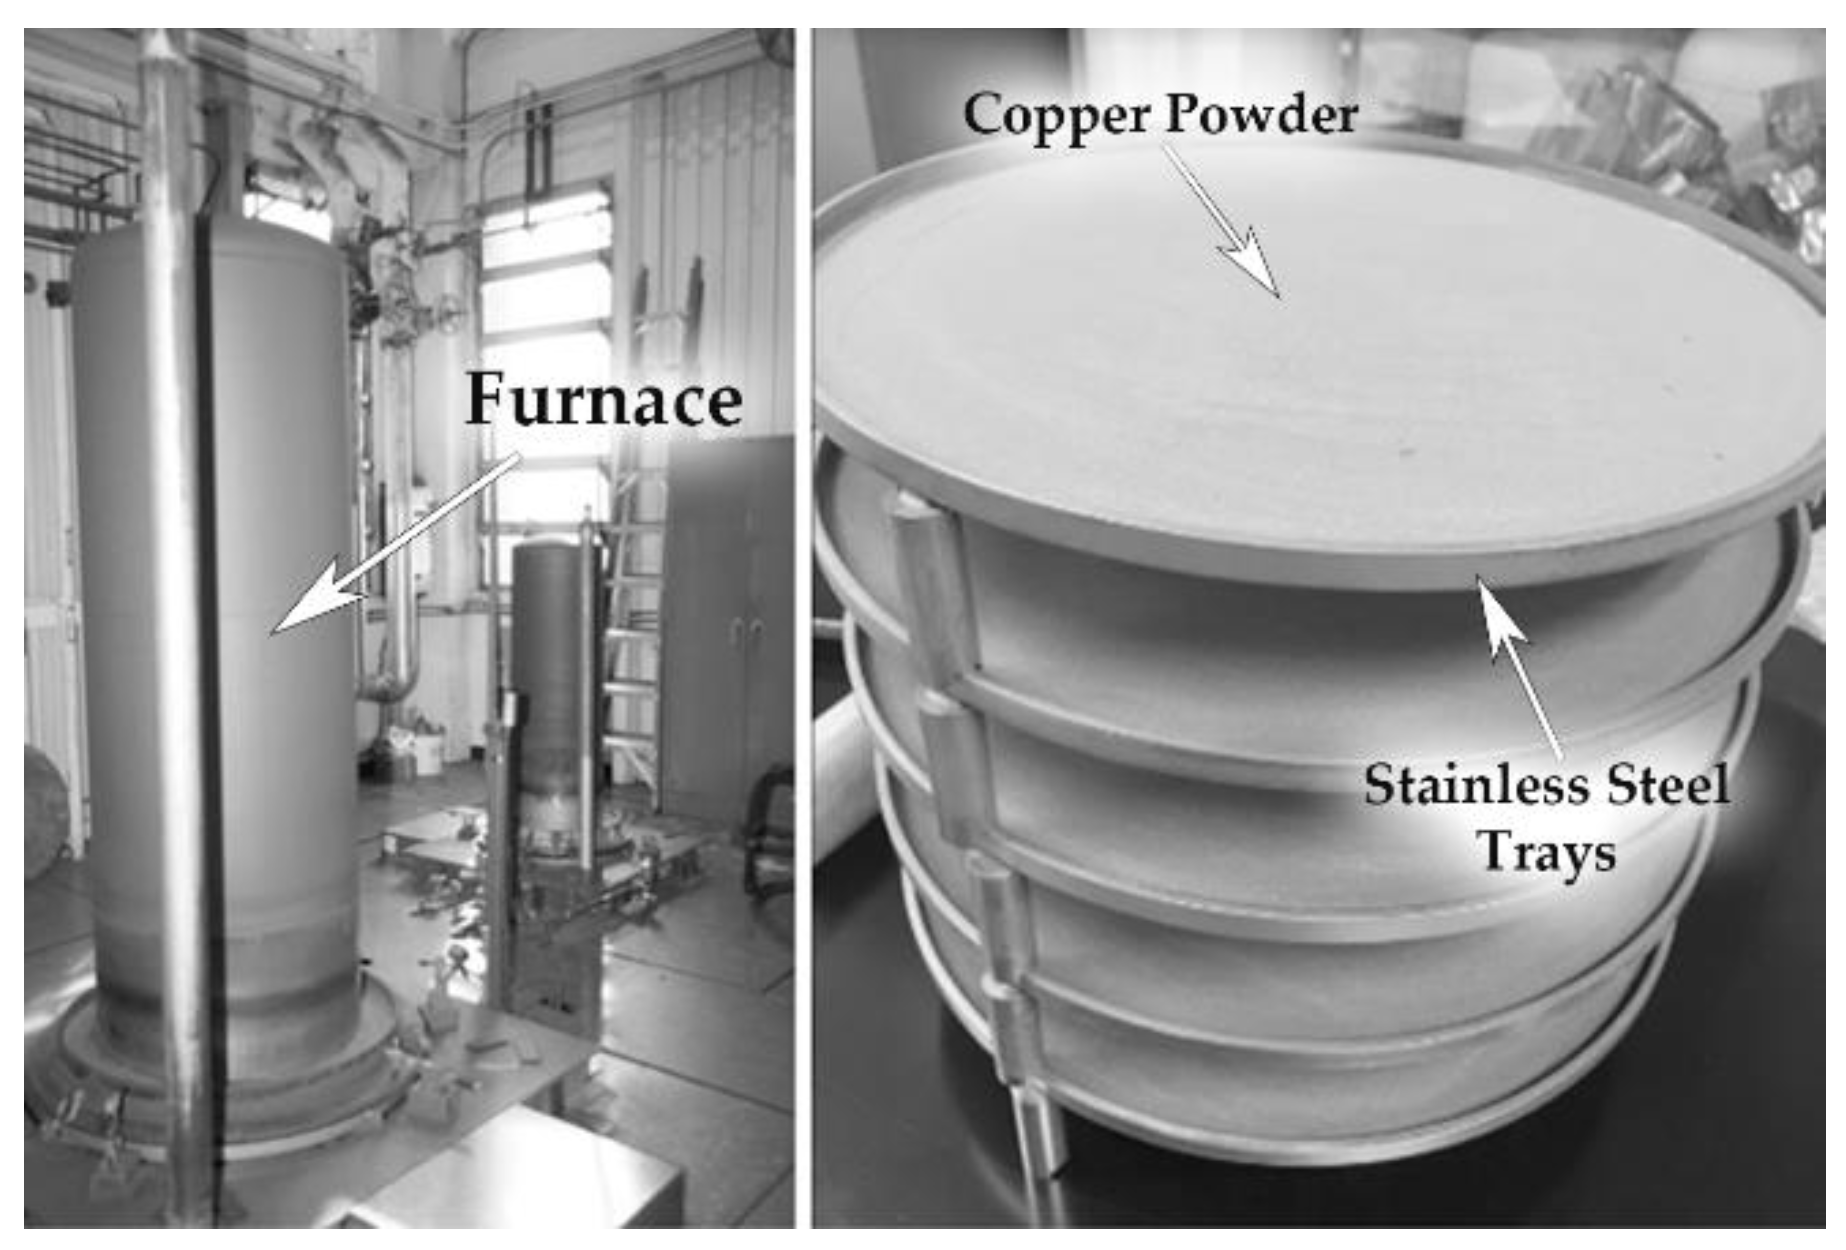
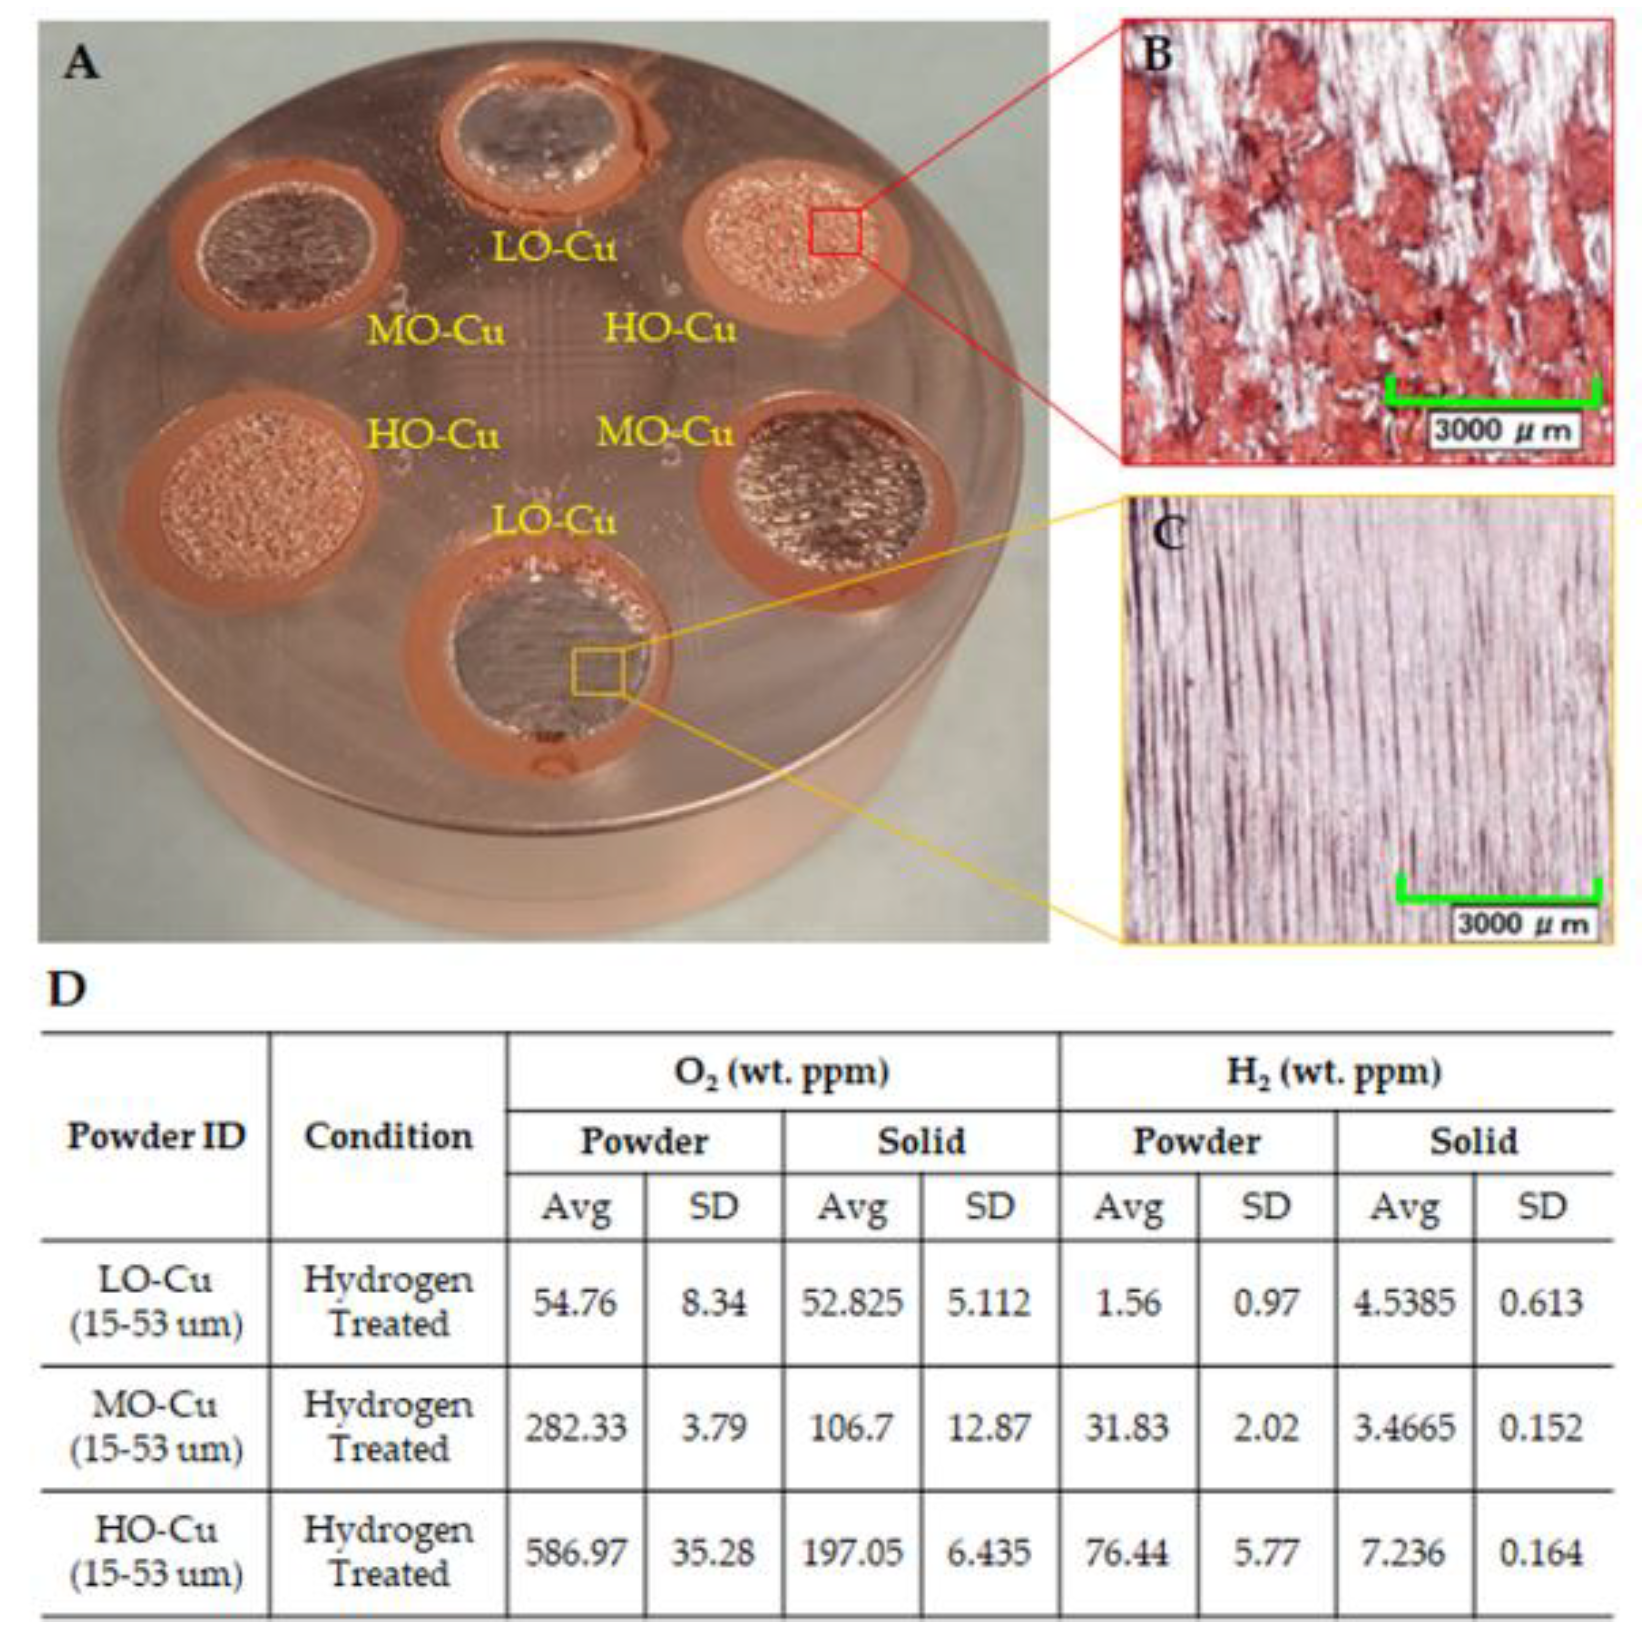
Portions of the powder from each of the three batches, LO-Cu, MO-Cu, and HO-Cu, were then exposed to hydrogen treatment at 400 °C for 4 h under one atmosphere of flowing pure hydrogen, and cooled at a rate of 5 °C per minute in a dry hydrogen atmosphere heating cover retort furnace. A custom stainless-steel fixture comprised of stacked circular trays allowed the processing of 1 kg of powder per treatment cycle in 2 mm thick layers, as shown in Figure 1. To avoid oxygen contamination after hydrogen treatment, the powders were packed in vacuum-sealed foil bags after purging with dry nitrogen. The vacuum bags were then sealed in a second bag filled with dry nitrogen. All of the copper powders were subsequently stored, handled, and sampled in an argon or nitrogen atmosphere.

2.2. Feedstock Characterization

Each of the three powder conditions were characterized before and after hydrogen treatment, for size distribution by laser diffraction (Microtrac S3500, Microtrac Inc., Montgomeryville, PA, USA), and density by helium pycnometry (ASTM B923-16, Quantachrome MicroUltrapyc 1200e, Quantachrome Instruments, Boynton Beach, Florida, USA). The oxygen and hydrogen content of all the powders were quantified by inert gas fusion analysis (LECO OHN836, LECO, St. Joseph, MI, USA). The reported values herein were acquired immediately prior to the experiments. The powder morphology was characterized by a JOEL 6010LA scanning electron microscope (JEOL USA, Inc., Peabody, MA, USA). An additional powder characterization was performed on individual powder particles using focused ion beam (FIB) milling for the cross-sectional analysis by secondary electron and gallium ion contrast on a FEI Quanta 3D Field Emission Gun (FEG) (Thermo Fisher Scientific, Hillsboro, Oregon, USA). Scanning transmission electron microscopy (STEM) analysis and energy dispersive spectroscopy (EDS) were performed on a FEI Talos (Thermo Fisher Scientific, Hillsboro, Oregon, USA), to assess the chemical composition, size of surface, and internal oxide species.
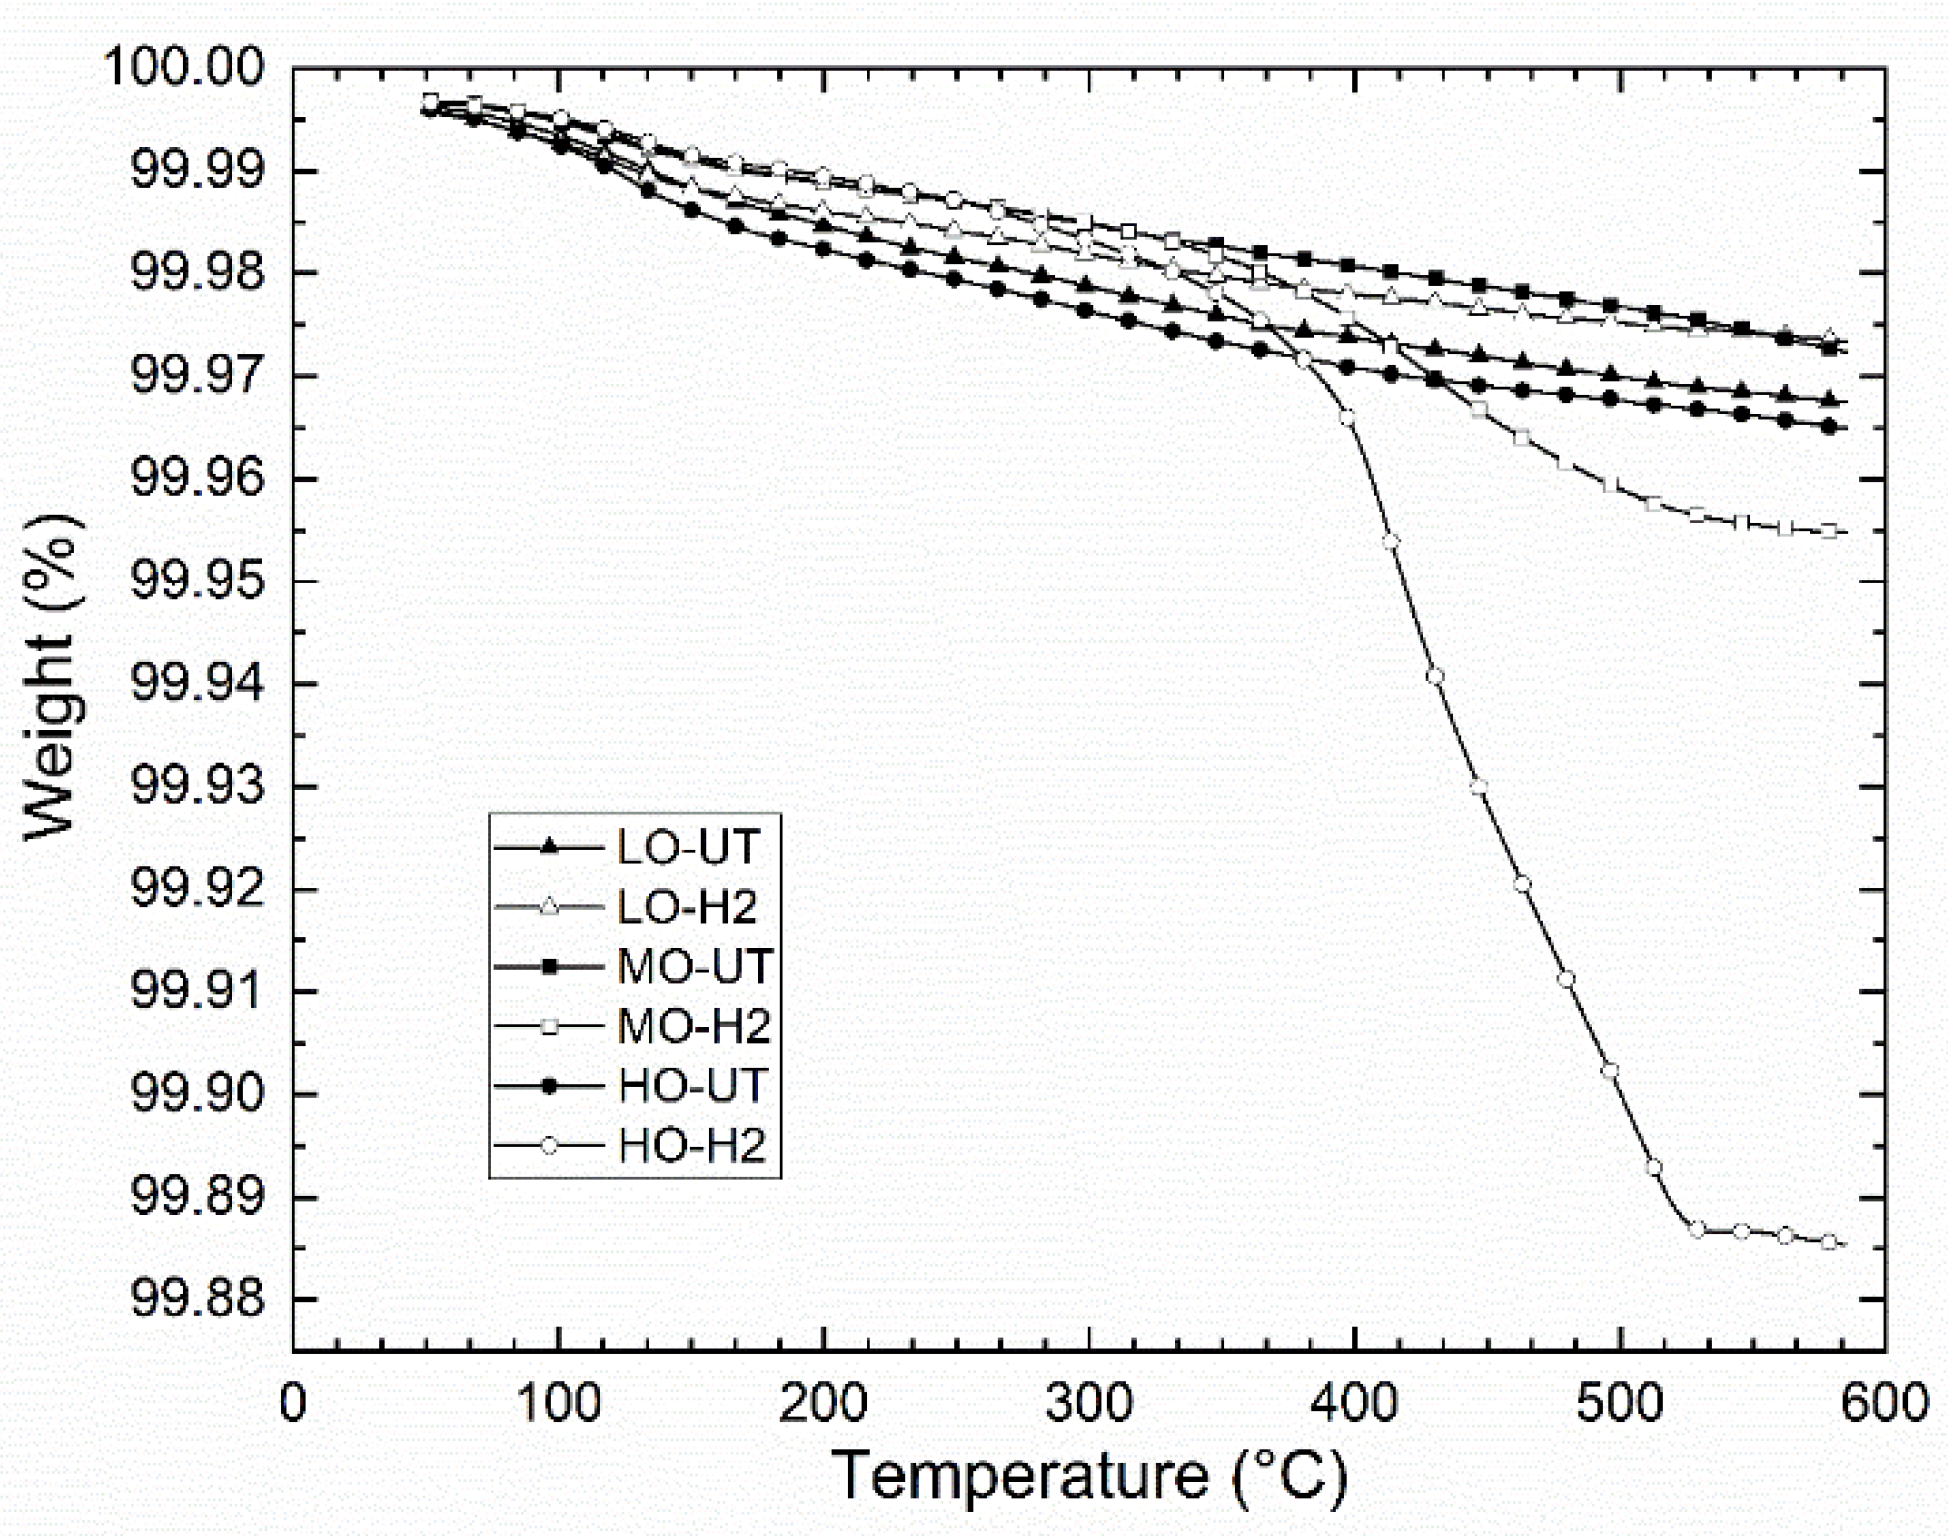
A thermogravimetric analysis (TGA) was performed using a TA SDT 650 Simultaneous Thermal Analyzer (TA Instruments, New Castle, DE, USA) under flowing nitrogen, while the samples were heated at 5 °C/s to 600 °C in an alumina sample holder in order to identify the temperature at which the H2O can escape from the treated copper powders.

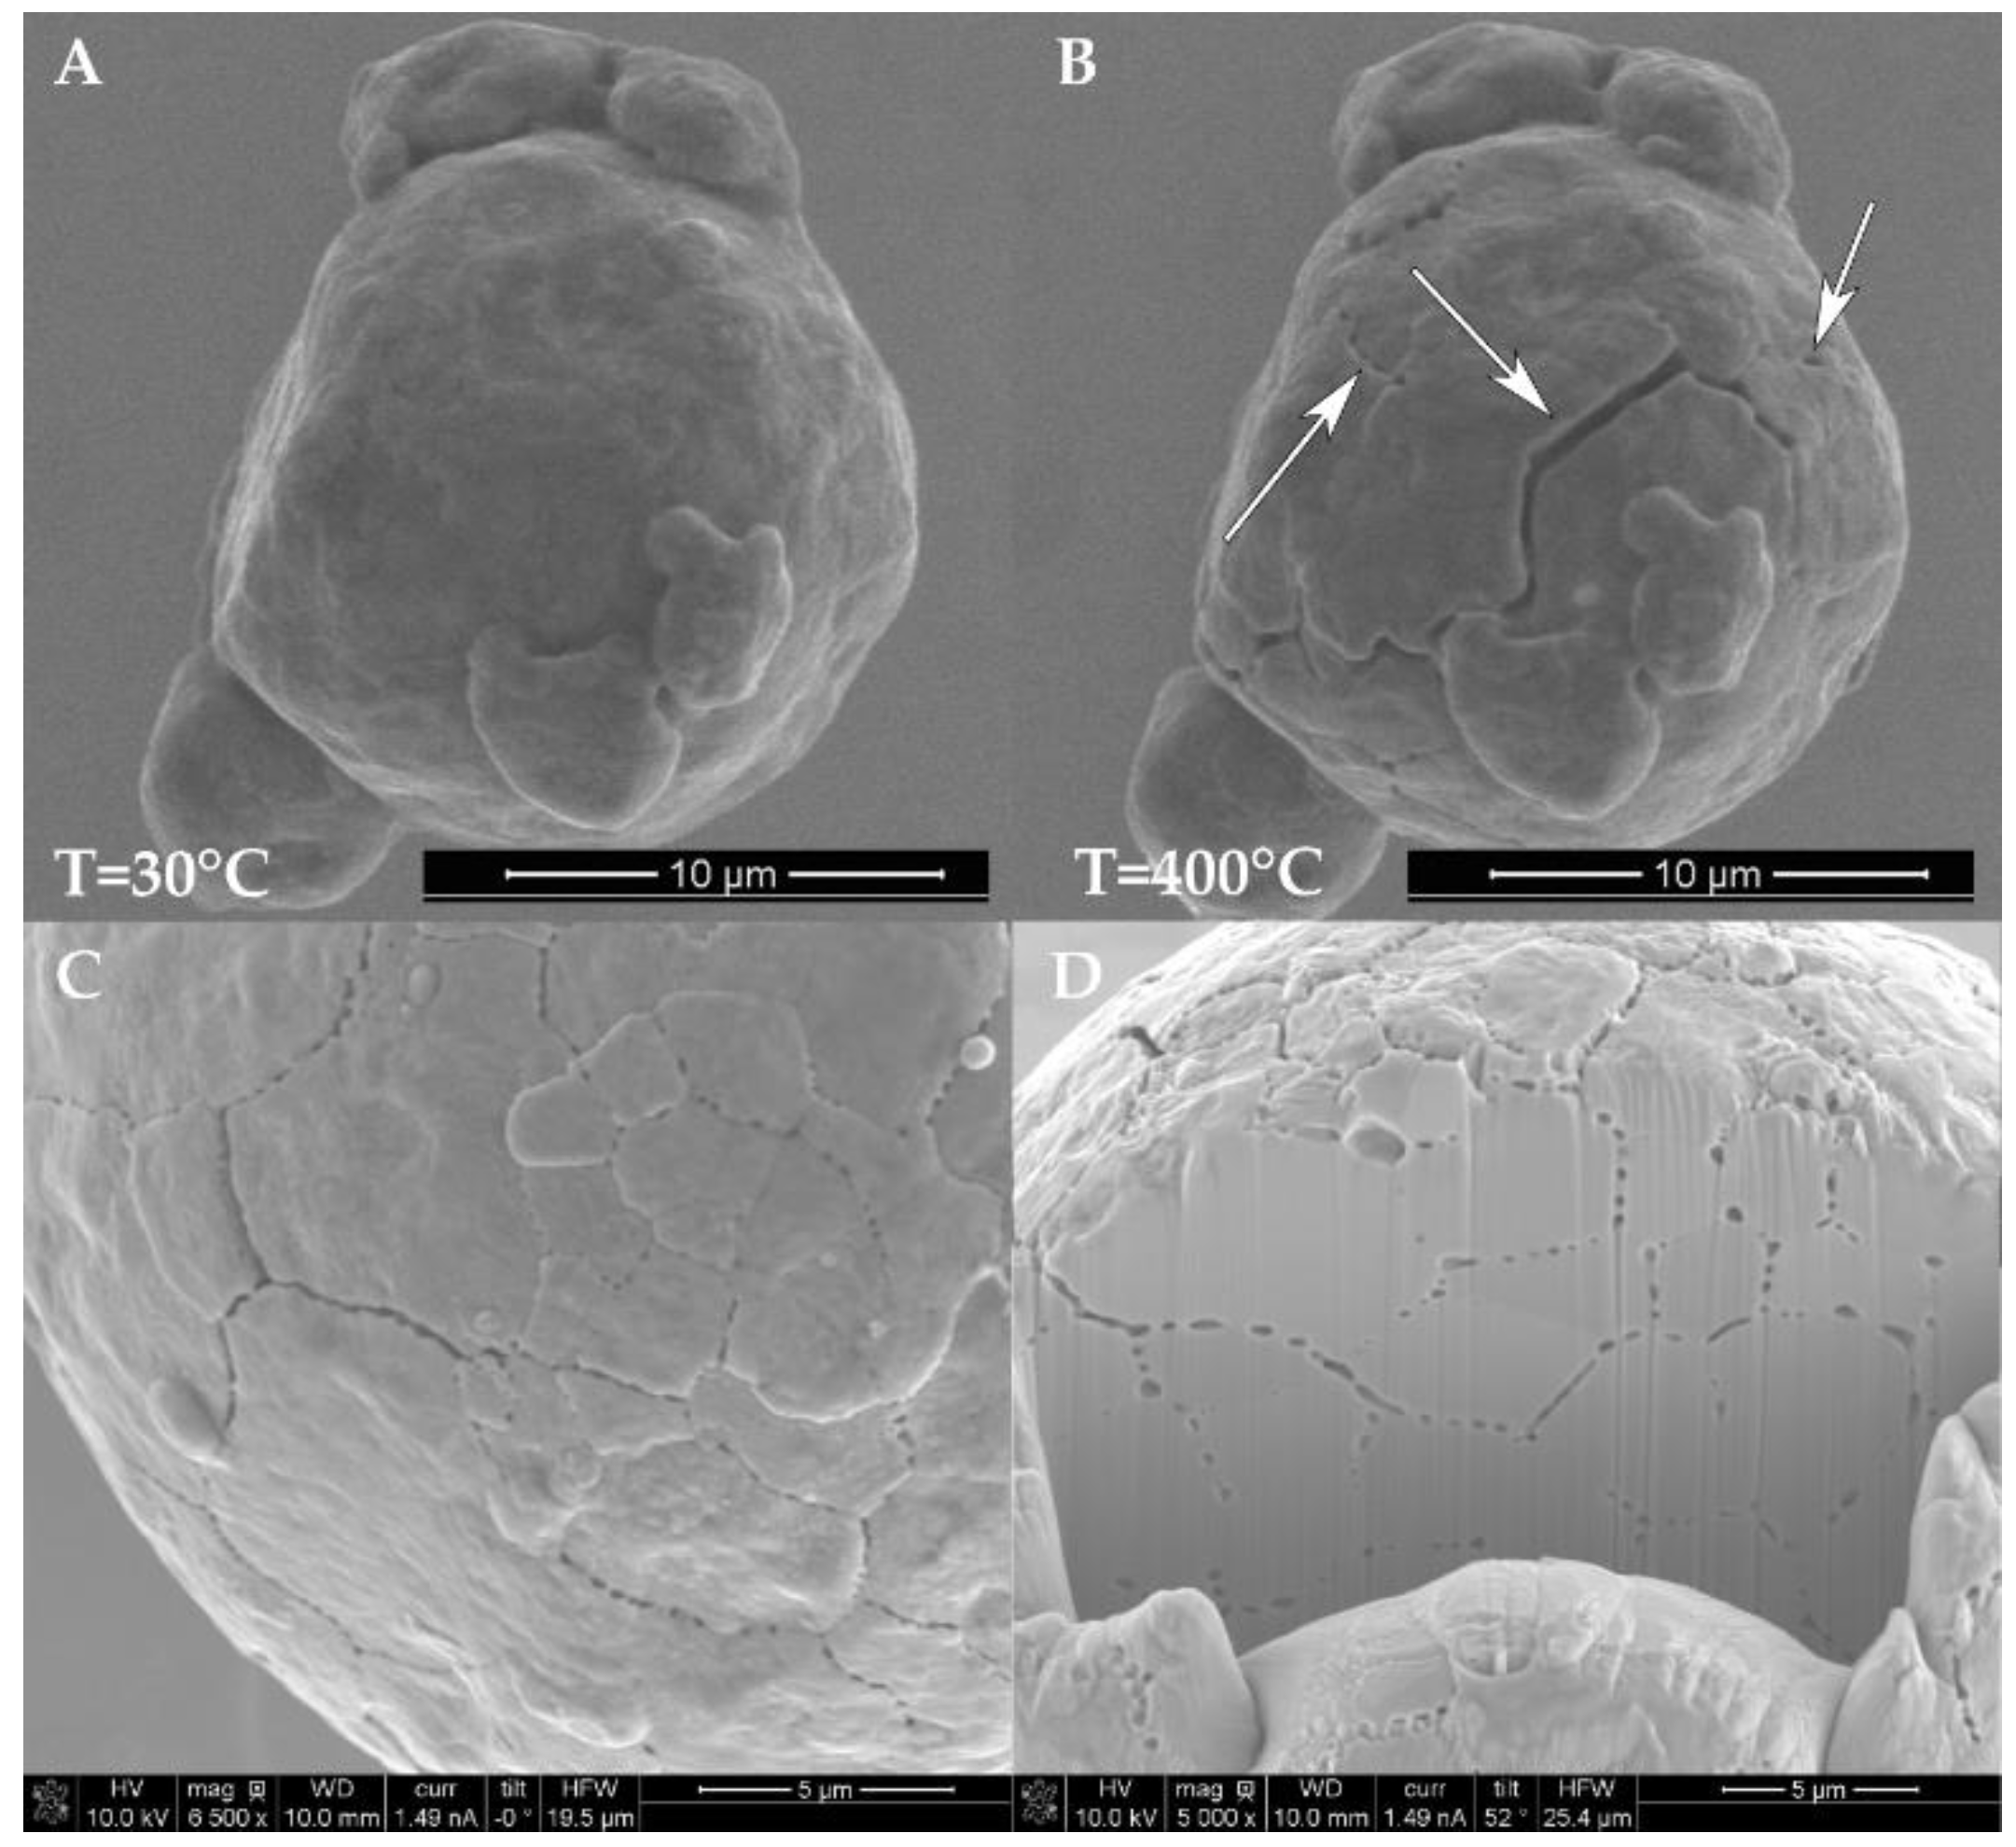
2.3. In-Situ Heated Stage

In-situ heated stage SEM degassing experiments were performed on a FEI Quanta 3D FEG so as to observe the mechanism of H2O gas release from a single copper powder particle. Both hydrogen heat treated copper particles and untreated copper particles were separated from the adjacent powder feedstock with a single fiber brush using a light microscope at 50× magnification. Individual powder particles were then placed onto a SiC heated stage (Protochips Fusion) for controlled heating under standard SEM operating conditions. The stage was ramped to a maximum temperature of 400 °C at 100 °C/s, and image sequences were made at 30 fps with secondary electron detectors.

2.4. Customized EB-PBF Platform

All of the electron beam melting (EBM) experiments were conducted using a customized Arcam A2 EB-PBF system (Arcam Build Control Software V3.2, SP2, Arcam AB, Sweden). While the EB-PBF operation and process parameters have been described in detail elsewhere [40], it is important to highlight that in this work, the internal components of the commercial system have been removed and replaced with a custom 304 stainless steel build tank, platform, and powder feeder system. The customized chamber was designed with viewports that are oriented radially about the vertical axis of the electron beam column at a 55° angle to the surface of the experimental substrate/fixture, in order to view the entire build surface. The experiments were monitored with by an emissivity corrected single color pyrometer (Fluke Process Endurance Pyrometer, Fluke, Everett, WA, USA), a visible light camera (Nikon D7000, Nikon, Melville, NY, USA), a 200-amu residual gas analyzer (Stanford Research Systems, Sunnyvale, CA, USA), and an IR thermal imaging camera (FLIR A655sc, FLIR, Wilsonville, OR, USA). The viewport window materials varied as a function of the transmittance requirements for each instrument. Figure 2 shows a photograph of the customized setup.

2.5. Simulation and Validation of Variable Spacing Single Melt Track Width Wafers

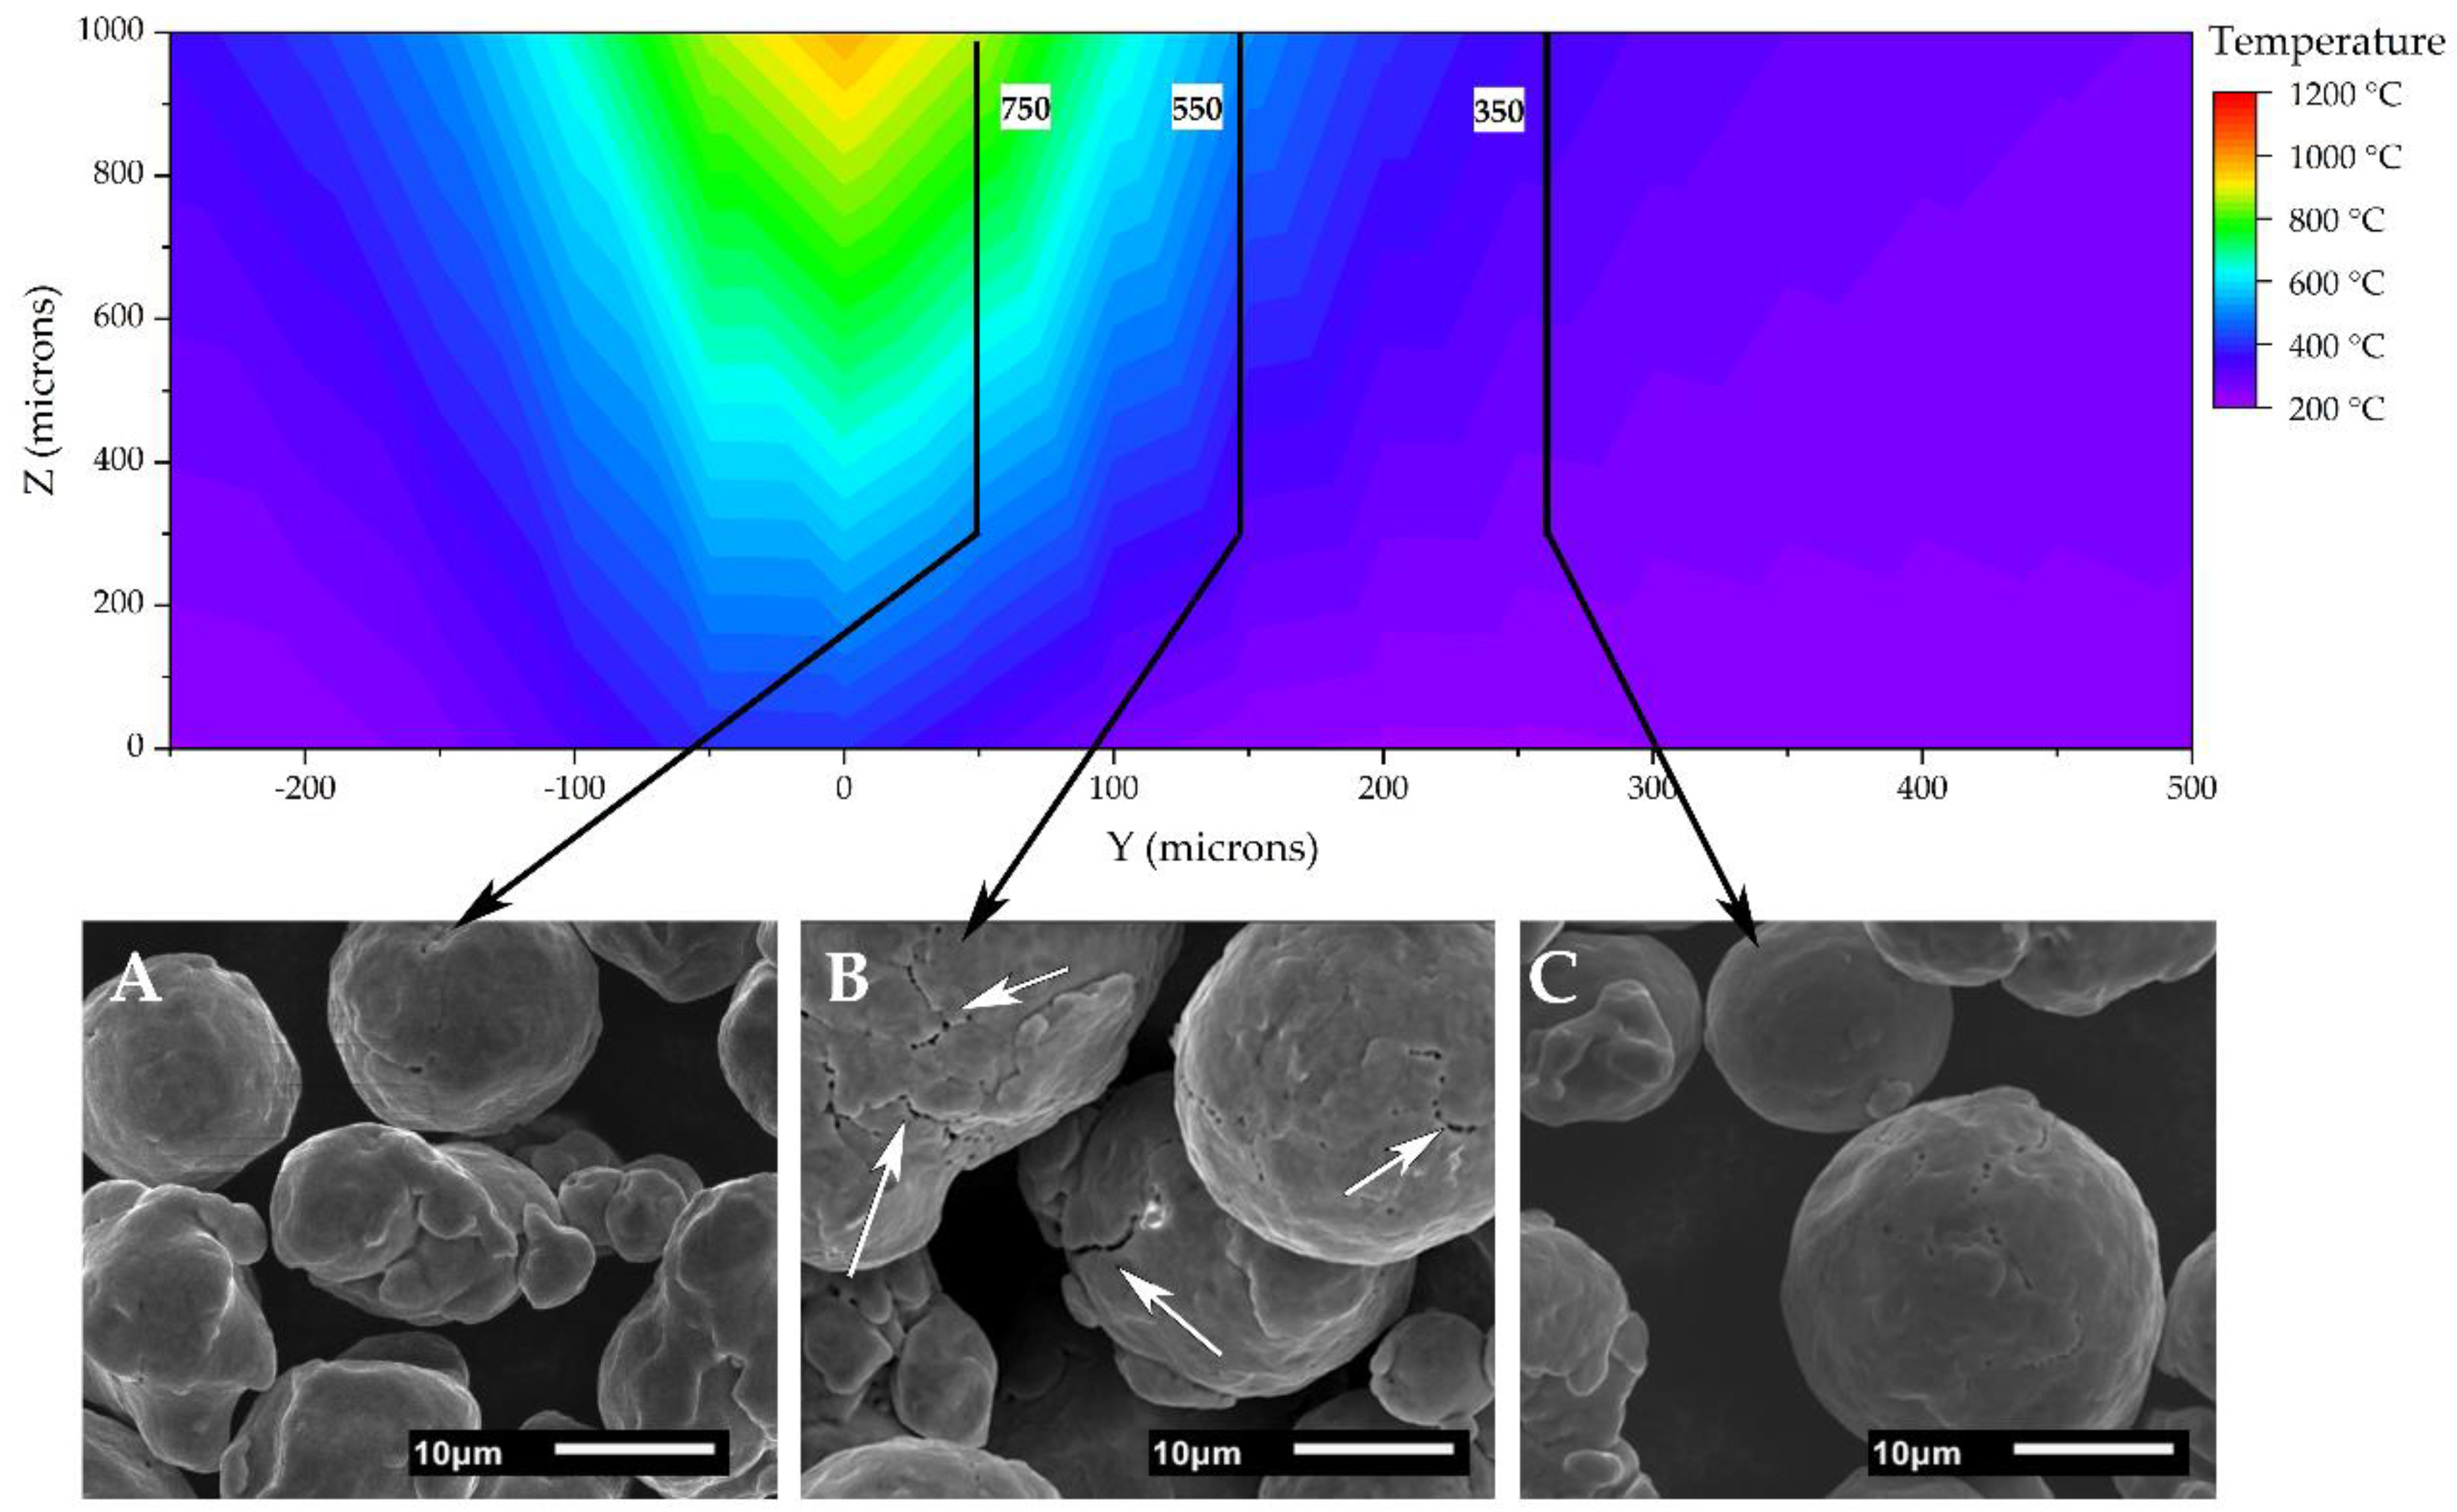
We hypothesized that during melting, H2O vapor escapes from both the liquid melt pool and from powder in the heat affected zone. For the powder adjacent to the melt pool, the internal pressure of the H2O vapor overcomes the mechanical strength of the grain boundary, and the pore begins to expand in size. This leads to the fracturing of the particle along the grain boundaries and a release of H2O vapor into the vacuum system. To explore this, single melt track width scenarios were simulated at various hatch spacings, utilizing the 3D transient heat transfer model developed by Lee et al. [41] at the Oak Ridge National Laboratory. Calculations were made using FEniCS software (2019.1.0, FEniCS), utilizing python scripts, and the thermal model output was analyzed using ParaView visualization software (v5.7, Kitware Inc., Clifton Park, NY, USA). The simulation used variables including heat input, beam speed, thermal conductivity, and so on, to model the EB-PBF process and the temperature profile across a solid plate with the thermophysical properties of a comparable copper powder bed during different operating conditions. The simulation variables used in this study are listed in Appendix A.
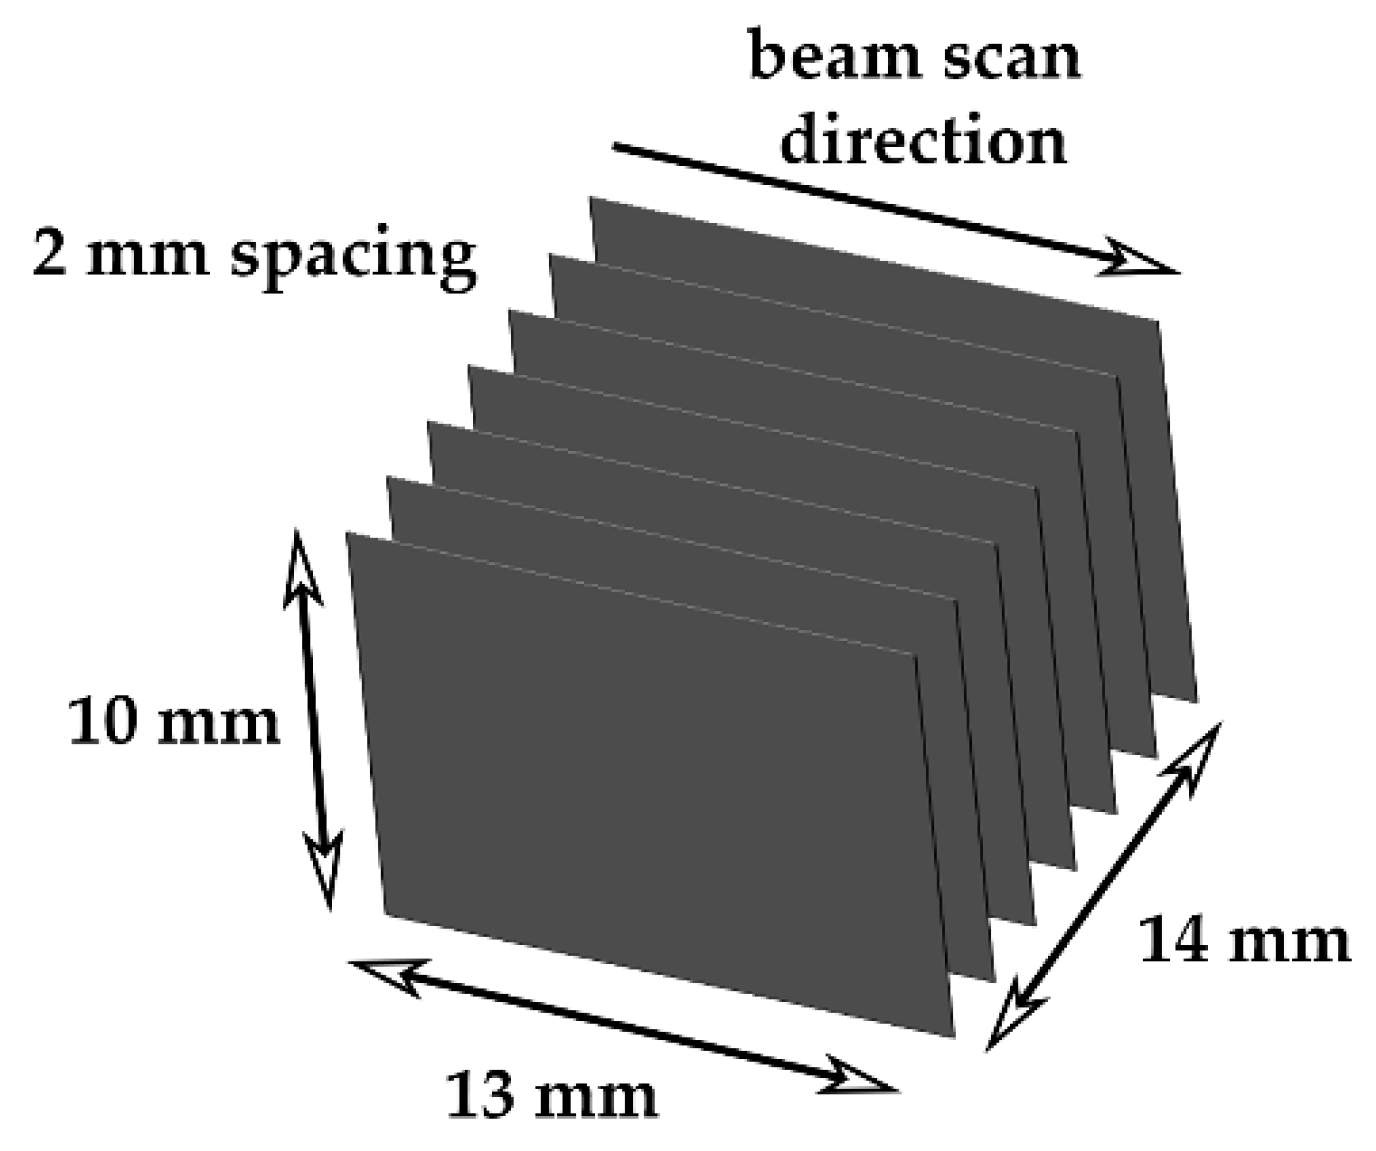
Based on the model results, single melt track width wafers 13 mm long and 10 mm tall were fabricated using hydrogen-treated HO-Cu powder with 2.0 mm on center spacings, as shown in Figure 3. The build substrate was a machined OFE copper substrate that measured 90 mm in diameter and 30 mm in thickness. During the EB-PBF processing, the build temperature was maintained at 270 °C, measured by a thermocouple attached to the bottom of the plate, and the partial pressures of H2O vapor and other gas species were monitored using the RGA. Each wafer was melted with a line energy of 0.8 J/mm (600 mm/s, 8 mA, 0 mA focus offset) and layer thickness of 40 µm, with the power analyze function (Arcam specific thermal controls) disabled. The beam scan direction was constant (right to left) for each wafer and each layer.
Upon the build completion, each block of wafers was removed from the surrounding sintered powder and build surface using a razor blade. The sintered powder cake between the solid wafers was serially sectioned with a razor blade as a function of the distance from the melt pool, and placed on carbon tape for the SEM analysis. Additionally, the top surface of the intact sintered cake was analyzed on a JOEL 6010LA, in order to observe sintered powder characteristics at specific distances from the melt track.

2.6. EB-PBF Processing of Hydrogen-Treated Copper Powder

To directly observe and quantify the H
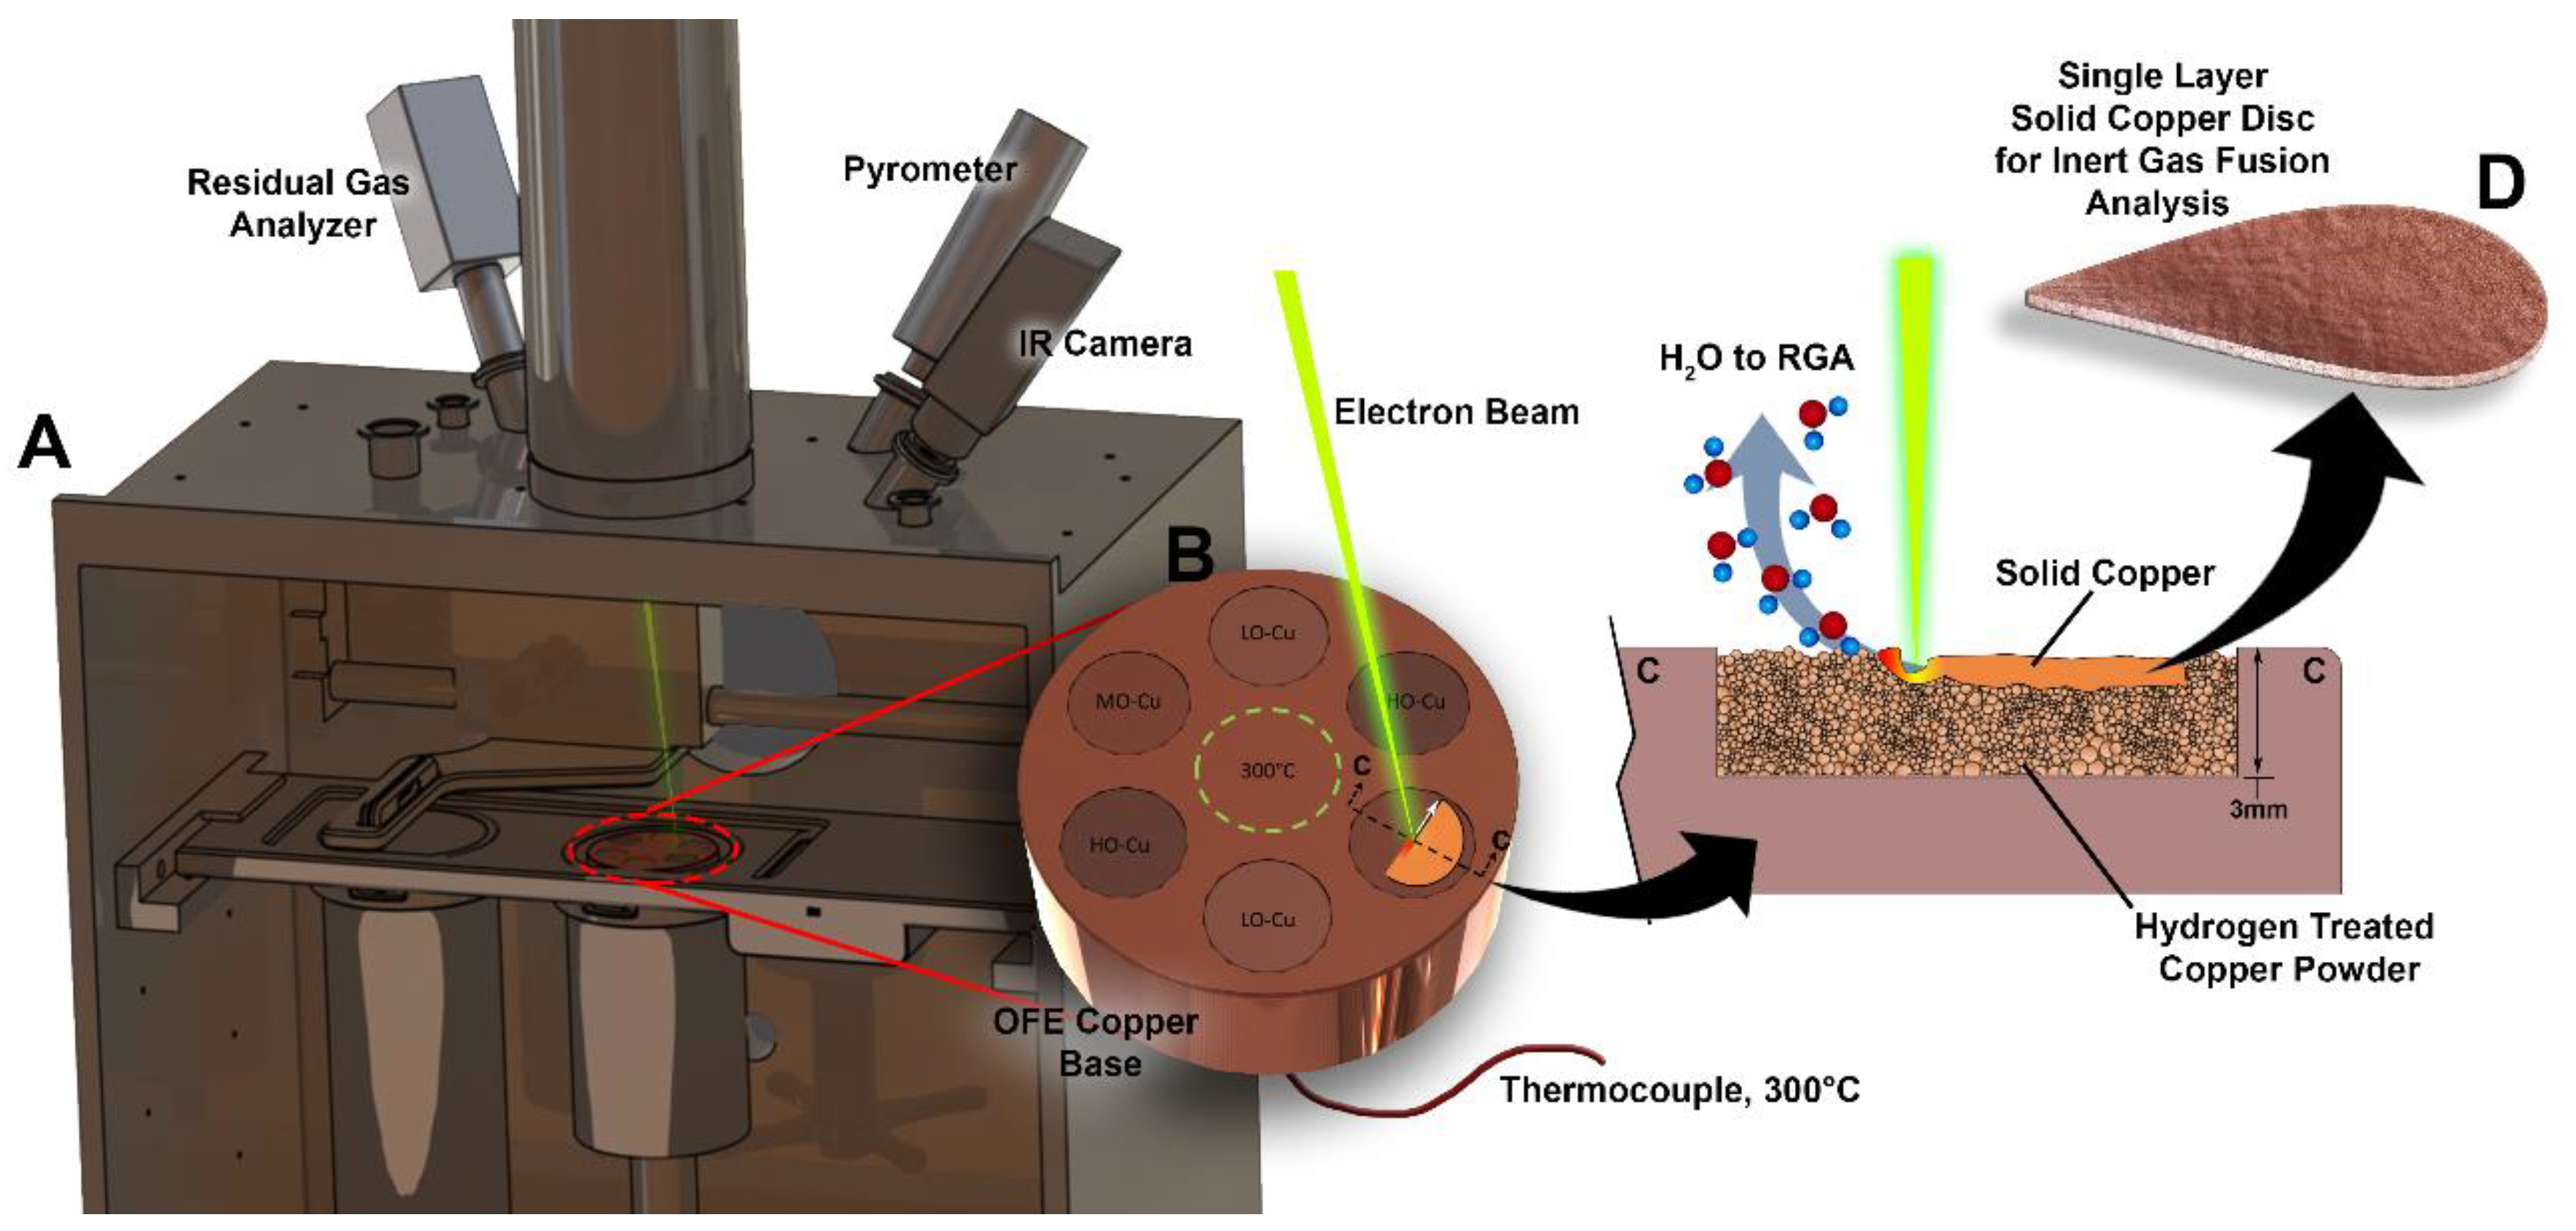
2O release during EB-PBF, single layer discs were melted using the various hydrogen-treated and untreated powders. Figure 4 illustrates the experiment. The fixture upon which the experiments were carried out was an annealed OFE copper cylinder, 100 mm in diameter and 50 mm thick. Six equally spaced cylindrical pockets, measuring 25 mm in diameter by 3 mm deep were milled into the surface at a radial distance of 30 mm from the plate center, such that each pocket is effectively isolated from the others, as seen in Figure 4. After the machining, the copper substrate was cleaned using a standard ultra-high vacuum (UHV) protocol for machined copper.
Each of the pockets in the substrate were filled and leveled to the top surface of the plate with ~5 grams of LO-Cu, MO-Cu, or HO-Cu powder before or after hydrogen treatment, each having a replicate. The oxygen and hydrogen content of the powder, as noted previously, was measured by inert gas fusion prior to this experiment. A type K thermocouple was affixed to the bottom of the substrate, and the substrate was placed on top of the build piston, which allows for the thermal isolation from the system.
The vacuum chamber was evacuated to a pressure of 3.75 × e−5 Torr, and the copper substrate was heated by repeatedly scanning the defocused electron beam in a circular area, 25 mm in diameter at the center of the substrate, with a beam current of ~2–4 mA. The substrate temperature was measured by the thermocouple at the bottom, and a two-color pyrometer through a sapphire window positioned in one of the upper viewports.
The substrate heating was manually modulated until both of the temperature readings agreed within 5% of the target value (300 °C), and then this temperature was maintained for a 2 h outgassing cycle. A 200 amu residual gas analyzer (SRS-RGA200) was used to measure the partial pressure of the gas species of interest for this study (O, H, N, NO, NO2, and H2O). During the outgassing cycle, the background H20 partial pressure was observed to decrease and stabilize at ~8 × e−7 Torr. This outgassing period at 300 °C also allowed sufficient time for the initial stages of sintering to take place within the powder. This was observed with the IR camera by a uniform emissivity shift across all six powder pockets.
The focused electron beam was then raster scanned over an area measuring 20 mm in diameter on the surface of each one of the powder pockets. A line energy of 0.8 J/mm (600 mm/s, 8 mA, 0 mA focus offset, 100 µm hatch offset) was sufficient to melt and consolidate a single layer of copper supported underneath by the sintered powder. The melting process was recorded by the thermal imaging camera through a germanium port at 25 Hz, and by in-situ monitoring of the back scattered electron signal. A thermal video of the melting process is available in the Supplementary Materials. During the melting, the outgassing of the key gas species was monitored by the RGA at 1 Hz. This process was repeated on each powder pocket with approximately 10 min to pass between each raster melt in order to allow for the RGA partial pressures and substrate temperature to stabilize. The solids samples were then cooled under a vacuum to room temperature.
The material in each pocket was removed from the substrate and the sintered powder was mechanically removed from the solid wafer with a wire brush in an inert gas glove box. The oxygen and hydrogen content of both the sintered powder and solid wafer from each pocket were measured by inert gas fusion (LECO Form 203-821-455, LECO OHN836, LECO, St. Joseph, MI, USA). The experiment was repeated several times, varying the position of each powder type and the order in which powders were melted.

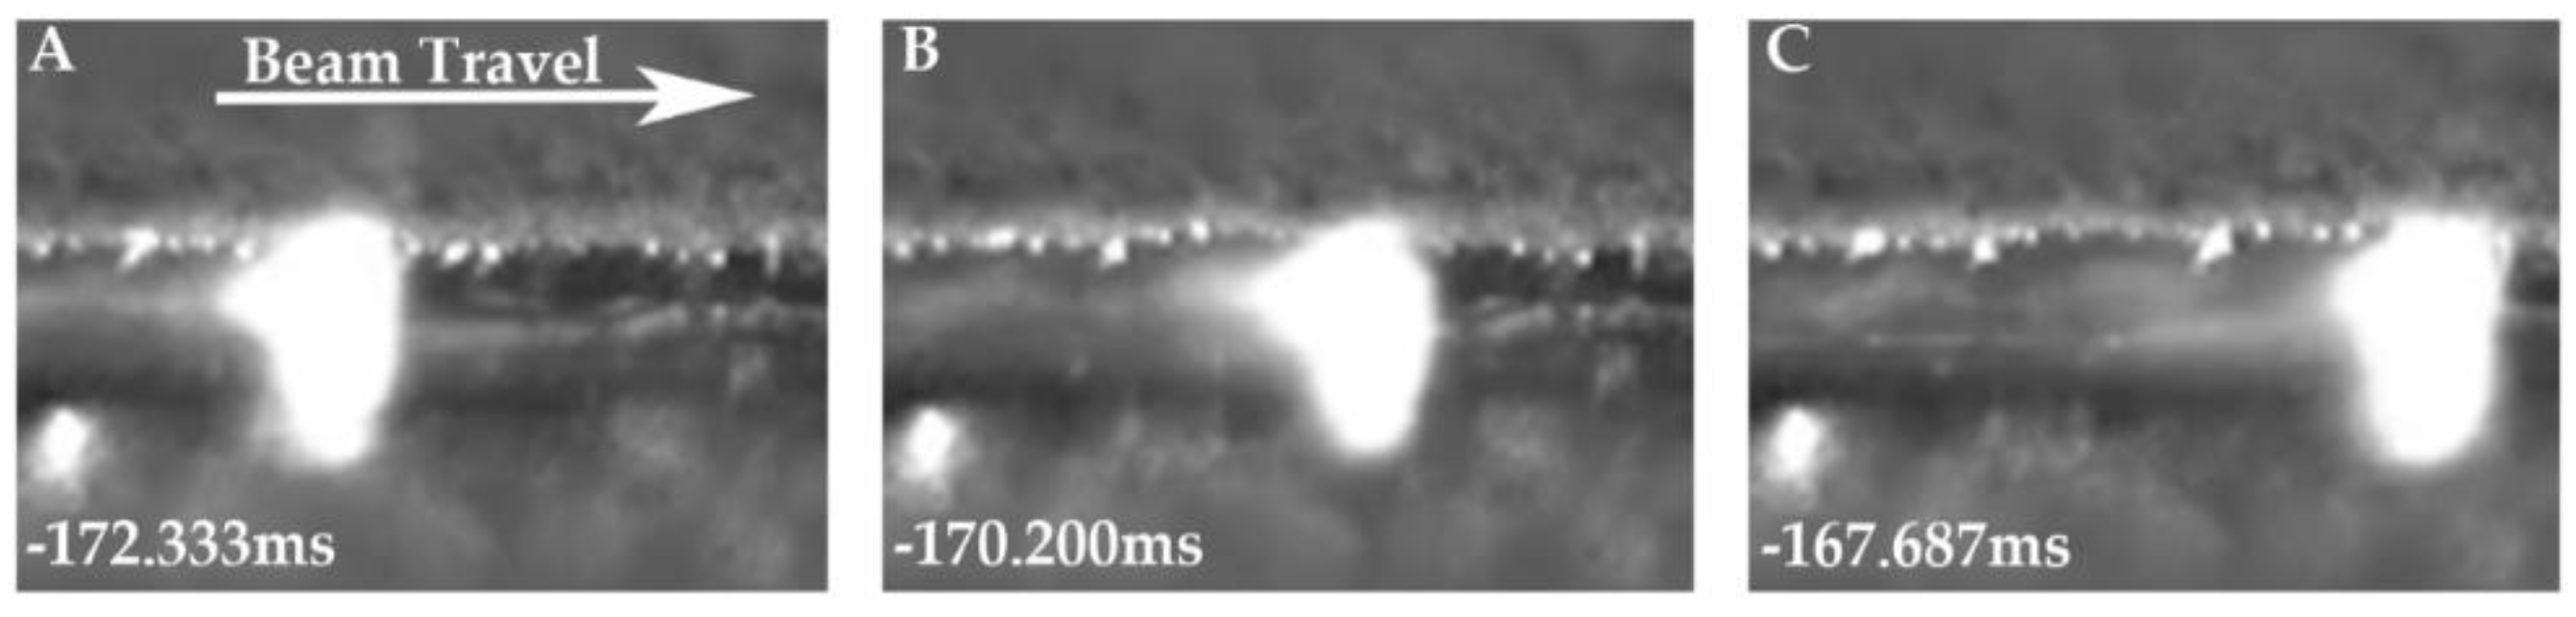
2.7. High Speed Footage of Melt Pool

In order to directly observe the H2O vapor escaping from the melt pool, a Photron SA-X2 high-speed camera was utilized to capture the footage at 30,000 frames per second, at a focal length of 30 cm. The footage was captured for both a hydrogen-treated LO-Cu and HO-Cu melt pool using the same procedure for the EB-PBF processing as described in Section 2.6.

2.8. Solid Sample Fabrication

To validate the process for fabricating the components of high purity copper with hydrogen heat-treated powers, solid cylindrical specimens measuring 15 mm in diameter were fabricated for the microstructural and chemical analysis, using both untreated and hydrogen-treated MO-Cu powder. The untreated powder had an oxygen content (~600 wt. ppm) similar to what was used in the studies by Frigola et al. [1], Lodes et al. [8], and Guschlbauer et al. [9]. The processing parameters used were 600 mm/s, 8 mA, 18 mA focus offset, and 120 µm hatch offset with a 40 µm layer thickness. This falls within the processing space (~166 J/mm3) used by both Frigola et al. [1] and Guschlbauer et al. [9]. The build temperature was maintained at 300 ± 10 °C for the duration of the fabrication. The gas species in the chamber were monitored during the fabrication process using the RGA, as described earlier.

3. Results

3.1. Powder Characterization

The oxygen and hydrogen content were carefully tracked after the atomization, screening, and hydrogen treatment. Table 1 shows the oxygen and hydrogen content for the untreated and hydrogen treated LO-Cu, MO-Cu, and HO-Cu screened powders. The LO-Cu powder was procured as-atomized and was sieved in-house under argon in order to maintain a low oxygen content of ~225 wt. ppm and ~1 wt. ppm hydrogen. After the hydrogen treatment of the LO-Cu powder, the oxygen content was reduced to ~50 wt. ppm, with minimal change in the hydrogen content. The untreated MO-Cu powder contained ~450 wt. ppm oxygen and ~2 wt. ppm hydrogen, and after hydrogen treatment, the oxygen content was reduced to ~280 wt. ppm, but the hydrogen content increased to ~30 wt. ppm, indicating that the hydrogen was retained within the powder after treatment, likely as trapped H2O, which is consistent with the reported literature by Nieh and Nix [28,30]. As a third condition, the HO-Cu was intentionally oxidized in order to exaggerate the effects of oxygen, and produced an extreme condition with oxygen measured at ~1500 wt. ppm and ~2 wt. ppm hydrogen. After the hydrogen treatment of the HO-Cu powder, the oxygen content was reduced to ~580 wt. ppm, but the hydrogen content increased to ~75 wt. ppm, again most likely trapping H2O inside the particles. No significant sintering is observed after the powders undergo the hydrogen treatment. Figure 5 shows a plot of the atomic percent of oxygen versus the atomic percent of hydrogen for all of the hydrogen heat-treated copper powders used in this study. The 2:1 stoichiometric relationship is a key indicator that hydrogen is retained in the powder in the form of H2O vapor. It is also notable that the linear relationship is offset by ~0.06% at. % oxygen, which can be accounted for volumetrically on the surface of the powder particles.
Further evidence for the formation of H2O vapor induced cavities in the powder is supported by the helium pycnometry results for each powder condition (shown in Figure 6). No significant change in density is seen after the hydrogen treatment of the LO-Cu particles from the untreated condition. Without internal, grain boundary Cu2O, the hydrogen does not react to form H2O vapor. However, both the MO-Cu and HO-Cu particles show a decrease in density after hydrogen treatment, which is likely caused by the formation of H2O in the particles due to the significant difference in densities between H2O (1 g/cm3) and copper (8.96 g/cm3). The decrease in density among the as received powders can be attributed to the increasing contribution of Cu2O with the increasing oxygen content, which has a density of only ~6 g/cc.
Because of its relatively high oxygen content, the MO-Cu powder was selected to observe the effect of hydrogen heat treatment on the surface oxides. Figure 7 shows the representative low and high magnification scanning electron micrographs of (Figure 7A,C) and the hydrogen-treated (Figure 7B,D) MO-Cu powder. Figure 7C shows the surface of the untreated MO-Cu powder, where bright spots were identified as oxygen-rich copper particles. Figure 7D shows the surface at the same magnification after the hydrogen treatment of the MO-Cu powder, where the surface oxides have been largely removed. These results were typical for untreated and hydrogen-treated MO-Cu and HO-Cu particles.
The representative particles were serial sectioned using a FIB to reveal the internal structure of the untreated and hydrogen-treated powder of each type using ion channel imaging, as shown in Figure 8. Figure 8A is an ion image of a sectioned untreated LO-Cu particle showing no obvious porosity or oxide-rich particles. Figure 8B,C are cross-sectioned MO-Cu and HO-Cu particles, respectively, which have fine equiaxed microstructures and submicron oxygen-rich particles along the grain boundaries. The distribution of oxide particles along the grain boundaries vary by size, where larger oxides tend to be located at triple points, and smaller oxides along the grain boundaries. Figure 8D shows a hydrogen-treated LO-Cu particle with minimal change after hydrogen treatment because of its initially low oxygen content. The LO-Cu particles, produced with a special handling consideration, consistently showed few to no internal oxides (within the resolution of the instrument). A grain boundary is shown in Figure 8A,D. However, the lack of contrast between the two grains can be attributed to the similarity of the grain orientations. Figure 8E shows a hydrogen-treated MO-Cu particle with both a micron and submicron scale porosity throughout the grain boundaries. The high oxygen content of the HO-Cu particle leads to the formation of a significant interconnected porosity at the grain boundaries after hydrogen heat treatment. Several large pores are evident after hydrogen treatment in Figure 8E,F for MO-Cu and HO-Cu, respectively; however, in both cases, small dark features are evident along the grain boundaries. It was not immediately clear from this SEM analysis whether these were residual, unreacted oxides or small water vapor induced pores. Videos of the serial sectioning process using FIB are provided in the Supplementary Materials for each of the cases in Figure 8. The HAADF STEM imaging and EDS (Figure 9) of a grain boundary triple point of hydrogen heat-treated MO-Cu confirms the presence of the H2O vapor induced porosity, consistent with the observations of Nieh and Nix [28,30].
Figure 10 shows the results of the thermogravimetric analysis (TGA) of untreated and hydrogen-treated powders for the three initial oxygen contents. A TGA was carried out to ascertain the temperature at which the internal pressure of the H2O vapor pores exceeds the grain boundary strength of the copper powder particles. All of the untreated powders demonstrate no significant change in weight loss after heating to 600 °C at 5 °C/s. However, both hydrogen-treated MO-Cu and HO-Cu powders experience weight loss beginning at 375 °C, which then stabilizes at approximately 525 °C. Hydrogen-treated LO-Cu powder also shows minimal mass change while heating when compared to the hydrogen treated MO-Cu and HO-Cu particles. The weight loss can be correlated to the initial oxygen content of the powder before hydrogen treatment, indicating an increased presence of H2O in the hydrogen-treated particles at higher oxygen contents.
To directly observe the mechanism for the H2O release during the heating of the treated powders, treated and untreated particles were heated to 400 °C, and then to melting at 1200 °C, using an in-situ SEM heating stage (Protochips Fusion). It is important to note that the reported temperature is that of the surface of the heating elements, not necessarily the equilibrium temperature of the particles. The temperature of the stage is calibrated with a pyrometer and correlated to the input current. Here, it is assumed that the mass of the particle is small compared with the input power, and that the equilibrium temperature is reached quickly. This assumption is corroborated by the data acquired from multiple sources in this study (TGA, in-situ EB-PBF, etc.). A temperature of 400 °C was chosen for imaging, based on the onset temperature of weight loss observed by TGA. Figure 11A shows a typical hydrogen-treated HO-Cu particle at room temperature. Additional treated and untreated particles are included as Supplemental video files. This particle was placed on the SiC chip in the SEM, and heated in-situ to 400 °C at 100 °C/s. Figure 11B is an SEM image of the particle surface at 400 °C immediately after fracture lines are observed, as H2O vapor escapes from the particle, illustrated by the arrows. Subsequently, as shown in the Supplemental videos, the fracture lines close and heal through diffusion mechanisms.
Figure 11C shows images of another particle surface at 400 °C immediately after the onset of the grain boundary fracture. In this case, the particle was quenched from this condition, and subsequently cross sectioned with a FIB, which reveals interconnected porosity along the grain boundaries inside the particle (Figure 11D). Here, the release of H2O vapor at 400 °C causes the interconnected porosity along the grain boundaries underneath the particle surface, with an additional porosity towards the center of the particle.

3.2. Electron Beam Fabrication

EBM involves the selective melting of an elevated temperature powder bed for part fabrication. In this study, the powder bed temperature for part fabrication in copper is below the critical temperature for H2O release in hydrogen-treated powder. The reported powder bed temperatures for the EB-PBF of copper range from 380 °C (Lodes et al. [8]) to 530 °C (Guschlbauer et al. [9]), with oxygen contents comparable to the MO-Cu used in this study (although with a larger powder size distribution). It was observed early in the development of this study that the removal of surface oxides with hydrogen heat treatment resulted in difficulty in spreading the powder at elevated powder-bed temperatures (>350 °C). Without the presence of surface oxides, the activation energy for sintering is greatly reduced. In some cases, sintering was observed during spreading, resulting in homogenous and uneven layering. A lower powder bed temperature alleviates this problem to some extent, and, from a practical standpoint, facilitates the removal of powder from closed cavities. Unlike other common materials utilized in EB-PBF (e.g., Ti6Al4V, TiAl, and 718), copper powder is less susceptible to charge-induced scattering, because of its high conductivity, which also enables EB-PBF processing at lower temperatures, with minimal sintering.
The single melt track width experiments, described in Section 2.5, were carried out to determine whether the powder adjacent to the melt-pool front reaches a sufficiently high temperature for a sufficiently long duration, in order to induce the powder cracking H2O vapor release mechanism observed in the heated stage experiments. The thermal input conditions were modeled using the 3D transient heat transfer model developed by Lee et al. [41] at the Oak Ridge National Laboratory, to guide the experimental design. A 2D contour plot of the temperature profile during melting with a 2000 µm hatch spacing is shown in Figure 12. The heat affected zone in the powder bed surrounding the melt pool extends several hundred microns below and to the sides of the melt pool, ranging from 500 °C at 150 µm from the center of the melt pool, to 350 °C at a distance of 250 µm.
The powder samples were harvested from between each of the EB-PBF wafers from the edge/wall wafers and in ~0.1 mm increments so as to determine the influence of the heat affected zone of the melt pool on the surrounding powder bed particles. Figure 12A–C are the SEM images of the sintered powder adhered to the fabricated part (Figure 12A), ~0.1 mm distance (Figure 12B) and ~0.3 mm distance (Figure 12C) from the part where the surface characteristics of the particles correlate to their respective associated temperature. The sintered powder at the edge of the melt pool was estimated to reach temperatures of 700 °C, where the subsurface H2O is expected to be expelled from the grain boundaries, and the particle surface is smoothed due to diffusion at these relatively high temperatures. Powder images at 0.1 mm from the edge of the wall experienced temperatures of approximately 400–500 °C, according to the thermal model, and had features similar to the in-situ SEM heating (Figure 11), where obvious grain boundary cracking occurred, but no surface smoothing was visible. The collected powder imaged at 0.3–0.5 mm from the melt pool showed no obvious surface changes because of the relatively low temperature (<350 °C) estimated by the thermal model, and still contained the characteristic H2O vapor pores. These data support the hypothesis that H2O is released in the heat affected zone ahead of the melt pool in EB-PBF.
To determine the extent at which H2O is released from hydrogen-treated copper powders during melting as a function of the initial oxygen content, single layer discs were fabricated from each of the treated and untreated powder conditions. Figure 13A shows an image of the melted wafers on the OFE copper fixture after removal from the EB-PBF system. Figure 13C shows an optical image of the surface of the hydrogen-treated LO-Cu melted disc, which exhibits a uniform surface texture with evenly spaced melt pools. However, a non-uniform surface texture is observed on the hydrogen-treated HO-Cu melted disc, where exposed powder can be seen in circular pores on the surface (Figure 13B). The oxygen and hydrogen content of the starting powder, and the resulting solid discs are tabulated in Figure 13D for the treated powders. The untreated powders showed no change in oxygen content. A minimal change in the oxygen content was detected in the treated LO-Cu solid discs from the starting powder. However, the MO-Cu and HO-Cu solid discs show an approximately 50% reduction in the oxygen content from the starting powder. In both cases, a reduction in the hydrogen content is also observed as being approximately proportional to the amount of reduction in the oxygen content.
The residual gas analysis was measured as a function of time during the EB-PBF of HO-Cu, MO-Cu, and LO-Cu single layer discs, and is shown in Figure 14. Each disc was melted as a single step and the H2O partial pressure was allowed to stabilize before moving to the next step. The HO-Cu and MO-Cu powders show an increase in partial pressure of the H2O vapor during the melting of the disc with the intensity of the peak being indicative of the relative amount of hydrogen in the powder, as seen in Table 1. The peaks gradually diminish as the H2O vapor is removed from the system via the vacuum pumps. A minimal peak is witnessed during melting for the LO-Cu powder because of the absence of appreciable H2O vapor trapped in the particles.
The presence of porosity on the surface of the discs produced from hydrogen-treated HO-Cu and MO-Cu powder is indicative of excessive spatter, and suggests that a portion of the H2O vapor escapes from the liquid copper, in addition to the cracking mechanism observed in both the EB-PBF wafer tests and the heated stage experiments. To examine this possibility, high speed imaging (30 kfps) was conducted during the melting process. Full videos are included as part of the Supplementary Materials in this report. Selected frames of high-speed footage of the EB-PBF of hydrogen-treated LO-Cu powder (Figure 15) show a relatively stable melt pool with minimal spatter. However, Figure 16 shows selected frames from the high-speed footage of hydrogen treated HO-Cu particles during melting, and in this case, significant spatter is observed, caused by the escape of H2O vapor and the expansion in the molten copper. Large bubbles, on the order of 1–2 mm in diameter, are observed expanding and collapsing from liquid copper several mm behind the EB spot. Figure 16B shows a bubble forming in the molten pool, which then collapses and ejects molten metal from the pool shown, in Figure 16C (indicated by arrows).
Despite the presence of porosity in the single layer melt scenario caused by the escape of H2O vapor from the liquid zone, it was speculated that the layerwise remelting of a material typical in additive manufacturing would serve to reduce or eliminate this porosity in the fabrication of components. In order to determine the effect of successive melts on the removal of H2O, as well as the solid sample density, cylinders were fabricated using hydrogen-treated MO-Cu powder.
In the EB-PBF validation runs, the precursor untreated powders had an oxygen content of ~450 ppm and a hydrogen content of ~2 ppm, and the solid copper components fabricated with untreated powder show no change in the oxygen content. Hydrogen heat treatment of the MO-Cu powder reduces the oxygen content to ~280 ppm because of the volumetric elimination of surface oxides, and additionally, the hydrogen content of the powder is increased to ~33 ppm. Solid samples fabricated with EB-PBF using hydrogen-treated MO-Cu powder results in an oxygen content of ~50 ppm, and a negligible hydrogen content. The in-situ RGA during both trials shows the partial pressure of the layerwise outgassing of H2O vapor, which while present on all AM powders, is two orders of magnitude higher for the treated powders compared with the untreated powders. These data are reported in Figure 17. Figure 18 shows the representative microstructures of the solid samples produced with both treated and untreated powders. In both cases, a columnar grain structure is observed, aligned with the build direction, and a high density is achieved.

4. Discussion

The oxygen content of each of the three starting powder conditions results from surface oxide films and oxides along the grain boundaries. The copper oxide will continue to grow when exposed to oxygen, as it does not passivate [42]. The surface oxide thickness as a function of time at room temperature was empirically derived by White and Germer [43]. A typical oxide thickness would fall between 3–5 nm, but could be much thicker. The overall contribution of this oxide layer becomes a significant portion of the chemistry for a powder with a high specific surface area [44]. 
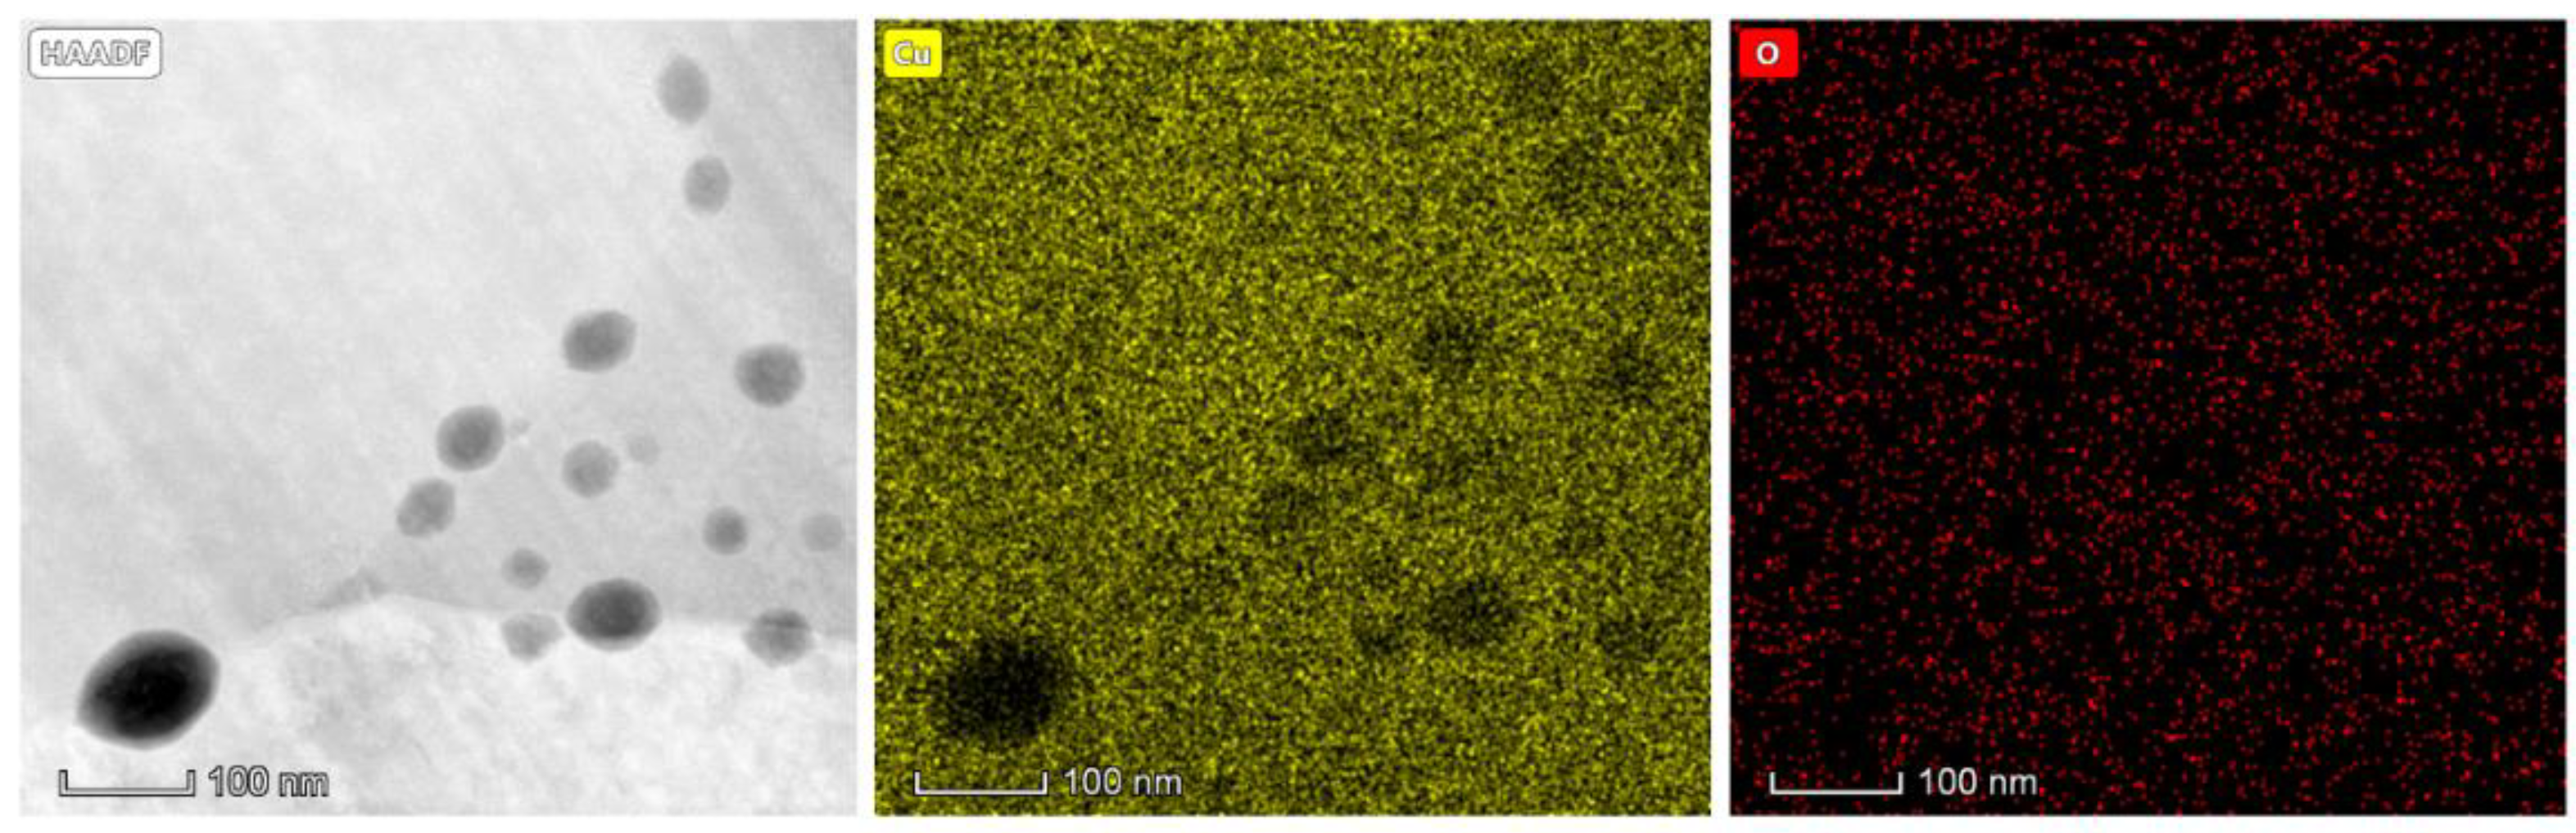
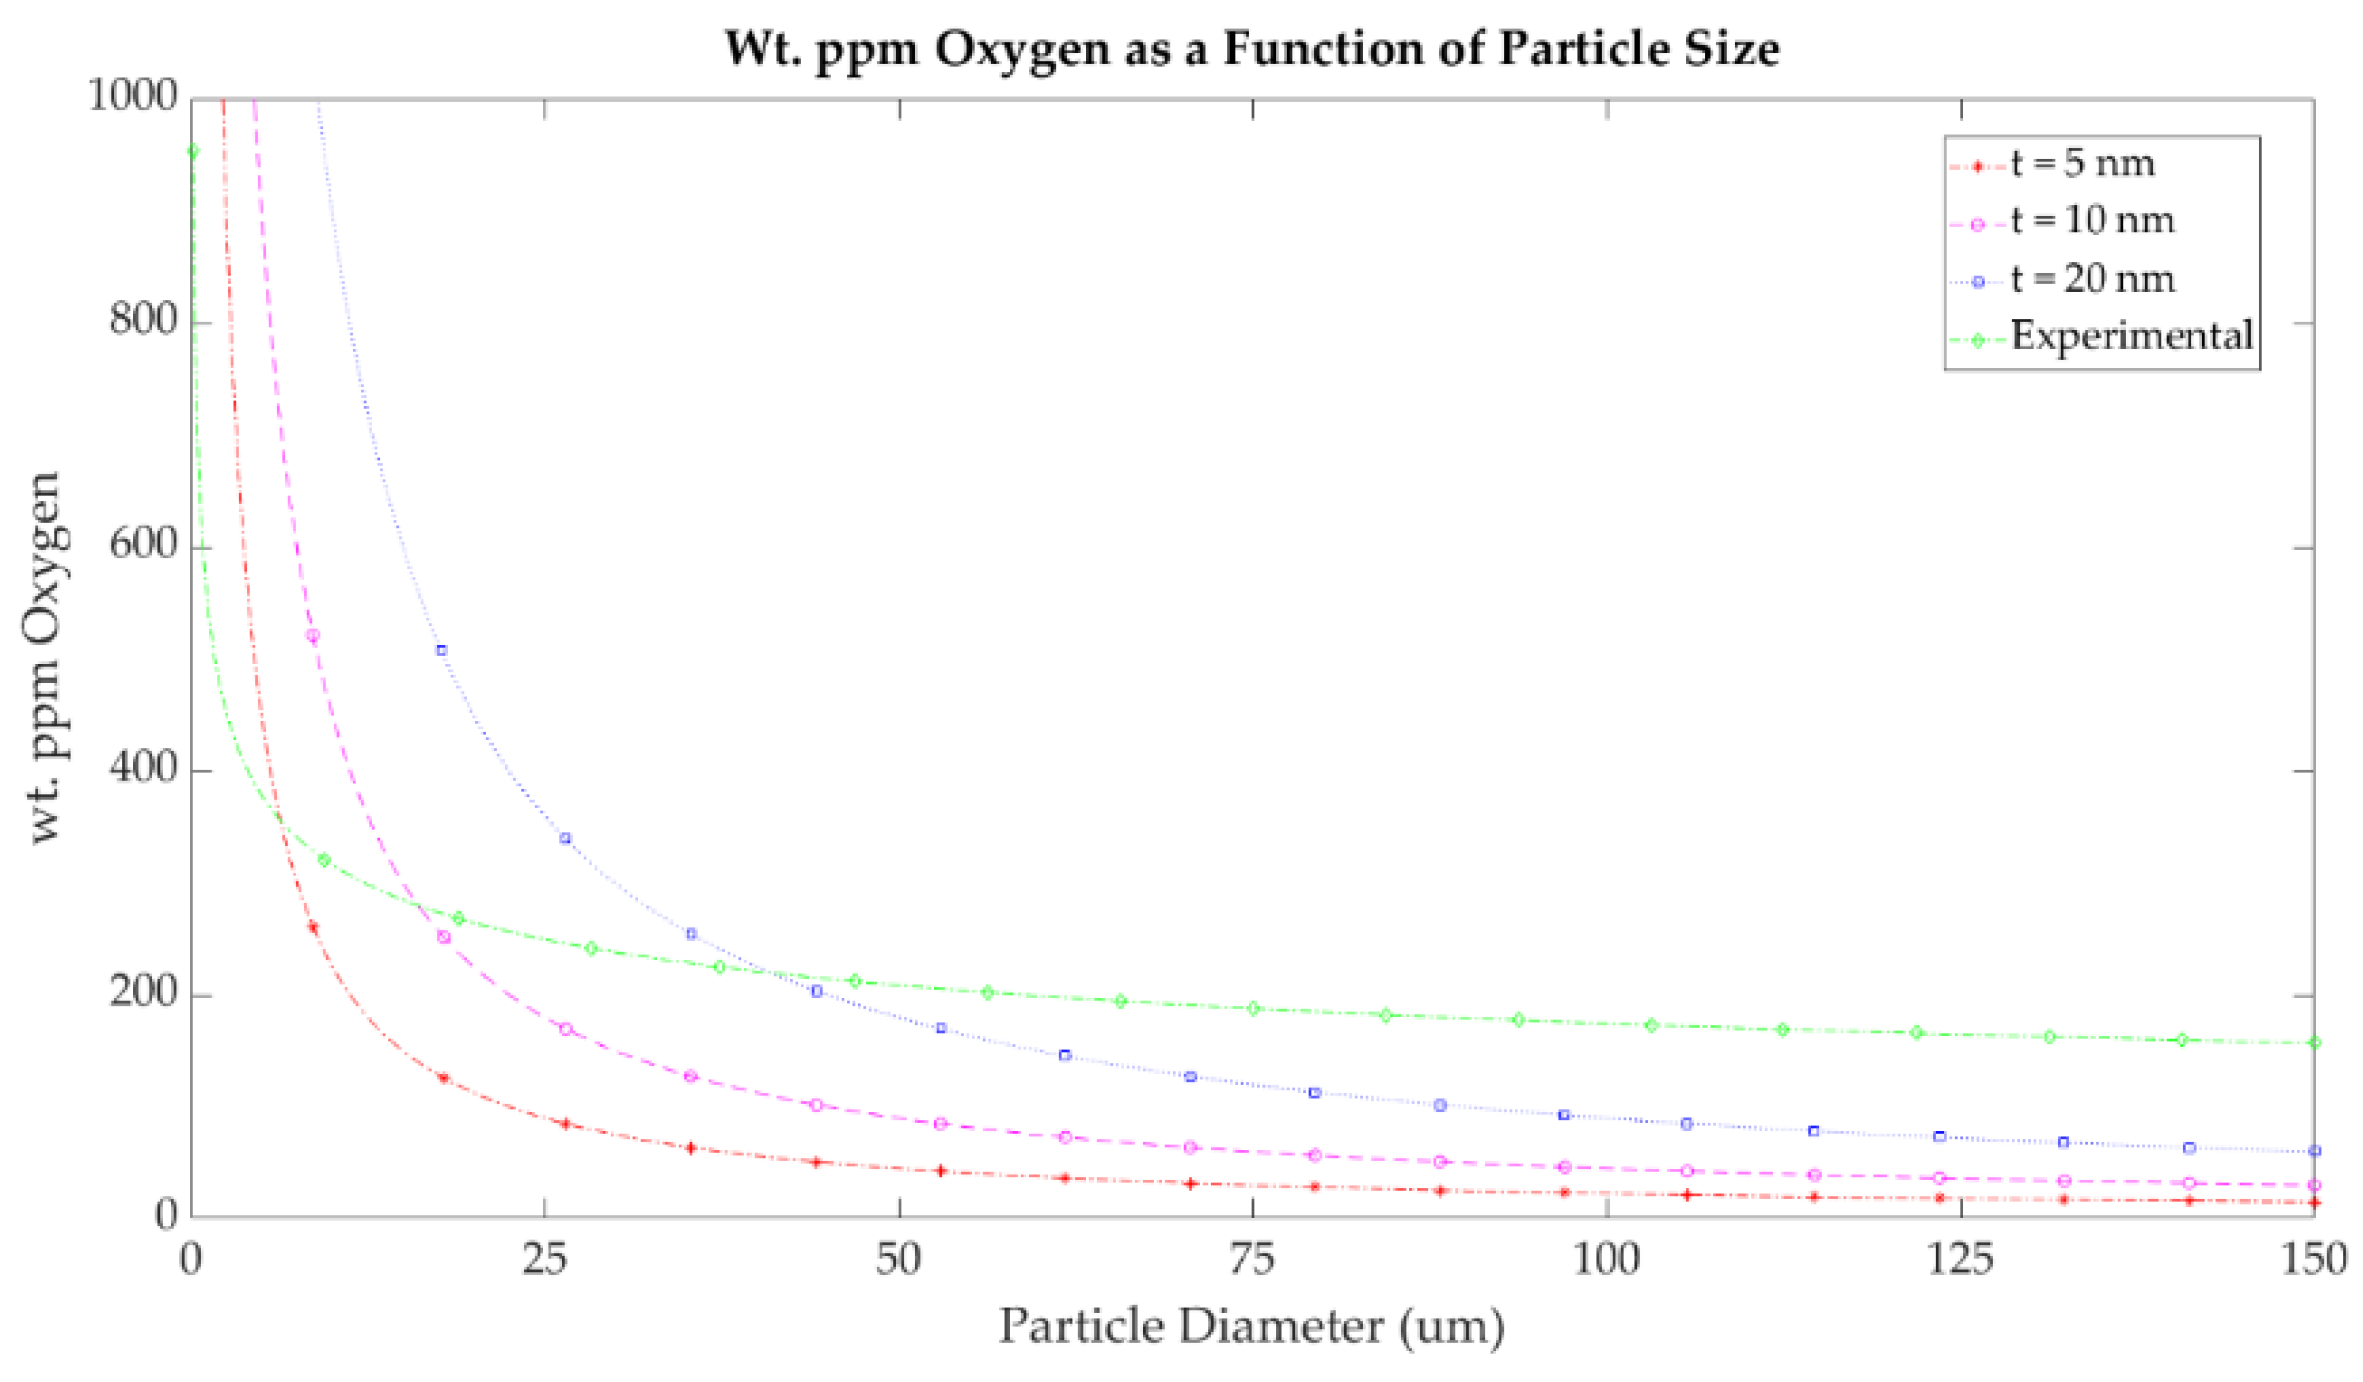
Figure 19 shows the calculated wt. ppm of oxygen as a function of the particle diameter for cuprous oxide surface films of various thicknesses. In the case of a 5 nm coating, and a typical Gaussian powder size distribution centered at a 35 µm diameter, the oxygen content is estimated to be roughly 75 wt. ppm oxygen, assuming all oxygen neglecting the 2 wt. ppm in solid solution at room temperature [39]. The experimental data gathered in this study suggest that the oxide thickness on the LO-Cu particles used in this study is ~15–20 nm, consistent with our STEM observations. Volumetrically, this accounts for the measured 200 wt. ppm oxygen, which was mainly surface oxides in the LO-Cu material for particles in the range of 15–53 µm.
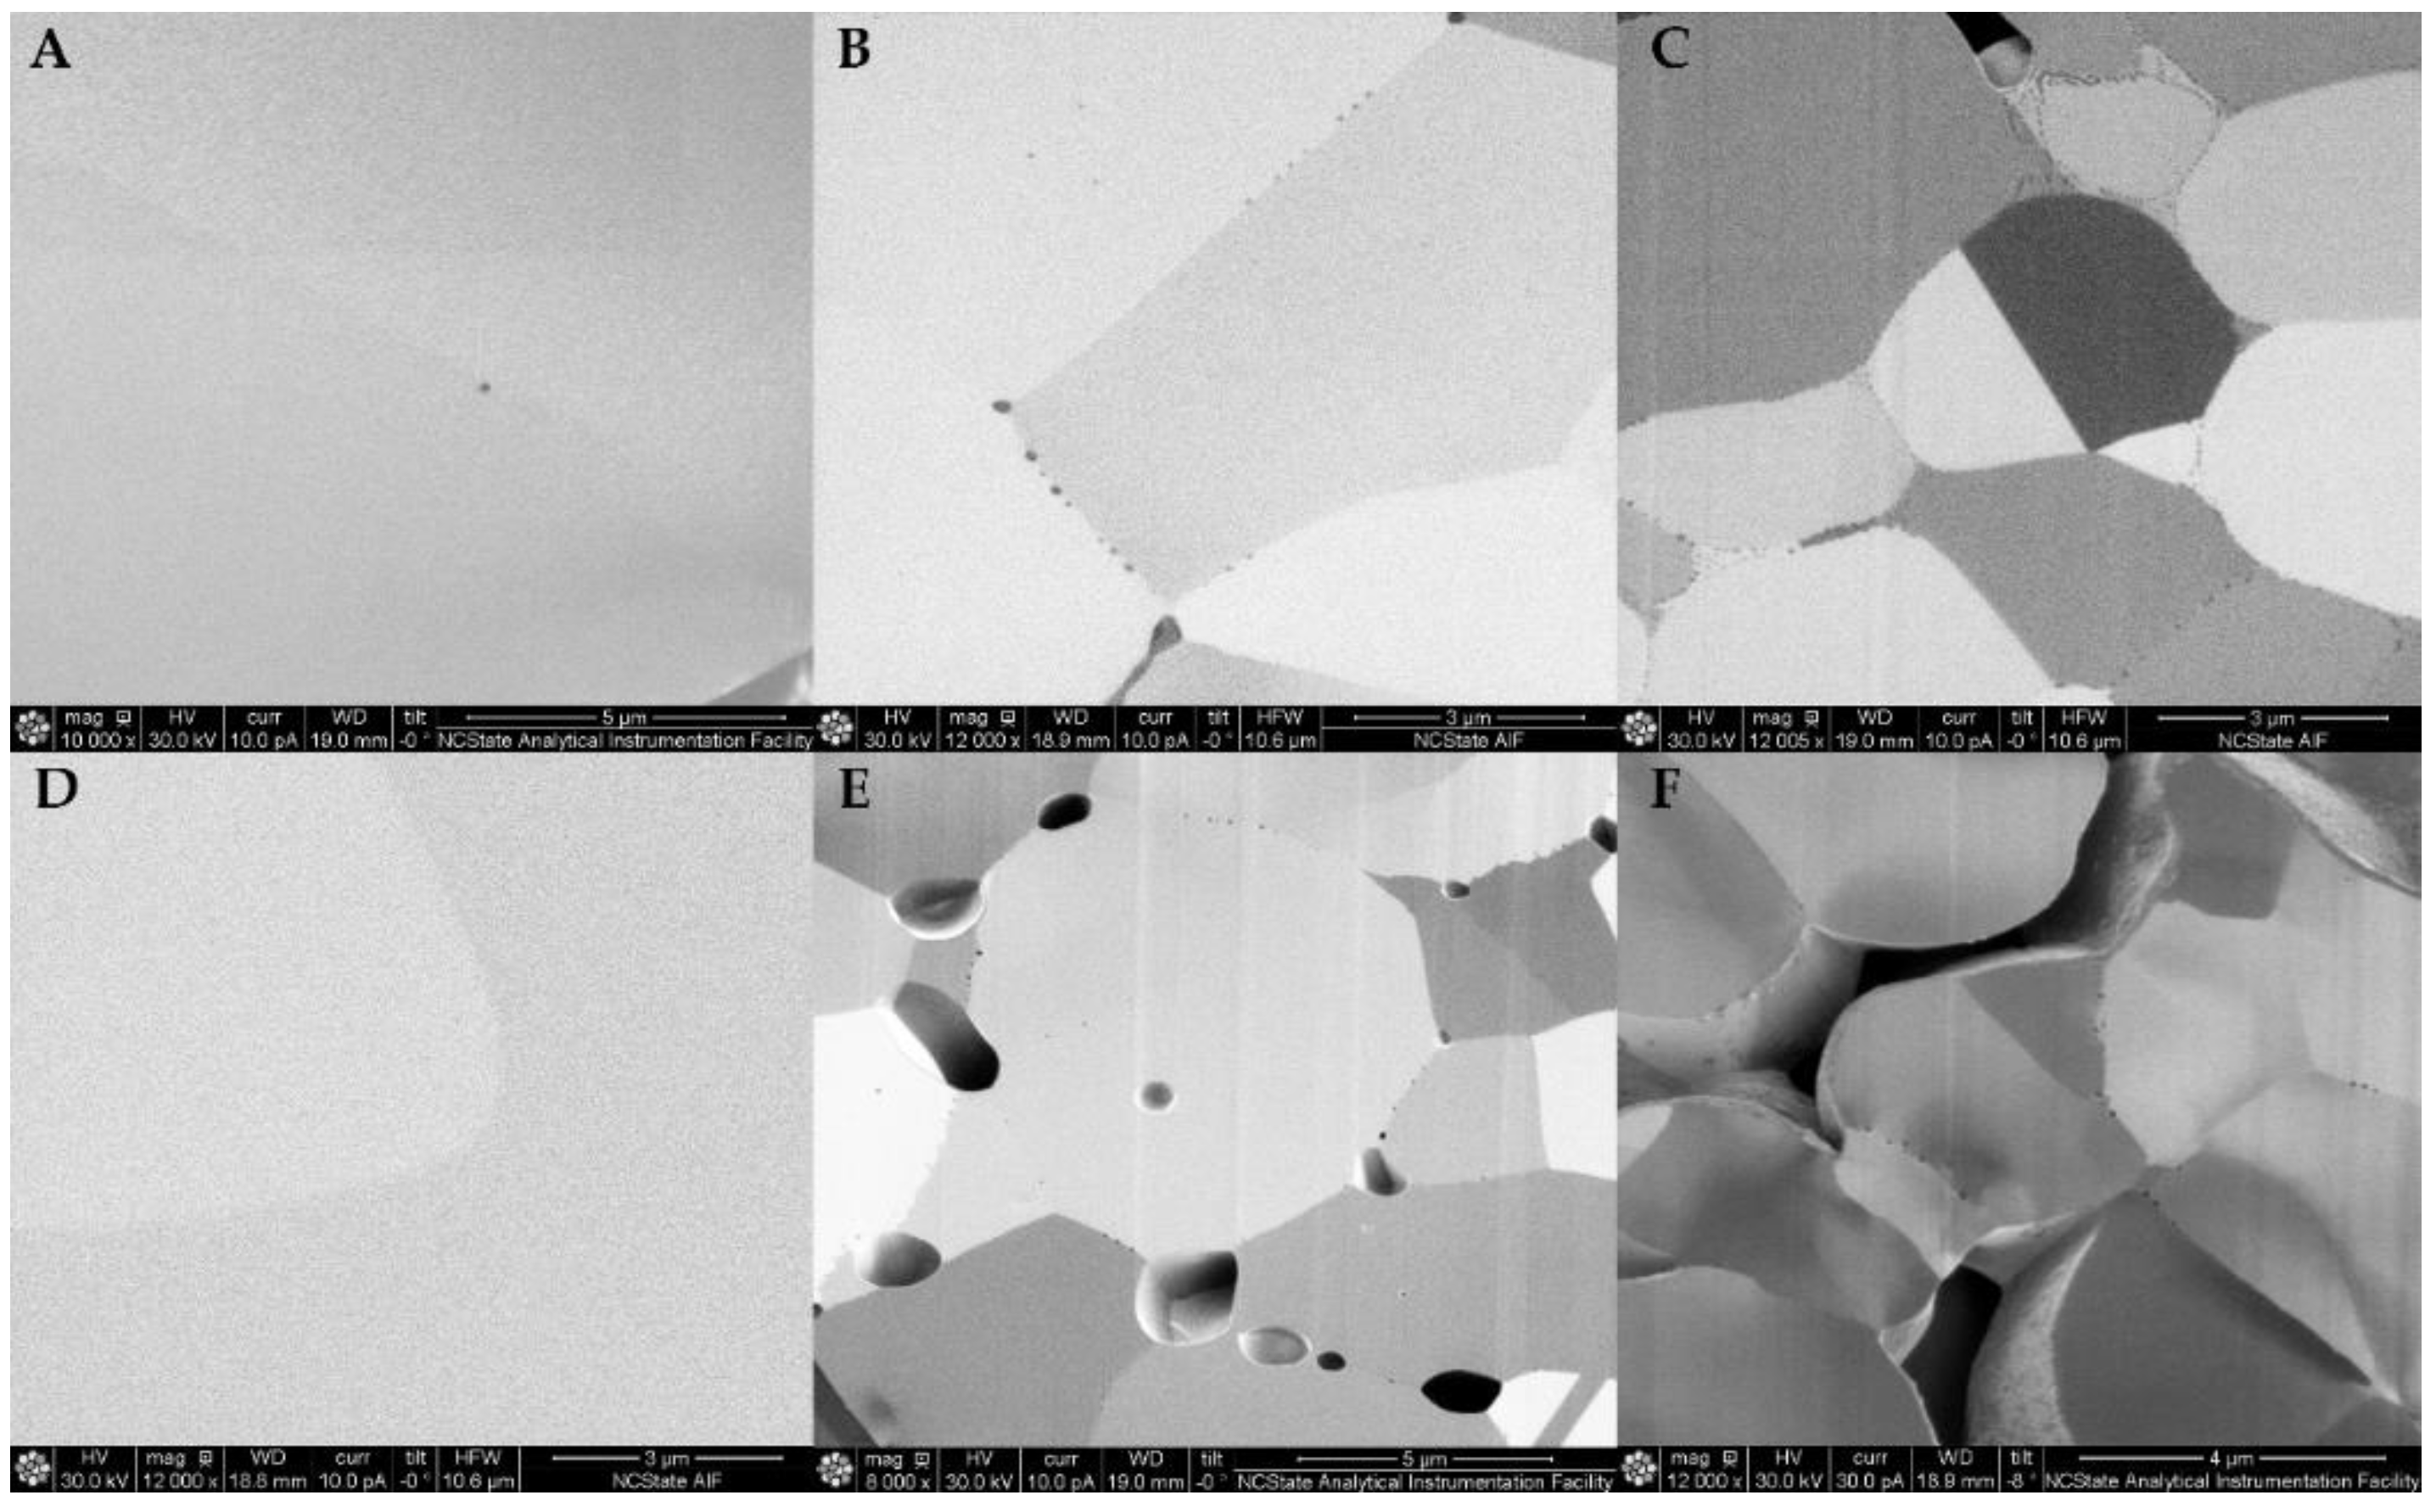
The MO-Cu and HO-Cu particles greatly exceed this oxygen content and show a large number of submicron oxides along the grain boundaries, as seen in Figure 7B,C. Naturally, the HO-Cu particles show the largest number of submicron oxides along the grain boundaries, with several larger oxides at triple points of the microstructure because of its exposure to air at elevated temperatures.
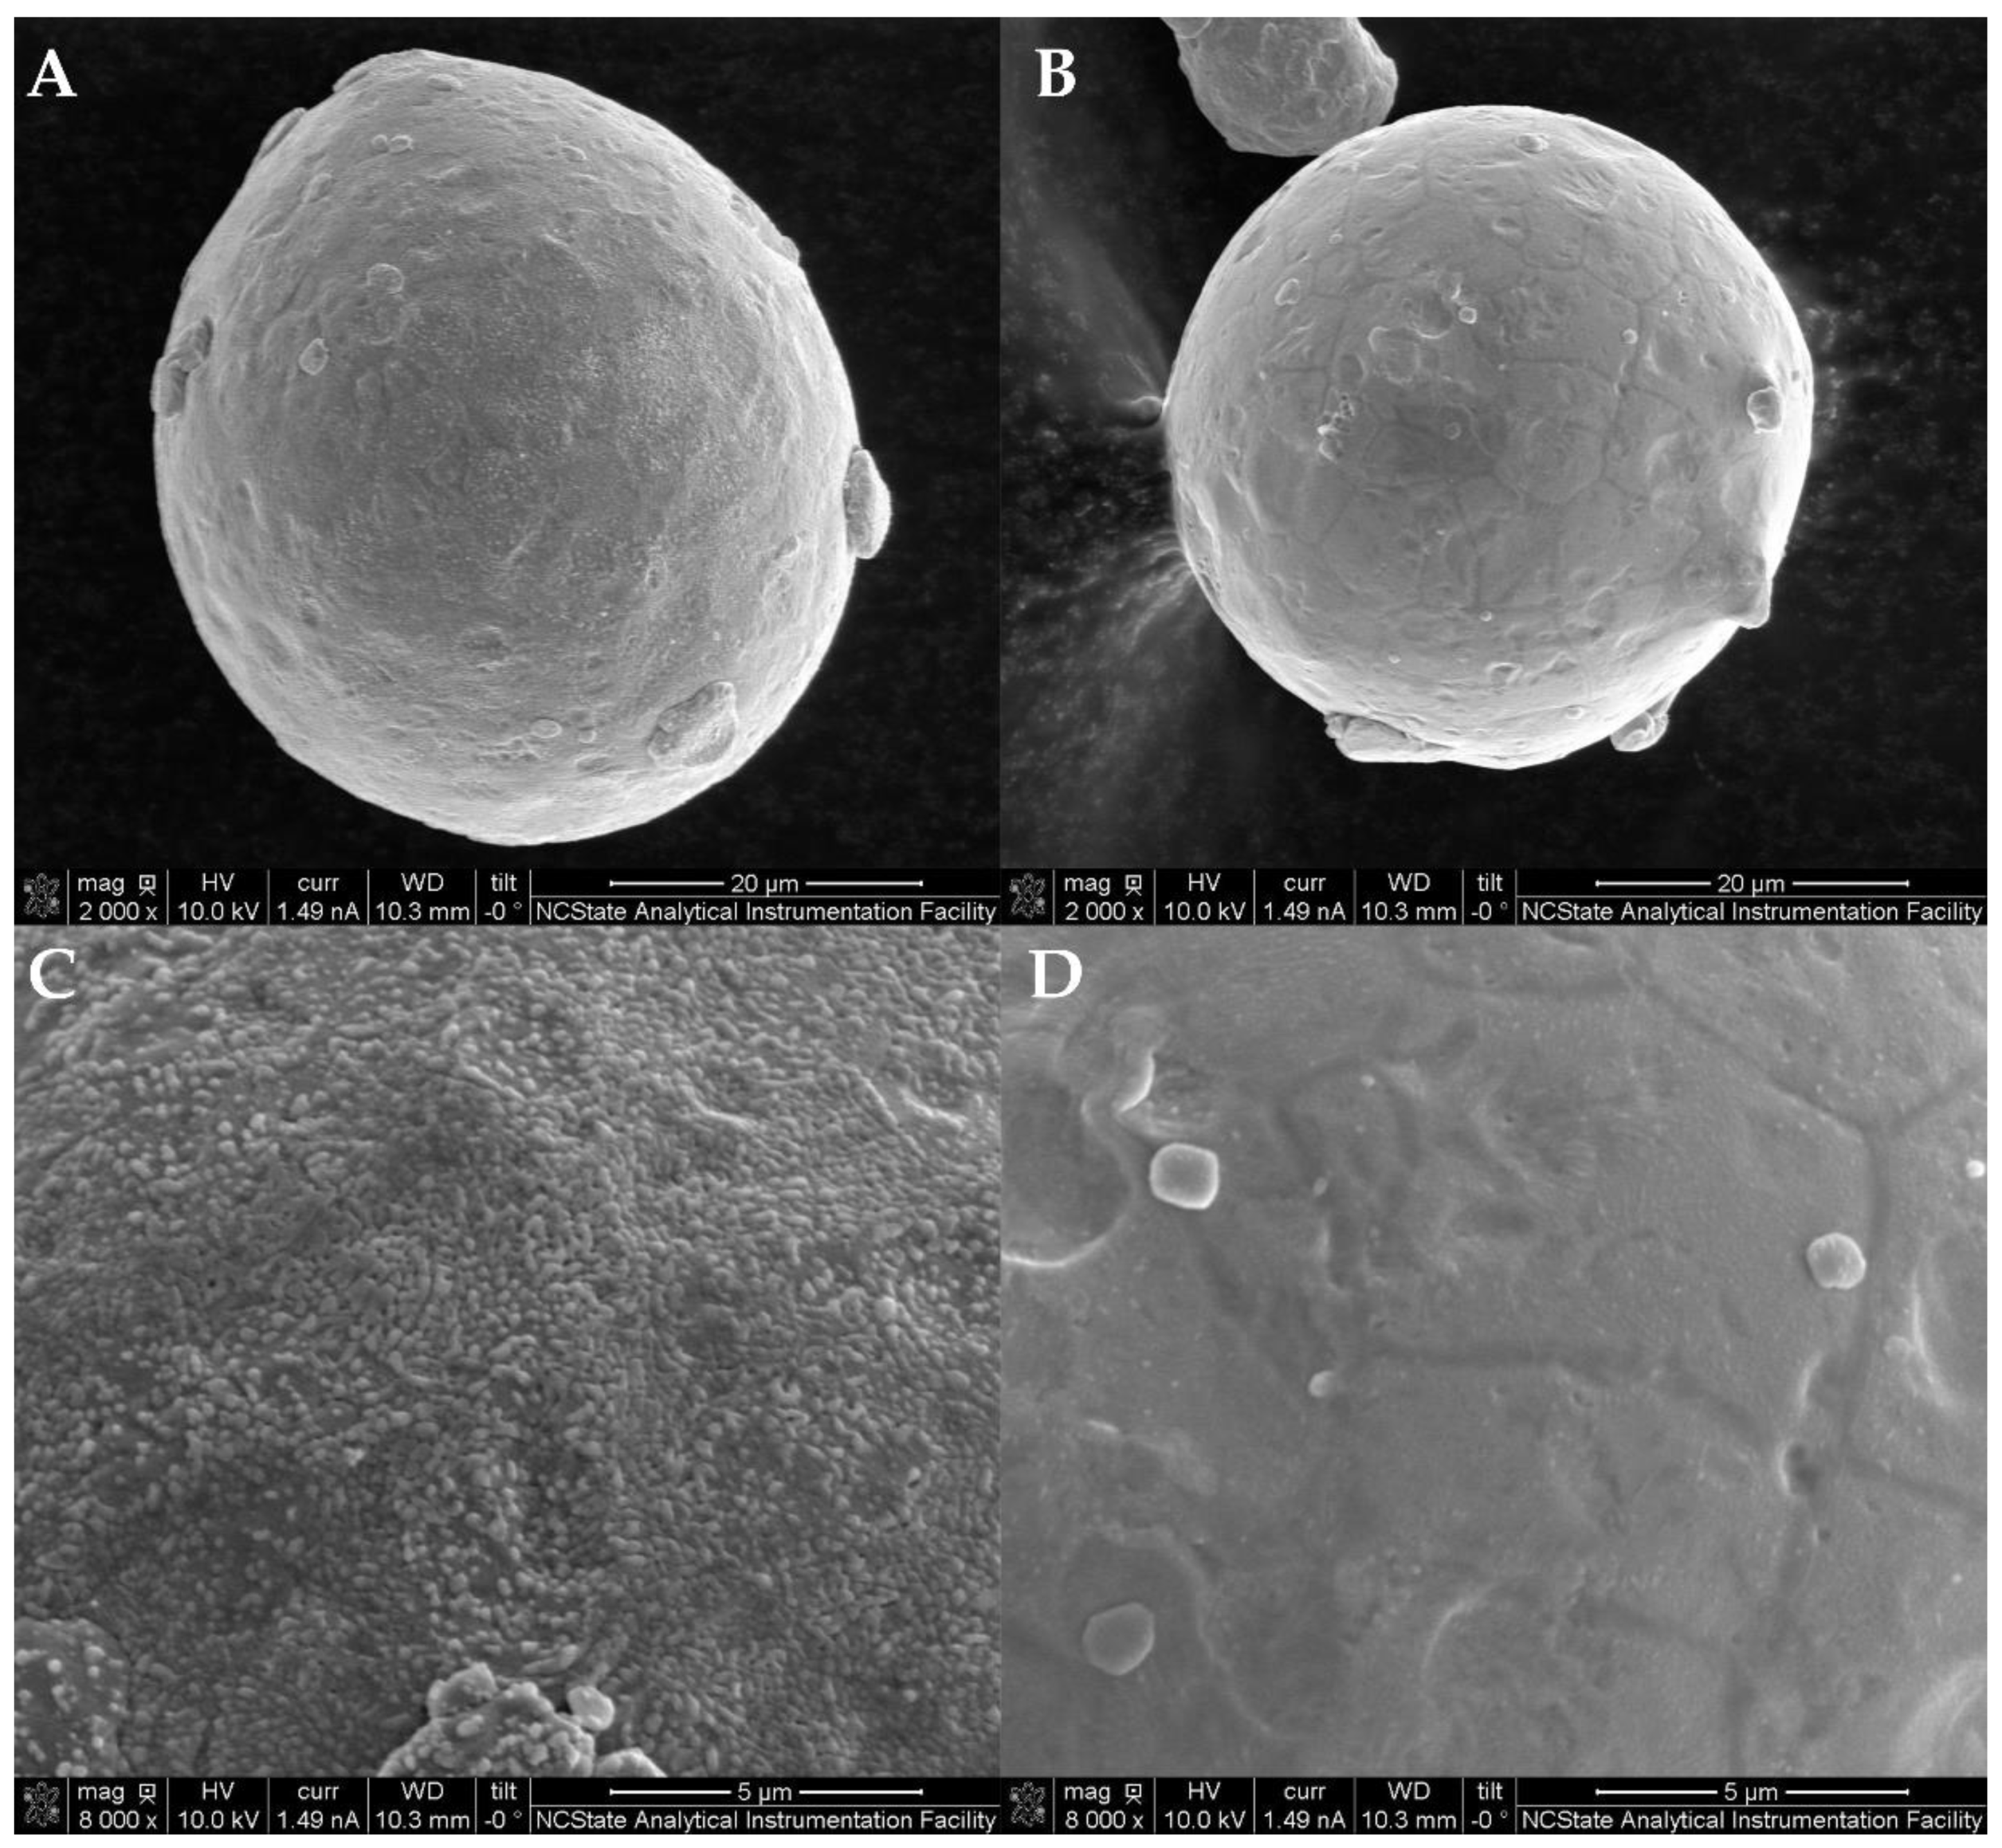
To remove the oxide particles, a hydrogen atmosphere heat treatment is employed to reduce the copper oxide to copper and H2O. This was first observed in the MO-Cu powder in Figure 7C,D, where the surface oxides were removed by hydrogen treatment. As hydrogen diffuses rapidly in copper (900 µm2/s at 400 °C [34]), it allows for the reduction of oxides present inside the particles in a relatively short amount of time. The hydrogen treatment temperature and time was chosen to allow for sufficient hydrogen diffusion through the particles, while not reaching sintering temperatures for the fine powder size distribution. Although not directly reported herein, it is worth noting that, not since the completion of this study, we have subsequently demonstrated the hydrogen reduction of copper powder in several furnace types (including batch and continuous) in both pure hydrogen and in forming gas (5% h, 95% Ar), and we have observed consistent results in all scenarios for the equivalent treatment times. After hydrogen treatment, the MO-Cu and HO-Cu powders exhibit a micron scale porosity at the triple points of the grain boundaries, and a smaller submicron porosity along the grain boundaries. These pores have previously been shown in the literature to be trapped H2O vapor [28,30,35].
According to Ito and Hayashi [35], the formation of H2O vapor in closed pores is as a result of the reduction of copper oxide during hydrogen heat treatment. The H2O vapor pressure inside a closed pore is higher than that of the surface stress of the pore, which inhibits the pore from collapsing. However, the H2O vapor pressure is not great enough to overcome the mechanical strength of the grain boundaries of the particle at room temperature.
At around 350 °C, the strength of the copper is significantly reduced, and the increasing internal pressure of the H2O vapor overcomes the mechanical strength of the grain boundary and the pore begins to expand in size. This leads to the fracturing of the particle, seen as an extensive network of interconnected pores along the grain boundaries, and a release of H2O vapor into the vacuum system, as seen in the SEM images in 
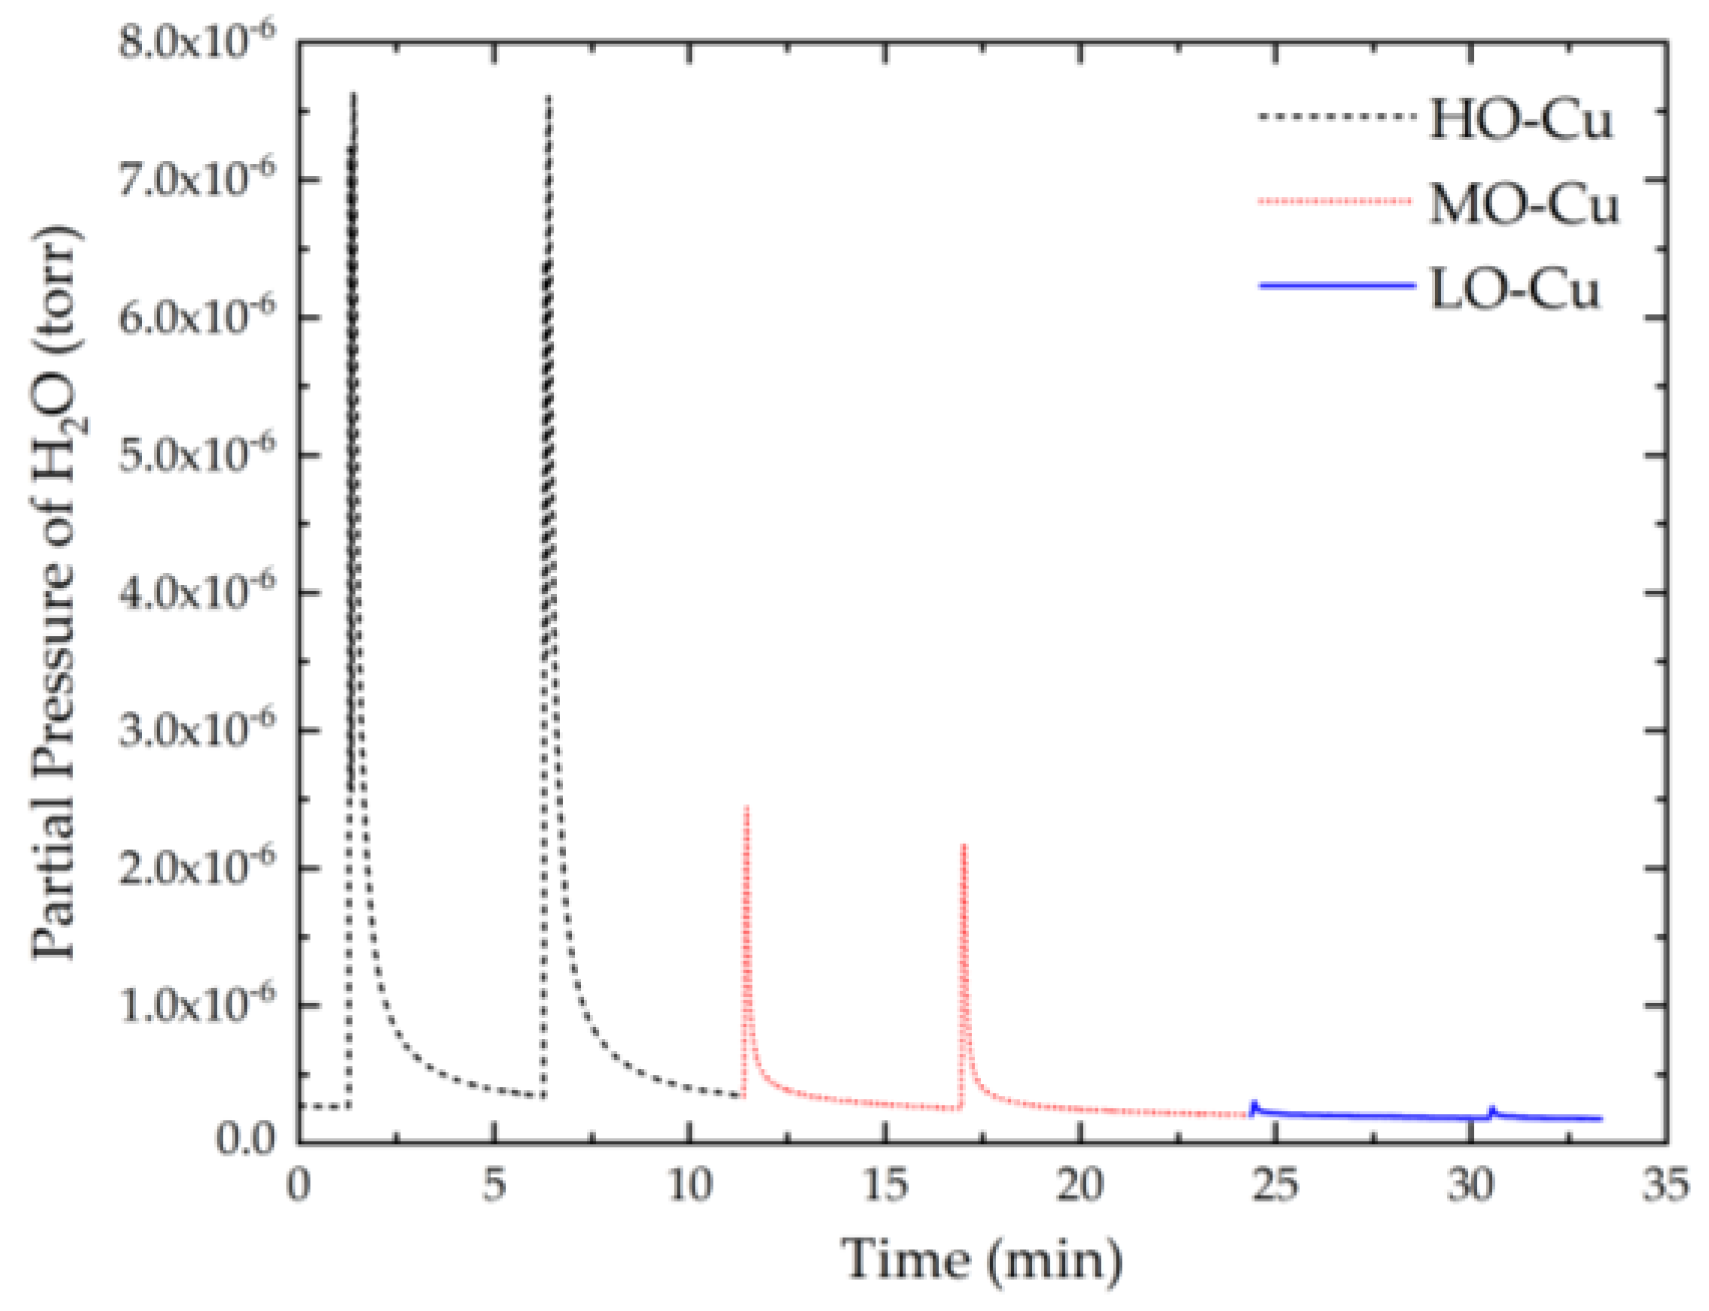
Figure 11C,D, and the RGA data from Figure 14. Notably, our work is presented for a given size distribution of gas atomized powder. While it is apparent that the reduction of internal Cu2O and the formation of steam pores is, for all intents and purposes, independent of particle size (owing to the rapid diffusion of hydrogen in copper at 400 °C), the practical upper and lower limits on particle size, for which the observed phenomena hold true, is not clear from this research. It is likely that the combined influences of grain boundary strength, grain size, radius of curvature, and oxygen content will contribute to the steam embrittlement/fracture mechanism in different ways.
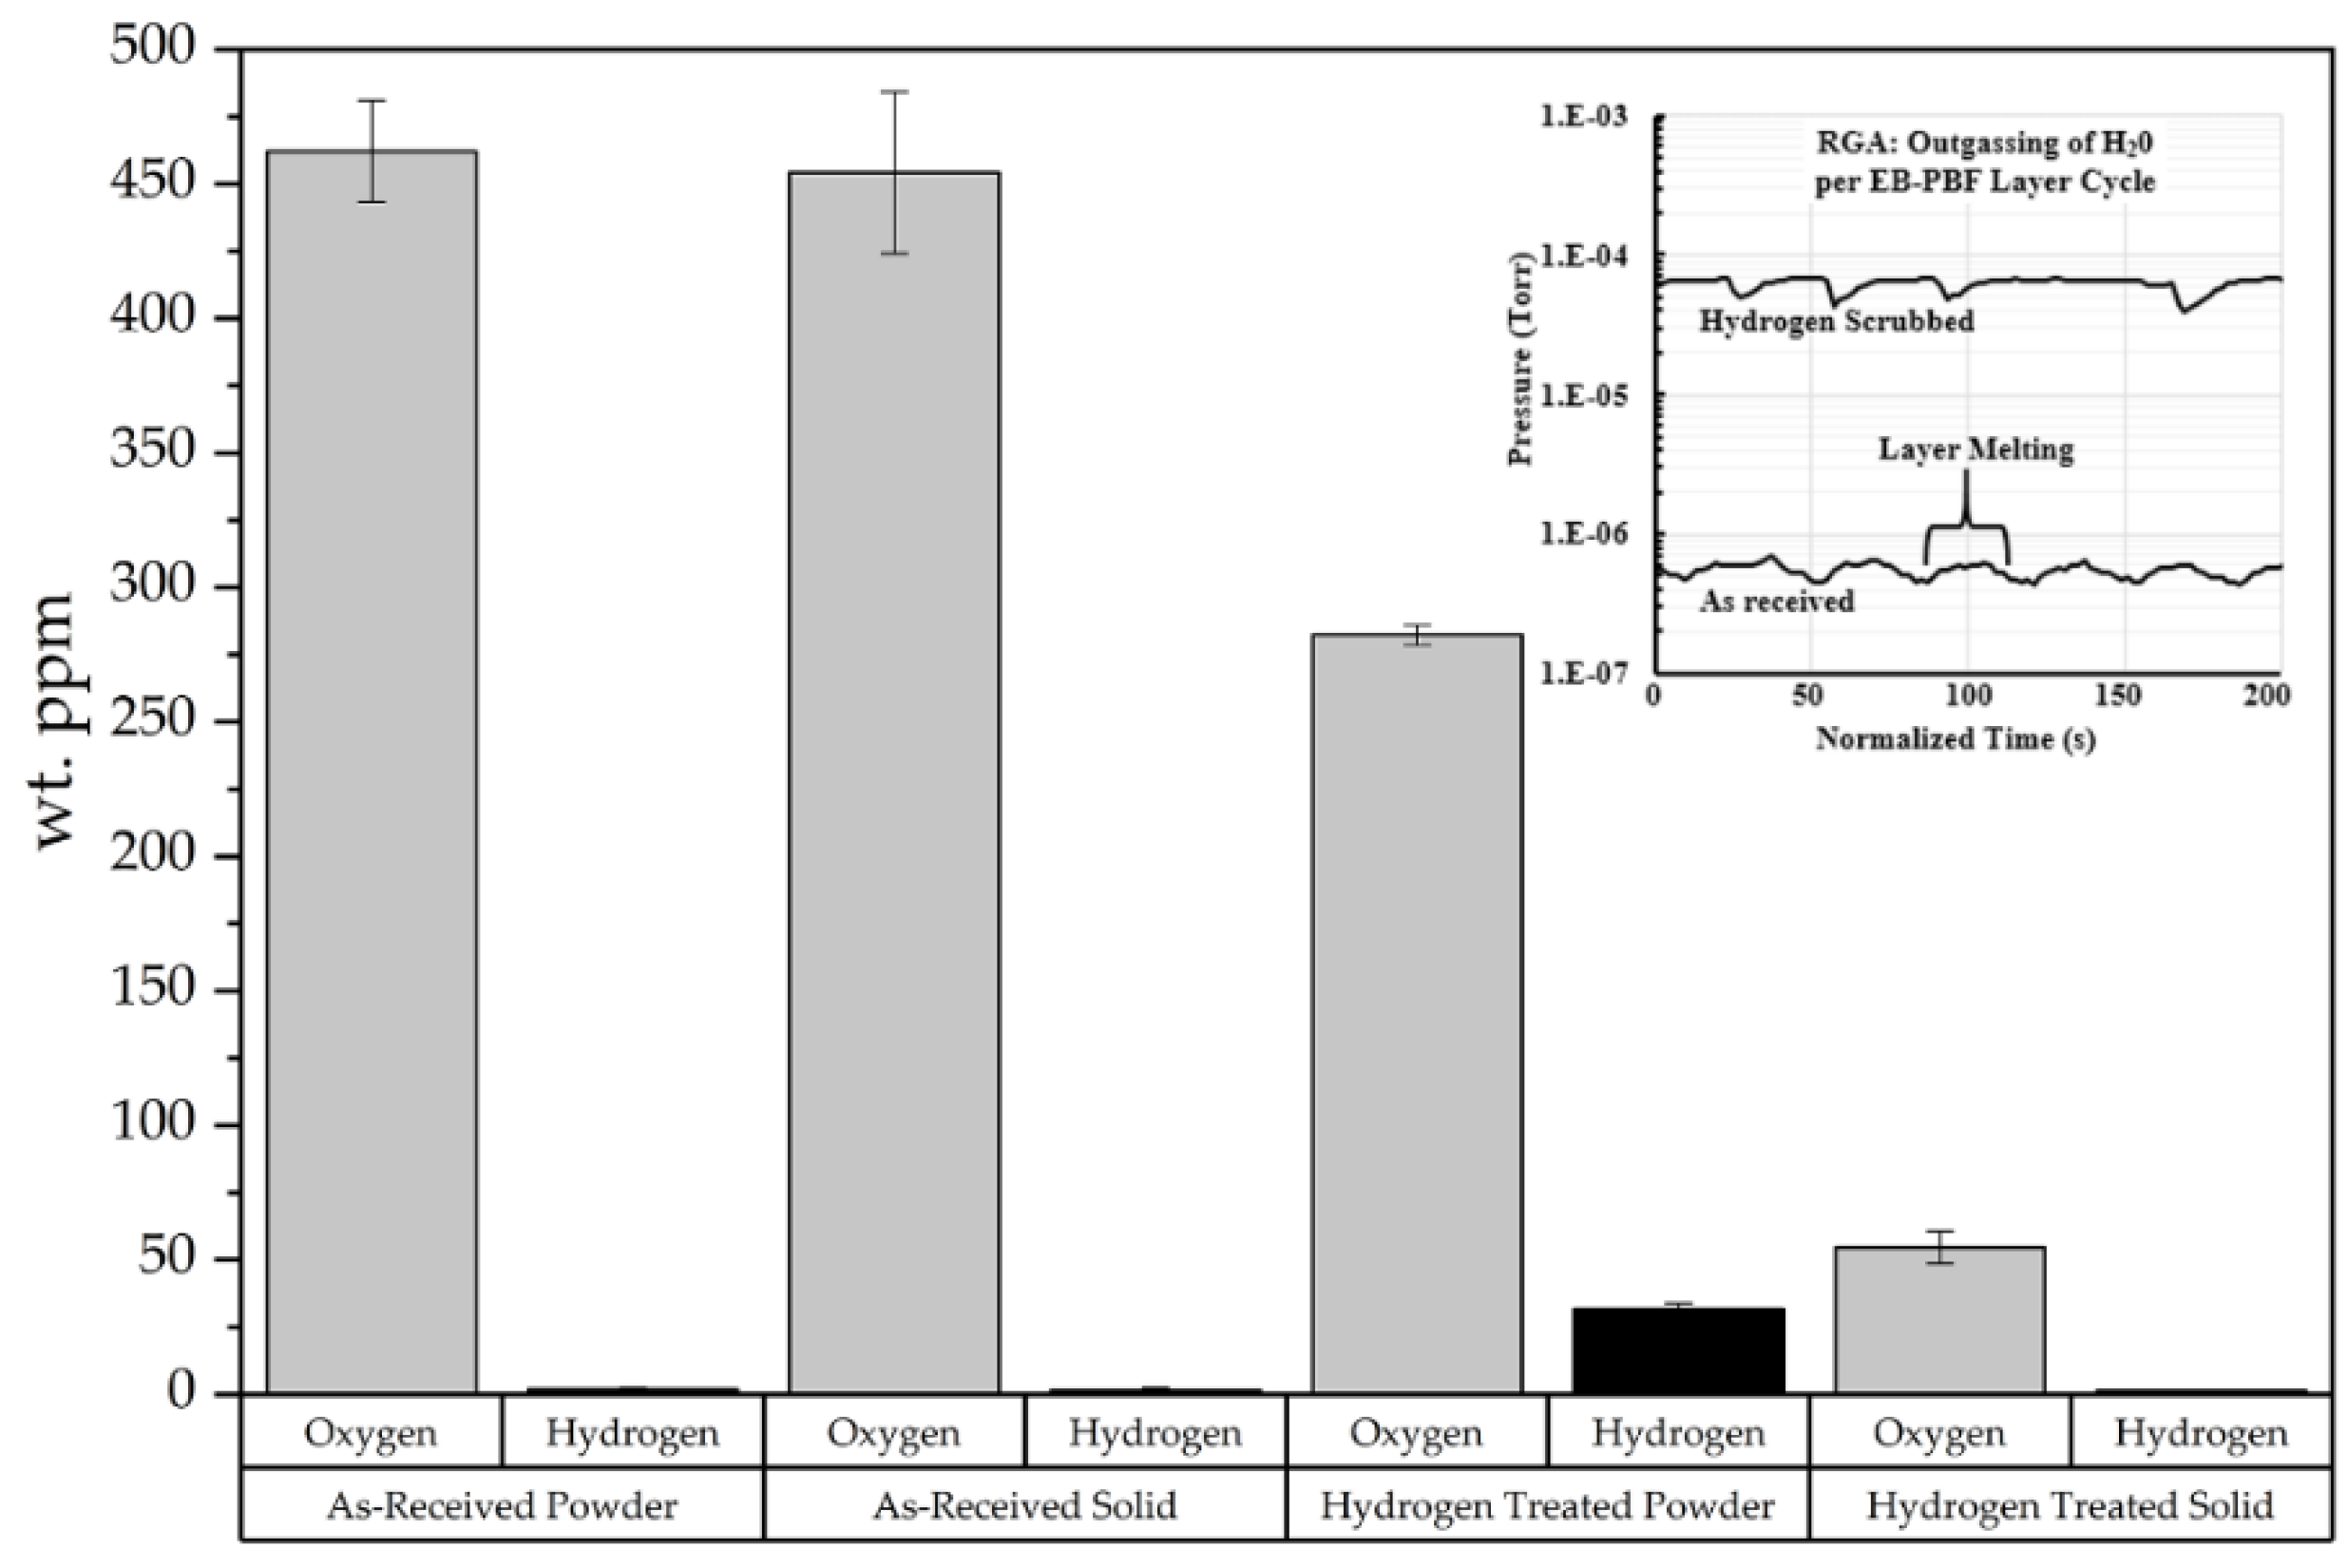
The observations shown here suggest that H2O is released by two mechanisms during EB-PBF. A chemical analysis of the sintered powder bed shows a similar oxygen and hydrogen content as the starting powder, as seen in Table 1, and suggests that the H2O vapor is not released during the preheating step, which is measured in the range of 250–270 °C. While not explored in this study, it is anticipated that higher preheat temperatures, similar to those used by Frigola [1] and Guschlbauer [9], would be sufficiently high to elicit the effect observed by the TGA and heated stage SEM experiments. In the present case, the simulation results and experiments of a single electron beam melt line in a copper powder bed show that as the electron beam scans across the sample during the melting step, the highly localized heat in front and to the sides of the beam causes the particles in the heat affected zone to fracture because of the H2O vapor expansion at 400 °C. The scanning electron microscopy of the particles surrounding the single wafer tracks show fracture surfaces similar to that of Figure 11C.
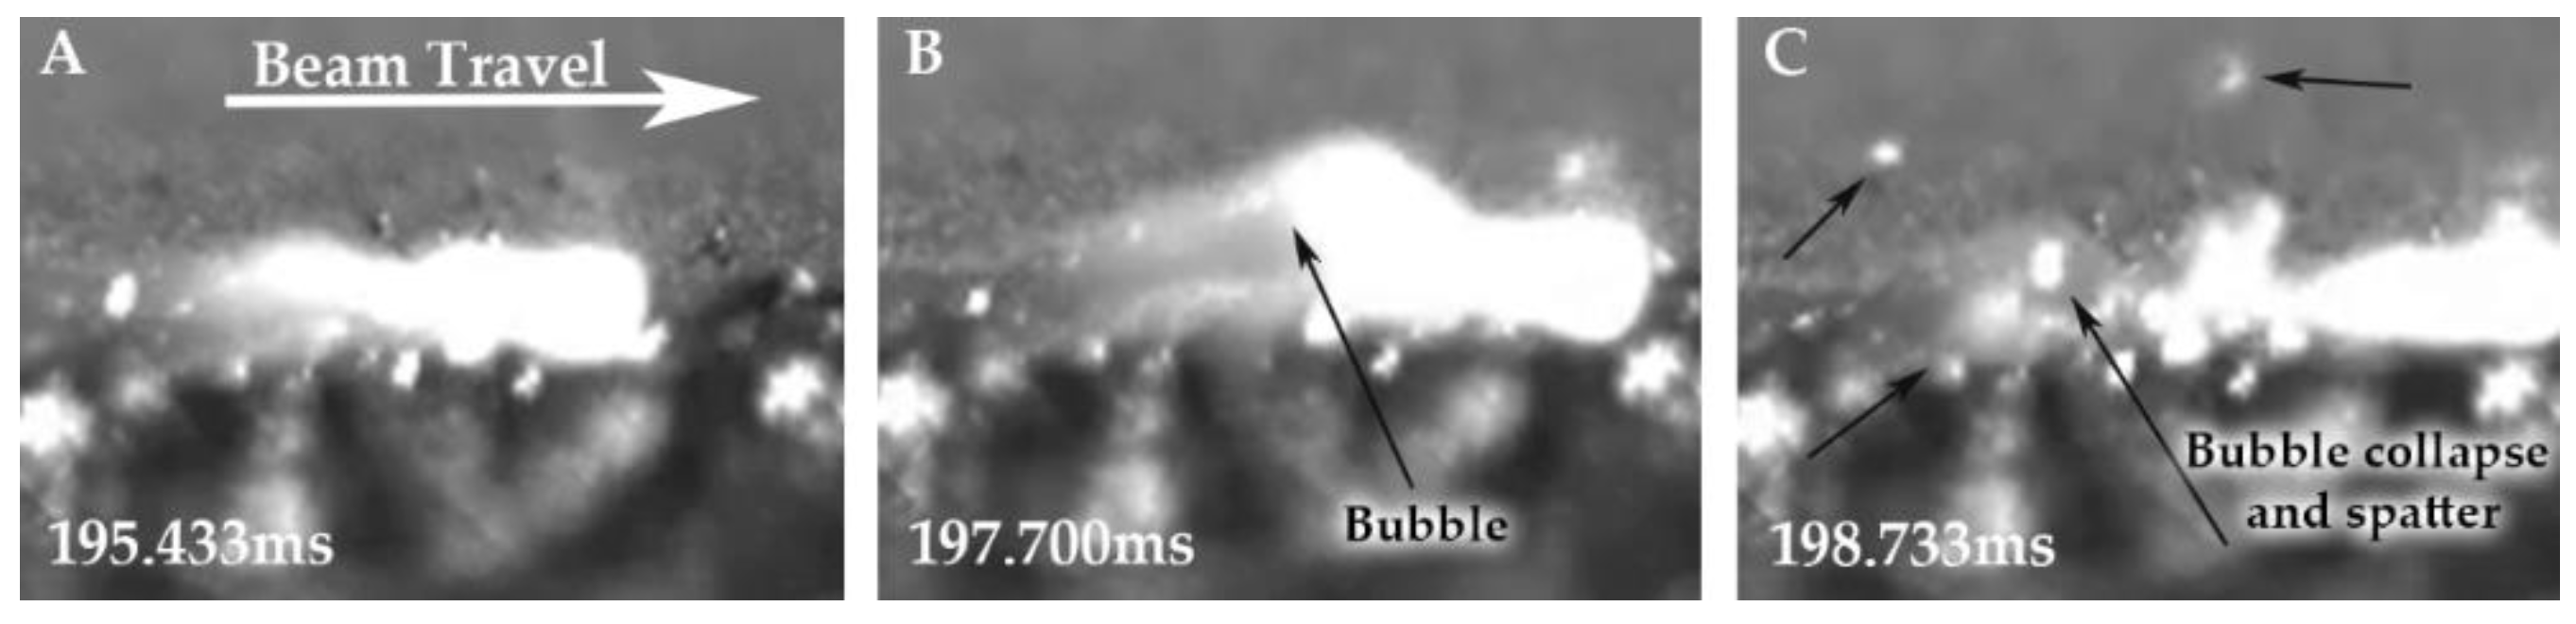
The chemical analyses of the single layer melt solid discs of MO-Cu and HO-Cu show that some amount of H2O vapor is trapped during the solidification of the melt pool, as seen in Figure 14. We theorize that as the particles become molten, the volume of the H2O vapor rapidly expands because of the significant pressure drop due to the vacuum environment, and become bubbles of H2O vapor in the melt pool. According to Boyle’s law, a pressure of 5.7 MPa confined to a sphere with a diameter of 1 um will expand to a sphere with a diameter of 1 mm at a pressure of 5 × e−9 MPa. This is approximately a 109 increase in the volume of the trapped H2O vapor from within a closed pore. The H2O vapor bubbles are able to escape the melt pool, which is evident in the decrease in oxygen and hydrogen content of the single melt layer discs. However, because of the rapid solidification of the melt pool (10−4 to 10−6 °C/s) and the high viscosity of molten copper, and the large amount of spatter associated with bubble collapse, a portion of these H2O vapor bubbles may become trapped in the solid single layer discs as pores. An observation of the multiple layer build validation runs suggest that these pores are largely eliminated by the subsequent remelting of the previous layers, which allows repeated opportunities for the H
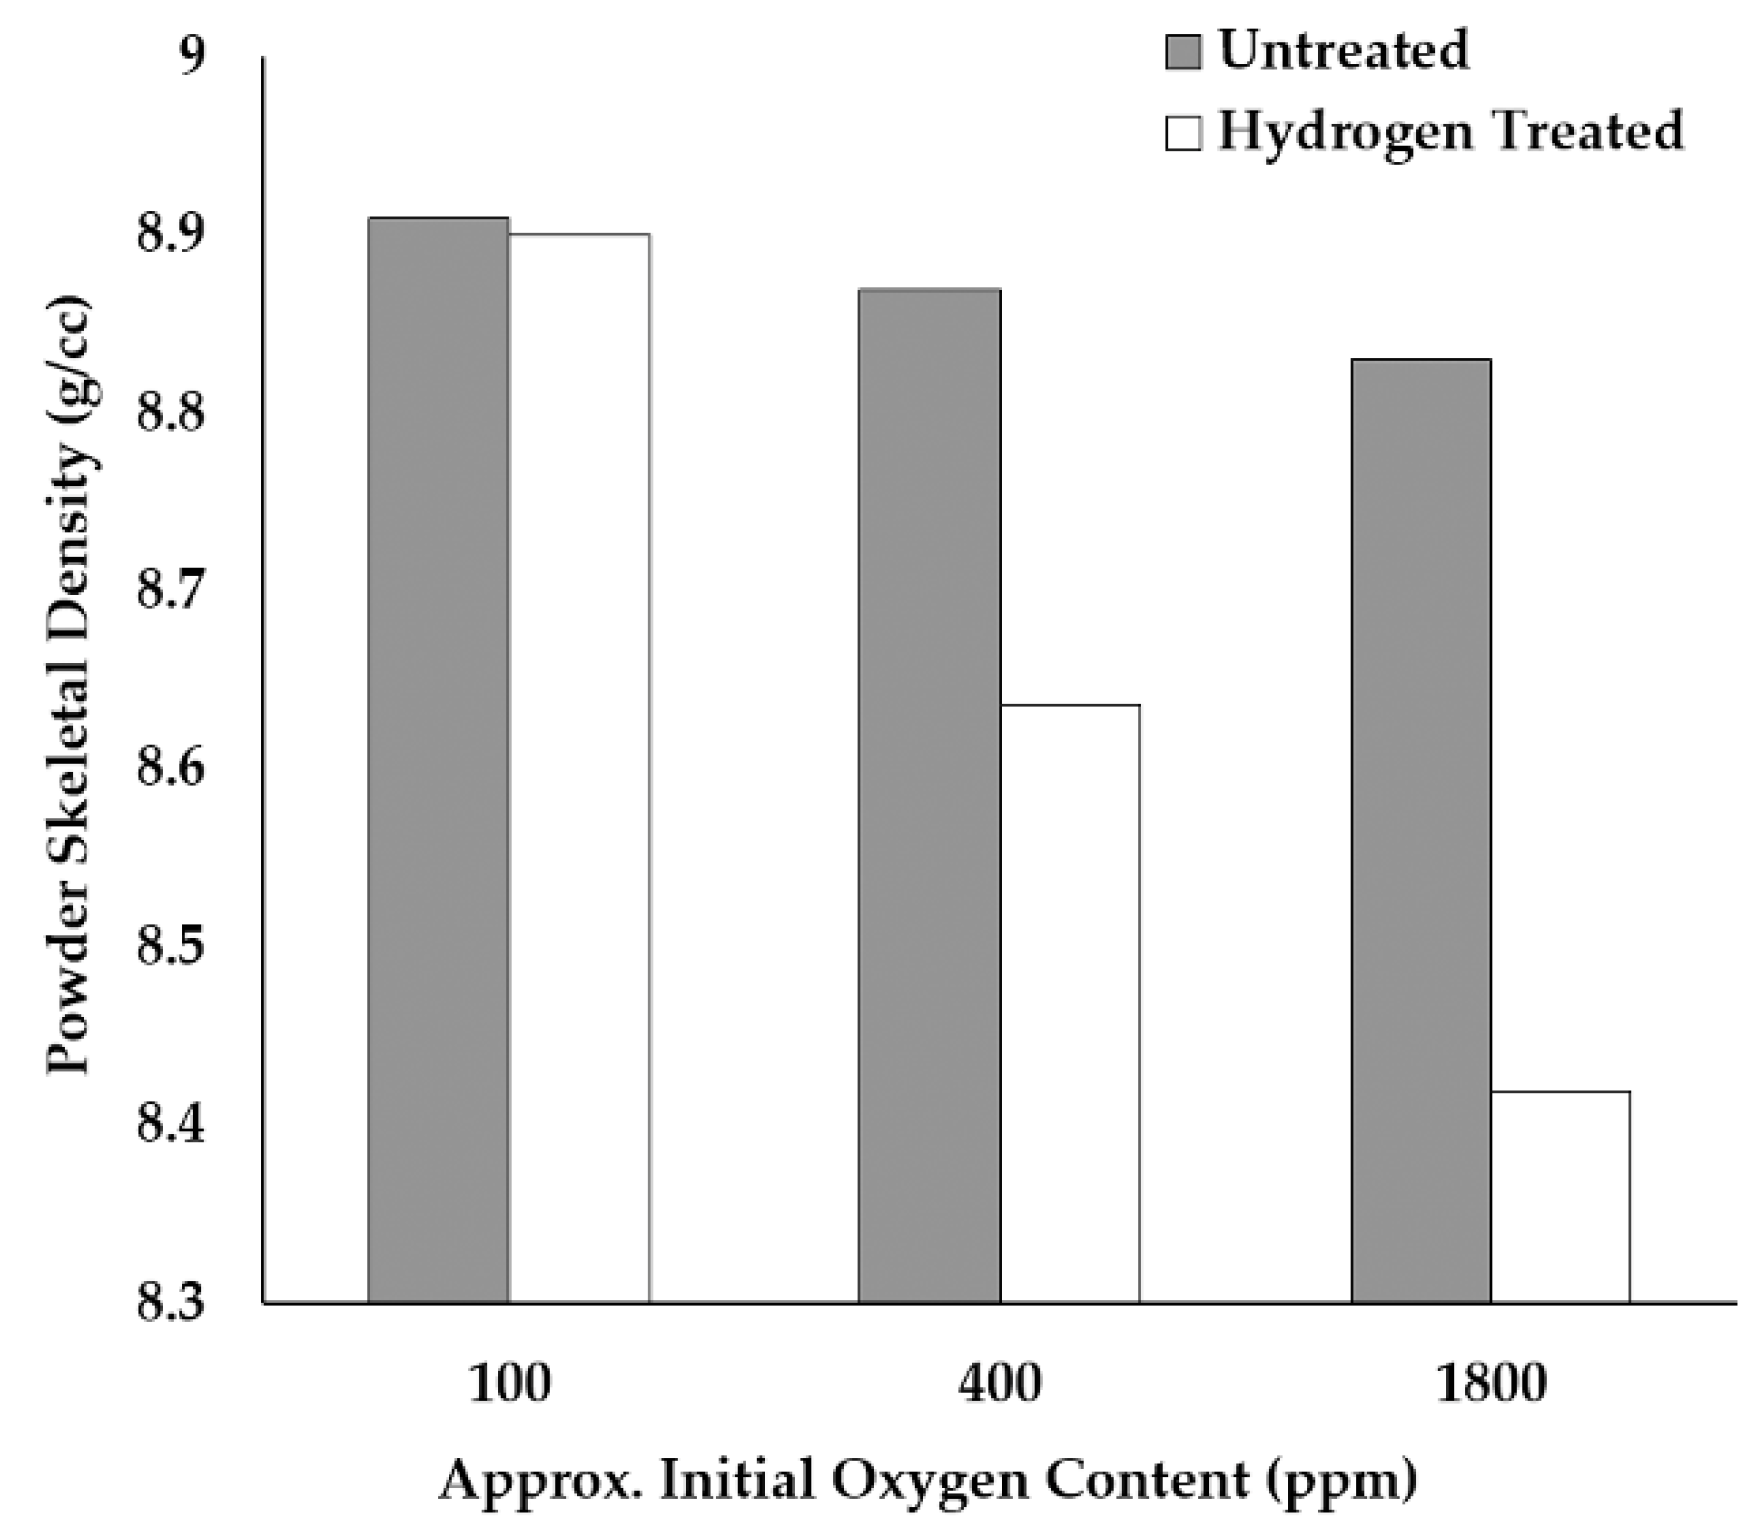
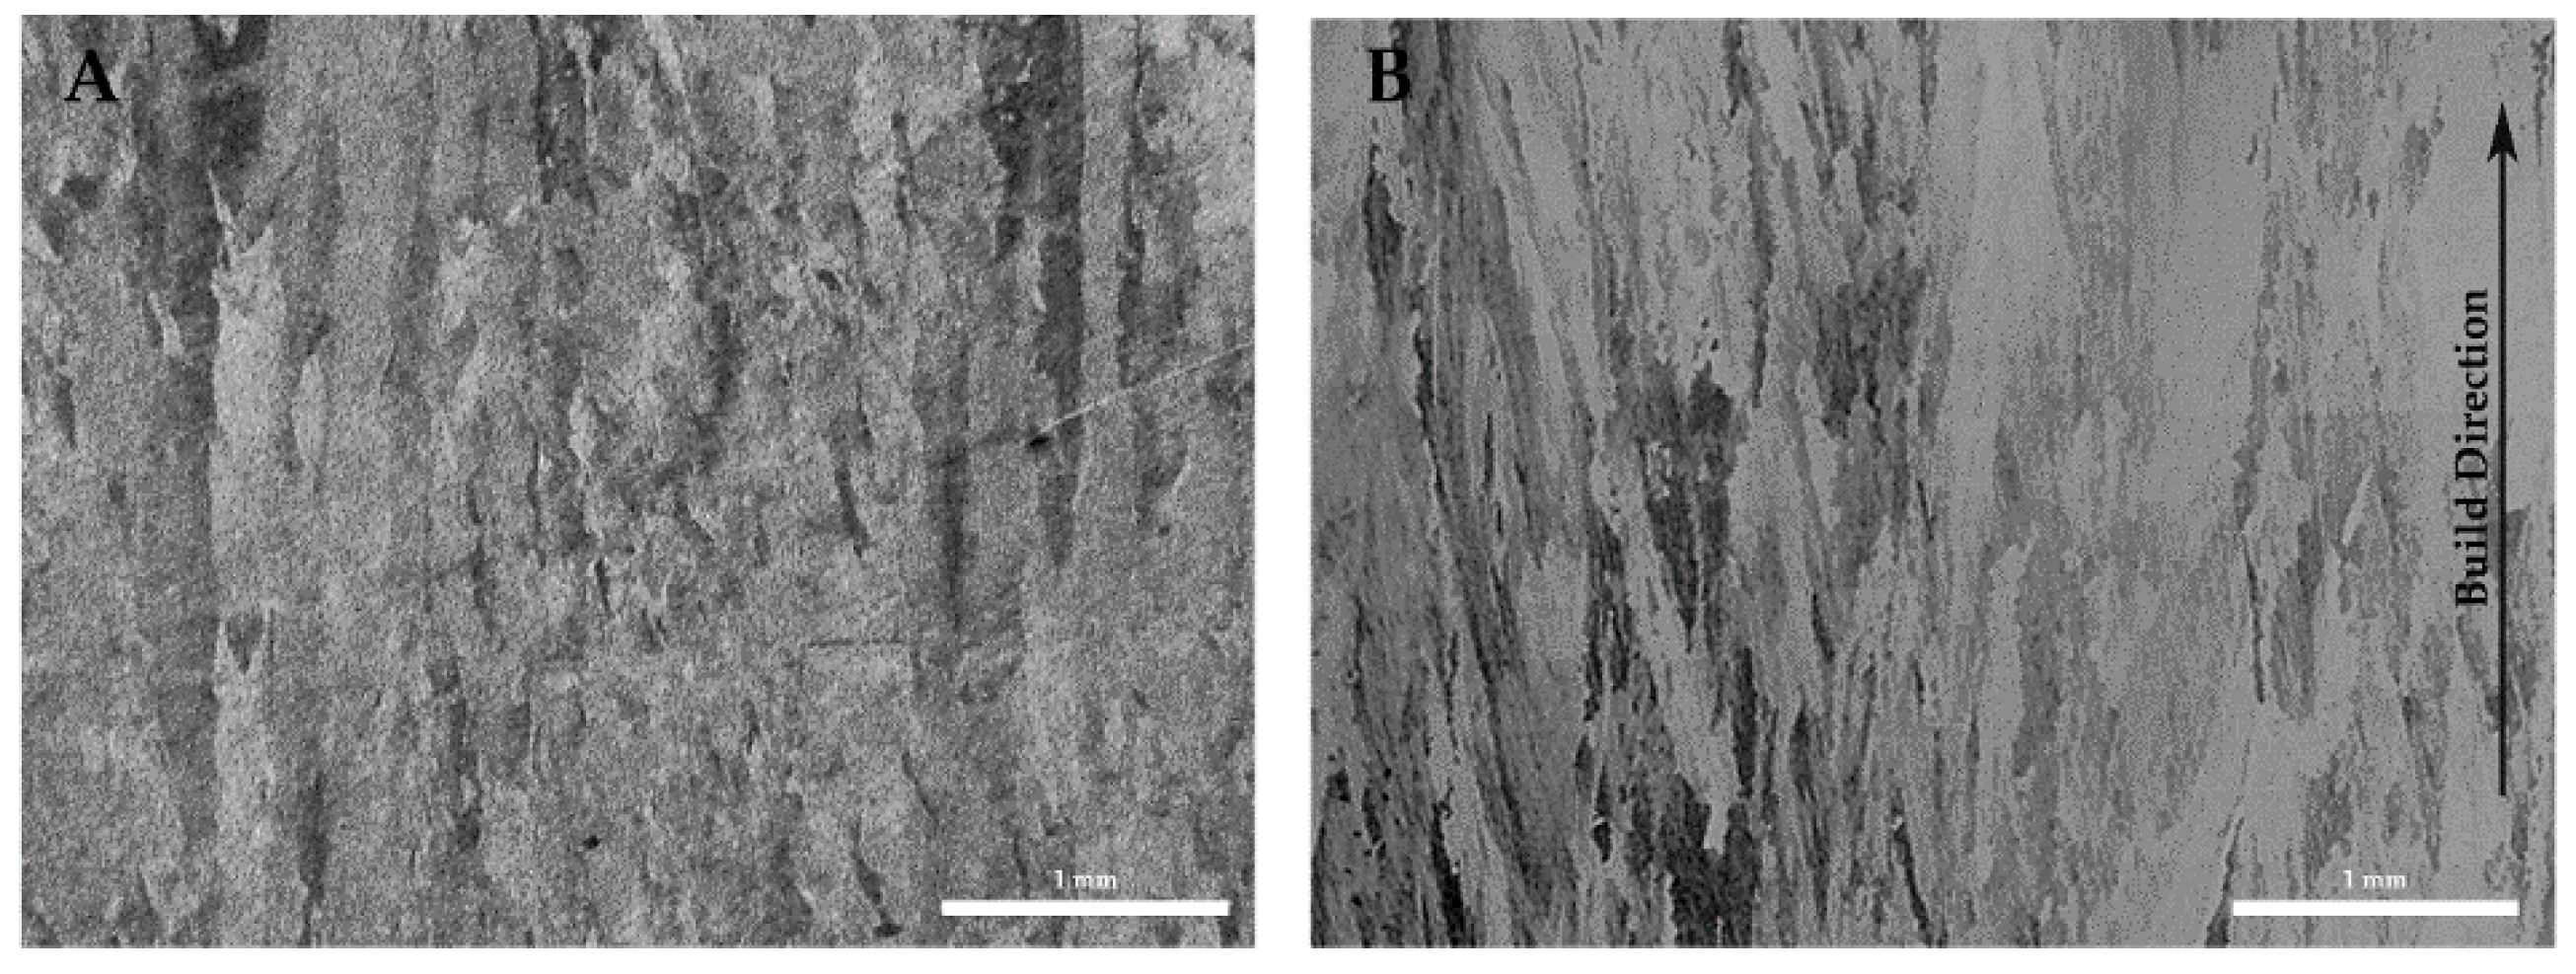
2O vapor to escape to the surface. This is in stark contrast to the traditional copper processing routes (powder metal, sintering, annealing etc.) for which oxygen containing copper powder exposed to a high temperature hydrogen atmosphere results in deleterious embrittlement, cracking, swelling, and porosity. This is clearly shown in the density and microstructures of Figure 18. Also evident is an apparent difference in grain size. This was not investigated in this study, but it is reasonable that the differences in oxygen content and the turbulent liquid pool/spatter brought about by the escape of water vapor during solidification could lead to the disruption of grain growth observed. Further analyses would be required in order to verify this hypothesis.
While the present study has focused on the EB-PBF processing of copper, it is entirely plausible that a comparable methodology could be repeated for the LPBF processes. However, the poor absorptivity, lower ambient temperatures, and lack of a vacuum atmosphere may contribute to a significantly different outcome. In the work by El-Wardany et al. [6], a relatively high oxygen copper powder was heat treated in a forming gas environment in order to remove the surface oxides and subsequently be coated with a polydimethylsiloxane (PDMS) polymer. No further data on the chemistry, properties, or microstructure of this material were reported, other than the observation of the formation of unexpectedly large pores in single track welds that were not present in the untreated powders. These results, and the results of the current study suggest that further research is warranted, which also accounts for the potentially important effects of chamber atmosphere and the partial pressures of the relevant gas species during the AM processing of copper.

5. Conclusions

By utilizing a hydrogen furnace treatment to reduce the oxygen content of atomized copper powder feedstock for use in EBM processing, we have shown the ability to produce pure copper parts with a lower oxygen content than that of the initial feedstock. Depending on the initial oxygen content, the mechanism for reduction shifts from the removal of surface oxides of a low starting oxygen content, to a combination of surface oxide removal and internal H2O vapor formation as the starting oxygen content increases. The release of internally trapped H2O vapor is shown to occur in the heat affected zone to the front and side of the melt pool, in addition to release from the melt pool. Successive remelting allows sufficient time for H2O removal from hydrogen-treated powder, to produce solids resulting in an oxygen content of 50 wt. ppm.

Supplementary Materials

The following are available online at https://www.mdpi.com/2076-3417/9/19/3993/s1.

Author Contributions

Conceptualization, C.L., C.R., D.G. and T.H.; methodology, C.L., C.R. and T.H.; software, C.L.; validation, C.L. and T.H.; formal analysis, C.L.; investigation, C.L.; writing—original draft preparation, C.L., C.R., D.G. and T.H.; writing—review and editing, C.L., C.R., P.C., P.F., D.G. and T.H.; supervision, T.H.; project administration, C.L., C.R., D.G. and T.H.; funding acquisition, D.G. and T.H.

Funding

This research was partially funded by the Navy Sea Systems Command Contract Number N0025316P0261. This research was also partially funded by DARPA INVEST, program N66001-16-1-4044, and the Center for Additive Manufacturing and Logistics, North Carolina State University.

Acknowledgments

This work was performed in part at the Analytical Instrumentation Facility (AIF) at North Carolina State University, which is supported by the State of North Carolina and the National Science Foundation (award number ECCS-1542015). The AIF is a member of the North Carolina Research Triangle Nanotechnology Network (RTNN), a site in the National Nanotechnology Coordinated Infrastructure (NNCI). High speed videos were acquired with the assistance of Dr. Mark Pankow and the Ballistic Loading and Structural Testing Lab (BLAST), Department of Mechanical and Aerospace Engineering, NC State University. We would also like to thank Dr. Yousub Lee at Oak Ridge National Laboratory’s Manufacturing Demonstration Facility for assistance with transient heat input models using FEniCS software.

Conflicts of Interest

The authors declare no conflict of interest.

Appendix A

ParameterValueUnits
Density5376.0kg/m3
Specific Heat390J/kg*K
Thermal Conductivity50w/m*K
Heat Transfer Coefficient0.1w/m2
Emissivity0.5
Preheat Temperature543K
Plate Thickness1mm
Heat Input480watts
Beam Speed0.6m/s
Beam Radius100µm

References

  1. Frigola, P.; Harrysson, O.L.A.; Horn, T.J.; West, H.; Aman, R.; Rigsbee, J.M.; Ramirez, D.A.; Murr, L.; Medina, F.; Wicker, R.B.; et al. Fabricating Copper Components. Adv. Mater. Process. 2014, 172, 20–24. [Google Scholar]
  2. Gamzina, D.; Kozina, M.; Mehta, A.; Nanni, E.; Tantawi, S.; Welander, P.; Horn, T.; Ledford, C. Copper Reconsidered: Material Innovations to Transform Vacuum Electronics. In Proceedings of the 2019 International Vacuum Electronics Conference (IVEC), Busan, Korea, 29 April–1 May 2019; pp. 1–2. [Google Scholar]
  3. Gamzina, D.; Luhmann, N.C.; Ledford, C.; Horn, T.; Karakaut, I.; Lin, L.; Frigola, P. Additive vacuum electronics: Electron beam melting of copper. In Proceedings of the 2017 Eighteenth International Vacuum Electronics Conference (IVEC), London, UK, 24–26 April 2017; pp. 1–2. [Google Scholar]
  4. Horn, T.; Karakaut, I.; Ledford, C.; Gonzalez, M.; Gamzina, D.; Luhmann, N.C.; Lin, L. Additively manufactured WR-10 copper waveguide. In Proceedings of the 2018 IEEE International Vacuum Electronics Conference (IVEC), Monterey, CA, USA, 24–26 April 2018; pp. 409–410. [Google Scholar]
  5. Ives, R.L. Additive Manufacturing of Klystrons. In Proceedings of the 2018 Nineteenth International Vacuum Electronics Conference (IVEC), Monterey, CA, USA, 24 April 2018. [Google Scholar]
  6. El-Wardany, T.I.; She, Y.; Jagdale, V.N.; Garofano, J.K.; Liou, J.J.; Schmidt, W.R. Challenges in Three-Dimensional Printing of High-Conductivity Copper. ASME J. Electron. Packag. 2018, 140, 020907. [Google Scholar] [CrossRef]
  7. Raab, S.J.; Guschlbauer, R.; Lodes, M.A.; Körner, C. Thermal and Electrical Conductivity of 99.9% Pure Copper Processed via Selective Electron Beam Melting. Adv. Eng. Mater. 2016, 18, 1661–1666. [Google Scholar] [CrossRef]
  8. Lodes, M.A.; Guschlbauer, R.; Körner, C. Process development for the manufacturing of 99.94% pure copper via selective electron beam melting. Mater. Lett. 2015, 143, 298–301. [Google Scholar] [CrossRef]
  9. Guschlbauer, R.; Momeni, S.; Osmanlic, F.; Körner, C. Process development of 99.95% pure copper processed via selective electron beam melting and its mechanical and physical properties. Mater. Charact. 2018, 143, 163–170. [Google Scholar] [CrossRef]
  10. Ramirez, D.A.; Murr, L.E.; Li, S.J.; Tian, Y.X.; Martinez, E.; Martinez, J.L.; Machado, B.I.; Gaytan, S.M.; Medina, F.; Wicker, R.B. Open-cellular copper structures fabricated by additive manufacturing using electron beam melting. Mater. Sci. Eng. A 2011, 528, 16–17. [Google Scholar] [CrossRef]
  11. Ramirez, D.A.; Murr, L.E.; Martinez, E.; Hernandez, D.H.; Martinez, J.L.; Machado, B.I.; Medina, F.; Frigola, P.; Wicker, R.B. Novel precipitate–microstructural architecture developed in the fabrication of solid copper components by additive manufacturing using electron beam melting. Acta Mater. 2011, 59, 4088–4099. [Google Scholar] [CrossRef]
  12. Bala, K.; Pradhan, P.R.; Saxena, N.S.; Saksena, M.P. Effective thermal conductivity of copper powders. J. Phys. Appl. Phys. 1989, 22, 1068–1072. [Google Scholar] [CrossRef]
  13. Smith, C.J.; Tammas-williams, S.; Hernandez-nava, E.; Todd, I. Tailoring the thermal conductivity of the powder bed in Electron Beam Melting (EBM) Additive Manufacturing. Sci. Rep. Nat. Publ. Group Lond. 2017, 7, 1–8. [Google Scholar] [CrossRef]
  14. Wei, L.C.; Ehrlich, L.E.; Powell-Palm, M.J.; Montgomery, C.; Beuth, J.; Malen, J.A. Thermal conductivity of metal powders for powder bed additive manufacturing. Addit. Manuf. 2018, 21, 201–208. [Google Scholar] [CrossRef]
  15. Martin, A.A.; Calta, N.P.; Hammons, J.A.; Khairallah, S.A.; Nielsen, M.H.; Shuttlesworth, R.M.; Sinclair, N.; Matthews, M.J.; Jeffries, J.R.; Willey, T.M. Ultrafast dynamics of laser-metal interactions in additive manufacturing alloys captured by in situ X-ray imaging. Mater. Today Adv. 2019, 1, 100002. [Google Scholar] [CrossRef]
  16. Mahamood, R.M. (Ed.) Laser Basics and Laser Material Interactions. In Laser Metal. Deposition Process. of Metals, Alloys, and Composite Materials; Springer International Publishing: Cham, Switzerland, 2018; pp. 11–35. [Google Scholar]
  17. Colopi, M.; Caprio, L.; Demir, A.G.; Previtali, B. Selective laser melting of pure Cu with a 1 kW single mode fiber laser. Procedia CIRP 2018, 74, 59–63. [Google Scholar] [CrossRef]
  18. Constantin, L.; Fan, L.; Mortaigne, B.; Keramatnejad, K.; Zou, Q.; Azina, C.; Lu, Y.F.; Silvain, J.-F. Laser sintering of cold-pressed Cu powder without binder use. Materialia 2018, 3, 178–181. [Google Scholar] [CrossRef]
  19. Ikeshoji, T.-T.; Nakamura, K.; Yonehara, M.; Imai, K.; Kyogoku, H. Selective Laser Melting of Pure Copper. JOM 2018, 70, 396–400. [Google Scholar] [CrossRef]
  20. Kaden, L.; Matthäus, G.; Ullsperger, T.; Engelhardt, H.; Rettenmayr, M.; Tünnermann, A.; Nolte, S. Selective laser melting of copper using ultrashort laser pulses. Appl. Phys. A 2017, 123, 596. [Google Scholar] [CrossRef]
  21. Lykov, P.; Safonov, E.V.; Akhmedianov, A. Selective Laser Melting of Copper. Mater. Sci. Forum 2016, 843, 284–288. [Google Scholar] [CrossRef]
  22. Trevisan, F.; Calignano, F.; Lorusso, M.; Lombardi, M.; Manfredi, D.; Fino, P. Selective Laser Melting of Chemical Pure Copper. In Proceedings of the Euro PM 2017 Congress & Exhibition, Milan, Italy, 1–5 October 2017. [Google Scholar]
  23. Zhong, H.Z.; Li, C.G.; Zhang, X.Y.; Gu, J.F. The graded microstructures evolving with thermal cycles in pure copper processed by laser metal deposition. Mater. Lett. 2018, 230, 215–218. [Google Scholar] [CrossRef]
  24. Davis, J.R. Copper and Copper Alloys; ASM International: Cleveland, OH, USA, 2001. [Google Scholar]
  25. Andrews, P.V.; West, M.B.; Robeson, C.R. The effect of grain boundaries on the electrical resistivity of polycrystalline copper and aluminium. Philos. Mag. J. Theor. Exp. Appl. Phys. 1969, 19, 887–898. [Google Scholar] [CrossRef]
  26. Heuer, R.P. The Effect of Iron And Oxygen on the Electrical Conductivity of Copper. J. Am. Chem. Soc. 1927, 49, 2711–2720. [Google Scholar] [CrossRef]
  27. Belkin, E.; Nagata, P.K. Hydrogen Embrittlement of Tough Pitch Copper by Brazing. Weld. Res. Suppl. 1975, 54–62. [Google Scholar]
  28. Ward, T.G.; Nix, W.D. The formation of water vapor bubbles in copper and their effect on intergranular creep fracture. Acta Metall. 1980, 28, 557–566. [Google Scholar]
  29. Hallstedt, B.; Risold, D.; Gauckler, L.J. Thermodynamic assessment of the copper-oxygen system. J. Phase Equilibria 1994, 15, 483–499. [Google Scholar] [CrossRef]
  30. Nieh, T.G.; Nix, W.D. Embrittlement of copper due to segregation of oxygen to grain boundaries. Metall. Trans. A 1981, 12, 893–901. [Google Scholar] [CrossRef]
  31. Goldstein, E.A.; Mitchell, R.E. Chemical kinetics of copper oxide reduction with carbon monoxide. Proc. Combust. Inst. 2011, 33, 2803–2810. [Google Scholar] [CrossRef]
  32. Poulston, S.; Parlett, P.M.; Stone, P.; Bowker, M. Surface Oxidation and Reduction of CuO and Cu2O Studied Using XPS and XAES. Surf. Interface Anal. 1996, 24, 811–820. [Google Scholar] [CrossRef]
  33. Ren, D.; Deng, Y.; Handoko, A.D.; Chen, C.S.; Malkhandi, S.; Yeo, B.S. Selective Electrochemical Reduction of Carbon Dioxide to Ethylene and Ethanol on Copper(I) Oxide Catalysts. ACS Catal. 2015, 5, 2814–2821. [Google Scholar] [CrossRef]
  34. Magnusson, H.; Frisk, K. Diffusion, Permeation and Solubility of Hydrogen in Copper. J. Phase Equilibria Diffus. 1993, 38, 65–69. [Google Scholar] [CrossRef]
  35. Ito, H.; Hayashi, K. Detection of Gases in Closed Pores of Incompletely Densified Copper Sintering. In Proceedings of the 1993 Powder Metall, Kyoto, Japan, 12–15 July 1993. [Google Scholar]
  36. Lin, Y.-J.; Hwang, K.-S. Swelling of Copper Powders during Sintering of Heat Pipes in Hydrogen-Containing Atmospheres. Mater. Trans. 2010, 51, 2251–2258. [Google Scholar] [CrossRef] [Green Version]
  37. Collet, R.; le Gallet, S.; Charlot, F.; Lay, S.; Chaix, J.M.; Bernard, F. Oxide reduction effects in SPS processing of Cu atomized powder containing oxide inclusions. Mater. Chem. Phys. 2016, 173, 498–507. [Google Scholar] [CrossRef]
  38. Louthan, M.R.; Caskey, G.R.; Donovan, J.A.; Rawl, D.E. Hydrogen embrittlement of metals. Mater. Sci. Eng. 1972, 10, 357–368. [Google Scholar] [CrossRef]
  39. Magnusson, H.; Frisk, K. Self-Diffusion and Impurity Diffusion of Hydrogen, Oxygen, Sulphur and Phosphorus in Copper; Swerea KIMAB AB: Stockholm, Sweden, December 2013; p. 33. [Google Scholar]
  40. Murr, L.E.; Gaytan, S.M.; Ramirez, D.A.; Martinez, E.; Hernandez, J.; Amato, K.N.; Shindo, P.W.; Medina, F.R.; Wicker, R.B. Metal Fabrication by Additive Manufacturing Using Laser and Electron Beam Melting Technologies. J. Mater. Sci. Technol. 2012, 28, 1–14. [Google Scholar] [CrossRef]
  41. Lee, Y.S.; Kirka, M.M.; Raghavan, N.; Dehoff, R.R. Simulation of Spot Melting Scan Strategy to Predict Columnar to Equiaxed Transition in Metal Additive Manufacturing. In Proceedings of the International Solid Freeform Fabrication Symposium, Austin, TX, USA, 7–9 August 2017; p. 13. [Google Scholar]
  42. Lee, S.-K.; Hsu, H.-C.; Tuan, W.-H. Oxidation Behavior of Copper at a Temperature below 300 °C and the Methodology for Passivation. Mater. Res. 2016, 19, 51–56. [Google Scholar] [CrossRef]
  43. White, A.H.; Germer, L.H. The Rate of Oxidation of Copper at Room Temperature. Trans. Electrochem. Soc. 1942, 81, 305–319. [Google Scholar] [CrossRef]
  44. Zhou, Y.; Liu, J.; Liang, D.; Shi, W.; Yang, W.; Zhou, J. Effect of particle size and oxygen content on ignition and combustion of aluminum particles. Chin. J. Aeronaut. 2017, 30, 1835–1843. [Google Scholar] [CrossRef]
Figure 1. Hydrogen brazing furnace at SLAC National Accelerator Laboratory Technology Innovation Directorate (TID) (left), and stacked-stainless steel fixture (right) for treating multiple trays of copper powder in 2-mm thick layers.
Applsci 09 03993 g001
Figure 2. Photographs of the customized Arcam A2 electron beam melting system, showing the interior of the vacuum chamber, mechanical components and in-situ backscatter electron (BSE) detector (A), and the exterior of the vacuum chamber, showing the electron beam column and the location of instrumentation and viewports (B). The line of sight of the visible light camera, pyrometer, and IR camera are illustrated by the dashed lines in 2A, from viewports 1, 2, and 3, respectively.
Applsci 09 03993 g002
Figure 3. Illustration of the single melt track width geometry with 2.0 mm spacing. Powder was harvested from between the wafers in a serial fashion, as a function of the distance from the solid copper wall.
Applsci 09 03993 g003
Figure 4. Illustration of the in-situ H2O vapor out-gassing experiment. The electron beam melting (EBM) vacuum chamber is outfitted with a residual gas analysis (RGA) and IR camera, and the surface temperature is monitored by a two-color pyrometer and thermocouple (A). The base fixture contains six 3 mm deep pockets (B), which are filled with hydrogen-treated and untreated powders with varying initial oxygen content. A single layer disc is melted on the top surface of each powder type. During melting, H2O is released from the powder or melt pool, and detected by the RGA (C). Upon completion, the powder is manually removed from the solid disc of copper, which is analyzed for oxygen and hydrogen content by inert gas fusion (D).
Applsci 09 03993 g004
Figure 5. Plot showing at. % oxygen versus at. % hydrogen for all of the hydrogen heat-treated copper powders used in this study.
Applsci 09 03993 g005
Figure 6. Plot showing the skeletal density of the untreated and hydrogen heat-treated copper powders of varying initial oxygen content, as measured by helium pycnometry.
Applsci 09 03993 g006
Figure 7. Representative low and high magnification scanning electron micrographs of untreated and hydrogen-treated MO-Cu powder. (A) Low magnification and (C) high magnification of untreated hydrogen-treated MO-Cu powder; (B) Low magnification and (D) high magnification of hydrogen-treated MO-Cu powder.
Applsci 09 03993 g007
Figure 8. Representative high magnification ion channeling contrast micrographs of pretreated LO-Cu (A), MO-Cu (B), HO-Cu (C), and post hydrogen treatment LO-Cu (D), MO-Cu (E), and HO-Cu (F) focused ion beam (FIB) sectioned Cu powder particles showing the presence of grain boundary Cu2O in the untreated condition (AC), which reacts with hydrogen to form H2O pores (E,F). LO-Cu powder lacks significant grain boundary oxides, and therefore does not exhibit H2O vapor induced porosity. Note that scale bars vary in the images.
Applsci 09 03993 g008
Figure 9. HAADF STEM micrograph and energy dispersive spectroscopy (EDS) of hydrogen-treated MO-Cu powder grain boundary triple point showing submicron scale H2O vapor induced porosity.
Applsci 09 03993 g009
Figure 10. Thermogravimetric analysis of untreated and hydrogen-treated LO-Cu, MO-Cu, and HO-Cu powder under flowing nitrogen.
Applsci 09 03993 g010
Figure 11. Scanning electron micrographs of a HO-Cu particle after hydrogen treatment, before (A) and after (BD) in-situ SEM heating on a SiC chip to 400 °C at 100 °C/s under a vacuum.
Applsci 09 03993 g011
Figure 12. Contour plot of the temperature profile in the XZ plane during melting, with a 2000 µm hatch spacing, showing SEM images of particles located at the edge/wall (A), ~0.1 mm (B), and ~0.3–0.5 mm (C) from the wafer.
Applsci 09 03993 g012
Figure 13. Photograph showing the oxygen free electronic (OFE) copper fixture after EB-PBF of single layer discs on top of hydrogen-treated powder cakes (A). Optical microscope images of the surface of single layer disc produced with hydrogen-treated HO-Cu showing pitting and porosity (B), and surface of single layer disc produced with hydrogen-treated LO-Cu, showing a smooth surface texture (C). Tabulated oxygen and hydrogen contents of the precursor powders and the solid single layer discs for each treated powder condition (D).
Applsci 09 03993 g013
Figure 14. Residual gas analysis of HO-Cu, MO-Cu, and LO-Cu powder during the electron beam powder bed fusion (EB-PBF) of single layer discs.
Applsci 09 03993 g014
Figure 15. Representative frames of high-speed video footage showing the EB-PBF of a single layer disc on hydrogen-treated LO-Cu powder at timestamps −172.333 ms (A), −170.200 ms (B), −167.687 ms (C).
Applsci 09 03993 g015
Figure 16. Representative frames of high-speed video footage showing the EB-PBF of a single layer disc on hydrogen-treated HO-Cu powder at timestamps 195.433 ms (A), 197.700 ms (B), 198.733 ms (C).
Applsci 09 03993 g016
Figure 17. Oxygen and hydrogen content of precursor powders and solid copper cylinders produced with the EB-PBF of untreated and hydrogen-treated MO-Cu powder, and (inset) in-situ residual gas analysis of both EB-PBF runs, showing the layerwise outgassing of H2O.
Applsci 09 03993 g017
Figure 18. Optical micrographs showing polished and etched microstructures of copper samples fabricated with EB-PBF using hydrogen heat-treated MO-Cu powder (A) and untreated MO-Cu powder (B). The build direction for both samples are indicated by the arrow in B.
Applsci 09 03993 g018
Figure 19. Wt. ppm oxygen as a function of the particle size, assuming a 5 nm cuprous oxide film.
Applsci 09 03993 g019
Table 1. Chemical content of copper powders.
Powder IDConditionAverage
O2 (wt. ppm)
Standard
Deviation (wt. ppm)
Average
H2 (wt. ppm)
Standard
Deviation (wt. ppm)
LO-Cu
(15–53 um)
Untreated226.5111.360.870.56
Hydrogen Treated54.768.341.560.97
MO-Cu
(15–53 um)
Untreated462.1718.871.810.66
Hydrogen Treated282.333.7931.832.02
HO-Cu
(15–53 um)
Untreated1507.3312.701.950.99
Hydrogen Treated586.9735.2876.445.77

