1. Introduction
Video analysis is common in elite sports and covers different areas of application. In individual sports, especially acrobatic sports, video analysis is used to compare and improve complex skills [
1]. For quantifying biomechanical aspects of such skills, such as score-relevant kinematic variables of vaults in artistic gymnastics, 3D motion capture (3D video analysis) is used. [
2,
3]. By means of video analyses, Brehmer and Naundorf [
4] created reference values for kinematic parameters, indicating the safe execution of vaults. To make use of such reference values, measuring certain kinematic parameters in routine training becomes crucial, so that gymnasts’ performances can be compared with the requirements of certain vaults. In regard to monitoring training progress, using video analysis during routine training is intriguing [
2,
3].
The gold standard for complex kinematic analyses is 3D motion capture, with which movements can be analyzed in sagittal, frontal, and transversal planes simultaneously [
5]. However, precise 3D motion capture is associated with considerable financial, spatial, and temporal issues, and is therefore uncommon in routine training settings [
6]. Two-dimensional video analysis (2D analysis), if sufficiently accurate, could offer a more practical alternative for measuring kinematics during training, especially since advancements in smartphone and tablet technology are continually making high-definition video capture and analysis more convenient. Aside from convenience while capturing motion, 2D video is faster, cheaper, and requires less prior knowledge compared to 3D analysis [
1,
7]. Nonetheless, although multiple studies showed moderate validity compared to 3D motion capture and high intrarater reliability of 2D analysis when examining joint angles during simple movements, such as single-leg squats and running [
1,
5,
6,
7], the validity and reliability of 2D video analysis for complex skills in acrobatic sports are unclear and must be scientifically assessed before this method can be recommended for gymnastics. The validity and reliability of 2D analysis were deemed sufficient for measuring the flight time and height of vertical jumps, when compared to optical measurement systems (Opto Jump, Microgate, I) [
8] or to a force plate [
9]. Further, 2D analysis was deemed valid (ICC = 0.8) and reliable (ICC > 0.85) for measuring joint angles during the more complex skill of baseball pitching, as long as the camera was placed properly [
1], so the possibility of it being useful in gymnastics seems worthy of investigation.
In summary, the studies mentioned above offer justification for using simple, time-saving, and cost-effective 2D analysis for simple lower-extremity movements based on good validity and reliability compared to gold-standard methods. However, in contrast to movements in previous studies, artistic gymnastics involve highly complex movements that are performed with high accelerations and velocities. Therefore, the aim of this study was to investigate criterion validity (comparison of 2D to 3D analysis) and both intrarater (test-retest) and interrater (equivalence of two assessors) reliability of 2D video analysis for the peak height (hpeak) and length of flight (L) of vaults in artistic gymnastics.
2. Materials and Methods
Twenty-two junior and international elite gymnasts (female: n = 5; male: n = 17) volunteered to participate in the study. All subjects gave written informed consent before participating in the study. All study procedures were approved by the ethics committee Bern (17.01.2017; Project-ID: 2016-01970) and conducted in accordance with the current version of the Declaration of Helsinki, the ICH-GCP, ISO EN 14155, and all national legal and regulatory requirements.
In total, 38 vaults were used for assessment. These included vaults from the three most important vault categories (handspring, Tsukahara, and Yurchenko) and comprised a variety of different sagittal plane rotations (tuck/double tuck, pike/double pike, and layout), which were combined with up to three turns around the longitudinal axis. These vaults were simultaneously recorded with conventional 2D video and a 3D motion capture system (Vicon Motion System, Denver, CO, USA) and analyzed to determine hpeak and L in the second flight phase.
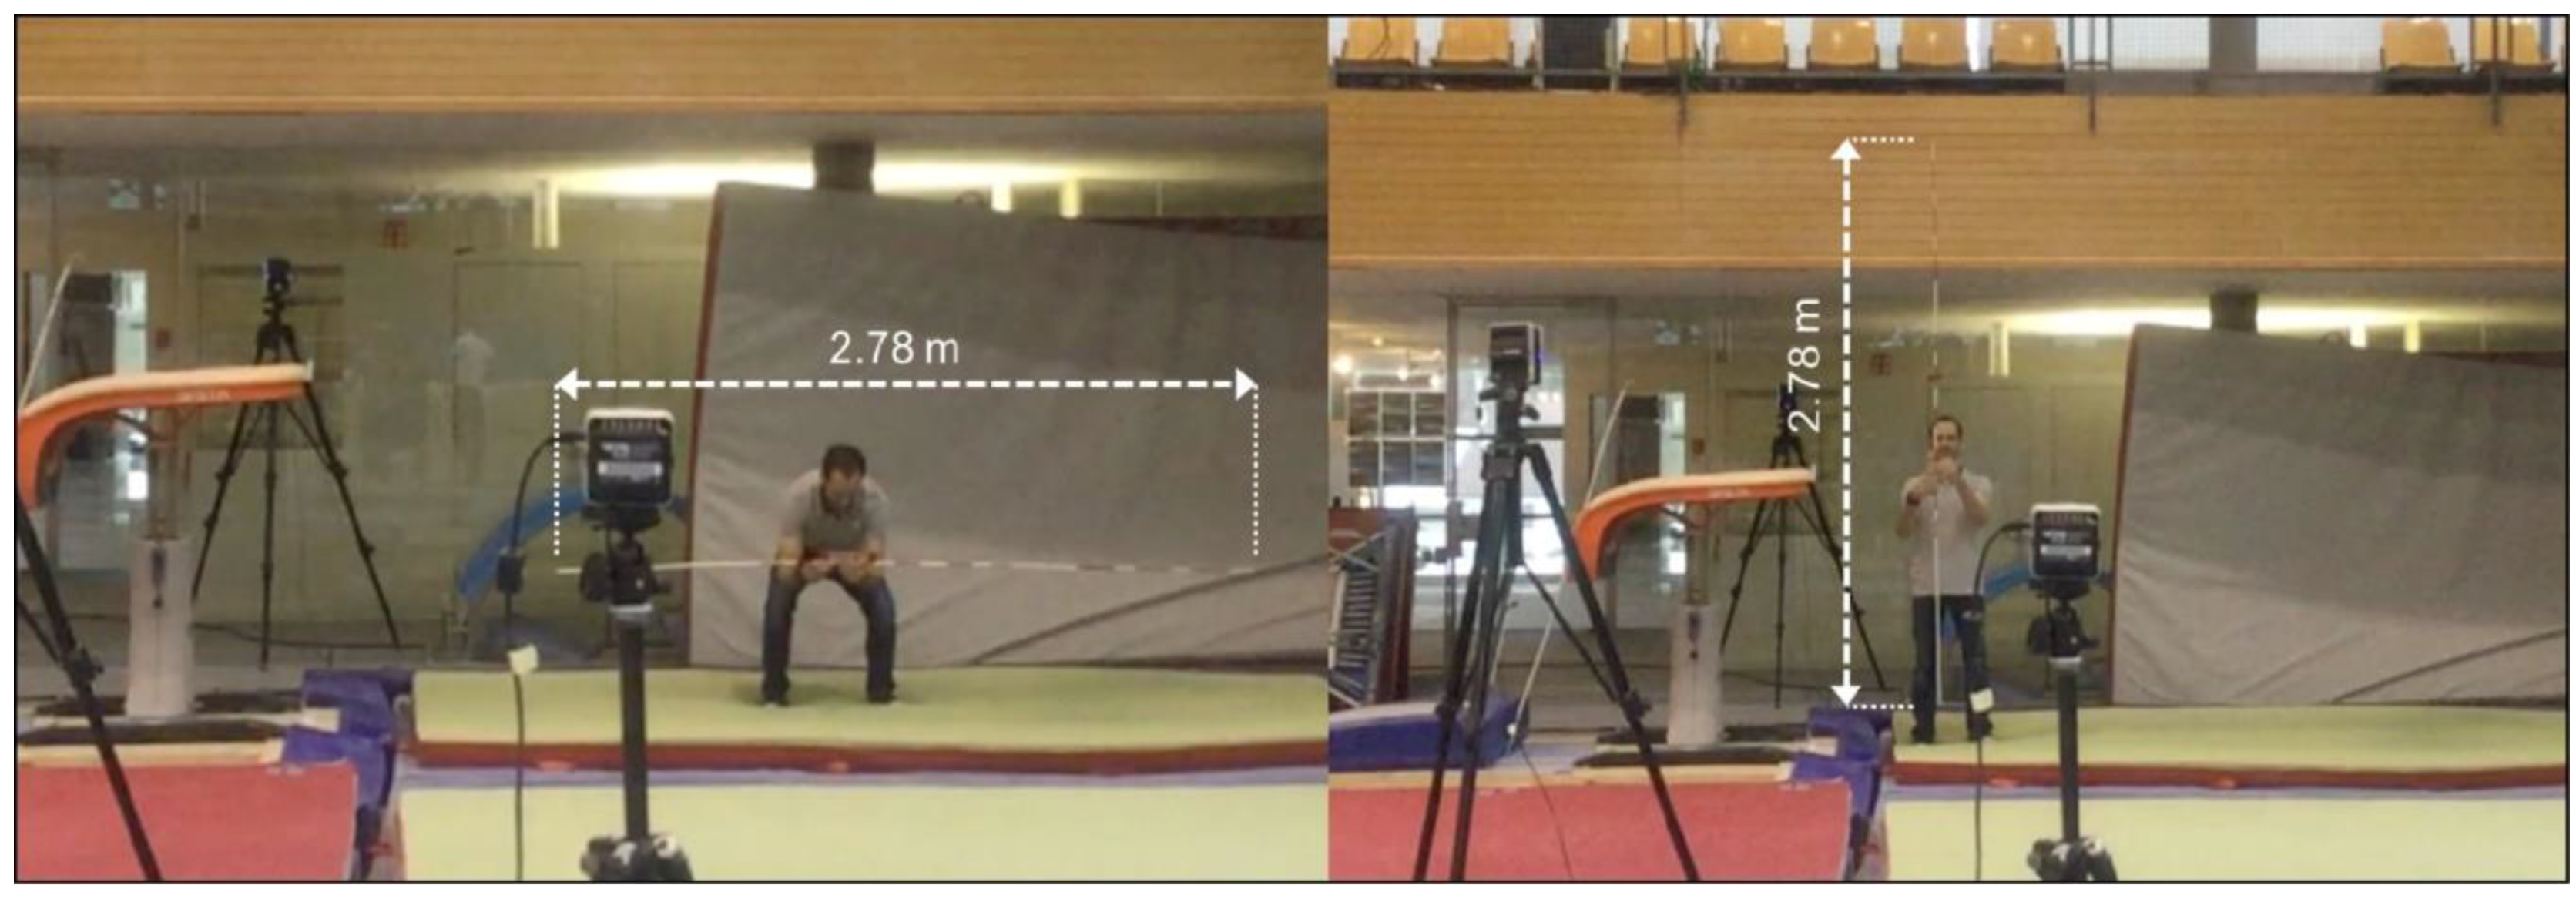
For 2D analysis, vaults were filmed using an iPad (iPad Pro 9.7", Apple Corporation, Cupertino, CA, USA) at 100 frames/s. The lens of the iPad was placed at a height of 1.55 m and at a distance of 10 m from the vaulting table, so that the take-off, first and second flight phases, and landing were all visible. The height and width of the image were calibrated within the analytical software (Dartfish SA, Fribourg, CH) by using a rod of known length (2.78 m) that was held vertically and horizontally along the landing zone (
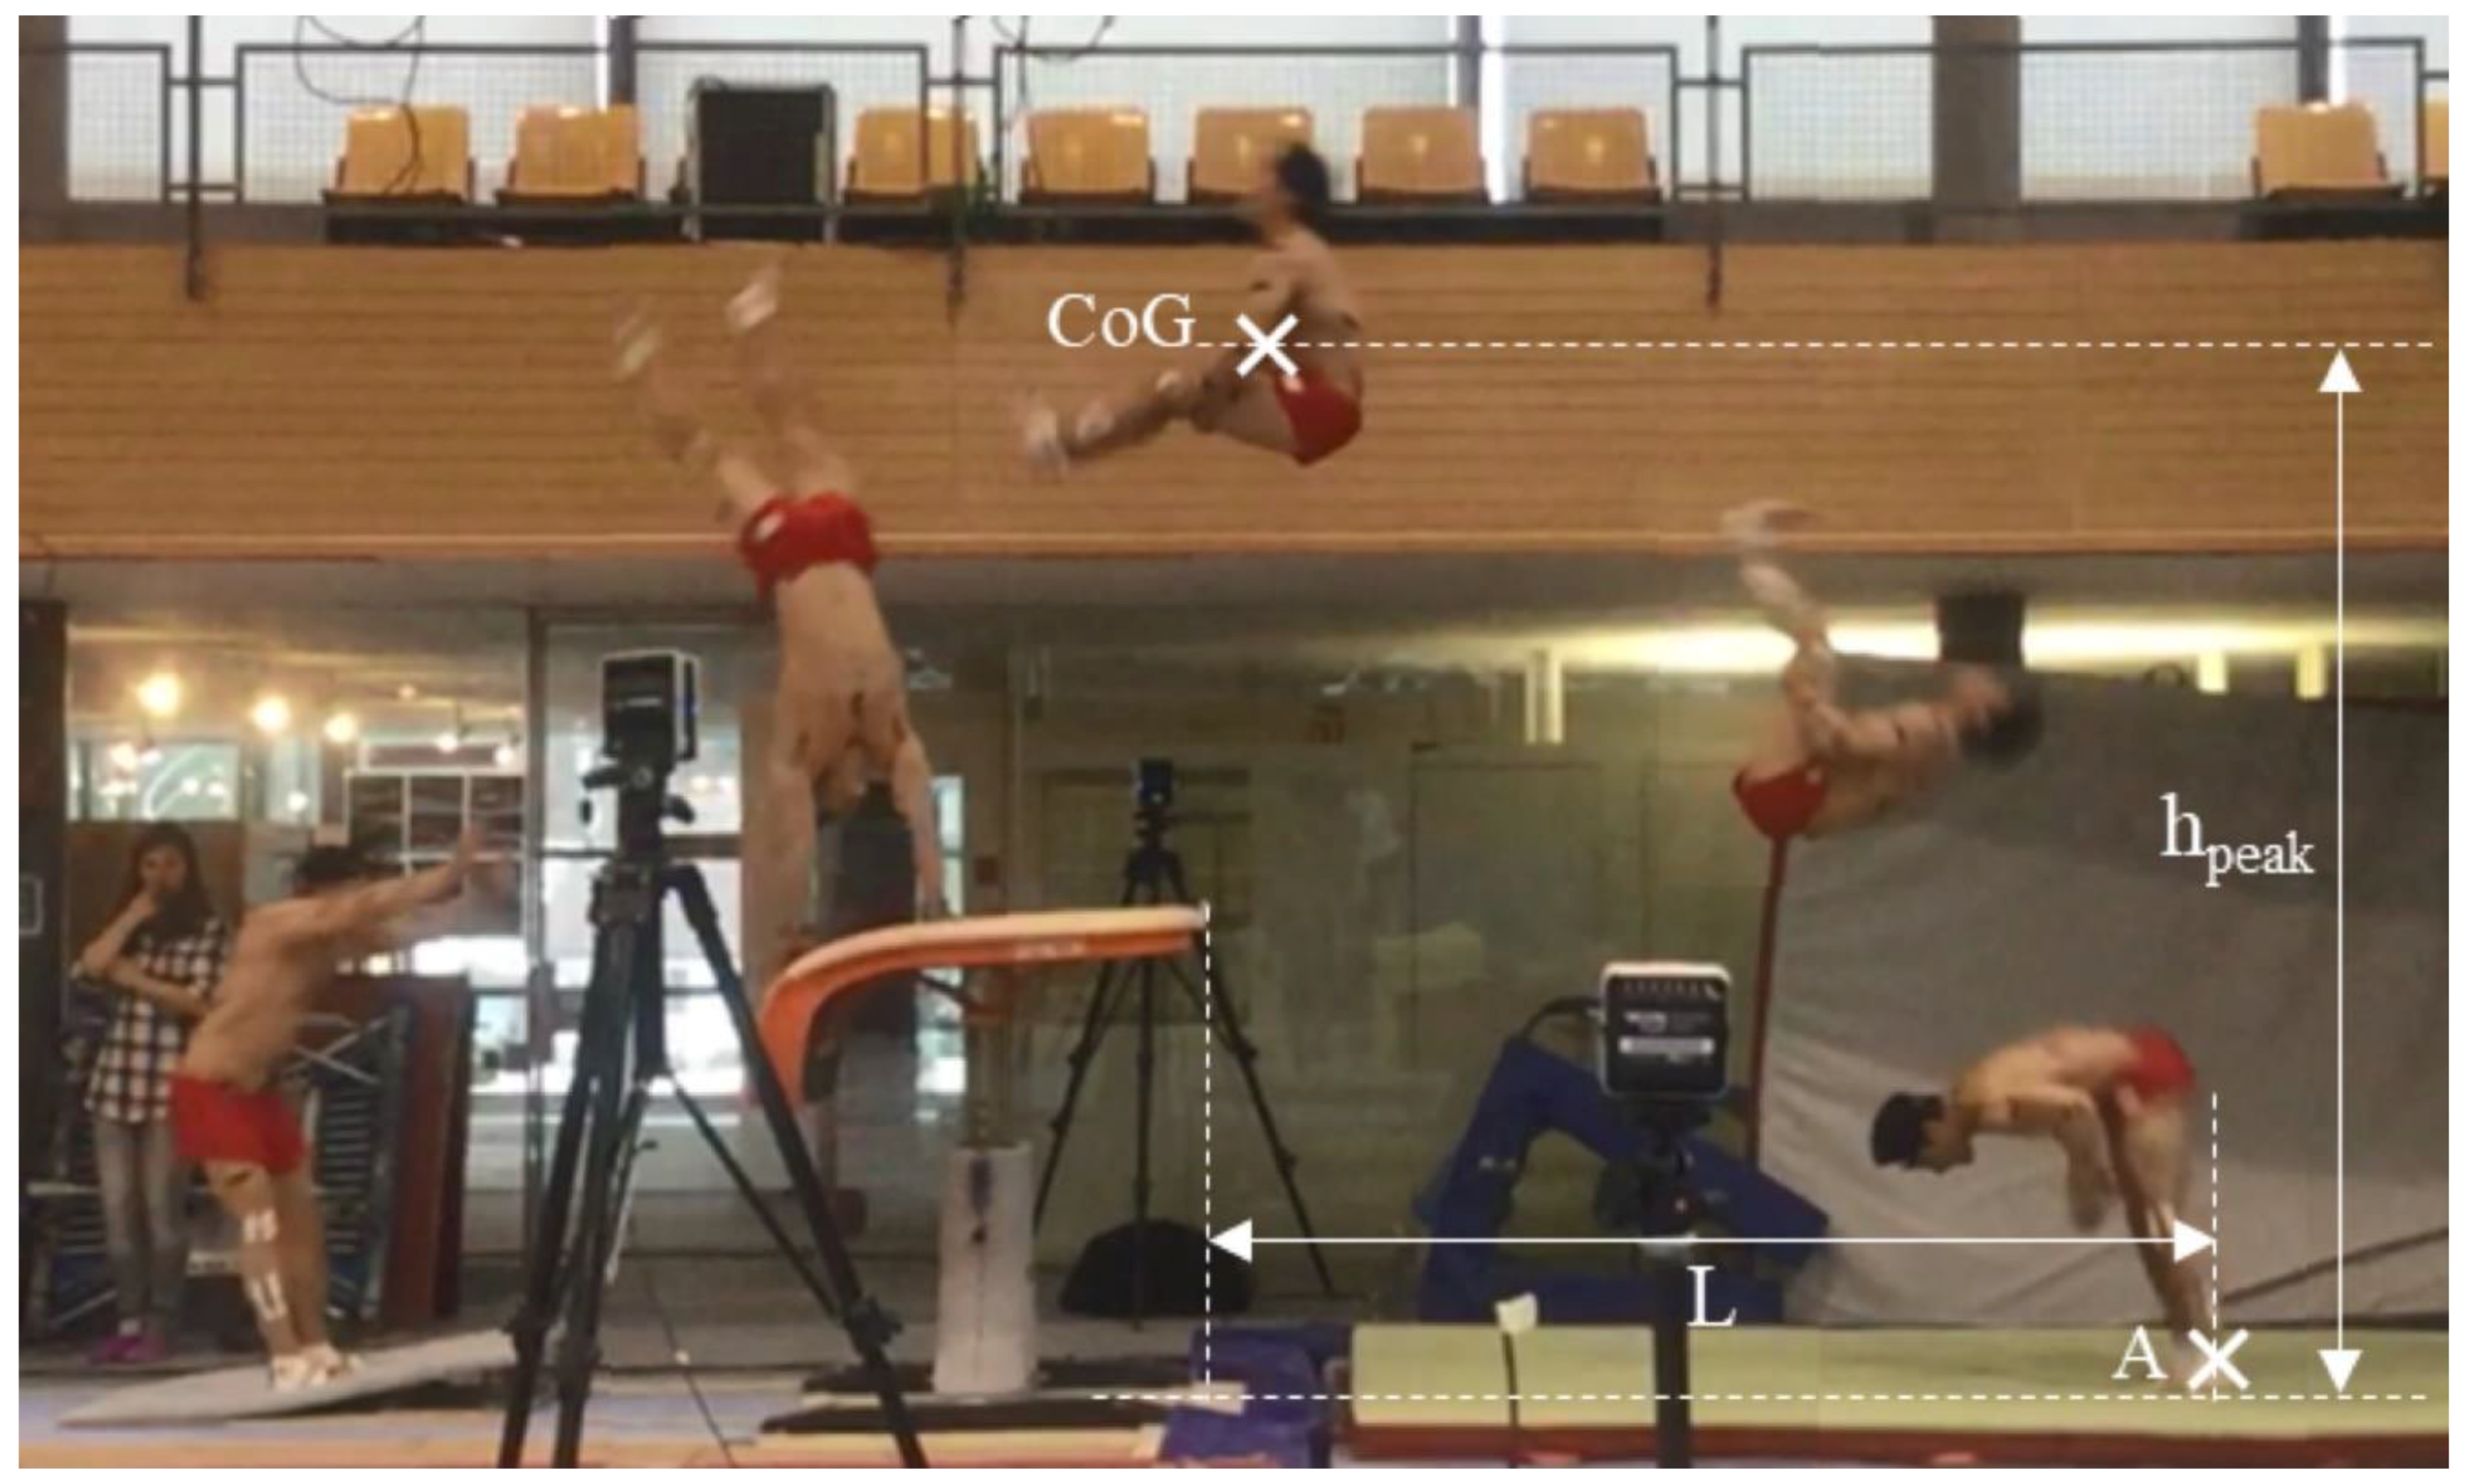
Figure 1). With the Dartfish software, h
peak was measured as the vertical distance between the landing mat and the gymnast’s center of gravity at its highest point during the second flight phase of the vault. For this, the gymnast’s center of gravity was estimated visually in the video frame at which the maximal height was deemed to have occurred. L was determined as the horizontal distance between the ankle at the foot’s first contact with the mat upon landing and the end of the vaulting table (
Figure 2). The software then automatically calculated h
peak and L by using the reference height and length.
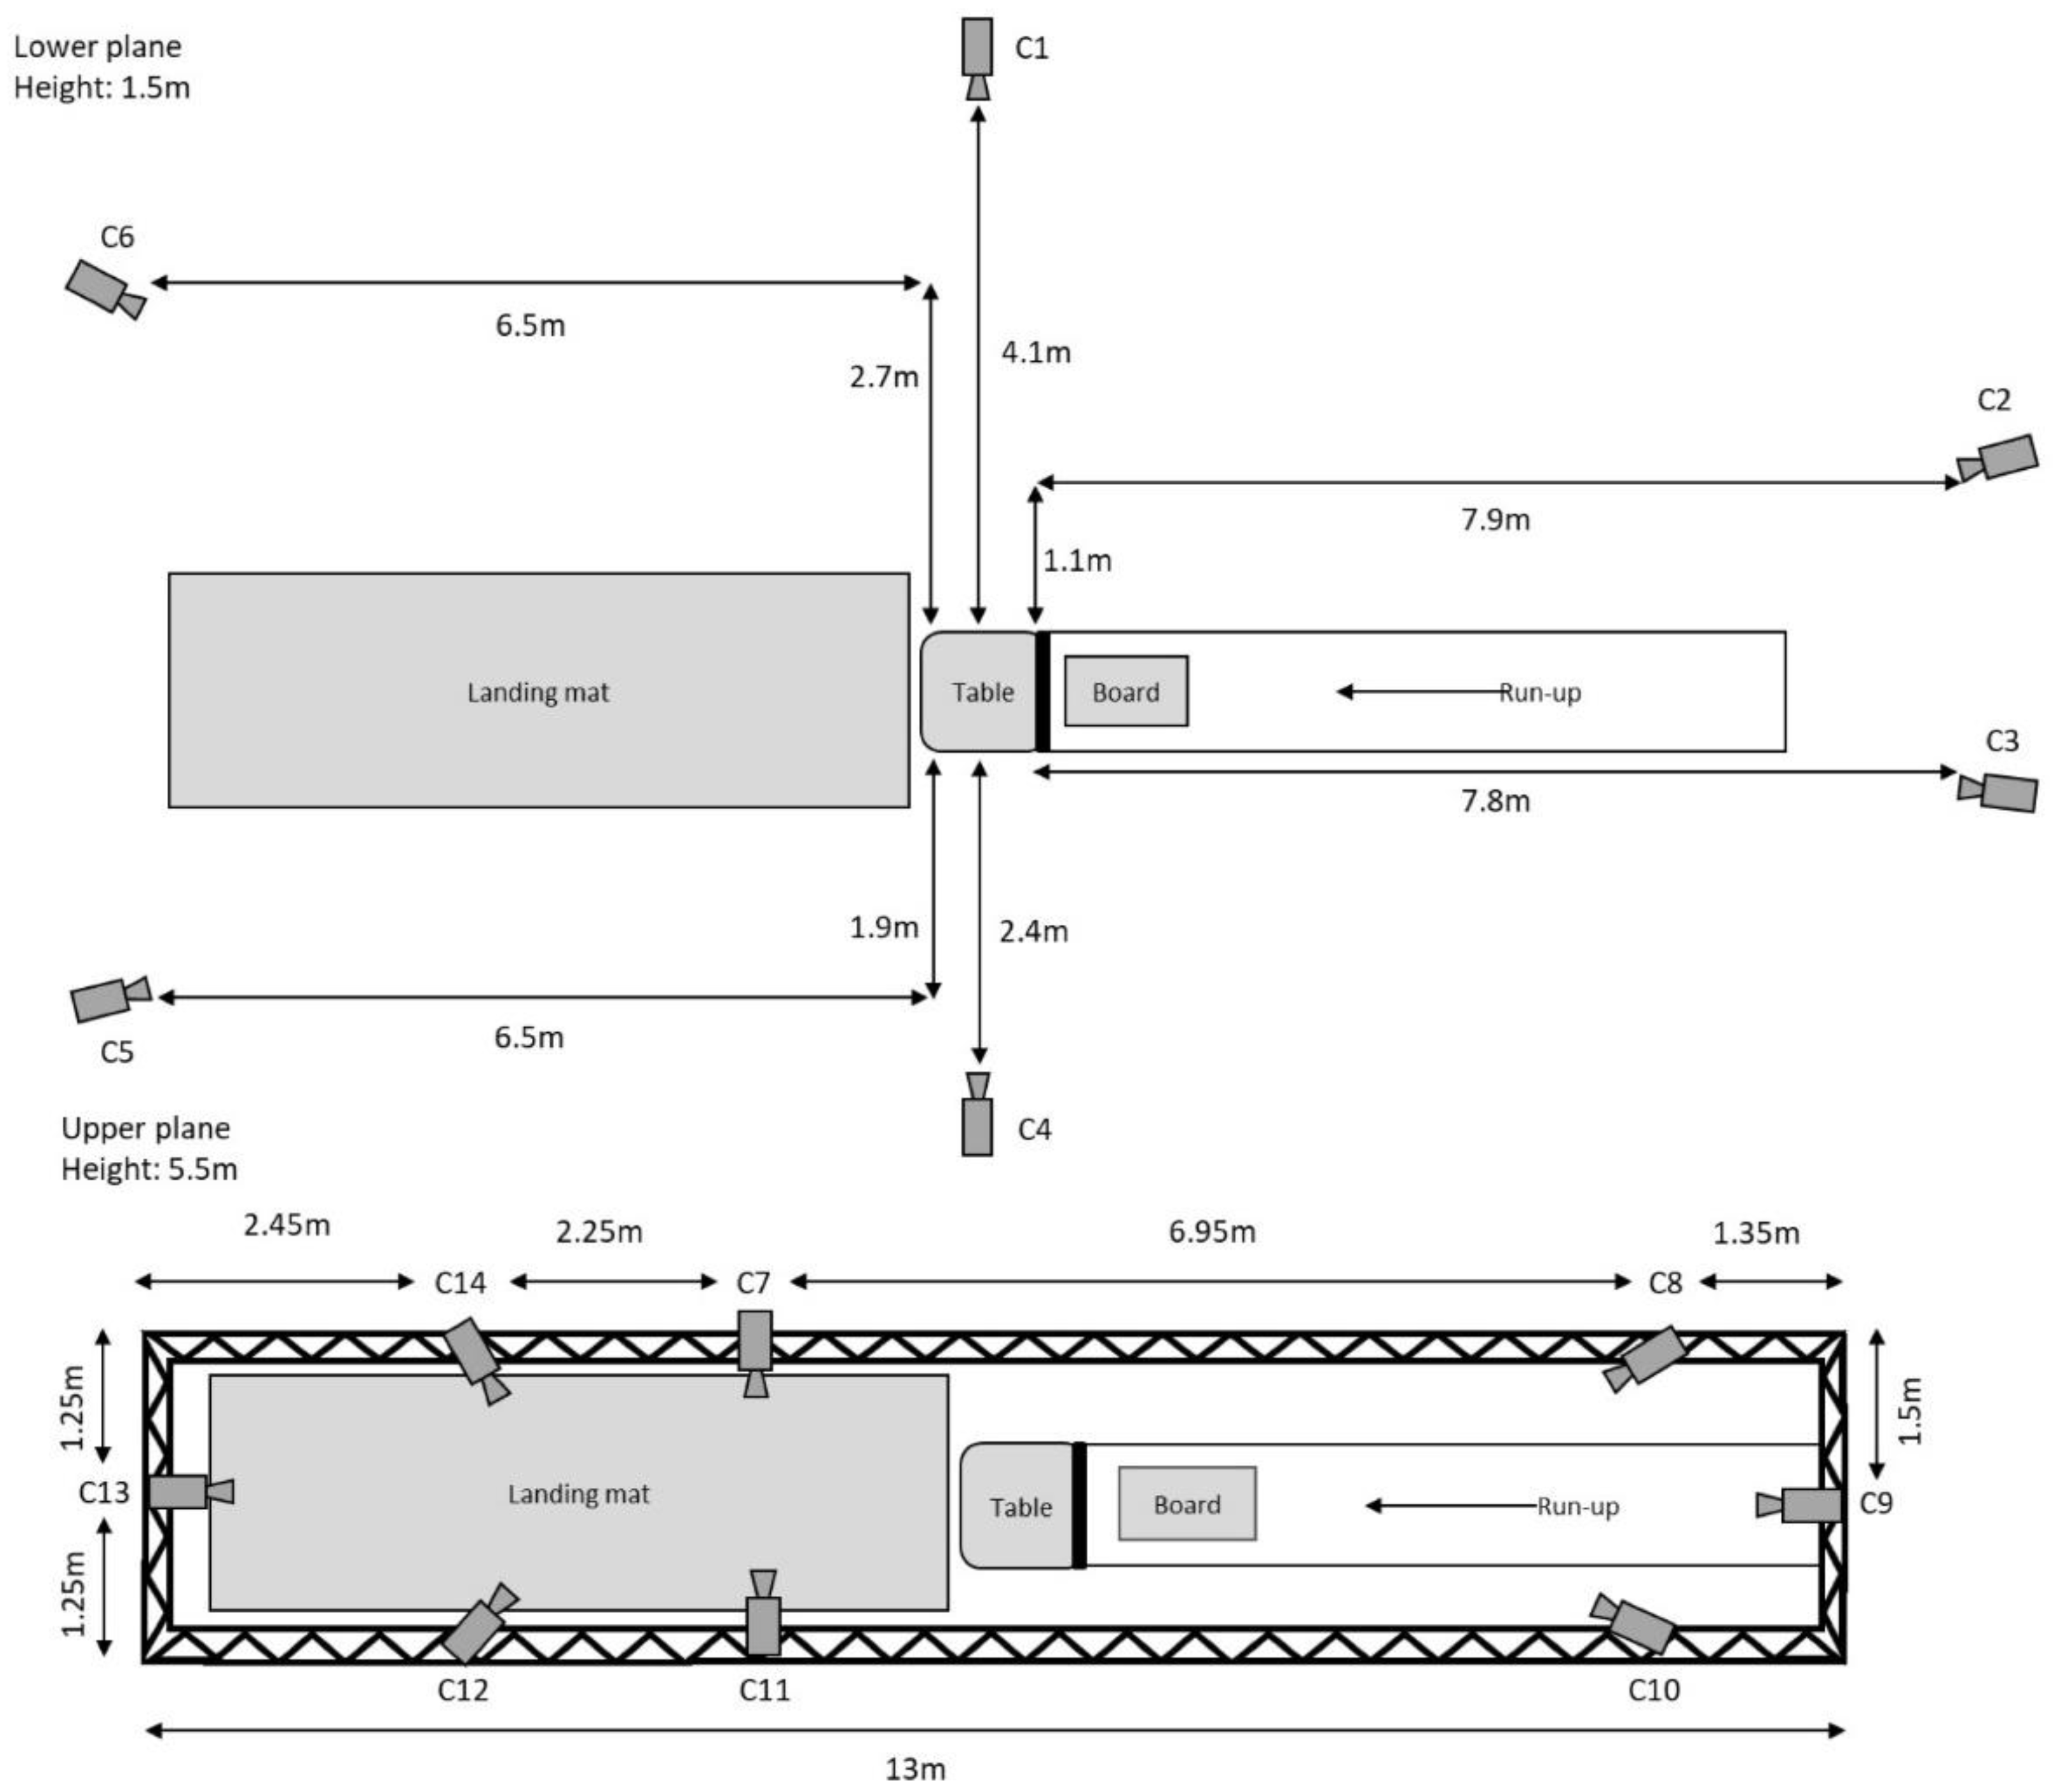
For the 3D analysis, all vaults were captured by 14 Vicon Vantage Cameras (Vicon Motion System, Denver, CO, USA) that were arranged in two planes: eight cameras were placed at a height of 5.50 m and six were placed at a height of 1.70 m (
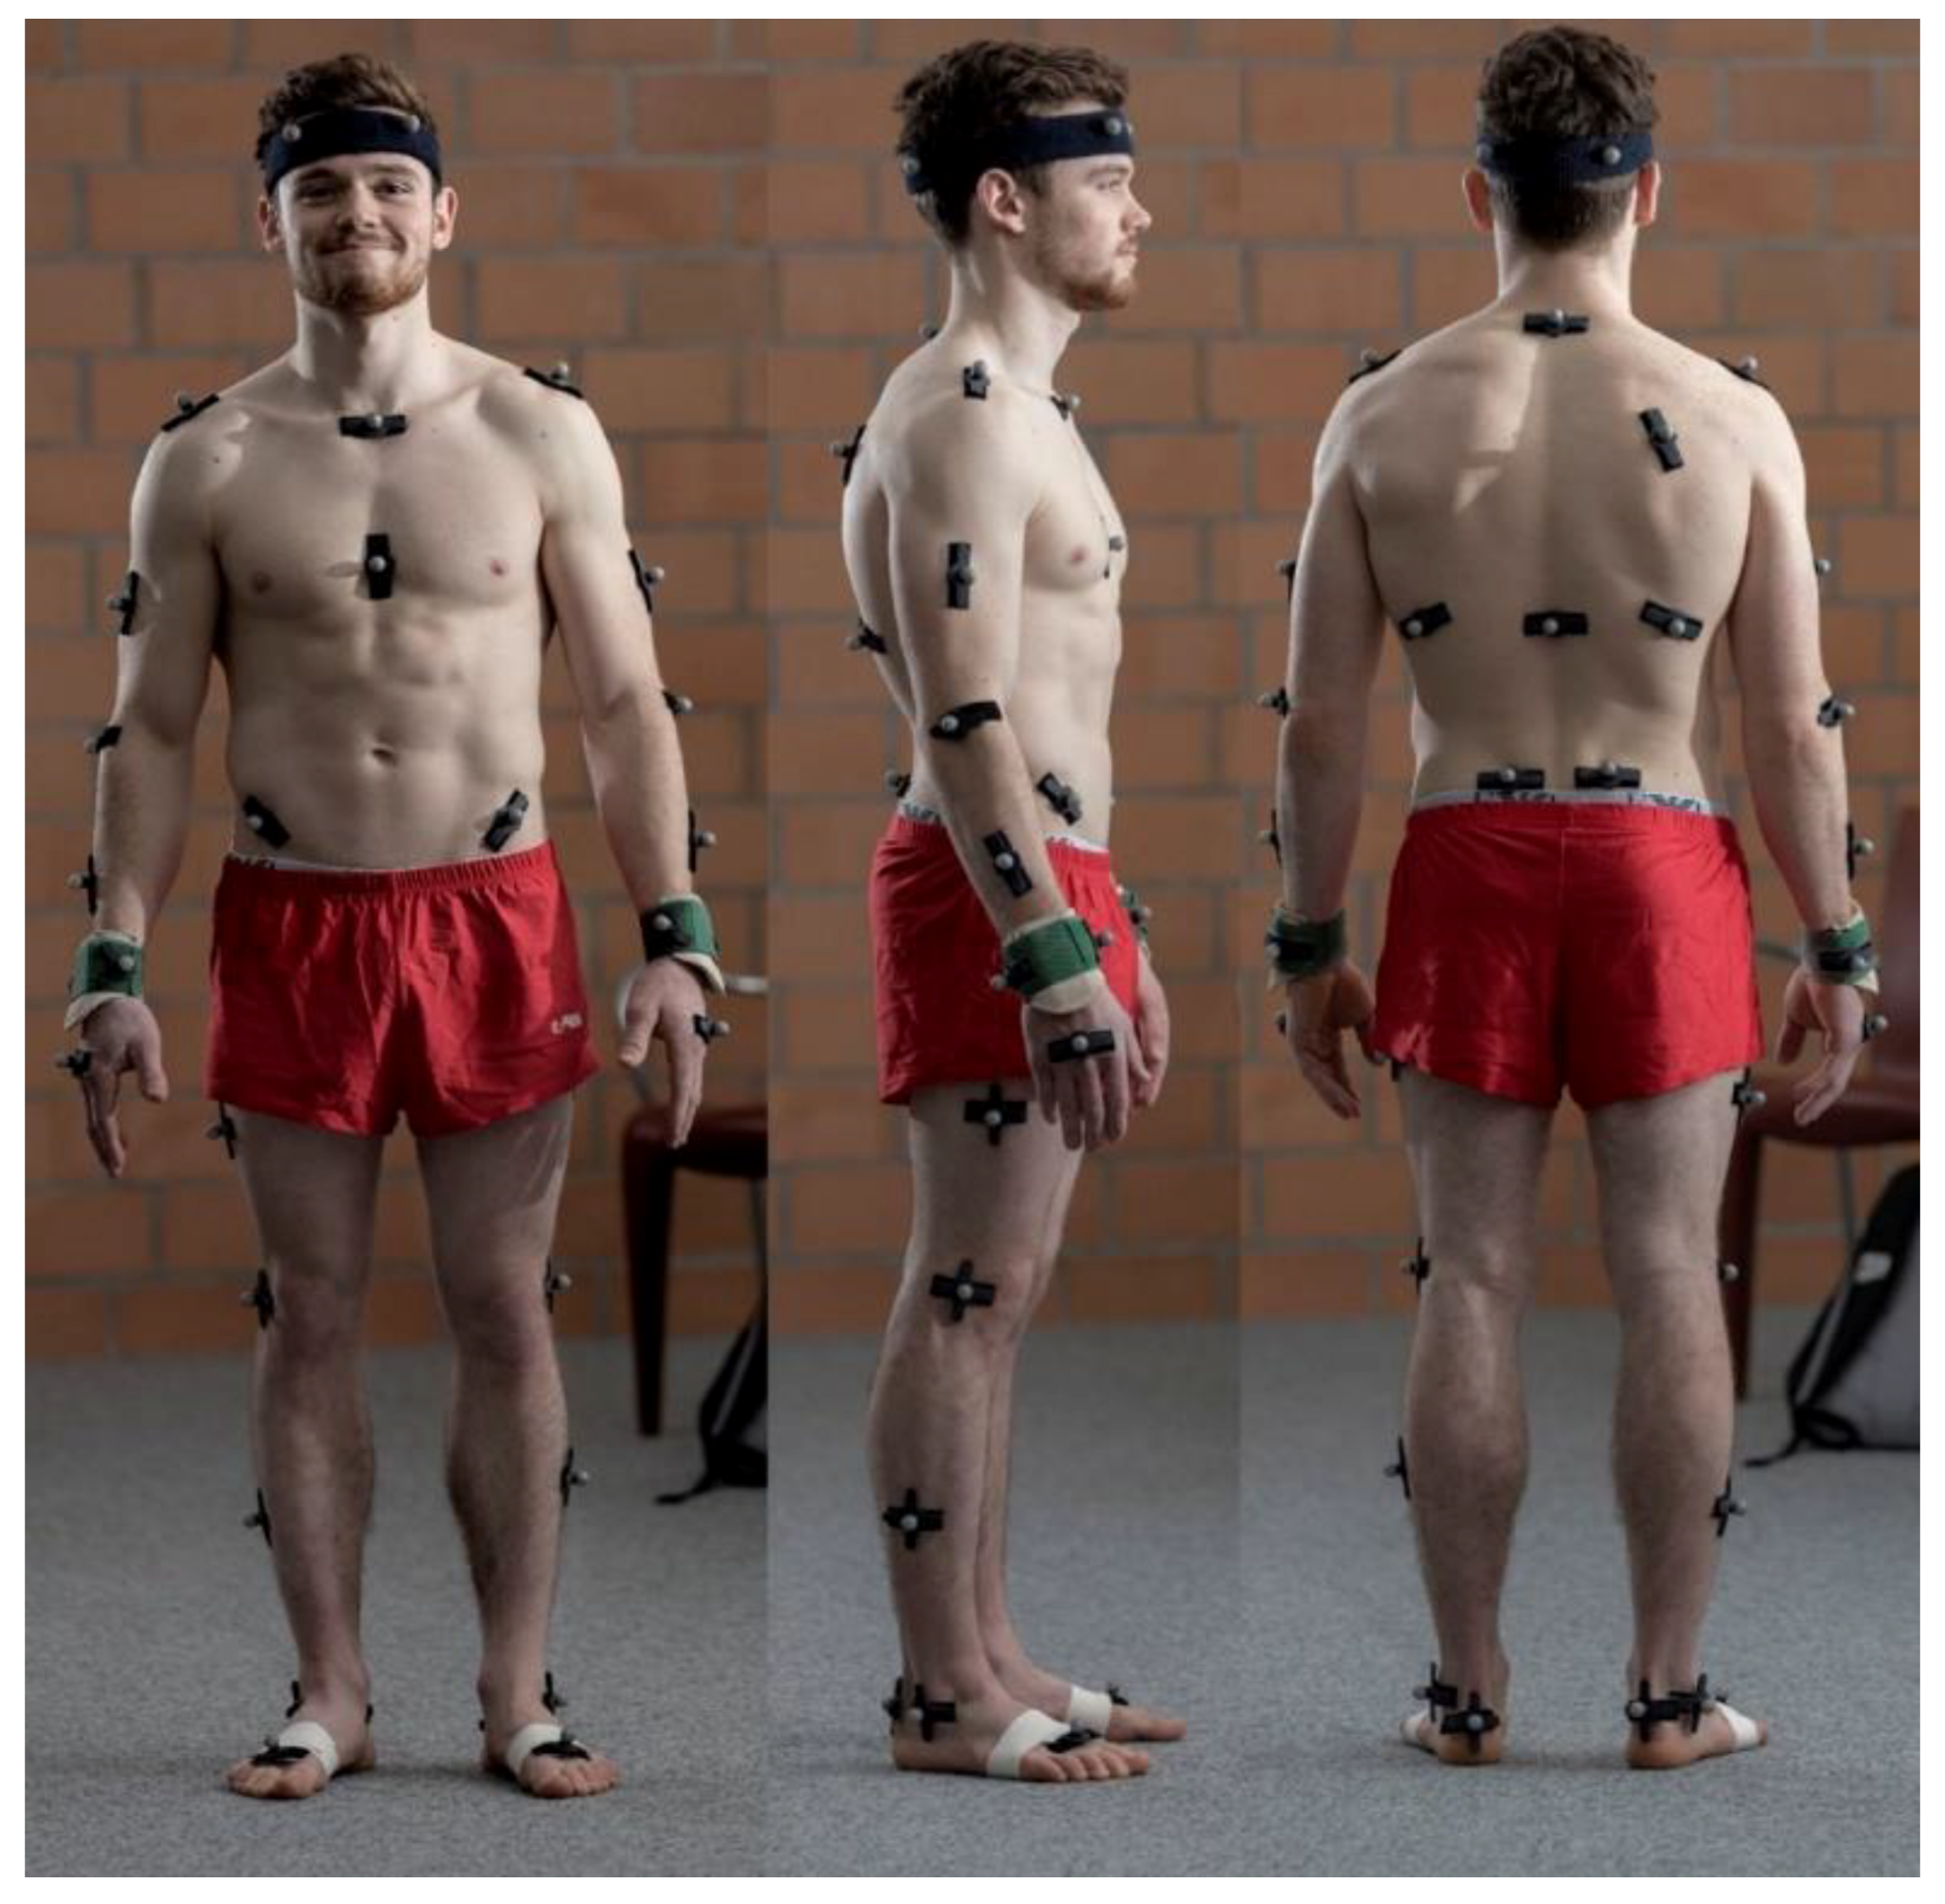
Figure 3) above ground level. Forty-three reflective markers were placed on the gymnasts’ bodies, according to the Vicon Plug-in Gait model [
10] (
Figure 4). For capturing and, afterward, determining h
peak and L, Vicon Nexus, version 2.6, Vicon Motion System, Denver, CO, USA) software was used.
The 2D videos were analyzed by a first-time assessor and an experienced assessor. The first-time assessor was only briefly introduced to the relevant functions of the software (reference measurements) and the important aspects of the measurement of hpeak and L (e.g., determination of the center of gravity at the maximum height of flight) before evaluating the trials.
The parameters determined by the first-time assessor (2D1) were compared to those obtained by 3D analysis to assess criterion validity of 2D analysis (2D1 vs. 3D). Further, the parameters were determined with Dartfish (Dartfish SA, Fribourg, CH) by the same assessor at two different points in time (first measurement: 2D1; second measurement: 2D2) and by an experienced assessor (2De) to verify intrarater (2D1 vs. 2D2) and interrater reliability (2D1 vs. 2De).
Mean, standard deviation, Pearson’s correlation coefficient (r), random error (
CV%), typical error (
TE), and systematic error (t-test: p) of h
peak and L measurements were calculated to determine criterion validity (3D vs. 2D
1) and both intrarater (2D
1 vs. 2D
2) and interrater reliability (2D
1 vs. 2D
e), according to Hopkins et al. [
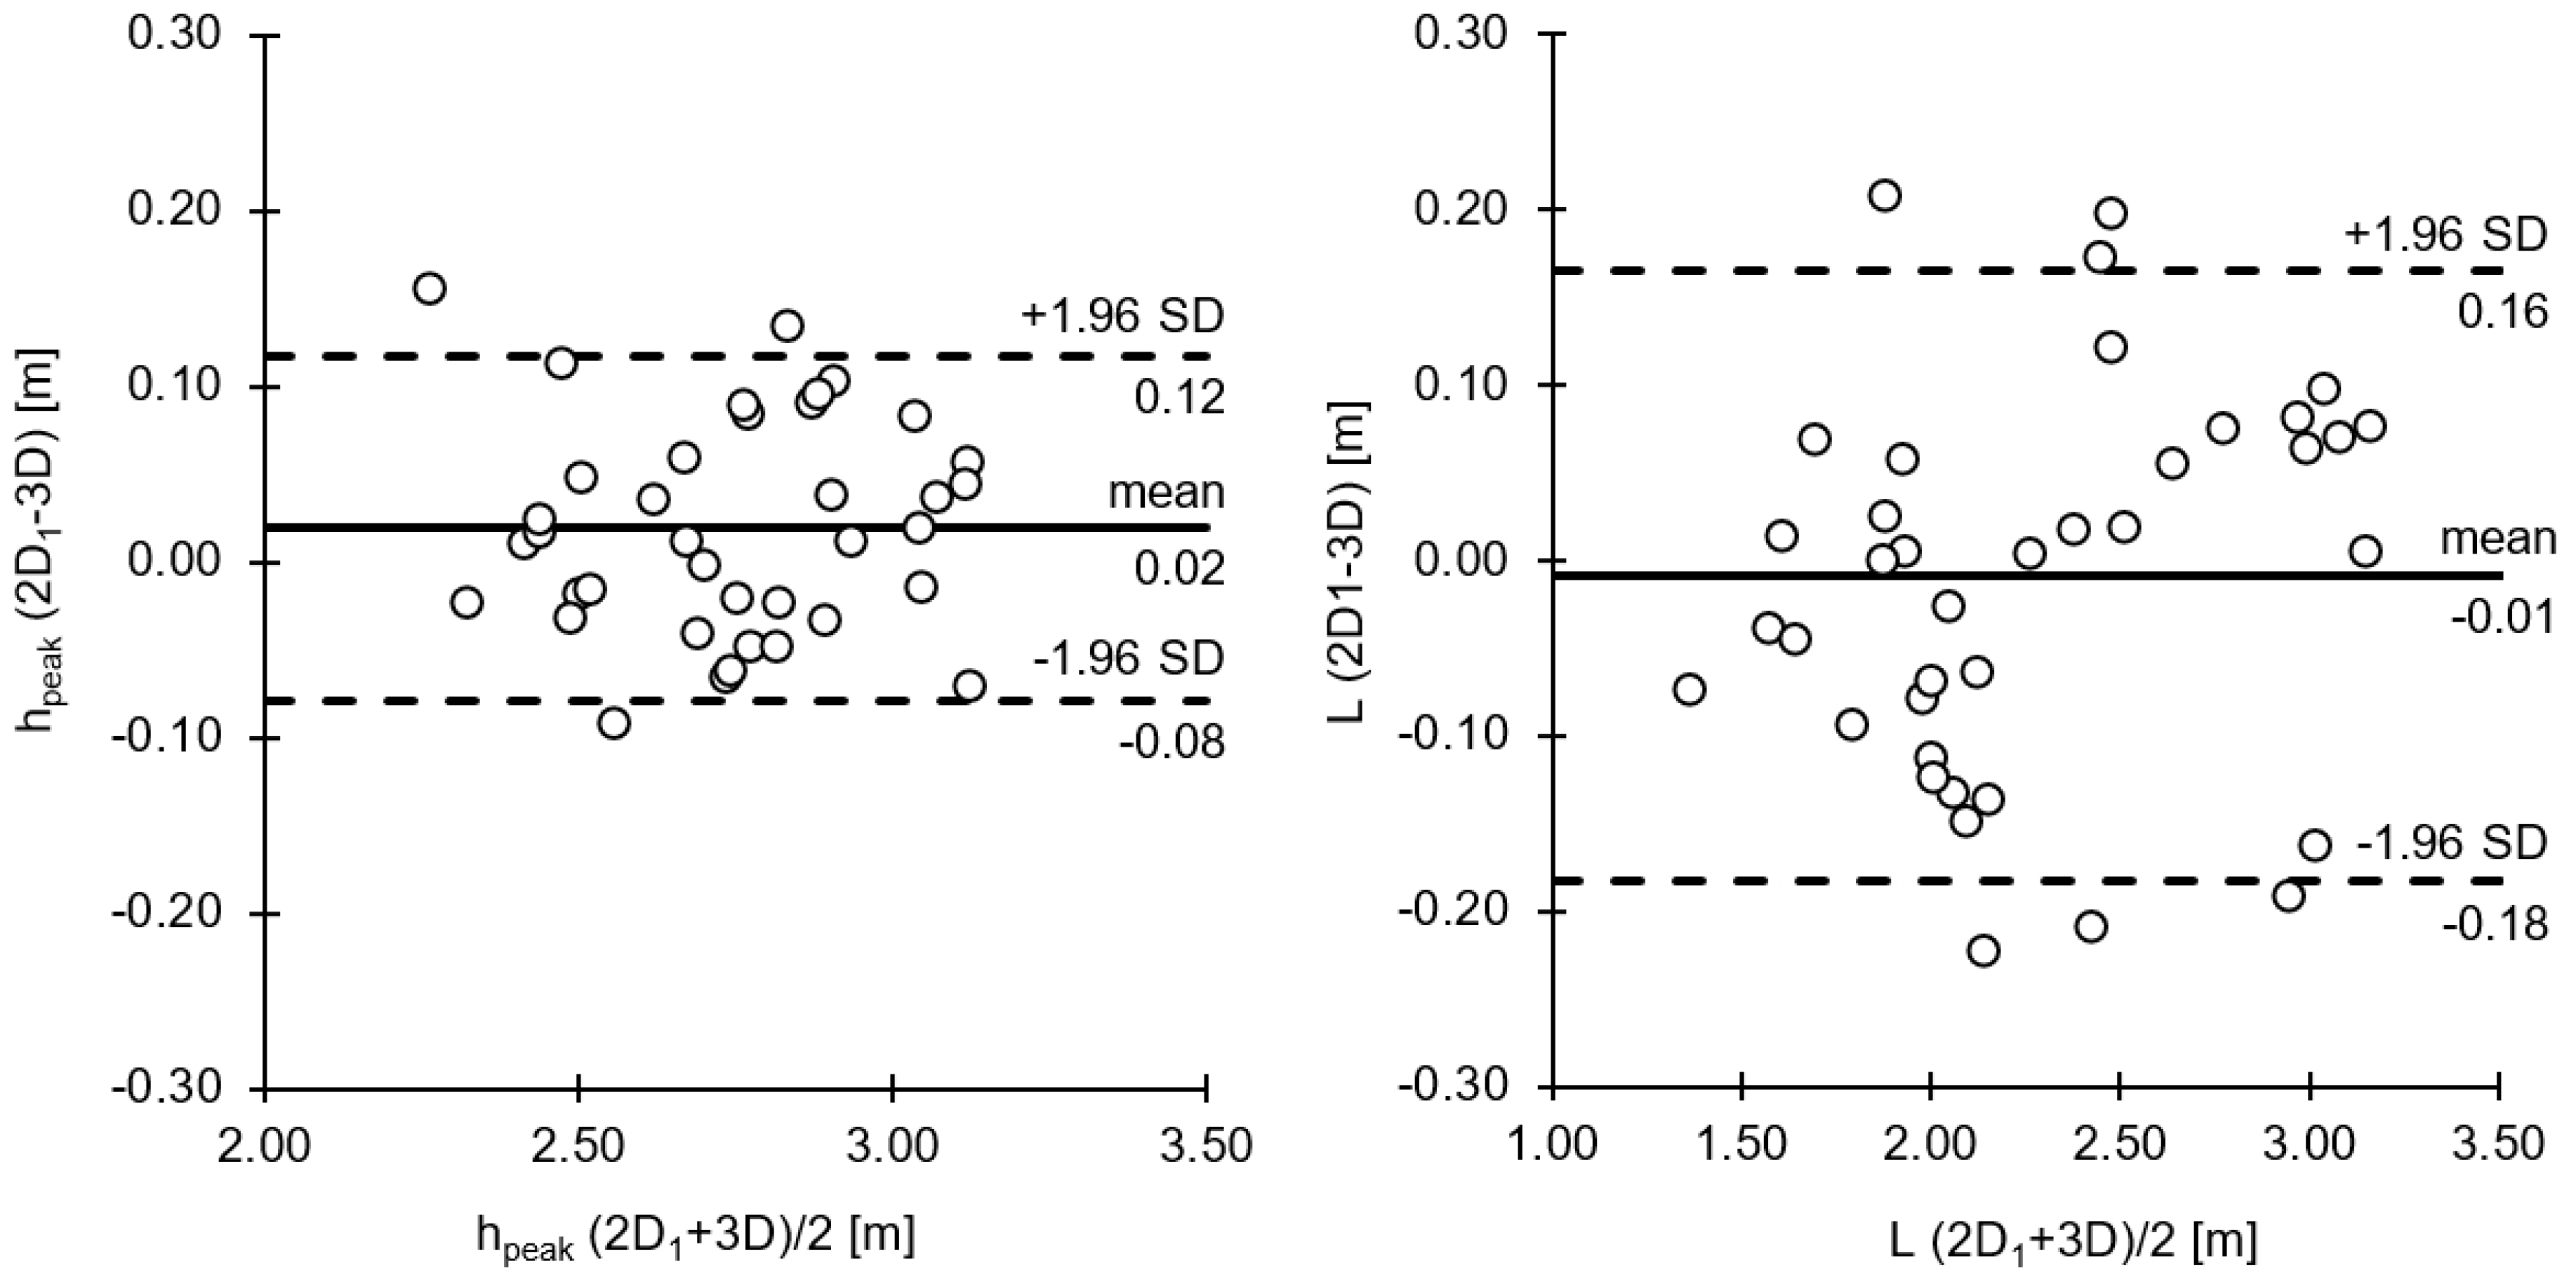
11]. The comparison between the 3D and 2D
1 measurements (criterion validity) is displayed in a Bland–Altman diagram [
12]. In order to determine the influence of lateral displacement at landing on the accuracy of the 2D measurements, the relationship between the difference in L (2D–3D measurement) and displacement along the
x axis (to the left or right) was calculated. The level of statistical significance was set to p < 0.05. Data analysis was conducted using Microsoft Excel spreadsheets (Microsoft Excel 2016, Microsoft Corporation, Redmond, WA, USA).
4. Discussion
This paper is the first to evaluate the validity and reliability of 2D video analysis of the hpeak and L of vaults in artistic gymnastics. Compared to 3D analysis (validity), 2D analysis showed smaller ±95% limits of agreement for hpeak (±3.6%) than for L (±7.6%). Further, we found smaller random errors for hpeak (CV% = 2.24%) than for L (CV% = 4.64%). In contrast, there was a tendency toward a systematic error of hpeak (p = 0.06), but not for L (p = 0.43). Regarding reliability, the hpeak and L of vaults can be repeatedly (intrarater reliability: hpeak: CV% = 0.44%, r = 0.99; L: CV% = 0.87%, r > 0.99) and independently (interrater reliability: hpeak: CV% = 0.51%, r = 0.99; L: CV% = 0.72%, r > 0.99) determined by 2D analysis.
The results support 2D video analysis as a valid measurement tool—particularly for determining the h
peak, but slightly less so for the L, of vaults in gymnastics. Our findings are in line with those of Balsalobre-Fernandez, Tejero-Gonzalez, del Campo-Vecino, and Bavaresco [
9], who have shown that 2D analysis is a valid technique for accurately measuring the flight height of vertical jumps. Thus, under the described measurement conditions, an increase of at least 6.16 cm in h
peak or of at least 10.59 cm in L, measured by 2D video analysis, can be considered a true performance increase.
Differences in the validity between the h
peak and L of vaults, as shown in the Bland–Altman diagram, may have several reasons. The most obvious is that 2D analysis measures the height and length of flight in the sagittal plane only. Accordingly, lateral displacement at the landing cannot be detected by 2D analysis and presents a possible confounding factor. This was shown by the significant relationship between lateral displacement upon landing and the difference between 2D and 3D determinations of L. This result supports research by Oyama, Sosa, Campbell, and Correa [
1], who compared 2D to 3D analysis of joint angles during complex movements. They found that 2D analysis is a valid measure only when cameras are placed perpendicular to the segment of interest. This limitation of 2D analysis was less important for the measurement of h
peak, because the lateral displacement is at its maximum at landing, long after the attainment of h
peak. Further, since L was determined as the distance between the vaulting table and the ankle, even straddled legs at landing may result in a lateral displacement and may lead to a measurement error of 2D analysis. In contrast, h
peak was measured vertically from the landing mat to the center of gravity. Therefore, the determination of h
peak did not depend on the position of one single extremity but on the highest point on the center of gravity’s smooth trajectory.
Another reason for the less accurate measurement of L could be the quality of the 2D videos (resolution and frame rate). The still frame at landing was often slightly blurred due to the velocity of the recorded movement. Therefore, it was difficult in some cases to determine the position of the ankle precisely, and, for this reason, small measurement errors may have occurred. In contrast, the slightly blurred image did not affect the determination of the center of gravity for the measurement of hpeak, since the determination of the center of gravity depends on a global view of the body and not on a small single part of the body.
One more reason for the larger inaccuracy in the determination of L may be the slight bend in the calibration rod when it was held horizontally to scale the image width (
Figure 1). This would have caused the reference length to be slightly too long, although this effect was too small to be apparent in our results (nonsignificant p-value).
In this study, we observed a tendency toward a systematic underestimation of hpeak with 2D analysis. Since the measurements of the experienced assessor were not statistically different from the values of the first-time assessor, it can be assumed that both assessors encountered the same basic problem that may have led to this tendency. In particular, it was difficult to determine the zero-point on the landing mat vertically underneath the highest point of the center of gravity during the second flight phase. We assume that this was the reason for the (almost significant) underestimation of hpeak. Nonetheless, considering the small measurement error when determining hpeak, 2D analysis may be considered a valid method. This knowledge is especially worthwhile since the height of flight dictates the potential to perform somersaults and twists during the second flight phase, and it is therefore an important performance-determining factor for vaults.
When comparing 2D analysis at two consecutive points in time, the variation coefficients of the h
peak and L of vaults were very low. For instance, the differences of 2D analysis were only 1.21 cm (h
peak) and 1.98cm (L), at a mean height of 2.75 m and a mean length of 2.28 m. These minor random errors are likely due to slightly different definitions of the zero-points (on the landing mat or at the end of the vaulting table), or of the gymnast’s center of gravity (h
peak) or ankle (L), rather than a different determination of the frame at which h
peak or L were determined. Therefore, the almost perfect correlation of the first and second 2D analysis and the low variation coefficient values demonstrate a very high intrarater reliability. Thus, 2D analysis using Dartfish (Dartfish SA, Fribourg, CH) is a reliable and reproducible measure for the h
peak and L of vaults. This result is in line with the findings of Maykut, Taylor-Haas, Paterno, DiCesare, and Ford (2015), who, among other things, examined intrarater reliability of 2D analyses of joint angles during running. They measured kinematic variables during running on a treadmill with the same video analytical software we used (Dartfish SA, Fribourg, CH), and they reported excellent intrarater reliability [
7]. Other studies have also shown 2D analyses to be reliable for measuring joint angles [
6] and flight height [
9].
Lastly, we compared the values of hpeak and L evaluated by an experienced assessor with those evaluated by a first-time assessor. Our results show that the hpeak and L of vaults are similar, as the coefficients of variance are low and the correlations are high. In this context, it should be mentioned that a brief introduction to the measurement software and determination of center of gravity is sufficient but indispensable. Therefore, 2D analysis is a straightforward measurement tool, where values of an inexperienced assessor, for example, those evaluated by a coach, are comparable to those of an expert. Therefore, our results show good interrater reliability with 2D analysis.
When evaluating data-collection procedures, it is important to evaluate practicality and not only validity and reliability. As there are few studies regarding the validity and reliability of 2D analysis, comparisons are difficult. Nevertheless, our results are similar to the results reached by Brehmer and Naundorf [
4], as well as Schurr, Marshall, Resch, and Saliba [
5], in regard to validity. As such, 2D analysis seems to be a reasonable, inexpensive, and portable alternative to 3D motion capture analysis. Furthermore, 2D analysis is time efficient, as video analysis of the h
peak and L of complex skills only takes about one minute for practiced evaluators. Additionally, the equipment needed for 2D analysis (video camera, tripod, analytical software, and calibration rod) is normally readily available in an artistic-gymnastics facility, making the described method an easy and cost-effective analytical tool. Lastly, even first-time assessors can precisely determine the important parameters of complex skills if they are briefly introduced to the measurement method. Thus, 2D analysis is a useful analytical tool for practical use in training and for scientific research, as the financial, spatial, and temporal costs are minimal.


