Featured Application
The initiation criterion for the liquid hydrazine tank and numerical simulation developed in this paper can be used to determine whether the satellite tank explodes under the debris hypervelocity impact, which is of great significance for the damage consequence analysis and risk assessment of the satellite.
Abstract
For the risk assessment of a satellite to determine whether the satellite tank explodes under the hypervelocity impact, the Walker–Wasley criterion is selected to predict the shock initiation of the satellite tank. Then, the minimum power density of liquid hydrazine is determined based on the tests, the expressions of shock wave pressure and pressure duration are constructed based on the one-dimensional wave theory, and the initiation criterion for the liquid hydrazine tank is established. Finally, numerical simulation and the initiation criterion are adopted to calculate the power density in the satellite tank under the debris impact at the velocity of 10 km/s. The calculated power density agrees well with the simulated power density, they are both larger than the minimum power density, demonstrating that the shock wave generated by the hypervelocity impact is sufficient to trigger an explosion in the satellite tank.
1. Introduction
Collisions between space debris and satellite are likely to occur given the rapid increase in space debris. The average collision velocity can reach 10 km/s, which is classified as hypervelocity (velocity above 3 km/s) [1]. Liquid hydrazine is the commonly used propellant for satellites. The satellite tank filled with liquid hydrazine, which accounts for a large part of the total mass, is one of the most vulnerable components to debris impact.
Tests and numerical simulations on the projectiles impacting liquid-filled tanks at hypervelocity have been carried out. There are mainly two kinds of failure mechanisms. One is that no chemical reaction occurs in the liquid, the tank suffers structural damage caused by the hydrodynamic ram. The other is that decomposition reaction occurs in reactive liquid, the generated heat leads to fire, explosion, and complete disintegration.
Hydrodynamic ram caused by the hypervelocity impact has been the subject of many investigations. Borg et al. (2001) performed a series of tests where an aluminum projectile with the diameter of 23.8 mm was shot into a steel shell filled with tributyl phosphate at velocities between 2 and 6 km/s [2]. He developed a non-dimensional model to predict shell growth and a fragmentation model to estimate shell breakup. In the same year, Borg et al. conducted tests in which a projectile weighting 19.8 g was launched at velocities from 2.3 km/s to 4.1 km/s against a vessel filled with water [3]. According to the test conditions, a numerical simulation was conducted using an Eulerian shock physics hydrodynamic code, CTH, to predict the vessel damage. Both the test and simulation results indicated that as the impact velocity increased, the shock wave loading enhanced, and the overall damage become more serious. Townsend et al. (2003) carried out tests in which projectiles weighting 3.5 g and 7 g were accelerated to velocities between 1 and 3 km/s to impact tanks filled with water [4]. The movement of the projectiles, the growth of the cavity and the plastic deformation of the tank walls were recorded by a high-speed camera.
The explosion of the reactive liquid in tanks under hypervelocity impact has also become the focus of many studies. In 1964, NASA Lewis Research Center conducted 40 hypervelocity impact tests [5]. In test 23, a 0.0625-inch-diameter steel projectile was shot into a titanium tank filled with liquid oxygen at the velocity of 5200 feet per second. A violent reaction continued until liquid oxygen was consumed. In test 38, the tank containing liquid hydrazine was penetrated by a 7/32-inch steel projectile at the velocity of 5800 feet per second. There were no details indicating that a chemical interaction had taken place. In 1991, White Sands Test Facility (WSTF) participated in a joint test program with NASA Hypervelocity Impact Research Laboratory (HIRL) to evaluate the initiation of nitromethane and liquid hydrazine [6]. In test HYP-10, they used an aluminum projectile with the diameter of 0.318 cm moving at the velocity of 6 km/s to impact a nitromethane-filled vessel. In test HYP-2, they used the same projectile moving at the velocity of 6.1 km/s to impact a vessel filled with liquid hydrazine. As a result, nitromethane and hydrazine did not detonate, a circular entry hole, bulge, and split were found on the vessels. In 1991, Science Applications International Corporation (SAIC) also performed a test in which a cylindrical projectile weighting 100 g was launched at the velocity of 5.0 km/s against a 100-mm-diameter spherical vessel full of liquid hydrazine [7]. Results indicated that some reaction occurred, but not enough evidence was gathered to confirm a detonation. Garcia and Chavez (1994) formulated the TITANK test to replicate the actual conditions on board Space Station [8]. The TITANK test in which the titanium tank filled with liquid hydrazine was impacted by a cylinder projectile at the velocity of 7.5 km/s was designed based on the simulation of SIN, TDL, and Zeus hydrocodes. Results showed that the generated shock wave in the TITANK test was sufficient to achieve hydrazine explosion. However, many kinetic parameters in SIN, TDL, and ZEUS codes are still unknown, a database containing kinetic parameters for various propellants needs to be established.
In the present work, the critical initiation criteria of explosives are elaborated and Walker–Wasley criterion is selected to predict the shock initiation of the satellite tank. Then, the minimum power density of liquid hydrazine is determined based on the WSTF#HYP-2 test, SAIC test and the designed TITANK test, the expressions of shock wave pressure and pressure duration are constructed based on the one-dimensional wave theory, and the initiation criterion for the liquid hydrazine tank are established. Finally, numerical simulation and the initiation criterion are used to calculate the power density in the satellite tank under the debris impact at the velocity of 10 km/s. Numerical simulation of the debris hypervelocity impact on satellite tank pays attention to the contact definition of debris/tank and debris/hydrazine, to the mesh size of liquid hydrazine and to the constraints of satellite tank [9]. Moreover, numerical modelling of the satellite tank under hypervelocity impact can offer a robust support for the structural design. In the future, tests of debris hypervelocity impact on a satellite tank will be carried out and the simulation results can provide an expected reference.
2. Shock Initiation Criterion
The shock initiation of explosives is closely related to their safety and power. Scholars have carried out a lot of research on shock initiation of explosives and established critical initiation criteria. In 1961, Seay and Seely proposed the initiation criterion based on critical pressure [10]:
where, Pi and Pc represent the input shock wave pressure and the critical initiation pressure, respectively. If Pi ≥ Pc is reached, the detonation will be triggered.
In 1969, Walker and Wasley conducted a series of experiments on shock initiation of LX-10, PBX-9404 and nitromethane [11]. Results show that shock initiation of the explosives depends not only on shock wave pressure P, but also on pressure duration t. They proposed the famous Walker–Wasley criterion based on critical energy Ec, which is applicable to both solid and liquid explosives:
The typical initiation criteria based on critical velocity are Jacobs–Roslund empirical criterion and Held criterion. Jacobs–Roslund empirical criterion is as follows [12]:
where, v is the impact velocity of projectile; d is the projectile diameter; K is the pointed coefficient; T is the shell thickness; θ is the impact angle; a and b are the parameters fitted according to the test results.
When T = 0, Equation (3) can be simplified as Held criterion [13]:
where, Ce is the initiation threshold determined by experiment. According to Equation (4), if the projectile diameter is large enough, the initiation threshold can be reached at a small impact velocity, which is inconsistent with the actual situation. Therefore, the applicability of the Held criterion is limited.
A satellite tank filled with liquid hydrazine can be regarded as a covered liquid explosive. Since Walker–Wasley criterion is applicable to liquid explosives, it is used to predict the shock initiation of the satellite tank under hypervelocity impact.
3. Initiation Criterion for the Liquid Hydrazine Tank
According to Walker–Wasley criterion, whether the debris hypervelocity impact can detonate liquid hydrazine depends on the impact shock wave pressure P, pressure duration t, and critical initiation energy Ec which is determined experimentally.
3.1. Minimum Power Density
Garcia and Chavez studied the detonability of liquid hydrazine based on Walker–Wasley criterion [8], and defined the critical initiation energy Ec as minimum power density Pdmin. If the shock wave pressure P produced by hypervelocity impact is equal to or greater than the C-J pressure PCJ of liquid hydrazine, and the power density Pd exceeds minimum power density Pdmin, a disastrous explosion will occur in the satellite tank. Otherwise, the satellite tank suffers structural damage under the effect of hydrodynamic ram, which is illustrated in Figure 1.
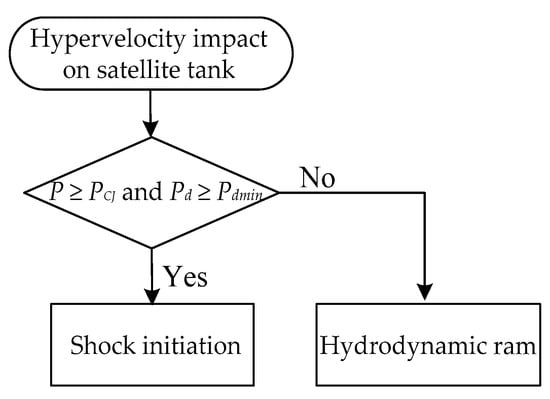
Figure 1.
Flow chart for judging the damage consequences of a satellite tank under debris hypervelocity impact.
For WSTF#HYP-2 test [6], SAIC test [7] and the designed TITANK test [8], calculations were carried out to determine the power density Pd in liquid hydrazine. Test conditions and results are summarized in Table 1. No explosion was observed in WSTF#HYP-2 test. Only some decomposition reactions were found in SAIC test. The simulation results of the designed TITANK test demonstrated that the shock wave in liquid hydrazine was sufficient to achieve an explosion. Moreover, the designed TITANK test replicates the actual tank existing on board Space Station, which is similar to the condition of satellite tank, so we are taking Pdmin = 3.98 × 10⁵ kbar2 μs as the minimum power density of liquid hydrazine. It means the explosion will be triggered when the power density in liquid hydrazine exceeds 3.98 × 10⁵ kbar2 μs.

Table 1.
Conditions and results of hypervelocity impact test on liquid hydrazine [8].
3.2. Shock Wave Pressure
When the spherical debris impacts the satellite tank vertically at the velocity up0, two shock waves will be formed. They propagate toward the debris and the tank wall, respectively. Based on the shock wave theory, the impact of debris on the satellite tank is simplified as one-dimensional impact. As shown in Figure 2a, when the debris impacts the outside of tank wall, the shock wave pressure, shock wave velocity and particle velocity in debris are P1, D1, and u1. The shock wave pressure, shock wave velocity and particle velocity in tank wall are P2, D2, and u2.
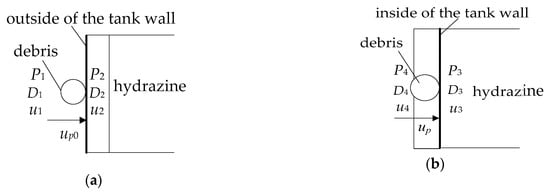
Figure 2.
(a) One-dimensional model of the spherical debris impacting the outside of tank wall; (b) One-dimensional model of the spherical debris impacting the inside of tank wall.
According to the conservation of mass and momentum, the expressions of shock wave pressure in the debris and tank wall can be obtained [14]:
where, ρp is the density of debris and ρt is the density of tank wall.
The relationships between the shock wave velocity and particle velocity are proposed based on the linear Hugoniot relation:
where, ap and bp are the Hugoniot coefficients of debris and at and bt are the Hugoniot coefficients of tank wall.
The following expressions can be obtained by substituting Equations (7) and (8) into Equations (5) and (6):
Based on the continuous boundary conditions, the following can be derived:
Shock wave attenuates in the tank wall. The pressure decreases to P3 when the shock wave propagates to the inside of the tank wall [15]:
where, α denotes the attenuation coefficient of the wall; δ denotes the thickness of the wall.
Given the shock wave pressure P3, the particle velocity u3 on the inside of tank wall can be calculated:
When the debris reaches the inside of tank wall, as shown in Figure 2b, its velocity decreases to up. The shock wave pressure, shock wave velocity and particle velocity in debris are P4, D4, and u4.
The debris velocity up can be solved by continuous boundary conditions:
When the debris moves in the liquid, it is only subjected to drag force and its velocity decreases gradually. The following can be deduced from Newton’s second law [16]:
where, Vp is the debris volume, Ap is the cross-section area of debris, CD is the drag coefficient.
The drag coefficient CD is a dimensionless number, which depends not only on the debris shape, but also on the Reynolds number of the liquid [17]. The debris moves at high speed in the liquid, part of its kinetic energy is transferred to the liquid. The liquid begins to flow, turbulence is generated around the debris and the Reynolds number Re > 103. Within this range, the drag coefficient basically remains unchanged. For spherical projectile CD = 0.4.
For spherical projectile, Vp = 4/3πrp3, Ap = πrp2, rp is the radius of projectile. The moment when the debris enters the liquid hydrazine is t = 0, and the initial condition is up(t = 0) = up. By substituting them into Equation (18), the projectile velocity up(t) can be solved [16]:
Townsend et al. performed tests in which steel projectiles were launched to impact water-filled tanks and proposed the relationship between the shock wave velocity us and particle velocity ul in liquid [4]:
where, al and bl denote the Hugoniot coefficients of the liquid.
Chou and Chen studied the hypervelocity impact on bumper-protected fuel tanks and considered that the particle velocity of the liquid is equal to the projectile velocity [18]:
By substituting Equation (21) into Equation (20), the relationship between shock wave velocity us(t) and the projectile velocity up(t) is:
Then, the shock wave pressure P in the liquid can be expressed as [3]:
By substituting Equation (19) into Equation (23), the formula of shock wave pressure decaying with time can be obtained (the pressure unit is Pa):
3.3. Pressure Duration
The shock wave pressure must be equal to or greater than the C-J pressure of liquid hydrazine in order to trigger an explosion. Otherwise, if the pressure is lower than the C-J pressure, the shock wave will not play a role in the explosion. The period from the moment when the shock wave is generated in liquid hydrazine to the moment when the shock wave pressure decays to the C-J pressure is the pressure duration. The C-J pressure of liquid hydrazine is PCJ = 1.39 × 10¹⁰ Pa [18], the pressure duration t in liquid hydrazine can be calculated as follows:
The power density Pd is expressed in the integral form:
Equations (5)–(26) constitute the initiation criterion for the liquid hydrazine tank under hypervelocity impact.
3.4. Verification of the Initiation Criterion
WSTF (1991) performed the HYP-2 test where an aluminum projectile with the diameter of 0.318 cm was shot into a steel vessel filled with liquid hydrazine at the velocity of 6100 m/s [6]. The vessel is a cylinder with 7.6 cm in diameter, 8.9 cm in height and 0.89 mm in wall thickness. The initiation criterion for the liquid hydrazine tank is used to calculate the power density and to judge whether an explosion occurs in the HYP-2 test. A flow chart of how the calculation process proceeds is shown in Figure 3.
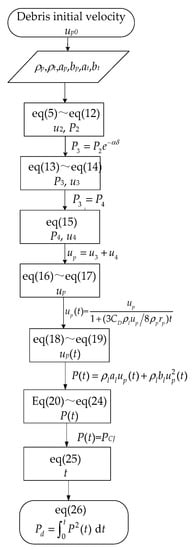
Figure 3.
Flow chart of the calculation process of initiation criterion for liquid hydrazine tank.
The material parameters of the projectile, vessel and liquid hydrazine used in the calculations are shown in Table 2 [19,20]. The power density calculated by the initiation criterion for the liquid hydrazine tank is Pd = 2658 kbar2 μs. This value was obtained using the process in Figure 4 as follows:

Table 2.
Parameters of the projectile, vessel and liquid hydrazine used in calculation.
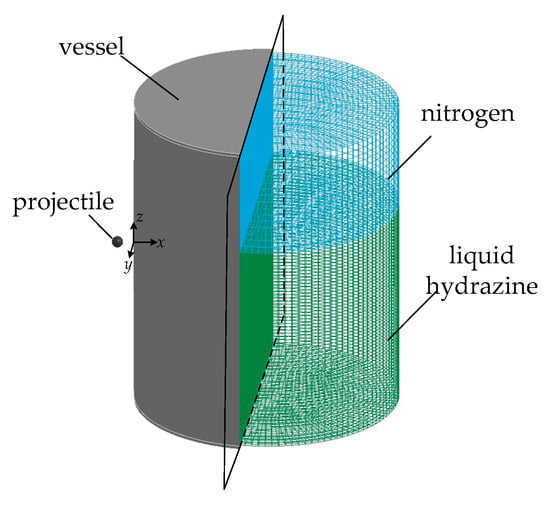
Figure 4.
The simulation model of HYP-2 test device and the right side is the inside view with the vessel wall removed.
Based on the continuous conditions on the interface, the following can be derived:
The pressure decreases to P3 when the shock wave propagates to the inside of the tank wall:
Given the shock wave pressure P3, the particle velocity u3 on the inside of tank wall can be calculated:
When the debris reaches the inside of tank wall, the shock wave pressure, shock wave velocity and particle velocity in debris are P4, D4, and u4.
The debris velocity up can be solved by continuous boundary conditions:
TDL simulation was also carried out to determine the power density in the HYP-2 test [8], which was 2400 kbar2 μs. The calculated power density is larger than the TDL simulation, the reasons are as follows: the vessel is filled with 1/3 nitrogen and 2/3 liquid hydrazine actually, the release wave is generated at the gas-liquid interface in the simulation, when the release wave meets the shock wave, the shock wave pressure decreases and the pressure duration shortens accordingly. However, the influence of the release wave is not taken into account in the initiation criterion. The relative error between the initiation criterion calculation and TDL simulation is 9.71%, verifying the effectiveness of the initiation criterion for the liquid hydrazine tank. The two power densities are both smaller than the minimum power density Pdmin = 3.98 × 10⁵ kbar2 μs, indicating that the shock wave produced by the projectile impact was insufficient to initiate an explosion, which is consistent with the HYP-2 test results.
4. Initiation of the Satellite Tank under Debris Impact
It is of great significance for the risk assessment of satellite to determine whether the satellite tank explodes under the debris hypervelocity impact. As the hypervelocity impact tests are limited by the stability of launcher and the accuracy of measuring device. Numerical simulation provides a new method, which has the advantages of low cost, good repeatability and easy access to intermediate physical quantities. In this section, numerical simulation and the initiation criterion are adopted to study the shock initiation of the satellite tank under the hypervelocity impact.
4.1. Verification of the Simulation Model
To verify the validity of the simulation model, HYP-2 test is simulated using ANSYS/LS-DYNA software and the simulation results are compared with the Zeus calculation. The simulation model consists of the projectile, vessel, nitrogen and liquid hydrazine, as displayed in Figure 4. Lagrange meshs are constructed for projectile and vessel, whilst Euler meshs are constructed for nitrogen and liquid hydrazine. These two meshs are coupled through Arbitrary Lagrange–Euler (ALE) algorithm [21]. Moreover, a multi-material ALE formulation with a second-order accurate advection has been selected to treat nitrogen and liquid hydrazine. The liquid hydrazine is allowed to flow into the nitrogen region by sharing nodes on their interfaces.
The interaction between the projectile and vessel wall is achieved through the eroding surface-to-surface contact, and the interaction between projectile and liquid hydrazine is achieved through the automatic surface-to-surface contact. The boundary conditions of the simulation model are summarized in Table 3.

Table 3.
Boundary conditions of the simulation model.
The mesh density affects the discretization degree of the simulation model and the accuracy of the simulation results. Generally speaking, the smaller the mesh size is, the greater the discretization degree is, and the more accurate the simulation results are. Beyond a certain limit, the mesh size continues to decrease, the simulation results do not change significantly. The simulation results are independent of the mesh density. For this simulation model, the shock wave pressure is related to the mesh density of liquid hydrazine, so it is necessary to determine the appropriate mesh size of liquid hydrazine. Numerical simulations were carried out by setting the mesh sizes of liquid hydrazine to 0.01 cm, 0.02 cm, 0.05 cm, 0.1 cm, 0.2 cm, and 0.3 cm. The attenuation curves of shock wave pressure along the impact line at different mesh sizes are shown in Figure 5. When the mesh size is smaller than 0.1 cm, the attenuation curves of shock wave pressure are very close, indicating that the pressure is not affected by the mesh size. Therefore, the mesh size of liquid hydrazine is set to 0.1 cm. The mesh sizes of the projectile, vessel wall and nitrogen are 0.05 cm, 0.05 cm, and 0.1 cm, respectively. The computing time step is 0.02 μs.
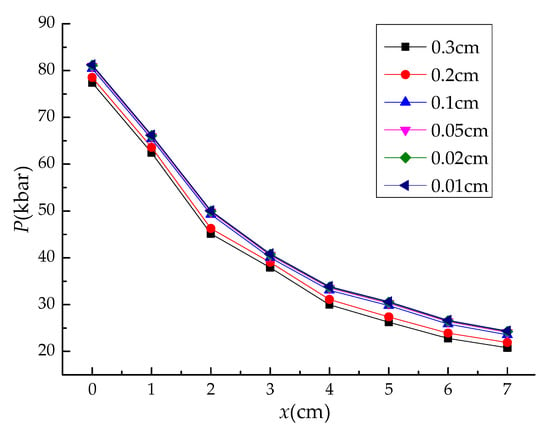
Figure 5.
Attenuation curves of the shock wave pressure along the impact line at different mesh sizes.
The nitrogen is modelled using the constitutive equation MAT_NULL and the state equation EOS_LINEAR_POLYNOMIAL. The pressure in linear polynomial equation is defined as follows [22]:
where C0~C6 are the polynomial equation coefficients, μ = (ρ/ρ0) − 1, ρ/ρ0 is the ratio of current density to initial density. The nitrogen is considered as ideal gas by setting C0 = C1 = C2 = C3 = C6 = 0.
Since the density, boiling point and critical temperature of liquid hydrazine are within 2% of the values for water [19], the constitutive equation MAT_NULL and the state equation EOS_GRUNEISEN of water are used to describe liquid hydrazine. The Gruneisen state equation defines pressure as follows:
where S1~S3 are the slope coefficients of the us − up curve; γ0 is the Gruneisen gamma. The properties and material parameters of nitrogen and liquid hydrazine are listed in Table 4 [22].

Table 4.
Material parameters of nitrogen and liquid hydrazine.
The aluminum projectile and steel vessel are modelled using the constitutive equation MAT_JOHNSON_COOK and the state equation EOS_GRUNEISEN. The Johnson–Cook model express the flow stress as follows:
where A is the quasi-static yield stress, B is the strain hardening modulus, C, n, and m are the material constants. The equations are widely used for metallic materials as numerous efforts have been exerted to determine these parameters. The material properties and parameters used for aluminum and steel [23] are summarized in Table 5.

Table 5.
Material parameters of aluminum and steel.
Figure 6a presents the shock wave pressure and duration in liquid hydrazine calculated by Zeus, and Figure 6b shows the pressure nephogram of the shock wave obtained by ANSYS/LS-DYNA software at 0.10 μs, 0.25 μs, 0.32 μs, 0.50 μs, 0.70 μs, and 0.88 μs s. t = 0 indicates the moment when the projectile contacts with liquid hydrazine, and t = 0.88 μs indicates the moment when the projectile completely enters liquid hydrazine. As seen from Figure 6b, a hemispherical shock wave is formed when the projectile impacts liquid hydrazine, which is consistent with Figure 6a. As the projectile penetrates deeper, the hemispherical shock wave expands.
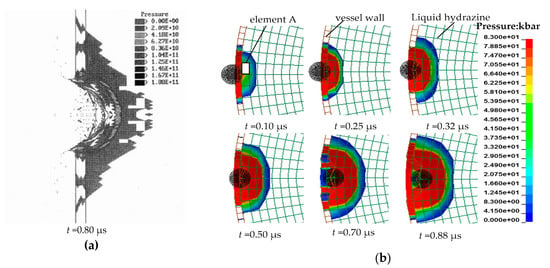
Figure 6.
(a) Zeus calculation of the shock wave pressure and duration in liquid hydrazine [8]; (b) The pressure nephogram of the shock wave in liquid hydrazine obtained by ANSYS/LS-DYNA.
As shown in Figure 6b, element A is located at the impact point in liquid hydrazine. Figure 7 exhibits the pressure–time curve of element A. The peak pressure is 80.42 kbar and the duration is 0.88 μs. Meanwhile, the shock wave pressure and duration obtained by Zeus calculations were 83 kbar and 0.8 μs, respectively [8]. The relative errors of the shock wave pressure and duration between the ANSYS/LS-DYNA simulation and Zeus calculation are 3.1% and 9.1%, thereby verifying the effectiveness of the simulation model.
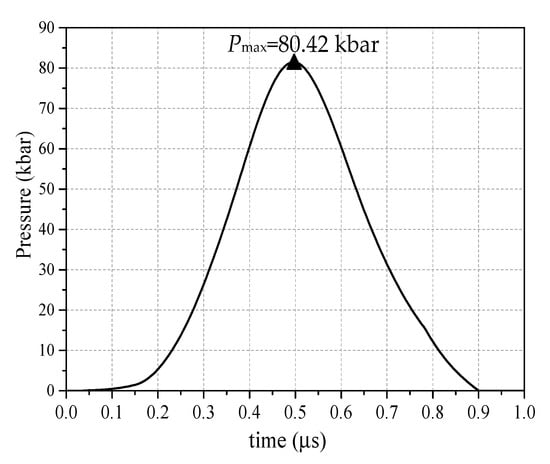
Figure 7.
Pressure-time curve of element A in liquid hydrazine; Pmax represents the peak pressure.
4.2. Simulation of the Debris Impacting Satellite Tank
Numerical simulation is conducted by ANSYS/LS-DYNA software to reproduce a hypothetical scenario, in which the spherical aluminum debris with a diameter of 4 cm impacts the satellite tank at the velocity of 10 km/s. The satellite tank is made of titanium and filled with liquid hydrazine. It is 50 cm in diameter, 120 cm in height, and 2 mm in wall thickness. The impact point is located at the middle of the satellite tank. The simulation model consists of the debris, satellite tank and liquid hydrazine, as displayed in Figure 8.
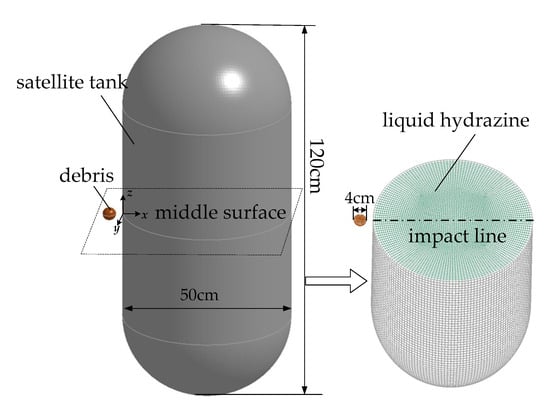
Figure 8.
The simulation model of the debris impacting the satellite tank and the right side is the model cut in half.
Lagrange grids are constructed for the debris and tank, whilst Euler grids are constructed for liquid hydrazine. ALE algorithm, initial velocity, contact type, and material parameters of aluminum and liquid hydrazine are the same as those of HYP-2 simulation model. Numerical simulations were carried out by setting the mesh sizes of liquid hydrazine to 0.1 cm, 0.5 cm, 1 cm, 2 cm, 3 cm, and 4 cm. Results show that when the mesh size is smaller than 2 cm, the shock wave pressure along the impact line remains basically unchanged, indicating that the shock wave pressure is independent of the mesh size. Therefore, the mesh size of liquid hydrazine is set to 2 cm. The mesh sizes of the projectile and satellite tank are 0.5 cm and 2 cm, respectively. The computing time step is 0.6 μs.
As the parameters describing titanium in Johnson–Cook model are unknown, the titanium tank is modelled using the material model MAT_PLASTIC_KINEMATIC. The material parameters of titanium are listed in Table 6. Where, E is the Young’s modulus, υ is the Poisson’s ratio, σs is the yield strength, and σb is the tensile strength.

Table 6.
Material parameters of titanium.
Figure 9 exhibits the pressure nephogram of the shock wave in satellite tank at 6 μs, 34 μs, 55 μs, 98 μs, 143 μs, and 192 μs. When the debris penetrates the satellite tank, a hemispherical shock wave is formed at the impact point. The velocity of the shock wave is higher than that of the debris, so the debris lags behind the shock wave. In the process of shock wave propagation, part of the wave front energy is converted into the internal energy of liquid hydrazine and the deformation energy of tank wall. The irreversible energy loss occurs on the wave front, which results in the continuous decrease in shock wave pressure. When t = 192 μs, the shock wave reaches the back wall of the satellite tank.
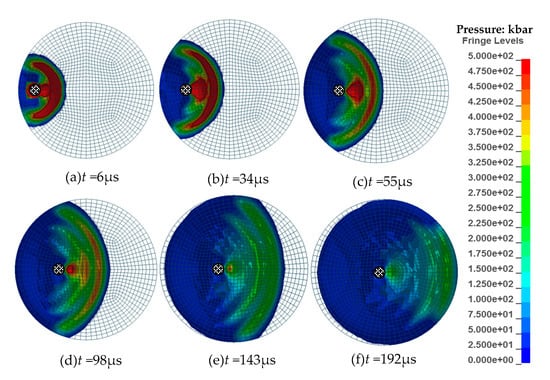
Figure 9.
The pressure nephogram of the shock wave in satellite tank at 6 μs, 34 μs, 55 μs, 98 μs, 143 μs, and 192 μs.
To determine the attenuation law of shock wave in the tank, the peak pressures of the elements on the debris impact line are obtained. These discrete pressures are fitted into a curve by the least square method, as depicted in Figure 10a. The expression of the fitting curve P(t) is as follows (the pressure unit is kbar):
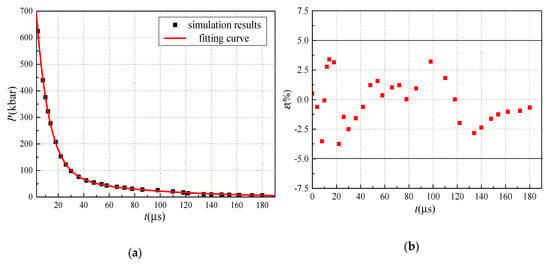
Figure 10.
(a) Fitting curve of the peak pressures on the impact line; (b) Regular residuals between the pressure calculated by the fitting curve and the pressure obtained by simulation.
The regular residuals ε between the pressure calculated by P(t) and the pressure obtained by simulation are shown in Figure 10b. They are evenly distributed and fall within the range of (−5% to 5%), which demonstrates that the fitting curve P(t) is reliable.
The pressure duration in satellite tank can be calculated as follows:
The solution to equation (49) is t = 25.38 μs, which means that the shock wave pressure attenuates to the C-J pressure at t = 25.38 μs.
Then, the power density Pd can be expressed as:
4.3. Calculation of the Debris Impacting Satellite Tank
The initiation criterion is also used to calculate the power density Pd in the satellite tank and to estimate whether the debris hypervelocity impact can trigger an explosion. The calculation process follows the flow chart in Figure 3. The parameters of the debris and satellite tank used in the calculations are shown in Table 7 [24].

Table 7.
Parameters of the debris and satellite tank used in calculation.
The power density calculated by the initiation criterion in the satellite tank is Pd = 5.2705 × 10⁶ kbar2 μs. Comparisons between the simulation results and calculation results are shown in Table 8. The calculated power density is larger than the simulated power density, the relative error ε between the calculated power density and the simulated power density is 8.54%. The reasons for the error may be that a series of simplifications were made in the derivation of the initiation criterion, and the energy loss of the shock wave was not taken into account. The calculated power density and the simulated power density are both greater than the minimum power density Pdmin = 3.98 × 10⁵ kbar2 μs, revealing that the shock wave generated by the hypervelocity impact is sufficient to trigger an explosion in the satellite tank. In general, the calculation results of initiation criterion agree well with simulation results. The two methods can verify each other and accurately predict the shock initiation of the satellite tank.

Table 8.
Comparison of the simulation results and calculation results.
5. Conclusions
- The minimum power density of liquid hydrazine Pdmin = 3.98 × 10⁵ kbar2 μs is determined based on the WSTF#HYP-2 test, SAIC test and the designed TITANK test, the expressions of shock wave pressure and pressure duration are constructed based on the one-dimensional wave theory, and the initiation criterion for the liquid hydrazine tank is established.
- The initiation criterion for the liquid hydrazine tank is used to calculate the power density in WSTF#HYP-2 test. The relative error between the initiation criterion calculation and the TDL simulation is 9.71%, which verifies the effectiveness of the initiation criterion for the liquid hydrazine tank.
- Numerical simulation and the initiation criterion are adopted to calculate the power density in the satellite tank under the debris impact at the velocity of 10 km/s, and the power densities obtained are 4.8206 × 10⁶ kbar2 μs and 5.2705 × 10⁶ kbar2 μs, respectively. The two results agree well with each other and they are both larger than the minimum power density, indicating that the satellite tank explodes under the debris hypervelocity impact.
Author Contributions
Conceptualization, J.Z.; methodology, C.C.; software, B.Z.; validation, B.Z.; formal analysis, B.Z.; investigation, B.Z.; resources, J.Z.; data curation, Y.W.; writing—original draft preparation, B.Z.; writing—review and editing, J.Z.; visualization, C.C.
Funding
This research received no external funding.
Acknowledgments
This research was done with the financial support of the State Key Laboratory of Laser Propulsion and Application. We wish to express sincere gratitude to Duan for his valuable help.
Conflicts of Interest
The authors declare no conflict of interest.
References
- Wang, F.H.; Feng, S.S.; Liu, Y.Y. Introduction to Space Debris; Science Press: Beijing, China, 2010; pp. 1–6. [Google Scholar]
- Borg, J.P.; Grady, D.; Cogar, J.R. Instability and fragmentation of expanding liquid systems. Int. J. Impact Eng. 2001, 26, 65–76. [Google Scholar] [CrossRef]
- Borg, J.P.; Cogar, J.R.; Tredways, S.; Yagla, J.; Zwiener, M. Damage resulting from high speed projectile liquid filled metal tanks. Comput. Methods Exp. Meas. 2001, 30, 889–902. [Google Scholar]
- Townsend, D.; Park, N.; Devall, P.M. Failure of fluid filled structures due to high velocity fragment impact. Int. J. Impact Eng. 2003, 29, 723–733. [Google Scholar] [CrossRef]
- Stepka, F.S.; Dengler, R.P.; Morse, C.R. Investigation of Catastrophic Fracturing and Chemical Reactivity of Liquid-Filled Tanks when Impacted by Projectiles of High Velocity; Report TM X-52063; National Aeronautics and Space Administration: Washington, DC, USA, 1964.
- Rucker, M.A.; Beeson, H.; Stoltzfus, J.M.; Frank, J.B. Demonstration of Hazardous Hypervelocity Test Capability; Report TR-692-001; White Sands Test Facility test: Las Cruces, NM, USA, 1991.
- Wilson, C.W.; Warne, D.; Chatfield, M.D. Fuel Tank Explosion Lethality; Report 91-5425-SH; Science Applications International Corporation: Shalimar, FA, USA, 1991. [Google Scholar]
- Garcia, B.O.; Chavez, D.J. Detonability Study of Liquid Hydrazine; Report ADA526746; White Sands Test Facility test: Las Cruces, NM, USA, 1994.
- Martin, L.; Michel, A.; Chiara, B.; Doormaal, J.C.A.M.; Christof, H.; Gotz, H.; Oliver, M.; Arja, S.; George, S.; Laurent, T.; et al. Design of Blast-Loaded Glazing Windows and Facades: A Review of Essential Requirements towards Standardization. Adv. Civ. Eng. 2016, 2016, 2604232. [Google Scholar]
- Seay, G.E.; Seely, L.B. Initiation of a low-density PETN pressing by a plane shock wave. J. Appl. Phys. 1961, 32, 1092–1097. [Google Scholar] [CrossRef]
- Walker, F.E.; Wasley, R.J. Critical energy for shock initiation of heterogeneous explosives. Explosivstoffe 1969, 17, 9. [Google Scholar]
- Roslund, L.A. Initiation of Warhead Fragments I: Normal Impacts; Report NOLTR73-124; Naval Surface Weapons Center White Oak: Silver Spring, MD, USA, 1973.
- Held, M. Initiation phenomenon with shaped charge jets. In Proceedings of the 9th International Detonation Symposium, Portland, OR, USA, 28 August–1 September 1989; pp. 1416–1426. [Google Scholar]
- Jiang, Y.Z.; Wang, W.L.; Huang, X.F.; Fu, L. Research on critical speed of projectile impacting initiation shelled explosive. Comput. Simul. 2015, 32, 11–14. [Google Scholar]
- Chen, W.; Hu, X.D. Experimental study on impact initiation characteristics of a new explosive. Initiat. Pyrotech. 2009, 2, 5–8. [Google Scholar]
- Lecysyn, N.; Bony, D.A.; Aprin, L.; Heymes, F.; Slangen, P.; Dusserre, G.; Munier, L.; Gallic, C.L. Experimental study of hydraulic ram effects on a liquid storage tank: Analysis of overpressure and cavitation induced by a high-speed projectile. J. Hazard. Mater. 2010, 178, 635–643. [Google Scholar] [CrossRef]
- Munson, B.R.; Young, D.F.; Okiishi, T.H.; Huebsch, W.W. Fundamentals of Fluid Mechanics, 6th ed.; Wiley: Hoboken, NJ, USA, 2009; pp. 500–503. [Google Scholar]
- Chou, P.C.; Chen, S. Hypervelocity impact of bumper-protected fuel tanks. J. Spacecr. 1970, 7, 1412–1418. [Google Scholar]
- Garcia, B.O.; Chavez, D.J. Shock compression of liquid hydrazine. In Proceedings of the 1995 Shock Compression Conference, Seattle, WA, USA, 13–18 August 1995. [Google Scholar]
- Wang, H.F.; Feng, S.S. An approximate theoretical model for the attenuation of shock pressure in solid materials. Acta Armamentarii 1996, 17, 79–81. [Google Scholar]
- Varas, D.; Zaera, R.; Lopz-Puente, J. Numerical modelling of the hydrodynamic ram phenomenon. Int. J. Impact Eng. 2009, 36, 363–374. [Google Scholar] [CrossRef]
- Varas, D.; Zaera, R.; Lopz-Puente, J. Numerical modelling of partially filled aircraft fuel tanks submitted to hydrodynamic ram. Aerosp. Sci. Technol. 2012, 16, 19–28. [Google Scholar] [CrossRef]
- Zhang, K.F.; Liang, M.Z.; Lu, F.Y.; Li, X.Y. Mechanics of plate fracture from detonation wave interaction. Propellants Explos. Pyrotech. 2019, 44, 188. [Google Scholar] [CrossRef]
- Shen, H.R.; Wang, W.J.; Li, Y.Y.; Shao, Q.L. Modeling and Analysis of Spacecraft Impact; Science Press: Beijing, China, 2014; p. 152. [Google Scholar]
© 2019 by the authors. Licensee MDPI, Basel, Switzerland. This article is an open access article distributed under the terms and conditions of the Creative Commons Attribution (CC BY) license (http://creativecommons.org/licenses/by/4.0/).