Abstract
Rhodium (Rh) nanoparticles have attracted a lot of attention due to their strong and ambient-stable UV plasmonic response. Very recently, the synthesis of Rh tetrahedra with and without concave defect-rich surfaces serving in plasmon assisted photocatalytic energy conversion has been reported. In this work, we perform a systematic numerical study on plasmonic behavior and surface charge distribution in order to optimize the use of Rh tetrahedra in surface-enhanced spectroscopies and photocatalysis. We analyze the effect of the edges and corners reshaping, a deformation already reported to appear in Rh nanocubes which have been repeatedly re-used in photocatalytic processes. It is demonstrated that rounding the edges and corners weakens both the near-field enhancement and surface charge densities in these locations, which in turn are the more reactive regions due to the presence of uncoordinated sites. In addition, we study how the near-field and charge density is redistributed on the surface of the tetrahedra when concavities of different sizes and depths are introduced. Through this study, we show that, in order to simultaneously maximize the near-field enhancement and surface charge densities in the concavity and at external edges and corners, medium size deep concavities are needed.
1. Introduction
The UV has been elusive for plasmonics due to the difficulty of finding metals with strong and ambient-stable plasmonic response in this spectral range. Common plasmonic metals (i.e., Ag or Au) cannot be used for this purpose because of the presence of interband transitions in the UV that inhibit the excitation of localized surface plasmon resonances (LSPRs) in this spectral region. Sanz et al. [1] initiated a quest for metals able to support LSPRs in the UV. From this study, magnesium (Mg), aluminum (Al), gallium (Ga) and rhodium (Rh) were presented as the most promising candidates. However, an issue that should be carefully addressed when dealing with the applicability of these materials in real applications is their stability when exposed to ambient conditions. For example, Mg, rapidly oxidizes when exposed to air, consuming the metal in the nanoparticles (NPs) while quenching completely the LSPRs [1,2]. Al and Ga form dense oxide layers that dramatically slows down subsequent oxidation reactions after only a few monolayers preventing further oxygen diffusion. In the case of Al, the thickness of the Al2O3 layer is of the order of several nanometers [1,3]. Ga, a liquid metal just above room temperature, forms a self terminating Ga2O3 ≈ 1 nm thick that maintains the shape of the nanoparticles and protects the inner metal from environmental degradation [4]. The formation of an oxide shell on the surface of the NPs made of these metals affects both the spectral position and near-field enhancement of the LSPRs, hampering a reproducible plasmonic response [5].
Rhodium was another of the recently proposed promising metals for UV plasmonics by Sanz et al. [1]. A lot of attention is being paid to this metal in UV plasmonics for several reasons: (i) the lack of a native oxide coating [6], (ii) the possibility of enhancing rhodium’s already favorable catalytic activity by UV illumination near its plasmonic resonance [7] and (iii) the variety of shapes in which Rh NPs can be synthesized through chemical methods with nanometer size control. Already, size-controlled Rh tripod stars and nanocubes have been grown with their corresponding systematic numerical study on their plasmonic response, and it has been demonstrated their activity in UV surface-enhanced Raman spectroscopy (SERS), surface-enhanced fluorescence (SEF) and photoinduced degradation of p-aminothiophenol [6,8,9,10]. Another Rh NPs shape that has been synthesized is the tetrahedron (TD). Interestingly, this polyhedron is the one with highest surface-to-volume ratio, a desired characteristic in photocatalytic systems. Not only perfectly shaped Rh TDs have been synthesized [11], but also concave ones with defect-rich surfaces [12,13]. These defects have been shown to enhance the plasmon assisted photocatalytic energy conversion [13]. Other active catalytic sites are corners and edges, where adsorbed chemical intermediates may have higher coordination with surface atoms there [14].
Here, we report a detailed numerical analysis of the UV plasmonic behavior and charge distribution of Rh TDs, a geometry easily fabricated with precise size control even with concave surfaces [11,12,13]. It is shown that the highest hot-spots are located at their edges and corners, and that their intensity decreases when they are progressively rounded. This deformation of the perfect shape commonly appears when TDs, and other NPs, are repeatedly used in photocatalytic cycles [10]. Due to the possibility of synthesizing concave TDs, we will also show how the concavity of TDs can be optimized by varying its depth and size to achieve, simultaneously, a maximum surface charge density on it and on its external corners and edges. In this way, we provide the path for designing of concave TDs with optimum electromagnetic behavior for photocatalysis applications.
2. Methods
The electromagnetic interaction between the Rh TDs and light has been modeled using finite element simulations implemented using COMSOL Multiphysics 5.2 (COMSOL Inc., Burlington, MA, USA). Its electromagnetic waves module allows solving of the differential form of Maxwell’s equations together with initial and boundary conditions. The equations are solved using the finite element method (FEM) with numerically stable edge element discretization in combination with state-of-the-art algorithms for preconditioning and solving the resulting sparse systems of equations.
The spectral dependence of three parameters has been studied—the absorption cross-section (), the local field enhancement of the electric field () and the surface charge density (), all of which depend on the photon energy of the illuminating electromagnetic field. For particles much smaller than the wavelength, can be associated with the far-field extinction efficiency. represents the local field enhancement. The areas with the highest enhanced local field intensity (i.e., hot-spots) are the regions where the hot-electron generation process takes place. The evaluation of allows us to identify the regions over the NP surface where hot electrons are being generated, this information being useful for photocatalysis research. A deeper analysis of this aspect is made through the evaluation of : the regions with the highest charge concentrations are the most reactive having the highest probability of charge transfer.
We have performed finite element simulations on Rh TDs and have compared them with identical ones made of Pt and Pd. These nanostructures were illuminated with a monochromatic linearly polarized plane wave within the interval of interest (i.e., 2-6 eV). The illumination geometry is depicted in Figure 1a: the TDs are illuminated at normal incidence (wave vector along the z-axis) with polarization parallel to one of the edges.
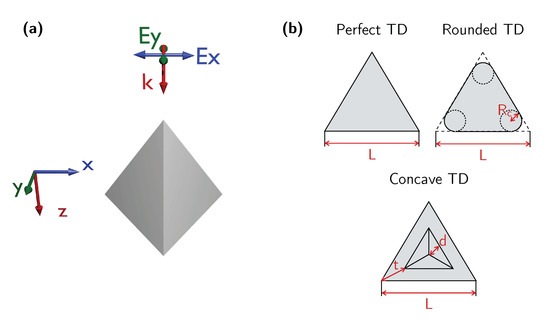
Figure 1.
(a) Scheme of simulations geometry: the tetrahedrons (TDs) are illuminated with monochromatic plane waves with orthogonal polarization and under normal incidence (along the z-direction). (b) Scheme of the different deformations introduced to the perfect TD. With red arrows are indicated the parameters that characterize each deformation.
Two different TD deformations have been studied stating from the perfect TD: (i) the rounded and (ii) the concave TDs. Each of them has their own parameters in order to characterize it. Figure 1b schematizes each of the aforementioned deformations and their characterization parameters. Starting by the perfect TD, it is defined by the side length L. The rounded TD is defined by the side length L of the perfect TD in which it is inscribed and the radius of curvature of the corners . Finally, the concave TD is defined by the side length L, the depth of the concavity d and the distance between the corner of the TD and the deformation t.
In this work, we have used the frequency dependent complex dielectric functions () of Rh, Pt and Pd taken from References [15,16,17]. The complex dielectric functions of these materials are plotted in Figure 2. The Fröhlich frequency () for these metals are 8.0 eV for Rh, 4.5 eV for Pt and 5.7 eV for Pd. At those energies, the figure of merit [18], typically used to evaluate the efficiency to generate LSPRs, and defined as , takes the following values: 2.25 for Rh, 0.35 for Pt and 0.66 for Pd. Therefore, Rh is able to support higher quality LSPRs reaching higher photon energies.
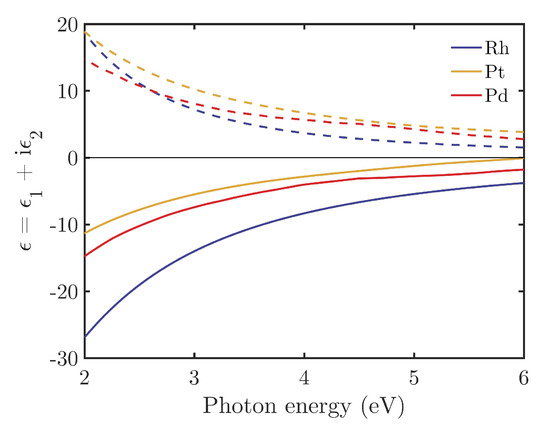
Figure 2.
Real (, solid line) and imaginary (, dashed line) parts of the complex relative permittivity () of Rh (blue), Pt (yellow) and Pd (red) as a function of the photon energy of the incident beam.
3. Results and Discussion
3.1. Comparison of Rh, Pt and Pd in Simple Geometries
Palladium (Pd) and platinum (Pt) are also materials that have shown photocatalytic behavior. Pd has been presented as key piece in the looming hydrogen economy due to its capability to dissociate hydrogen and store it [19]. Also, along with Pt and Rh, has been used in heterometallic antenna-reactor complexes. In these systems, metallic nanoparticles with strong optically resonant properties (i.e., Al) behave as nanoscale optical antennas that are coupled to weakly light-absorbing catalytic metallic NPs (i.e., Pd, Pt, or Rh) to trigger a light-induced generation of hot carriers within the catalyst nanoparticles [20,21].
As a first step, we consider tetrahedron monomers of Rh, Pd and Pt with an edge of 20 nm. This size has been chosen to mimic real photocatalysis experiments as reported in Reference [13]. Moreover, other authors have reported the possibility of synthesizing Pd and Pt tetrahedral NPs [22,23]. The nanostructure is illuminated with a monochromatic plane wave under normal incidence and x-polarization (see Figure 1a). To explore the relative contributions of the geometry and optical properties, calculations for a sphere and a cube with equivalent volume are also presented. The radius of the equivalent sphere is R = 6 nm. The equivalent cube has a side length of L = 10 nm.
Figure 3 plots the absorption cross-section (top row) and spectral electric field intensity averaged () over the NP’s closed surface (bottom row) for equivalent spheres, cubes and tetrahedra made of Rh, Pt and Pd. It can be seen how the tetrahedron presents the LSPR at lower photon energies than the other two geometries. In fact, it shows a broad peak that covers from 3.5 to 6 eV. In general the values of and are the highest for Rh followed by Pd and Pt as expected by the values of : 2.25 for Rh, 0.35 for Pt and 0.66 for Pd. In addition, it can be observed how the shape has a strong influence on the LSPRs and their spectral position. The LSPRs in the tetrahedra are produced at lower energies than those of the nanocubes and spheres, the latter being those appearing at higher energies.
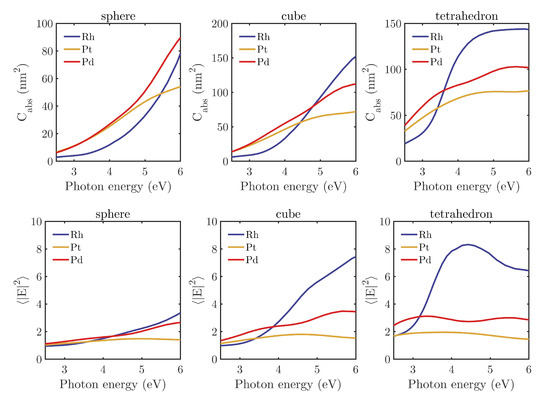
Figure 3.
Absorption cross-section () (top row) and spectral electric field intensity () averaged over the nanoparticle’s closed surface (bottom row) for spheres (R = 6 nm, first column), cube (L = 10 nm, second column), and tetrahedron (L = 20 nm, third column) composed of Rh (blue), Pt (yellow) and Pd (red) illuminated under normal incidence, and embedded in air.
3.2. Rh Tetrahedra: Effect of Rounding Edges
As shown in the previous section, the optical response strongly depends on the shape of the NP. Therefore, we now consider how the LSPR for an isolated perfectly shaped TD is modified when some deformations are introduced. Specifically, here, we will consider the effect of rounding the corners and edges of the TD. This type of deformation can arise during the chemical synthesis or from the extended use of the TDs as catalysts. Specifically, we have studied the effect of rounding the edges and corners by varying their curvature radius from 0 nm (perfect TD) to 2 nm. This study has been done starting from a perfect TD with side length nm illuminated under normal incidence with a monochromatic plane wave under and polarization (see Figure 1a).
Figure 4 shows the effect of increasing on the absorption cross-section (a) and (b,c) the local field enhancement . The local field enhancement has been evaluated spectrally by (b) averaging its value over the NPs close surface () to see at which photon energy this magnitude is maximized, and (c) locally on the surface of the TD to identify the regions were the enhancement is being produced (hot-spots). These maps have been recorded for the photon energy of maximum average enhancement .
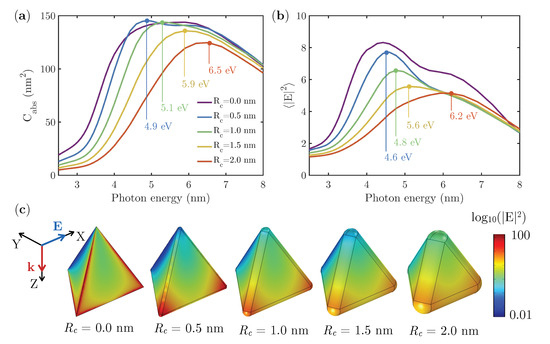
Figure 4.
(a) Absorption cross-sections () of edge length L = 20 nm Rh NCswith rounded edges and corners with a curvature radii varying from 0 (perfect TD) to 2 nm; (b) local field enhancement () averaged over the TD’s surface; (c) local field enhancement in logarithmic scale () over the surface of the different TD when illuminated with the corresponding resonant wavelength.
When increasing the value of , two trends can be distinguished in the spectra—a blue-shift and a decrease of the resonance peak. This effect can be understood attending to two different effects: a decrease in the volume of the TD as increases, and the reduction of the amplitude of charge oscillation due to the de-localization of charges at the edges and corners when rounded. A similar behavior has , whose spectra are also blue-shifted and quenched when increasing . This is related to weaker and more de-localized hot-spots as seen in Figure 4c. This de-localization of the hot-spots with increasing is related with the de-localization of charge at edges and tips, something that can be explained attending to the lightning rod effect—sharp corners and edges concentrate the dipolar fields in particles [24]. It is worth mentioning that the near-field resonances (peaks appearing in spectra) are red-shifted with respect to those in the far-field (peaks appearing in spectra), a phenomenon attributed to the different contribution of the evanescent and propagating components to the scattered field [25]. In this case, the red-shift is ≈0.3 eV.
To better illustrate the aforementioned de-localization of the charge at edges and tips, we have studied the surface charge density at the edges and flat faces of the TDs. The red/blue regions represent positive/negative charge densities. Since we associate high values of with a high chemical reactivity, these calculations allow us to identify the most reactive regions of the NP’s surface and to qualitatively quantify the loss of reactivity when increasing . Figure 5 shows the normalized absolute value of the averaged surface charge density on (a) the corners and edges, and (b) on the flat faces of the TD, respectively. It is clear from these plots that most of the charge is concentrated on the edges and corners, and that this density decreases with increasing . These results are consistent with the lightning rod effect [24]. On the flat faces of the TDs the value of remains almost constant no mater the value of . Figure 5c shows the value on the surface of the TDs when illuminated at resonance. It can be seen how for the smallest , at edges and corners takes the highest values.
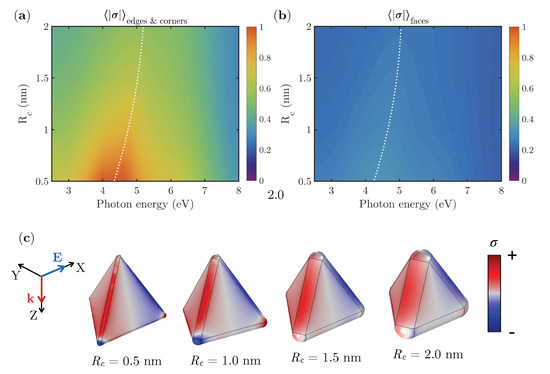
Figure 5.
(a) Normalized spectral values of surface charge distribution () averaged over edges and corners and (b) the flat faces of the TDs with rounded edges and corners as function of the curvature radii . (c) Surface charge distribution () over Rh TDs with rounded edges and corners with a curvature radii when illuminated at the resonant wavelength. The red/blue regions represent positive/negative charge densities.
Therefore, the study of the local-field enhancement and surface charge density has revealed that the reactivity of the TDs is higher when its edges and corners are sharper. In Rh NCs, it has been experimentally observed that, as the cubes are re-used in photocatalytic processes, the more spherical they become, leading to a loss of reactivity [10]. A similar effect is expected to occur on Rh TDs. Their re-use in photocatalytic processes is expected to round their edges, thus decreasing their reactivity as demonstrated by the decrease of and with increasing .
3.3. Rh Tetrahedra: Effect of a Concavity
Recent studies have reported the possibility of synthesizing Rh TDs with concave faces with defect-rich surfaces [12,13]. These defects have been shown to enhance the photocatalytic energy conversion [13]. Therefore, in this section we will evaluate how the near-field enhancement and the charge density are distributed over the TD’s surface when concavities are introduced at their flat faces. In this way, we can look for the concavity parameters that maximize the surface and inside the cavity to enhance its catalytic properties, while keeping high values of these magnitudes at the outer edges and corners to maintain their inherent reactivity. In order to do this, we have varied the size of the concavity t and its depth d (see Figure 1b).
First, we will address the effect of the size of the concavity t while keeping its depth constant ( nm) in a nm TD. Figure 6 shows the (a) and (b) spectra as the value of t decreases starting from the perfect TD. It can be seen that as we increase the size of the concavity (lower values of t), both the and peaks red-shift and narrow. The peak value of remains almost constant while those of slightly decreases (≈10%). The narrowing of the LSPR peak can be understood attending to the oscillation amplitude of the electrons in the TD. When the TD has flat faces, the electrons can oscillate with an amplitude going from the side length (oscillation between bottom corners of the TD) to progressively smaller amplitudes as the oscillations go up along the flat face, leading to broad LSPR peaks. When a concavity is introduced, some of the previously allowed oscillations are blocked by the presence of the concavity, narrowing the LSPR peak. In fact, for the biggest concavity, only the oscillation along the bottom edge of the TD is allowed (the widest amplitude), consistent with a LSPR peak at lower photon energy.
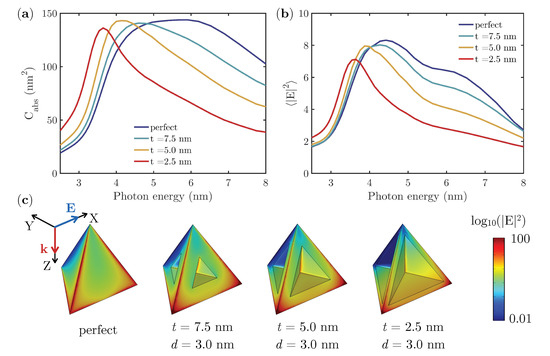
Figure 6.
(a) Absorption cross-sections () of edge length L = 20 nm Rh TDs with a concavity with increasing size t while keeping its depth constant nm; (b) local field enhancement () averaged over the TD’s surface; (c) local field enhancement in logarithmic scale () over the surface of the different TD when illuminated with the corresponding resonant wavelength.
Figure 6c shows the near-field distribution over the TD’s surface when illuminated at resonance. It can be seen how the most intense hot spots are produced at the external edges and bottom corners of the TDs. When increasing the size of the concavity, the hot spots, initially evenly distributed along the external edges (oscillation of the electrons all across the flat surface of the TD), become concentrated in the bottom corners. This is consistent with the fact that, for the largest concavity, the electron oscillation is constraint along the bottom edge of the TD.
In order to potentially increase the reactivity of the concavity, it is important to maximize the surface charge density on its surface. Therefore, in order to address this issue, we have calculated the averaged value of outside and inside the concavity to see how its value is affected when the size of the concavity increases. Figure 7 shows the average of the absolute value of the surface charge density (a) outside and (b) inside the concavity. The general trend is that as the concavity size increases, the value of increases while decreases. However, the drop in the value of is smaller (from 0.57 to 0.36) than the increase of (from 0.60 to 1.00). Thus, with a intermediate concavity size it is possible to keep a large reactive surfaces with a high values of simultaneously inside and outside the concavity. In small concavities, the angle between the inner and inner-outer faces is smaller, leading to an enhancement of the lightning rod effect [24] on those regions, and subsequently, to larger charge concentrations (higher ). Figure 7c shows the value on the surface of the TDs when illuminated at resonance. The highest surface charge concentrations are located at the external edges and corners of the TDs as evidenced by the high values of in comparison with those of .
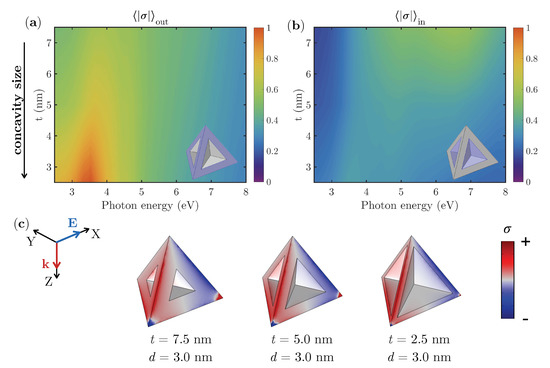
Figure 7.
(a) Normalized spectral values of surface charge distribution () averaged over the exterior faces and (b) over the concavity of the TDs as a function of the concavity size t while keeping its depth constant nm. (c) Surface charge distribution () over the concave Rh TDs. The red/blue regions represent positive/negative charge densities.
After analyzing the effect of the size of the concavity, now we will address the effect that has its depth on , and . As in the previous cases, we will consider a TD with nm. The concavity size has been fixed to nm and its depth d has been varied from 0 to 4 nm. Figure 8 shows the (a) and (b) spectra for different values of d. It can be seen how the peaks red-shift and slightly increase with d while their width progressively lowers. A similar trend can be seen in the case of —the wide peak appearing for the perfect TD red-shifts and narrows as d becomes larger. Again, the red-shift and narrowing of the LSPR peak can be understood in terms of the constrain in the oscillation amplitude of the electrons that the concavity impose. By looking at the local field enhancement on the surface of the TDs (Figure 8c), it is clear that, as concavity becomes deeper, the values of , evenly distributed along the edges for the perfect TD, are redistributed into the bottom corners and the inner edges of the concavity.
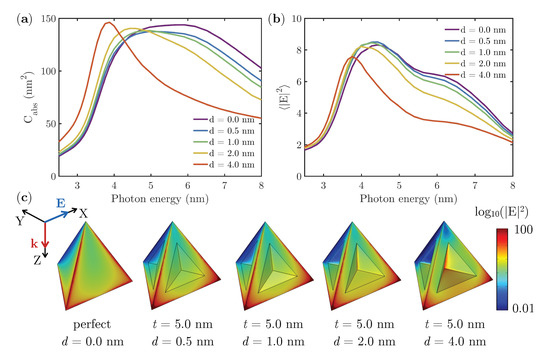
Figure 8.
(a) Absorption cross-sections () of edge length L = 20 nm Rh TDs with a concavity with increasing depth d while keeping its size constant nm; (b) local field enhancement () averaged over the TD’s surface; (c) local field enhancement in logarithmic scale () over the surface of the different TD when illuminated with the corresponding resonant wavelength.
Attending to the normalized surface charge density averaged outside and inside the concavity ( and ), we have looked at the possibility of simultaneously maximizing both magnitudes in order to increase the reactivity in the external edges and corners as well as in the defect-rich inner surfaces of the concavity. Figure 9 shows the average of the absolute value of the surface charge density (a) outside and (b) inside the concavity. It is clear that, by deepening the concavity, the surface charge density inside and outside increases. Therefore, the deeper the concavity the higher are the values of and . The increasing value of with d can be rationalized in terms of the lightning rod effect—as d increases, the angle formed between the inner and inner-outer faces of the concavity decreases, producing a lightning-rod effect [24] at those regions that, consequently, lead to higher surface charge densities. All these effects can be seen in Figure 9c, which plots the surface charge distribution over the studied TDs when illuminated at resonance.
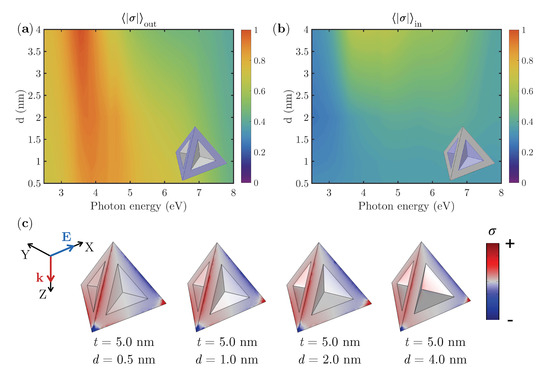
Figure 9.
(a) Normalized spectral values of surface charge distribution () averaged over the exterior faces and (b) over the concavity of the TDs as a function of the concavity depth d while keeping its size constant nm. (c) Surface charge distribution () over the concave Rh TDs. The red/blue regions represent positive/negative charge densities.
3.4. Rh Tetrahedra: Comparison with Other Fabricated Rh Geometries
Apart from Rh tetrahedra, other Rh NPs geometries have been reported in the literature with demonstrated applicability in photocatalysis and surface-enhanced spectroscopies. These geometries correspond to Rh tripod stars [6,8] and nanocubes [7,9,10]. Here, we will compare the near-field enhancement and spectral position of the LSPR peaks in perfect tetrahedra ( nm), and tripod stars and cubes of equivalent volume. The tripod stars have length nm, width nm and height nm [8]. The cube has an edge length of nm. Additionally, we consider in the comparison a concave tetrahedron with size nm, and a concavity parameterized by nm and nm (smaller volume). For the comparison, all the geometries have been illuminated under normal incidence with a plane-wave polarized along the x-axis. Finally, it is worth mentioning that the TD is the polyhedron with highest surface-to-volume ratio (0.72 nm−1 for the TD
0.60 nm−1 for the cube). The tripod star has a surface-to-volume ratio of 0.76 nm−1. Geometries with high values of this magnitude are desired in photocatalysis. It is worth mentioning that this magnitude is increased when a concavity is added to the particle ( 1.27 nm−1 for the concave TD the 0.72 nm−1 of the perfect TD).
Figure 10 plots (a) and (b) for the aforementioned geometries: the cube, tripod star, tetrahedron and concave tetrahedron. The near-field distribution on their surfaces when illuminated at resonance is shown in Figure 10c.
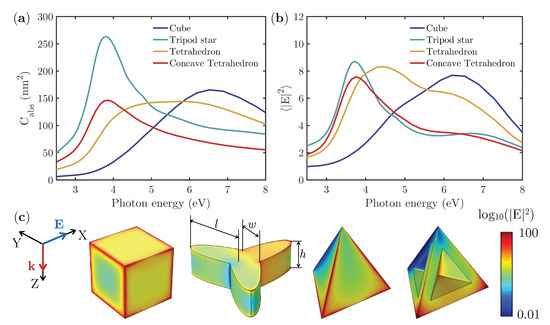
Figure 10.
(a) Absorption cross-section () and (b) local field enhancement () of a cube ( nm), tripod star ( nm, nm and nm), tetrahedron ( nm) and concave tetrahedon ( nm, nm and nm) illuminated under normal incidence with a x-polarized plane wave. (c) Near field distribution on the surface of the particles when illuminated at resonance.
Figure 10a shows big differences in the LSPR peaks of the different analyzed geometries. Both tripod star and the concave tetrahedron present well-defined peaks at approximately the same photon energy ( eV) with a difference in amplitude caused by the reduced volume of the concave TD. The cube also presents a well-defined peak with an amplitude slightly higher than that of the concave TD, although in this case the peak is considerably broader and at higher photon energy ( eV). The perfect TD shows a wide plateau covering the 4.5–6.5 eV spectral range and an amplitude similar to that of the concave TD. Regarding the values of , all the analyzed geometries show very similar maximum values, ranging between 7.5–8.5. Again, both the tripod star and the concave TD show well-defined peaks at lower energies ( eV) than those of the TD and cube. The broad peaks of the TD and the cube are formed by two overlapping components—for the TD at 4.4 and 6.2 eV, and for the cube at 5.0 and 6.2 eV. Whereas for the TD the dominant component is the one at low photon energy (4.4 eV), for the cube, the dominant one is that at higher photon energies (6.2 eV). Therefore, the TD and the cube produce near-field enhancements comparable to those of the tripod star and concave TD but in a broader spectral range, allowing a less precise spectral tuning of the illuminating beam in order to reach a resonant behavior.
4. Conclusions
Due to the increasing interest in Rh nanostructures for UV plasmonics and photocatalysis because of Rh’s ambient-stable, inherent catalytic properties and strong plasmonic response, we have numerically studied the electromagnetic behavior of Rh tetrahedra in the UV. This study has been performed by analyzing both near- and far-field parameters such as their absorption cross-section, local field enhancement and surface charge density. Specifically, we have studied the effect of rounding their edges and corners, a defect that may appear during their synthesis or repeated use in photocatalytic reactions. This deformation causes a blue shift on the LSPR peak and a weakening of the local field enhancement and surface charge density at edges and corners. Moreover, due to the possibility of synthesizing TDs with defect-rich concave faces–that have been shown to enhance the photocatalytic processes–we have studied how the size and depth of this concavity affects their electromagnetic behavior, increasing the size and depth of the concavity red-shift and narrowing the LSPR peak. In order to maximize the near-field enhancement and surface charge density on their tips and edges, as well as in their concave faces, medium size and deep concavities are needed. By comparison with other fabricated Rh geometries (tripod stars and nanocubes), it can be concluded that the perfect TD is able to produce comparable values of the near-field enhancement but in a broader spectral range, allowing a less precise tuning of the illuminating beam in order to reach a resonant behavior. The main results of this research mean to guide experimentalists in the optimization of the resonances of Rh TDs for photocatalysis or surface-enhanced spectroscopies through the control of the near-field enhancement and surface-charge densities over the surface of the nanoparticle.
Author Contributions
Conceptualization, Y.G.; electromagnetic calculations, Y.G.; writing–original draft preparation, Y.G.; review and editing, Y.G., F.M. and F.G.; supervision, F.M. and F.G.
Funding
This research has been supported by SODERCAN (Sociedad para el Desarrollo de Cantabria) through the Research Vicerrectorate of the University of Cantabria (project #14JU286466).
Acknowledgments
Y.G. thanks the University of Cantabria for her FPU grant.
Conflicts of Interest
The authors declare no conflict of interest.
References
- Sanz, J.M.; Ortiz, D.; Alcaraz de la Osa, R.; Saiz, J.M.; González, F.; Brown, A.S.; Losurdo, M.; Everitt, H.O.; Moreno, F. UV plasmonic behavior of various metal nanoparticles in the near- and far-field regimes: Geometry and substrate effects. J. Phys. Chem. C 2013, 117, 19606–19615. [Google Scholar] [CrossRef]
- Gutiérrez, Y.; Giangregorio, M.M.; Palumbo, F.; Brown, A.S.; Moreno, F.; Losurdo, M. Optically addressing interaction of Mg/MgO plasmonic systems with hydrogen. Opt. Express 2019, 27, A197–A205. [Google Scholar] [CrossRef] [PubMed]
- Knight, M.W.; King, N.S.; Liu, L.; Everitt, H.O.; Nordlander, P.; Halas, N.J. Aluminum for plasmonics. ACS Nano 2014, 8, 834–840. [Google Scholar] [CrossRef] [PubMed]
- Losurdo, M.; Suvorova, A.; Rubanov, S.; Hingerl, K.; Brown, A.S. Thermally stable coexistence of liquid and solid phases in gallium nanoparticles. Nat. Mater. 2016, 15, 995–1002. [Google Scholar] [CrossRef]
- Gutierrez, Y.; Ortiz, D.; Sanz, J.M.; Saiz, J.M.; Gonzalez, F.; Everitt, H.O.; Moreno, F. How an oxide shell affects the ultraviolet plasmonic behavior of Ga, Mg, and Al nanostructures. Opt. Express 2016, 24, 20621. [Google Scholar] [CrossRef] [PubMed]
- Watson, A.M.; Zhang, X.; Alcaraz de la Osa, R.; Marcos Sanz, J.; González, F.; Moreno, F.; Finkelstein, G.; Liu, J.; Everitt, H.O. Rhodium nanoparticles for ultraviolet plasmonics. Nano Lett. 2015, 15, 1095–1100. [Google Scholar] [CrossRef]
- Zhang, X.; Li, X.; Zhang, D.; Su, N.Q.; Yang, W.; Everitt, H.O.; Liu, J. Product selectivity in plasmonic photocatalysis for carbon dioxide hydrogenation. Nat. Commun. 2017, 8, 14542. [Google Scholar] [CrossRef] [PubMed]
- Alcaraz de la Osa, R.; Sanz, J.M.; Barreda, A.I.; Saiz, J.M.; González, F.; Everitt, H.O.; Moreno, F. Rhodium tripod stars for UV plasmonics. J. Phys. Chem. C 2015, 119, 12572–12580. [Google Scholar] [CrossRef]
- Zhang, X.; Li, P.; Barreda, Á.; Gutiérrez, Y.; González, F.; Moreno, F.; Everitt, H.O.; Liu, J. Size-tunable rhodium nanostructures for wavelength-tunable ultraviolet plasmonics. Nanoscale Horiz. 2016, 1, 75–80. [Google Scholar] [CrossRef]
- Gutiérrez, Y.; Ortiz, D.; Saiz, J.; González, F.; Everitt, H.; Moreno, F. The UV plasmonic behavior of distorted rhodium nanocubes. Nanomaterials 2017, 7, 425. [Google Scholar] [CrossRef]
- Park, K.H.; Jang, K.; Kim, H.J.; Son, S.U. Near-monodisperse tetrahedral rhodium nanoparticles on charcoal: The shape-dependent catalytic hydrogenation of arenes. Angew. Chem. Int. Ed. 2007, 46, 1152–1155. [Google Scholar] [CrossRef] [PubMed]
- Xie, S.; Zhang, H.; Lu, N.; Jin, M.; Wang, J.; Kim, M.J.; Xie, Z.; Xia, Y. Synthesis of rhodium concave tetrahedrons by collectively manipulating the reduction kinetics, facet-selective capping, and surface diffusion. Nano Lett. 2013, 13, 6262–6268. [Google Scholar] [CrossRef] [PubMed]
- Kuo, C.S.; Kao, C.R.; Chen, W.J.; Lu, M.Y.; Cullen, D.A.; Sneed, B.T.; Chuang, Y.C.; Yu, C.C.; Kuo, C.H. Aqueous synthesis of concave Rh nanotetrahedra with defect-rich surfaces: Insights into growth-, defect-, and plasmon-enhanced catalytic energy conversion. Chem. Mater. 2018, 30, 4448–4458. [Google Scholar] [CrossRef]
- Nørskov, J.K.; Studt, F.; Abild-Pedersen, F.; Bligaard, T. Fundamental Concepts in Heterogeneous Catalysis; John Wiley & Sons, Inc.: Hoboken, NJ, USA, 2014. [Google Scholar] [CrossRef]
- Pierce, D.T.; Spicer, W.E. Optical Properties of Rhodium. Phys. Status Solidi (B) 1973, 60, 689–694. [Google Scholar] [CrossRef]
- Palik, E.D. Handbook of Optical Constants of Solids; Academic Press: Cambridge, MA, USA, 1998. [Google Scholar]
- Johnson, P.B.; Christy, R.W. Optical constants of the noble metals. Phys. Rev. B 1972, 6, 4370–4379. [Google Scholar] [CrossRef]
- Blaber, M.G.; Arnold, M.D.; Ford, M.J. A review of the optical properties of alloys and intermetallics for plasmonics. J. Phys. Condens. Matter 2010, 22, 143201. [Google Scholar] [CrossRef] [PubMed]
- Wadell, C.; Syrenova, S.; Langhammer, C. Plasmonic hydrogen sensing with nanostructured metal hydrides. ACS Nano 2014, 8, 11925–11940. [Google Scholar] [CrossRef]
- Zhang, C.; Zhao, H.; Zhou, L.; Schlather, A.E.; Dong, L.; McClain, M.J.; Swearer, D.F.; Nordlander, P.; Halas, N.J. Al–Pd nanodisk heterodimers as antenna–reactor photocatalysts. Nano Lett. 2016, 16, 6677–6682. [Google Scholar] [CrossRef]
- Swearer, D.F.; Leary, R.K.; Newell, R.; Yazdi, S.; Robatjazi, H.; Zhang, Y.; Renard, D.; Nordlander, P.; Midgley, P.A.; Halas, N.J.; et al. Transition-metal decorated aluminum nanocrystals. ACS Nano 2017, 11, 10281–10288. [Google Scholar] [CrossRef]
- Yin, A.X.; Min, X.Q.; Zhang, Y.W.; Yan, C.H. Shape-selective synthesis and facet-dependent enhanced electrocatalytic activity and durability of monodisperse Sub-10 nm Pt-Pd tetrahedrons and cubes. J. Am. Chem. Soc. 2011, 133, 3816–3819. [Google Scholar] [CrossRef]
- Zhang, Y.; Wang, M.; Zhu, E.; Zheng, Y.; Huang, Y.; Huang, X. Seedless growth of palladium nanocrystals with tunable structures: From tetrahedra to nanosheets. Nano Lett. 2015, 15, 7519–7525. [Google Scholar] [CrossRef] [PubMed]
- Liao, P.F. Lightning rod effect in surface enhanced Raman scattering. J. Chem. Phys. 1982, 76, 751. [Google Scholar] [CrossRef]
- Moreno, F.; Albella, P.; Nieto-Vesperinas, M. Analysis of the spectral behavior of localized plasmon resonances in the near- and far-field regimes. Langmuir 2013, 29, 6715–6721. [Google Scholar] [CrossRef] [PubMed]
© 2019 by the authors. Licensee MDPI, Basel, Switzerland. This article is an open access article distributed under the terms and conditions of the Creative Commons Attribution (CC BY) license (http://creativecommons.org/licenses/by/4.0/).