Shoe Cushioning Effects on Foot Loading and Comfort Perception during Typical Basketball Maneuvers

1
School of Kinesiology, Shanghai University of Sport, Shanghai 200438, China
2
Key Laboratory of Exercise and Health Sciences of Ministry of Education, Shanghai University of Sport, Shanghai 200438, China
*
Author to whom correspondence should be addressed.
Appl. Sci. 2019, 9(18), 3893; https://doi.org/10.3390/app9183893
Submission received: 21 August 2019
/
Revised: 9 September 2019
/
Accepted: 12 September 2019
/
Published: 17 September 2019
(This article belongs to the Special Issue Biomechanical Spectrum of Human Sport Performance)
Abstract
:Purpose: This study aimed to explore the relationship between foot loading and comfort perception in two basketball shoes during basketball-specific maneuvers. Methods: Twelve male collegiate basketball players were required to complete three basketball maneuvers (i.e., side-step cutting, 90° L-direction running, and lay-up jumping) in two basketball shoe conditions (shoe L and shoe N, with different midsole cushioning types). Two Kistler force plates and a Medilogic insole plantar pressure system were used to collect kinetic data (i.e., impact force, peak loading rate, and plantar pressure variables). Perception scales were used to evaluate comfort perception. Results: No significant difference was observed between the two shoes during maneuvers in terms of ground reaction force. However, the plantar pressure of shoe L in the midfoot and lateral foot regions was significantly greater than that of shoe N during side-step cutting and lay-up jumping. Shoe N was significantly superior to shoe L, especially in dynamic scale in terms of the perception of comfort. The plantar pressure and perception characteristics in the two shoes were significantly different but inconsistent with each other. Conclusion: The biomechanical characteristics of the shoes themselves and the perception evaluation of the athletes should be considered in comprehensive shoe-cushioning design and evaluation.
1. Introduction
In basketball, the lower limbs of athletes are subjected to large impact forces during each landing [1]. Players complete 70 jumps/landings in a single game and attenuate impacts of up to nine times their body weight every time [2], which increases the risk of knee and ankle injuries [3]. Reducing impact forces (which includes both magnitude and loading rate characteristics) may help prevent foot injuries [4]. The shock absorption characteristics and comfort of basketball shoes, as core equipment of the sport, have important influences not only on the performance of the players but also on the prevention of lower extremity injuries [5]. The impact force and pressure distribution characteristics between the feet and the shoes must be understood to effectively optimize the technical movements, reduce foot injuries, and improve the design of specialized shoes [6]. However, the existing studies on foot loading have mainly focused on common gait characteristics, such as walking and running [7,8], and studies on specific sports maneuvers, such as cross-over running and lay-up jumping [9,10,11], are limited.
Meanwhile, comfort and stability have been identified as the principal factors of specialized sports shoes [12], in addition to meeting the functional requirements of specific sports and strengthening the foot protection function [13]. However, these factors are easily neglected. The comfort of basketball shoes is closely related to the performance of basketball athletes, as well as to ankle injury and its prevention [2]. The subjective perception scale has been proven to be an effective and credible method for assessing the aforementioned variables [14,15]. Hennig et al. [16] found that a close relationship exists between runners’ subjective perception of shoes’ cushioning performance and their impacts on plantar pressure during running. Meanwhile, foot comfort is also closely related to the impact load on the lower limbs at initial contact [17]. Thus, the functionality and comfort of basketball shoes for typical maneuvers in basketball must be explored through both the subjective perception and foot biomechanical tests [18].
Therefore, the current study aims to determine the effect of different basketball shoes on the ground reaction force (GRF) and plantar pressure characteristics in three typical basketball maneuvers and to further understand foot loading characteristics in basketball and their relationship with comfort through the subjective perception scale evaluation of basketball shoes. It was hypothesized that wearing different shoes would affect comfort perception, and correspondingly change GRF and plantar pressure characteristics during basketball maneuvers.
2. Materials and Methods
2.1. Participants
Twelve healthy male collegiate basketball players (age: 23.1 ± 2.0 years; height: 176.3 ± 4.5 cm; body mass: 70.5 ± 7.5 kg) with an average of 8.4 years of experience in basketball events were recruited for this experiment. An observational cross-sectional research design according to the Strengthening The Reporting of OBservational Studies in Epidemiology (STROBE) criteria [19,20]. The inclusion criteria were: (1) at least five years of experience in basketball events; (2) none has suffered musculoskeletal injuries of the lower extremity over the last six months; (3) none has engaged in strenuous training within 24 h. A two-tailed t-test was executed via the G*Power 3.1 software to determine whether a sample size of 12 was sufficient to minimize the probability of type II errors for all the variables (P = 80% at α = 0.05). All the participants signed an informed consent form, and ethical approval was granted by the Institutional Review Board of Shanghai University of Sports prior to the study (2017007).
2.2. Shoes and Instrumentations
Two types of U.S. size nine basketball shoes were used in this study. One of the shoes was a new sample provided by a local sports science laboratory (hereinafter referred to as shoe L), and the other (Figure 1) was a commercially available type with a popular international brand (hereinafter referred to as shoe N). The following are some details of the property of Shoe N: (1) upper: Black synthetic leather and Phyposite technology—Breathable tongue inner sleeve with a traditional lacing system; (2) midsole: Phylon midsole design that minimizes weight while maximizing cushioning with animpact absorption system; (3) outsole: Non-traditional outsole to reduce weight and optimize traction. Overall, the two types of shoes were similar in the abovementioned materials, design, color, weight (≈530 g), and so on, and only differed in the impact absorption systems of the midsole.
Two 90 cm × 60 cm three-dimensional force plates (9287B, Kistler Corporation, Switzerland) were utilized to collect GRF data, with a sampling rate of 1200 Hz.
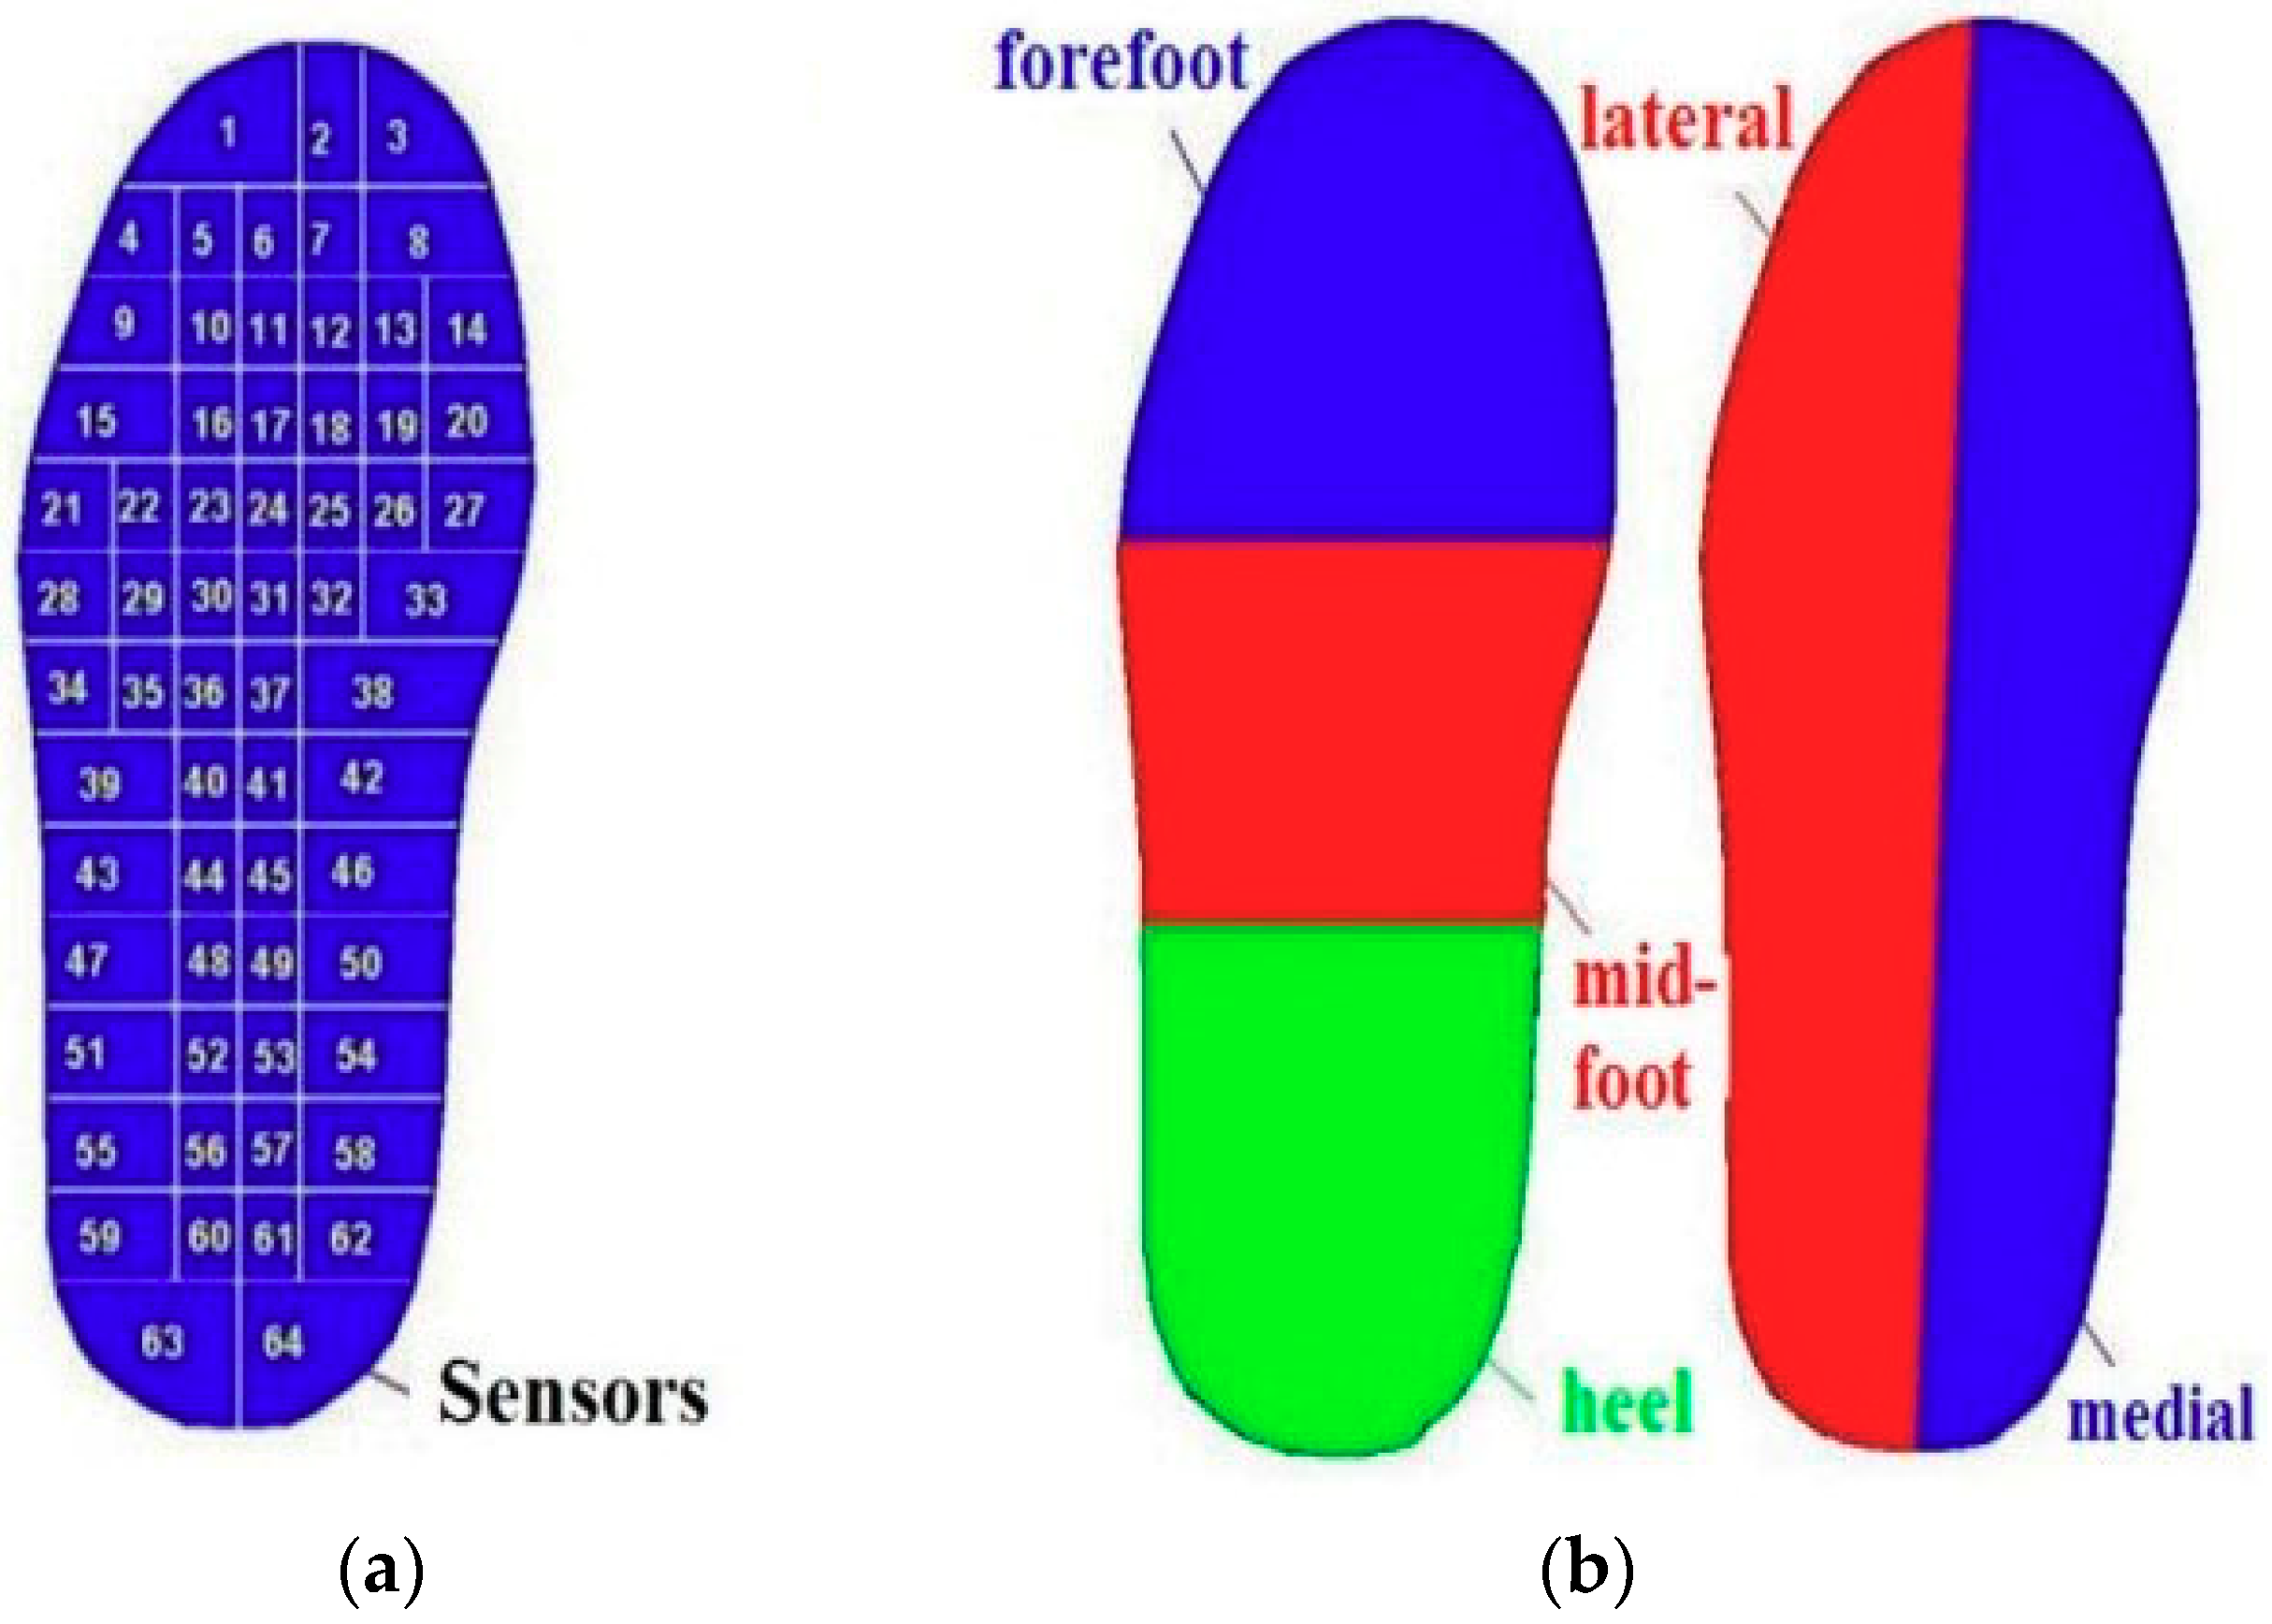
The insole measurement system (Medilogic Corporation, Germany) was used to capture the plantar pressure of different regions. This system has been validated [21]. Each insole was calibrated using the manufacturer’s calibration device (T&T medilogic Medizintechnik GmbH, Schönefeld, Germany) prior to the study. The size of the pressure insole was 8/9 according to the participants’ foot size. The pressure insole consisted of 225 pressure sensors (0.6 cm × 0.4 cm), with a pressure range of 0-64 N/cm2 and a maximum sampling rate of 300 Hz (Figure 2a). The plantar regions were divided into five parts, namely, the forefoot, the midfoot, the heel, the lateral, and the medial (Figure 2b).
2.3. Experimental Protocol
Three typical maneuvers, which are the most frequently used in basketball games according to the video observation and the coach interview, were selected, namely, side-step cutting (SS), 90° L-direction running (90° LR), and lay-up toe-off (LUTO) and touch-down (LUTD). The sports surface used in this study is the most common wooden floor used in basketball games. The participants first set their pace according to their personal movement habits and then tried their best to complete the movements. They were required to achieve the three typical maneuvers (SS, 90° LR, and lay-up) in the two different shoes in random order. Five successful trials were obtained for each condition. The pressure insoles were placed flat in the shoes before the experiment, and data were transmitted to the computer in real-time via a wireless receiver. The participants were required to familiarize themselves with the maneuvers before the formal tests began. The familiarization period for each participant was 10–15 min. To avoid the influence of fatigue on the results, 1–2 min breaks were given between each trial [22].
The perception-comfort scale used in this experiment was adapted from the perception scale provided by a famous shoe research center in the US. The scale includes two parts, namely, general fit and dynamic scale (Figure 3). The indices of the general fit test include the toe-box height, the toe-box width, the ball girth, the waist/instep, the elasticity at the heel, and the shoe length. The index scores range from 1 to 9: 1 means too low (toe-box height), too narrow (toe-box width), too tight (ball girth, waist/instep, heel), or too short (length); 9 means too high, too wide, too loose, or too long; and 5 means just right (Figure 3a). A dynamic scale was used to evaluate the fit of the basketball shoes during the maneuvers, including overall liking, heel cushioning, heel responsiveness, heel stability, heel-to-toe transition, and forefoot cushioning, which were also scored 1–9 points (1 for extremely dislike, 5 for neutral, and 9 for extremely like). In addition to overall liking, the intensity aspects were also rated 1–9: 1 means soft (heel and forefoot cushioning), no response (heel responsiveness), very unstable (heel stability), no smoothness (heel-toe transition), and so on; and 9 means hard, very reactive, very stable, very smooth, and so on (Figure 3b). The experiment process included a 10-minute regular-intensity basketball maneuver practice (including SS, 90° LR, and lay-up). The tongue and logos of the basketball shoes were completely covered before testing to avoid the brand effect and the influence of other factors on the scoring results.
2.4. Data Processing and Analysis
The main variables of the GRF included the following: (1) peak vertical GRF (Fz) and appearance time (tF) and (2) peak loading rate (Gz) and appearance time (tG). Fz and Gz were normalized by bodyweight (BW).
According to Bontrager’s study on the settings of the insole area and the structure of the pressure insoles [20], the peak pressure (normalized by BW) and the peak pressure distribution (contact area) were measured for six plantar areas, namely, the entire sole, the forefoot, the midfoot, the rearfoot, the medial, and the lateral (Figure 2).
The shoe comfort characteristics included (1) general fit: toe-box height, toe-box width, ball girth, waist/instep, heel, and length; and (2) dynamic fit: overall liking, heel cushioning, heel responsiveness, heel stability, heel-to-toe transition, and forefoot cushioning. Liking and intensity were involved in each dynamic fit variable.
2.5. Statistics
All data were normally distributed based on the Shapiro–Wilk test. The paired sample t-test was used to determine the effects of different basketball shoe cushioning on the GRF and the plantar pressure characteristics. The comfort perception variables were determined by the Wilcoxon rank-sum test (SPSS 19.0, SPSS Inc., Chicago, IL, USA). The significance level was set at 0.05.
3. Results
3.1. Vertical GRF
The passive impact phase in SS and 90° LR occurred within 100 ms after ground contact, with the Fz approximately twice that of the BW (Figure 4a). The vertical GRF increased rapidly in LUTO and LUTD during contact, that is, the Fz during the push-off phase and after landing could be as large as four and eight-times the BW, respectively (Figure 4b). However, no significant differences in Fz, Gz, tF, and tG were observed between the two basketball shoes during SS, 90° LR, LUTO, and LUTD (Table 1).
3.2. Maximum Plantar Pressure
Shoe L showed a lower maximum pressure in the entire sole (p < 0.05) and midfoot (p < 0.01) regions during SS (Table 2) compared with shoe N. Although shoe L showed a low plantar pressure in the entire sole and in the forefoot, the heel, the medial, and in the lateral regions, no significant differences were observed between the two shoes during 90° LR.
Notably, shoe L showed a lower maximum pressure in the midfoot and in the lateral regions during LUTO (p < 0.01) and LUTD (p < 0.01) compared with shoe N. Although no statistical differences were observed in plantar pressure on the rest of the regions, the maximum pressure was evidently lower in shoe L than in shoe N.
3.3. Foot Pressure Distribution
In general, the overall pressure distribution in the two shoes was similar but wider in shoe L than in shoe N, and the pressure value of each region was lower in shoe L than in shoe N. Specifically, less fore-lateral pressure distribution was noted in shoe L during SS; a wide heel pressure distribution was observed in shoe L during 90° LR, with pressure concentrated at the first metatarsal head, the first phalanges, and the fifth metatarsal head (Figure 5a); the foot pressure of each region in shoe L was smaller than that in shoe N during LUTO; and a smaller pressure at the first phalanges and a wider heel pressure distribution were noted in shoe N compared with shoe L during LUTD (Figure 5b).
3.4. Comfort Perception
No significant differences were observed in the general fit between shoe L and shoe N (Figure 6).
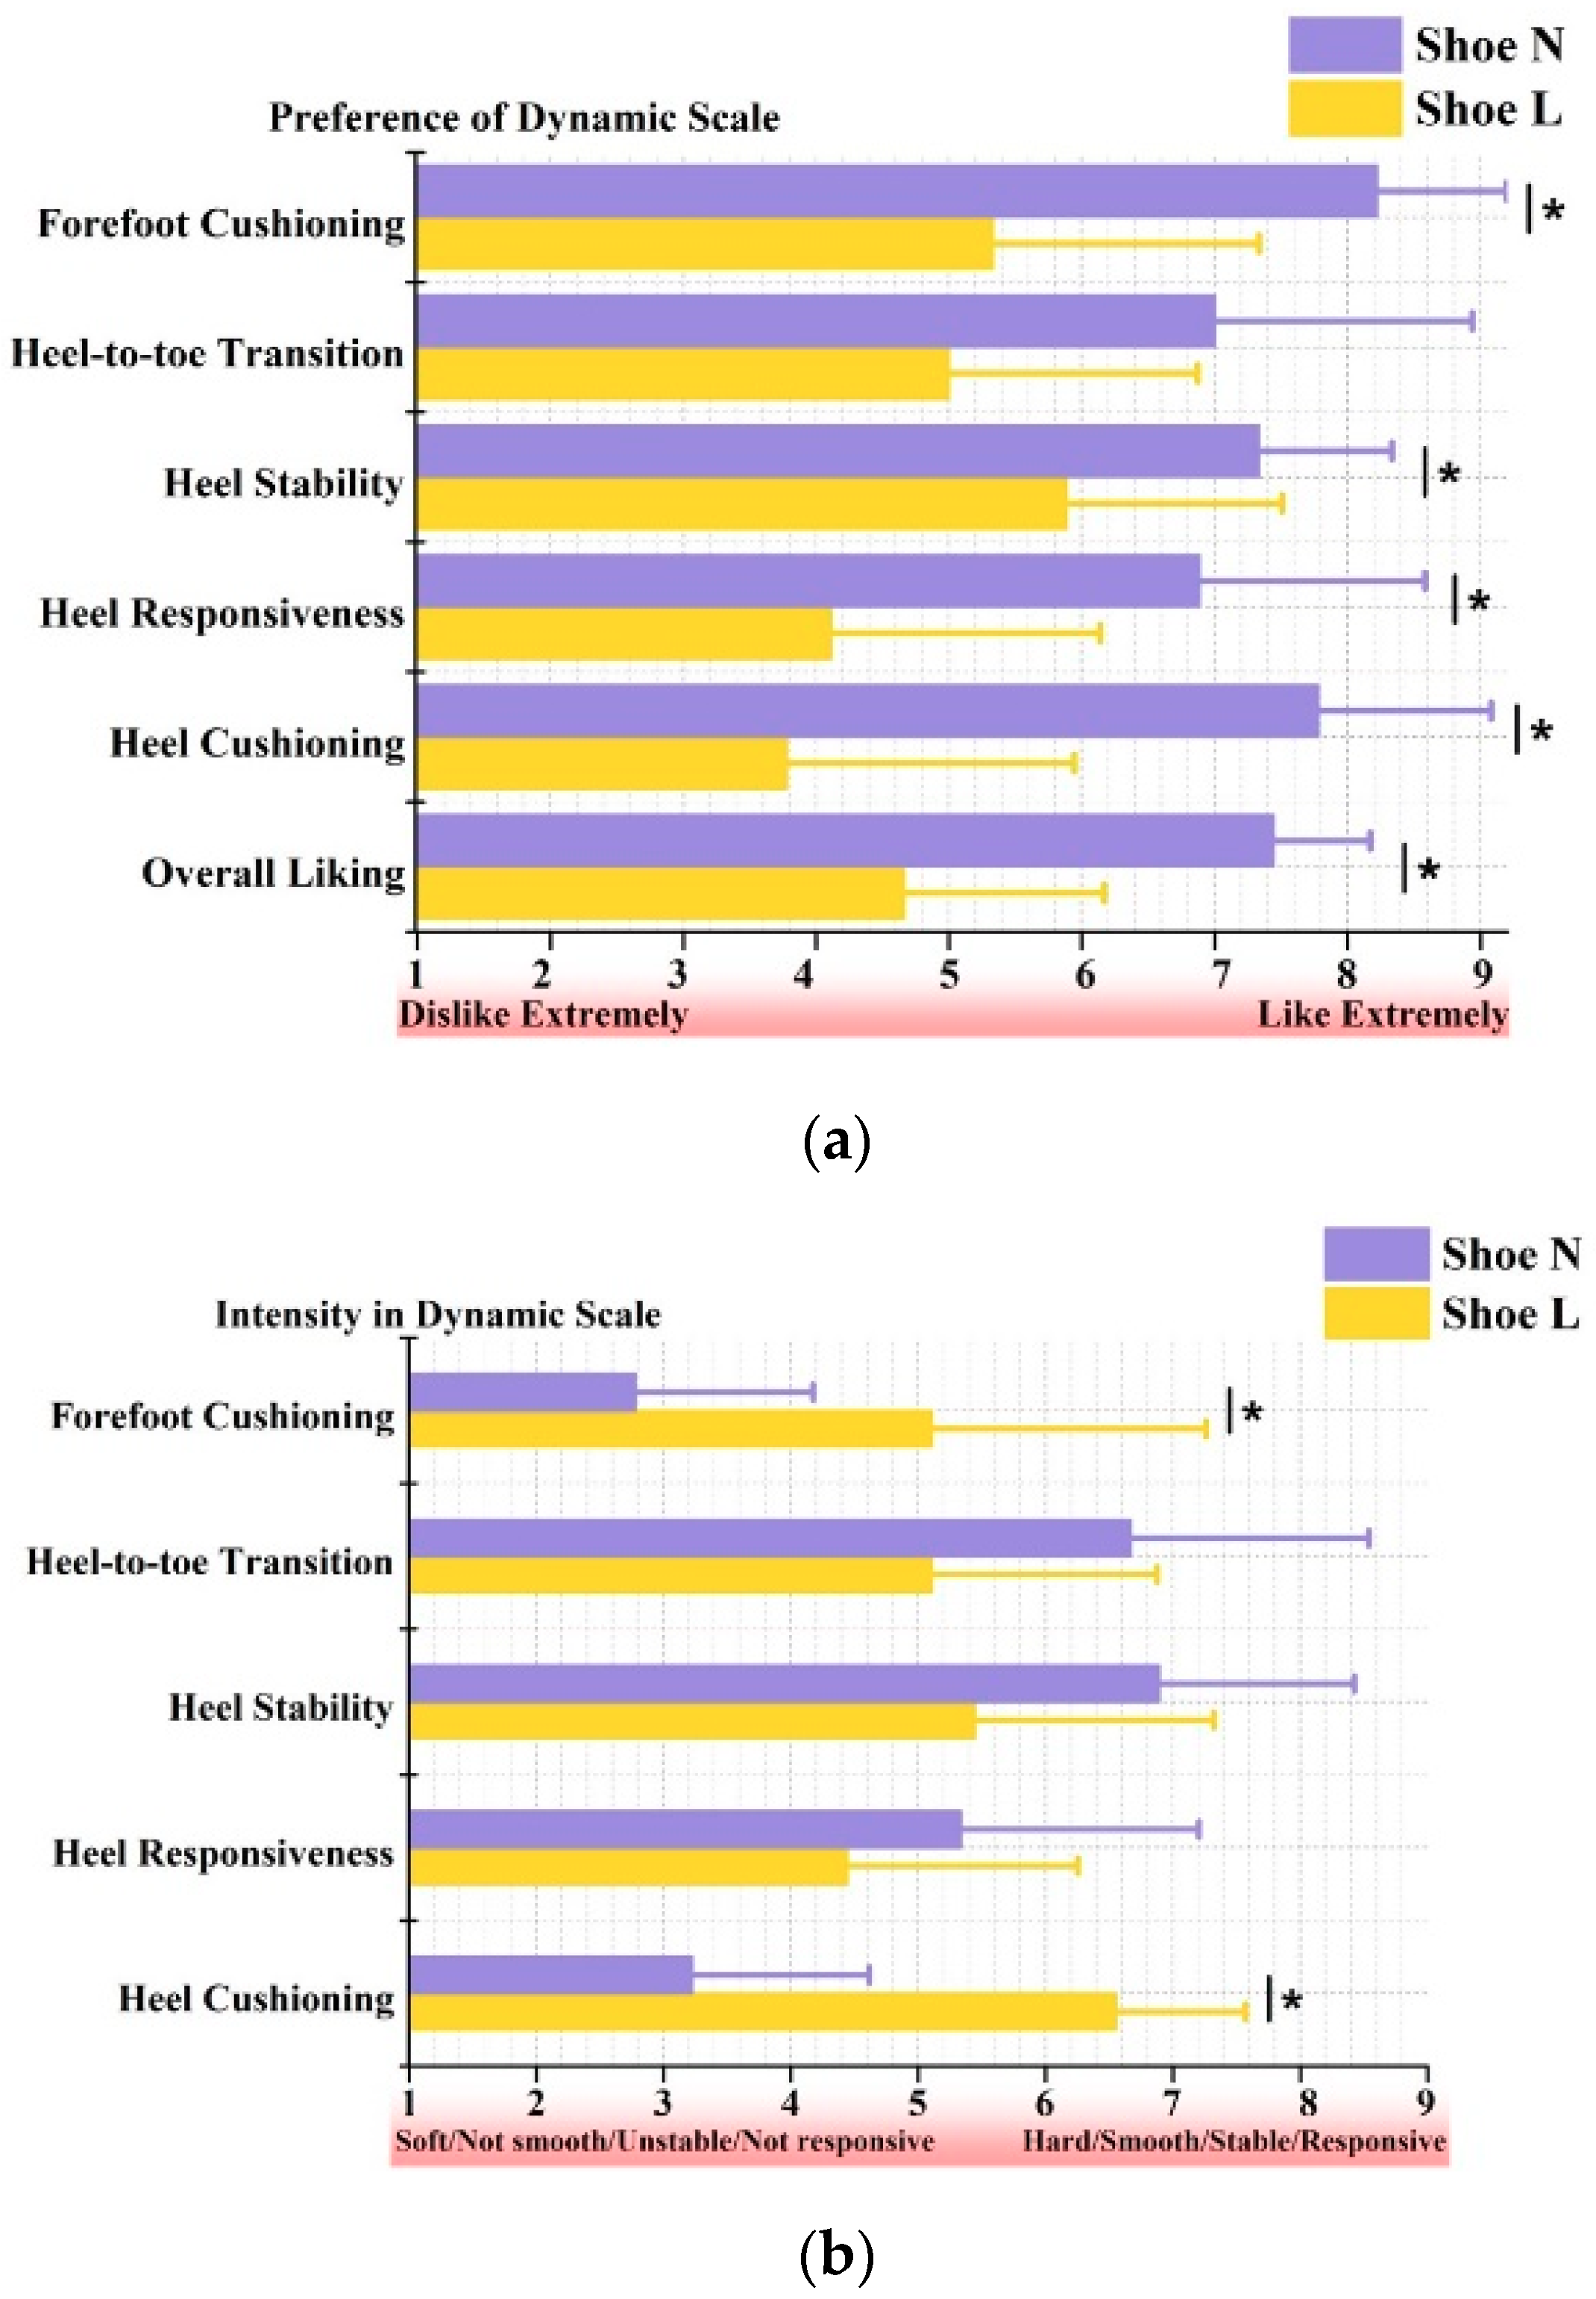
From the dynamic comfort scale perspective, the overall liking of shoe N was significantly higher than that of shoe L (p < 0.01) owing to forefoot and heel cushioning (p < 0.01). The heel responsiveness and stability of shoe N were greater than those of shoe L (p < 0.05), but no significant differences were observed in the heel-to-toe transition between the two shoes (Figure 7). The forefoot and heel cushioning of shoe L were significantly higher than those of shoe N (p < 0.05) (Figure 7) in terms of dynamic intensity. Meanwhile, no significant difference was observed in the heel-to-toe transition, heel response, and heel stability between the two types of shoes.
4. Discussion
This study aimed to investigate the effect of two different shoe cushionings on foot loading (GRF and plantar pressure) and the perception of comfort during three basketball-specific maneuvers (i.e., SS, 90° LR, and LUTO/LUTD). Consistent with our hypothesis, compared to shoe N, shoe L showed a lower maximum pressure in the entire and midfoot regions during SS and a lower maximum pressure in the midfoot and lateral regions during LUTO and LUTD. The overall pressure distribution was wider in shoe L than in shoe N. In terms of the perception of comfort, shoe N was significantly superior to shoe L, especially in the dynamic scale. However, contrary to our hypothesis, no significant differences in Fz, Gz, tF, and tG were noted between the two basketball shoes during SS, 90° LR, LUTO, and LUTD.
4.1. Vertical GRF
In general, two peaks appeared in the vertical GRF on the lower limbs when running or jumping, namely, the impact force (first peak) and the active force (second peak). The impact force is closely related to sports injuries [2,23]. This study analyzed the characteristics of GRF during three kinds of basketball-specific maneuvers, namely, side-step cutting (SS), 90° varied-direction running (90° LR), and lay-up toe-off (LUTO) and lay-up touch-down (LUTD). Notably, the impact forces, which were approximately twice the BW, were identified as passive forces that appeared within 100 ms at the initial contact during SS and 90° LR, and the active forces were regarded as the principal components. However, the results indicated that no significant differences in GRF existed between the two pairs of shoes during SS and 90° LR.
Among the numerous basketball maneuvers, the lay-up is one of the most representative and relatively complex movements that include the acceleration, take-off, and landing phases. The results of the present study showed that the GRF curves during LUTO and LUTD were very similar to the those when running with a heel strike pattern [24,25]. Although the force would not cause impact damage to the lower extremity at take-off, which was nearly four times the BW, the participants were subjected to up to eight times of the BW impact force during landing because of the high jumps performed in this study. The repeated impacts loaded on the lower limbs can easily lead to injuries, especially when high impacts cannot be loaded [26]. Therefore, the results indicated that the high impacts during LUTD caused overuse injuries. However, we found no significant differences in Fz, Gz, tF, and tG regardless of shoe conditions. This finding suggests that though the two midsole materials were different, the impacts of the active movements on the lower extremities made a small difference.
4.2. Plantar Pressure Characteristics
We found that shoe L exhibited a significantly lower maximum pressure on the entire sole and on the midfoot regions compared with shoe N. Although shoe L showed a lower plantar pressure on the entire sole and on the forefoot, the heel, the medial, and the lateral regions, no significant differences were noted between the two shoes during 90° LR. In addition, shoe L showed a lower maximum pressure on the midfoot and lateral regions during LUTO and LUTD compared with shoe N. Although no statistical differences were observed in the rest of the plantar pressure regions, the maximum pressure was lower in shoe L than in shoe N.
The overall plantar pressure distribution in the two shoes was similar but wider in shoe L than in shoe N, and the pressure value of each region was lower in shoe L than in shoe N. Specifically, the fore-lateral pressure distribution of shoe L during SS was low; the heel pressure distribution of shoe L during 90° LR was wide, with the pressure was concentrated at the first metatarsal head, the first phalanges, and the fifth metatarsal head; the foot pressure of each region of shoe L was smaller than that of shoe N during LUTO; the pressure was smaller at the first phalanges; and the heel pressure distribution was wider for shoe N than those for shoe L during LUTD. At present, plantar pressure distribution has been measured for efficiency in studies on the characteristics and biomechanical mechanism of plantar pressure in various sports. These studies have provided key technologies for sports shoes of different events, especially in terms of individualized design and manufacturing. The material of the sole and its structure for energy absorption and release are important factors in attenuating impacts and protecting the lower extremity from injury [27].
A significant difference was noted in the present study on the plantar pressure of the two shoes during the different maneuvers. However, no significant differences were observed in the GRF or loading rates, which suggests that the mechanical relationship between the foot and the ground became an indirect one owing to the intervention of shoe conditions. This change was mainly due to the special medium of the midsole. A special patented cushioning material was used in the midsole of shoe L. The materials and structures of the midsoles differed in the two shoes, thereby resulting in significant differences in plantar pressure during the three maneuvers despite the similar GRF. This finding suggests that the mechanical performance of shoes and feet and the relationship between feet and shoes caused by different midsole materials should be considered when exploring the function of sports shoes [28]. These factors should then be combined with plantar pressure to create a comprehensive design and to improve sports shoes effectively.
4.3. Comfort Perception
In addition to meeting the functional requirements of specific sporting events and strengthening foot protection, the most important element in specialized sport’s shoes is comfort [12,29]. At present, subjective scoring is still the most frequently applied method for internationally applicable comfort testing; however, the scales and questionnaires used in each study differ. The perception test which was used in this experiment mainly includes two parts, namely, the general fit and the dynamic scale, which have been proven reliable.
For the general fit, the two shoes provided comfort with no significant differences. However, shoe N outperformed shoe L significantly on each index for liking in the dynamic scale, especially in heel stability, heel response, heel cushioning, forefoot cushioning, and overall impression. Moreover, shoe N had above five scores in all the indices. The other feedback from the participants regarding shoe L included poor appearance, dehumanized overall design, thick sponge behind the shoes, and lack of details. In terms of dynamic comfort intensity, shoe L was insufficiently stable at the heel, while shoe N was not only stable but also responsive. Although the cushioning of shoe N was softer at the forefoot, the forefoot and heel cushioning of shoe L were better than those of shoe N, based on the participants’ feedback. This finding is probably due to the fact that shoe N was too soft to provide sufficient cushioning. The general fit in the perceptual test was preferred for assessing the appropriateness of the shoes, while the dynamic scale was preferred for evaluating the perceptual likings and performance of the two shoes from a functional aspect. The deficiency of shoe L was mainly due to its lack of ergonomic design for fit or may be related to the materials and structural design.
Notably, the results of plantar pressure were inconsistent with the perceptual comfort of shoe L and shoe N in the above-mentioned plantar pressure and perceptual comfort scale tests [30]. Although shoe L has a lower plantar pressure on the forefoot, it is not as comfortable as shoe N. The results of plantar pressure indicated the advantage of the forefoot cushioning performance of shoe L. However, the midsole structure of shoe L should be improved to avoid excessive force concentration under intense impact from the pressure distribution. Che et al. [31] found that the plantar pressure index affects comfort assessment. Similarly, the midsole material and structure could affect individual comfort assessment [32]. Therefore, we assumed that the plantar pressure distribution was related to perceptual comfort to some extent because the human being, as an active organism, self-evaluates the perceptual information of sneakers [33]. Differences were observed in the midsole cushioning performance obtained by the mechanical/biomechanical test or the perception of comfort, which could directly affect people’s choice of sports shoes. Ignoring these differences would inevitably affect the evaluation of sports shoes in terms of function. However, relevant studies on the reasons for these differences are limited. Therefore, further studies are required.
4.4. Limitations
In the present study, it is noteworthy that marker trajectories and surface electromyographic data were not collected to simplify the design by focusing on the foot loading and mimicking basketball maneuvers by limiting the experimental devices that were attached to the participants. However, future studies including electromyography results with different sports shoes in basketball players should be carried out in order to determine muscle activity [19,20,34]. Besides, it is considered that different trajectories performed by players could influence the trial times, as well as the impact on shoes [35].
5. Conclusions
No differences were observed in the impact forces and the average maximum plantar pressure between the two shoes during the three basketball-specific maneuvers. However, compared to shoe N, the plantar pressure range of shoe L was wider and showed a lower pressure at the midfoot and the lateral foot. Moreover, the comfort perception results indicated that though the general fit of the two shoes was equal, shoe L provided less overall comfort, forefoot flexibility, heel cushioning, heel stability, and heel response. Interestingly, the plantar pressure results were inconsistent with the perceptual comfort of the two shoes, which suggests that the biomechanical characteristics of the shoes themselves and the perception evaluation of the athletes should be considered in comprehensive shoe cushioning design and evaluation.
Author Contributions
X.Z., Z.L. and X.W. contributed equally. Conceptualization, W.F.; methodology, X.Z., Z.L. and X.W.; formal analysis, X.Z., Z.L., Y.Y., J.N. and X.W.; investigation, X.Z., Z.L., X.W., Y.Y., J.N. and W.F.; resources, W.F.; data curation, X.Z.; writing—original draft preparation, X.Z., Z.L., X.W. and J.N.; writing—review and editing, W.F.; project administration, W.F.; funding acquisition, W.F.
Funding
This work was supported by the National Natural Science Foundation of China (11772201, 11572202), the Talent Development Fund of Shanghai Municipal, China (2018107), the National Key Technology Research and Development Program of the Ministry of Science and Technology of China and the “Dawn” Program of Shanghai Education Commission, China.
Conflicts of Interest
The authors declare no conflict of interest.
References
- Randers, M.B.; Hagman, M.; Brix, J.; Christensen, J.F.; Pedersen, M.T.; Nielsen, J.J.; Krustrup, P. Effects of 3 months of full-court and half-court street basketball training on health profile in untrained men. J. Sport Health Sci. 2018, 7, 132–138. [Google Scholar] [CrossRef] [PubMed]
- Nin, D.Z.; Lam, W.K.; Kong, P.W. Effect of body mass and midsole hardness on kinetic and perceptual variables during basketball landing manoeuvres. J. Sport. Health Sci. 2016, 34, 756–765. [Google Scholar] [CrossRef] [PubMed]
- Meeuwisse, W.H.; Sellmer, R.; Hagel, B.E. Rates and risks of injury during intercollegiate basketball. Am. J. Sports Med. 2003, 31, 379–385. [Google Scholar] [CrossRef] [PubMed]
- Irmischer, B.S.; Harris, C.; Pfeiffer, R.P.; DeBeliso, M.A.; Adams, K.J.; Shea, K.G. Effects of a knee ligament injury prevention exercise program on impact forces in women. J. Strength Cond. Res. 2004, 18, 703–707. [Google Scholar] [PubMed]
- Chiu, H.T.; Shiang, T.Y. Effects of insoles and additional shock absorption foam on the cushioning properties of sport shoes. J. Appl. Biomech. 2007, 23, 119–127. [Google Scholar] [CrossRef] [PubMed]
- Morlock, M.; Nigg, B.M. Theoretical considerations and practical results on the influence of the representation of the foot for the estimation of internal forces with models. Clin. Biomech. 1991, 6, 3–13. [Google Scholar] [CrossRef]
- Blackmore, T.; Ball, N.; Scurr, J. The effect of socks on vertical and anteroposterior ground reaction forces in walking and running. Foot 2011, 21, 1–5. [Google Scholar] [CrossRef]
- Nilsson, J.; Thorstensson, A. Ground reaction forces at different speeds of human walking and running. Acta Physiol. 2010, 136, 217–227. [Google Scholar] [CrossRef]
- Lam, W.K.; Qu, Y.; Yang, F.; Cheung, R.T.H. Do rotational shear-cushioning shoes influence horizontal ground reaction forces and perceived comfort during basketball cutting maneuvers? PeerJ 2017, 5, 1–13. [Google Scholar] [CrossRef]
- Wei, Q.; Wang, Z.; Woo, J.; Liebenberg, J.; Park, S.K.; Ryu, J.; Lam, W.K. Kinetics and perception of basketball landing in various heights and footwear cushioning. PLoS ONE 2018, 13, e0201758. [Google Scholar] [CrossRef]
- Lam, W.K.; Ng, W.X.; Kong, P.W. Influence of shoe midsole hardness on plantar pressure distribution in four basketball-related movements. Res. Sports Med. 2017, 25, 37–47. [Google Scholar] [CrossRef] [PubMed]
- Nigg, B.M.; Bahlsen, H.A.; Luethi, S.M.; Stokes, S. The influence of running velocity and midsole hardness on external impact forces in heel-toe running. J. Biomech. 1987, 20, 951–959. [Google Scholar] [CrossRef]
- Brizuela, G.; Llana, S.; Ferrandis, R.; Garcia-Belenguer, A.C. The influence of basketball shoes with increased ankle support on shock attenuation and performance in running and jumping. J. Sports Sci. 1997, 15, 505–515. [Google Scholar] [CrossRef] [PubMed]
- Jordan, C.; Payton, C.; Bartlett, R. Perceived comfort and pressure distribution in casual footwear. Clin. Biomech. 1997, 12, 215–220. [Google Scholar] [CrossRef]
- Robbins, S.; Waked, E.; Krouglicof, N. Improving balance. J. Am. Geriatr. Soc. 1998, 46, 1363–1370. [Google Scholar] [CrossRef] [PubMed]
- Hennig, E.M.; Valiant, G.A.; Qi, L. Biomechanical Variables and the Perception of Cushioning for Running in Various Types of Footwear. J. Appl. Biomech. 1996, 12, 143–150. [Google Scholar] [CrossRef]
- Dinato, R.C.; Ribeiro, A.P.; Butugan, M.K.; Pereira, I.L.R.; Onodera, A.N.; Sacco, I.C.N. Biomechanical variables and perception of comfort in running shoes with different cushioning technologies. J. Sci. Med. Sport 2015, 18, 93–97. [Google Scholar] [CrossRef] [PubMed]
- Lam, W.K.; Sterzing, T.; Cheung, J.T.M. Reliability of a basketball specific testing protocol for footwear fit and comfort perception. Footwear Sci. 2011, 3, 151–158. [Google Scholar] [CrossRef]
- Roca-Dols, A.; Elena Losa-Iglesias, M.; Sanchez-Gomez, R.; Becerro-de-Bengoa-Vallejo, R.; Lopez-Lopez, D.; Palomo-Lopez, P.; Rodriguez-Sanz, D.; Calvo-Lobo, C. Electromyography activity of triceps surae and tibialis anterior muscles related to various sports shoes. J. Mech. Behav. Biomed. Mater. 2018, 86, 158–171. [Google Scholar] [CrossRef]
- Roca-Dols, A.; Losa-Iglesias, M.E.; Sanchez-Gomez, R.; Becerro-de-Bengoa-Vallejo, R.; Lopez-Lopez, D.; Rodriguez-Sanz, D.; Martinez-Jimenez, E.M.; Calvo-Lobo, C. Effect of the cushioning running shoes in ground contact time of phases of gait. J. Mech. Behav. Biomed. Mater. 2018, 88, 196–200. [Google Scholar] [CrossRef]
- Price, C.; Parker, D.; Nester, C. Validity and repeatability of three in-shoe pressure measurement systems. Gait Posture 2016, 46, 69–74. [Google Scholar] [CrossRef] [PubMed] [Green Version]
- Nigg, B.M.; Anton, M. Energy aspects for elastic and viscous shoe soles and playing surfaces. Med. Sci. Sports Exerc. 1995, 27, 92–97. [Google Scholar] [CrossRef] [PubMed]
- Patrek, M.F.; Kernozek, T.W.; Willson, J.D.; Wright, G.A.; Doberstein, S.T. Hip-abductor fatigue and single-leg landing mechanics in women athletes. J. Athl. Train. 2011, 46, 31–42. [Google Scholar] [CrossRef] [PubMed]
- Thompson, M.A.; Lee, S.S.; Seegmiller, J.; Mcgowan, C.P. Kinematic and kinetic comparison of barefoot and shod running in mid/forefoot and rearfoot strike runners. Gait Posture 2015, 41, 957–959. [Google Scholar] [CrossRef] [PubMed]
- Lieberman, D.E.; Venkadesan, M.; Werbel, W.A.; Daoud, A.I.; D’Andrea, S.; Davis, I.S.; Mang’eni, R.O.; Pitsiladis, Y. Foot strike patterns and collision forces in habitually barefoot versus shod runners. Nature 2010, 463, 531–535. [Google Scholar] [CrossRef] [PubMed]
- Yu, L.; Fu, W.; Wei, S. Effects of basketball shoe on impact force and quadriceps vibrations during active and passive landings. Footwear Sci. 2011, 3, 96–98. [Google Scholar]
- Zhang, S.; Clowers, K.; Kohstall, C.; Yu, Y.J. Effects of various midsole densities of basketball shoes on impact attenuation during landing activities. J. Appl. Biomech. 2005, 21, 3–17. [Google Scholar] [CrossRef]
- Kong, P.W.; Lam, W.K.; Ng, W.X.; Aziz, L.; Leong, H.F. In-shoe plantar pressure profiles in amateur basketball players implications for footwear recommendations and orthosis use. J. Am. Podiatr. Med. Assoc. 2018, 108, 215–224. [Google Scholar] [CrossRef]
- Nigg, B.M.; Nurse, M.A.; Stefanyshyn, D.J. Shoe inserts and orthotics for sport and physical activities. Med. Sci. Sports Exerc. 1999, 31, 421–428. [Google Scholar] [CrossRef]
- Leong, H.F.; Lam, W.K.; Ng, W.X.; Kong, P.W. Center of Pressure and Perceived Stability in Basketball Shoes with Soft and Hard Midsoles. J. Appl. Biomech. 2018, 34, 284–290. [Google Scholar] [CrossRef]
- Che, H.; Nigg, B.M.; de Koning, J. Relationship between plantar pressure distribution under the foot and insole comfort. Clin. Biomech. 1994, 9, 335–341. [Google Scholar] [CrossRef]
- Park, S.K.; Lam, W.K.; Yoon, S.; Lee, K.K.; Ryu, J. Effects of forefoot bending stiffness of badminton shoes on agility, comfort perception and lower leg kinematics during typical badminton movements. Sports Biomech. 2017, 16, 374–386. [Google Scholar] [CrossRef]
- Scanlan, A.T.; Fox, J.L.; Borges, N.R.; Tucker, P.S.; Dalbo, V.J. Temporal changes in physiological and performance responses across game-specific simulated basketball activity. J. Sport Health Sci. 2018, 7, 176–182. [Google Scholar] [CrossRef]
- Condello, G.; Schultz, K.; Tessitore, A. Assessment of sprint and change-of-direction performance in college football players. Int. J. Sports Physiol. Perform. 2013, 8, 211–212. [Google Scholar] [CrossRef]
- Roca-Dols, A.; Losa-Iglesias, M.E.; Sanchez-Gomez, R.; Lopez-Lopez, D.; Becerro-de-Bengoa-Vallejo, R.; Calvo-Lobo, C. Electromyography comparison of the effects of various footwear in the activity patterns of the peroneus longus and brevis muscles. J. Mech. Behav. Biomed. Mater. 2018, 82, 126–132. [Google Scholar] [CrossRef]
Figure 1.
Basketball shoes (shoe N) from a famous international manufacturer.
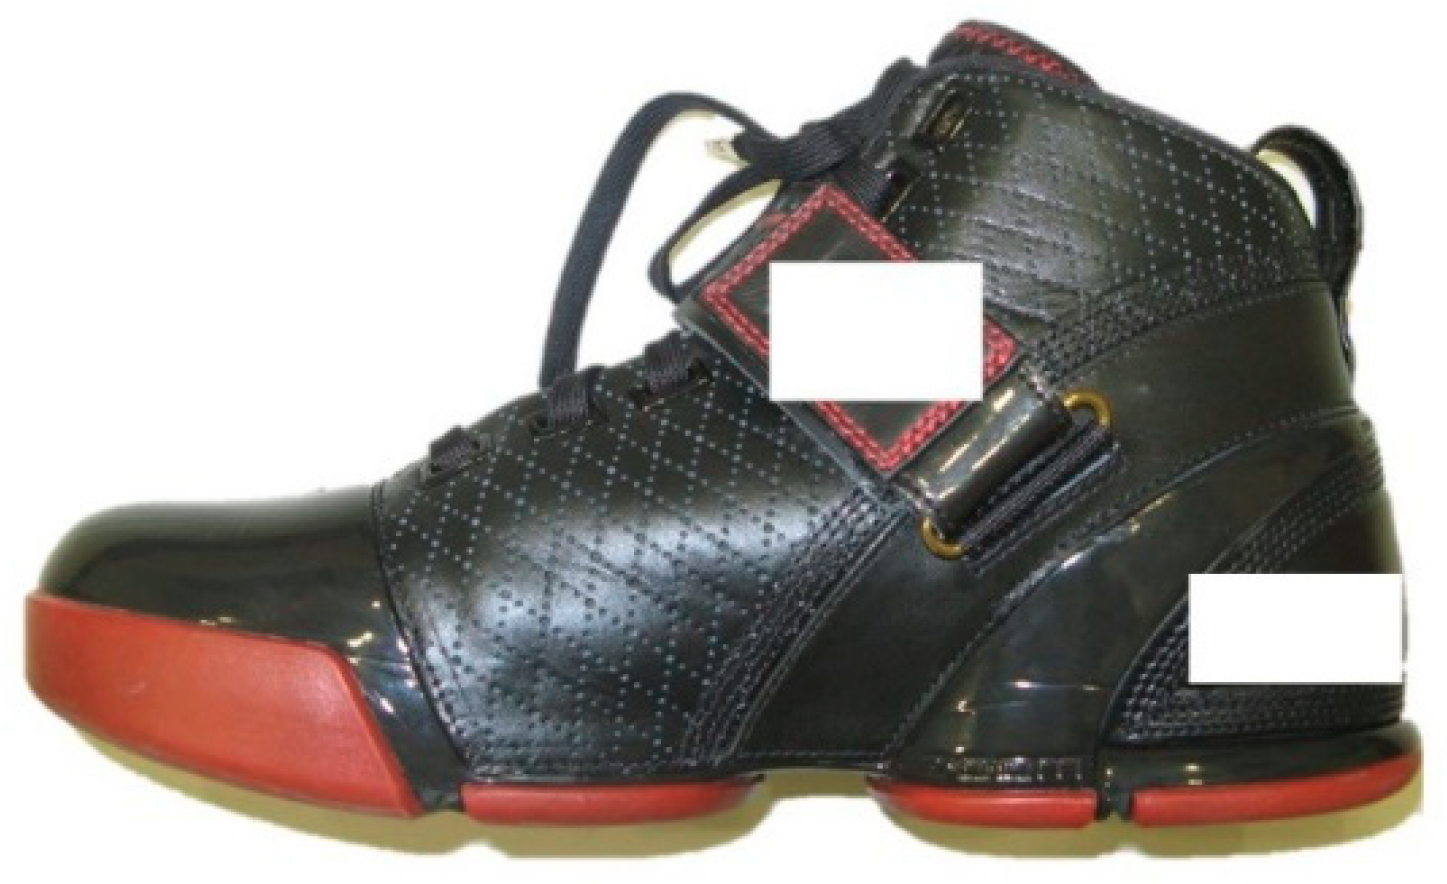
Figure 2.
(a) Composition of insole pressure sensors with a pressure range of 0–64 N/cm2; (b) region division of plantar pressure, including the forefoot, the midfoot, the heel, the lateral, and the medial parts.
Figure 2.
(a) Composition of insole pressure sensors with a pressure range of 0–64 N/cm2; (b) region division of plantar pressure, including the forefoot, the midfoot, the heel, the lateral, and the medial parts.

Figure 3.
(a) General fit scale includes the toe-box height, the toe-box width, the ball girth, the waist/instep, the elasticity at the heel, and the shoe length. The index scores range from 1 to 9 points; (b) dynamic scale includes overall liking, heel cushioning, heel responsiveness, heel stability, heel-to-toe transition, and forefoot cushioning, which were scored 1–9 points.
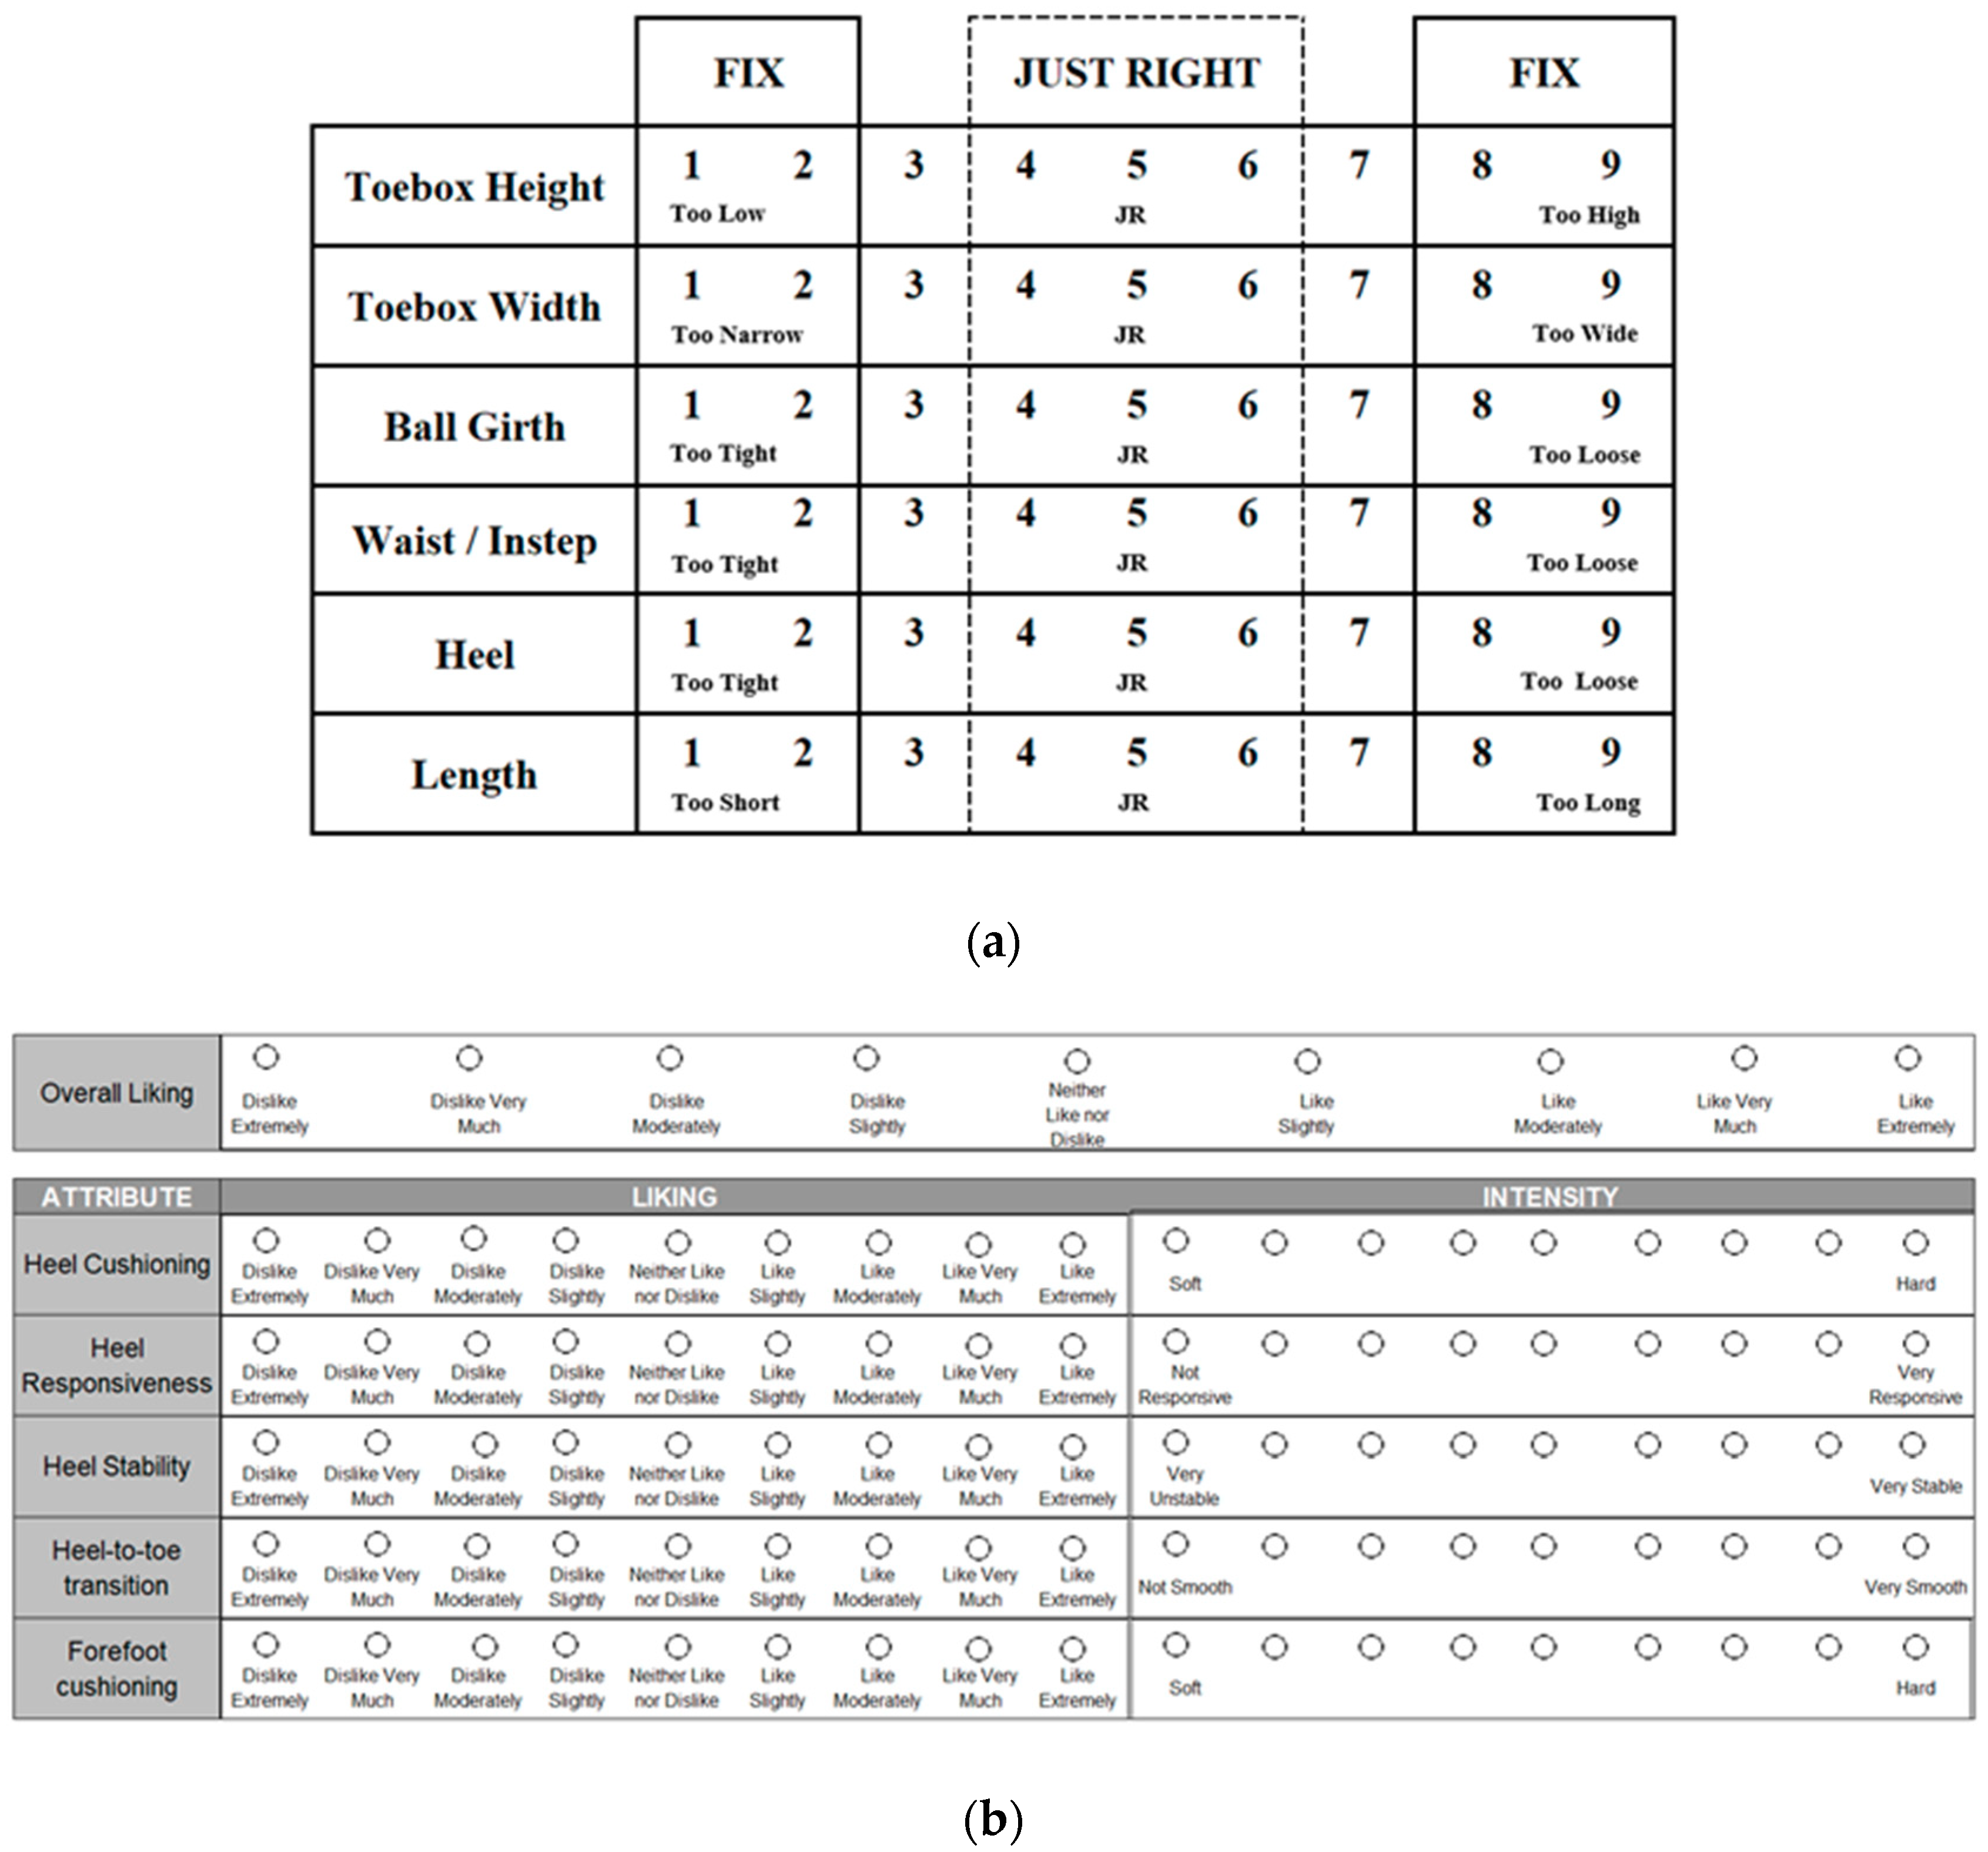
Figure 4.
(a) Vertical ground reaction force-time curves during side-step cutting (SS) and 90° L-direction running (90° LR) maneuvers; (b) vertical ground reaction force-time curves during lay-up toe-off (LUTO) and lay-up touch-down (LUTD) maneuvers. Notes: GRF is ground reaction force, Fz is peak vertical GRF, and BW is bodyweight.
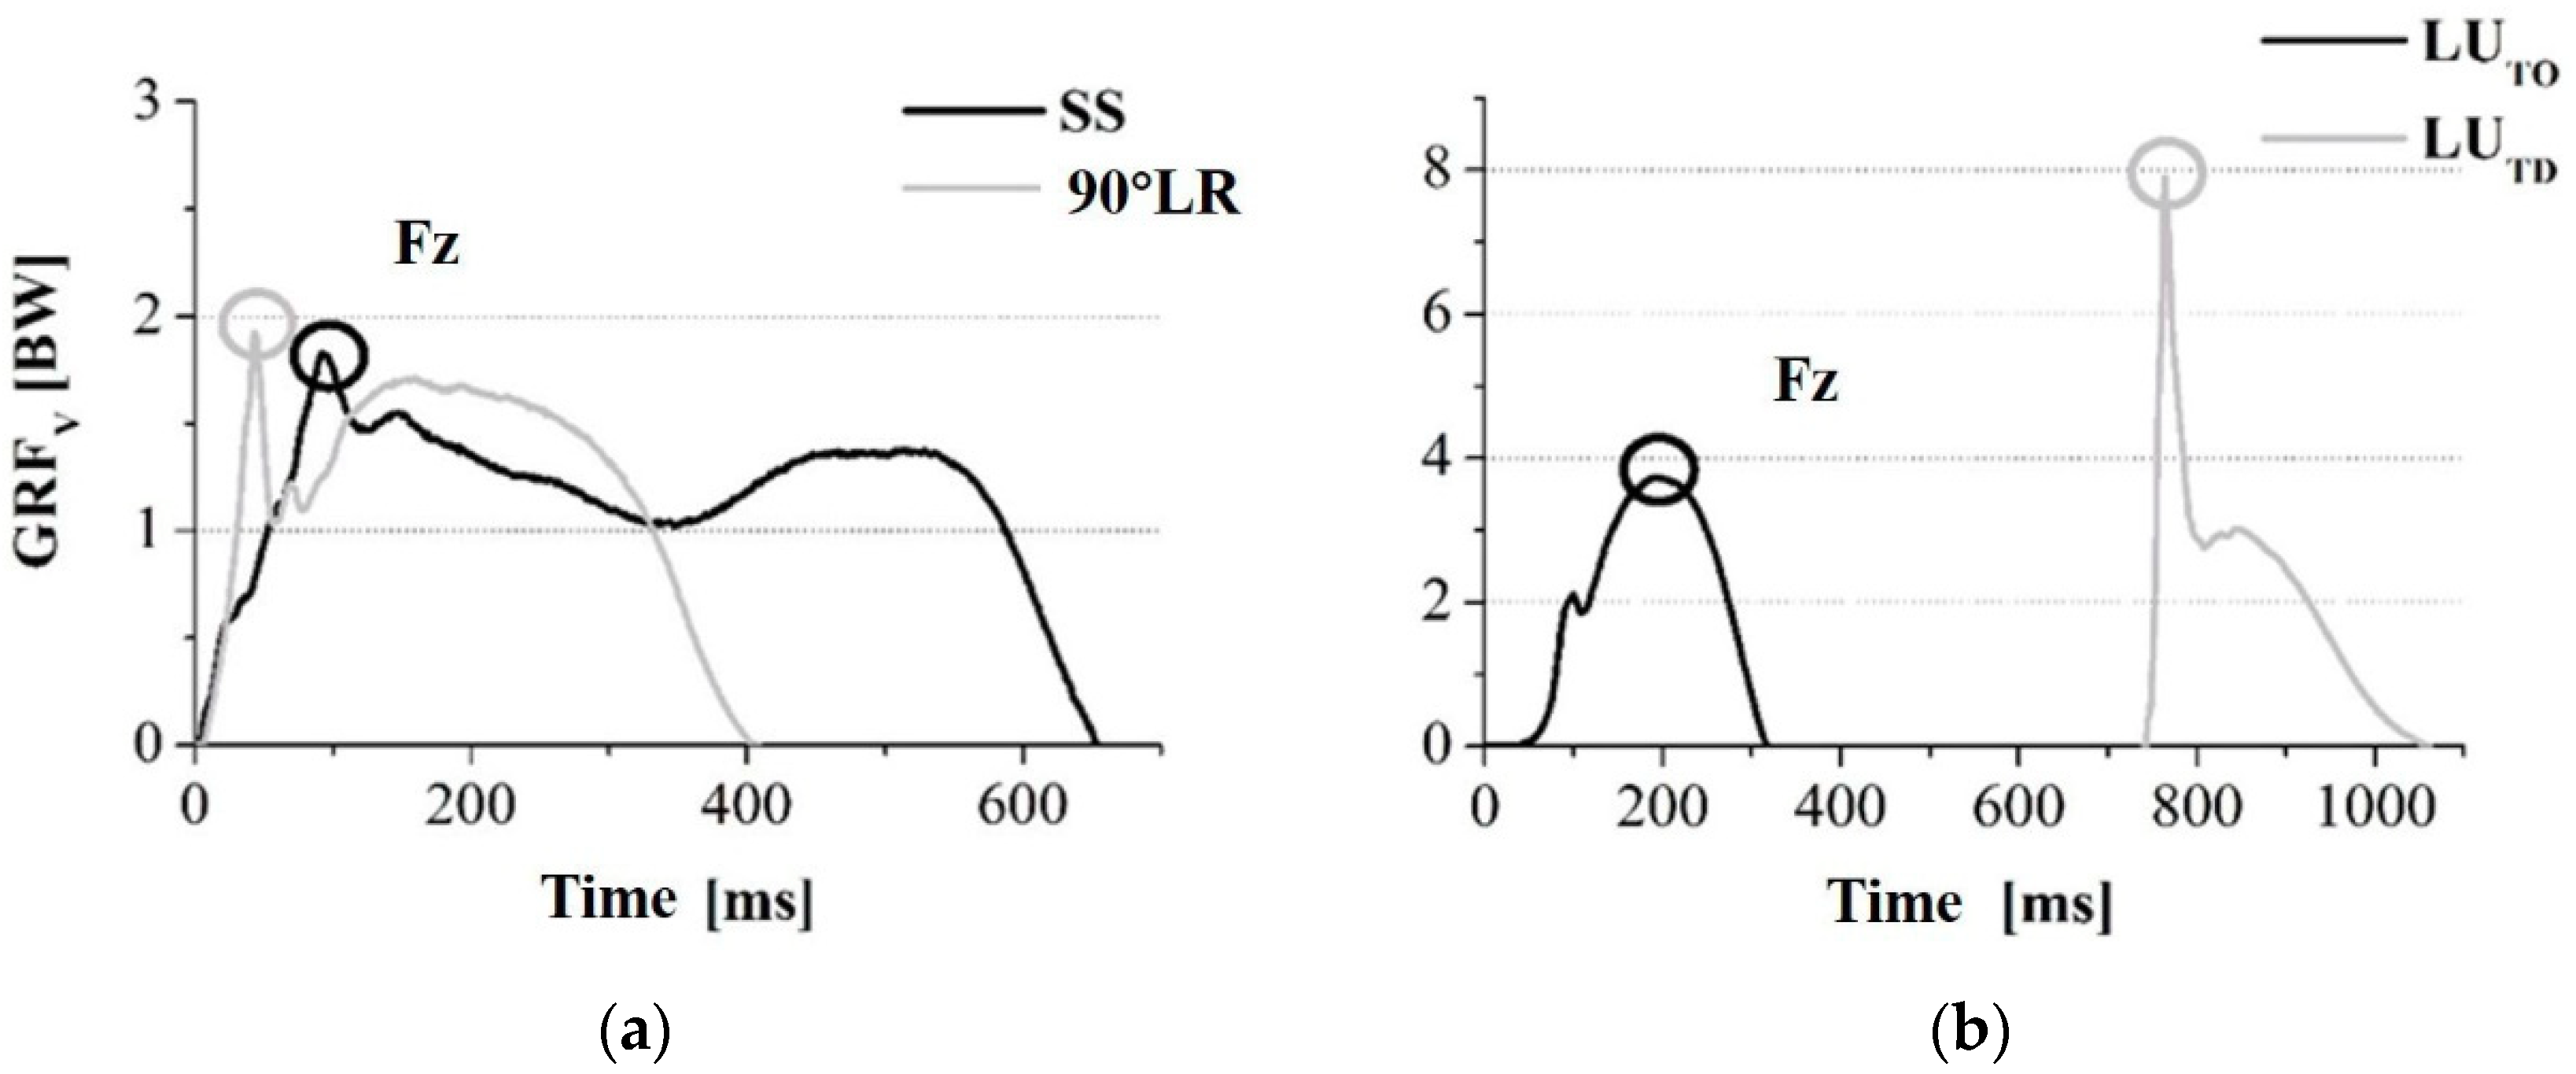
Figure 5.
(a) Effect of different basketball shoes (L vs. N) on plantar pressure distribution during side-step cutting (SS) and 90° L-direction running (90° LR) maneuvers; (b) effect of different basketball shoes (L vs. N) on plantar pressure distribution during lay-up toe-off (LUTO), and lay-up touch-down (LUTD) maneuvers. Different colors represented different pressure values. The pressure values from small to large were blue, green, yellow and red.
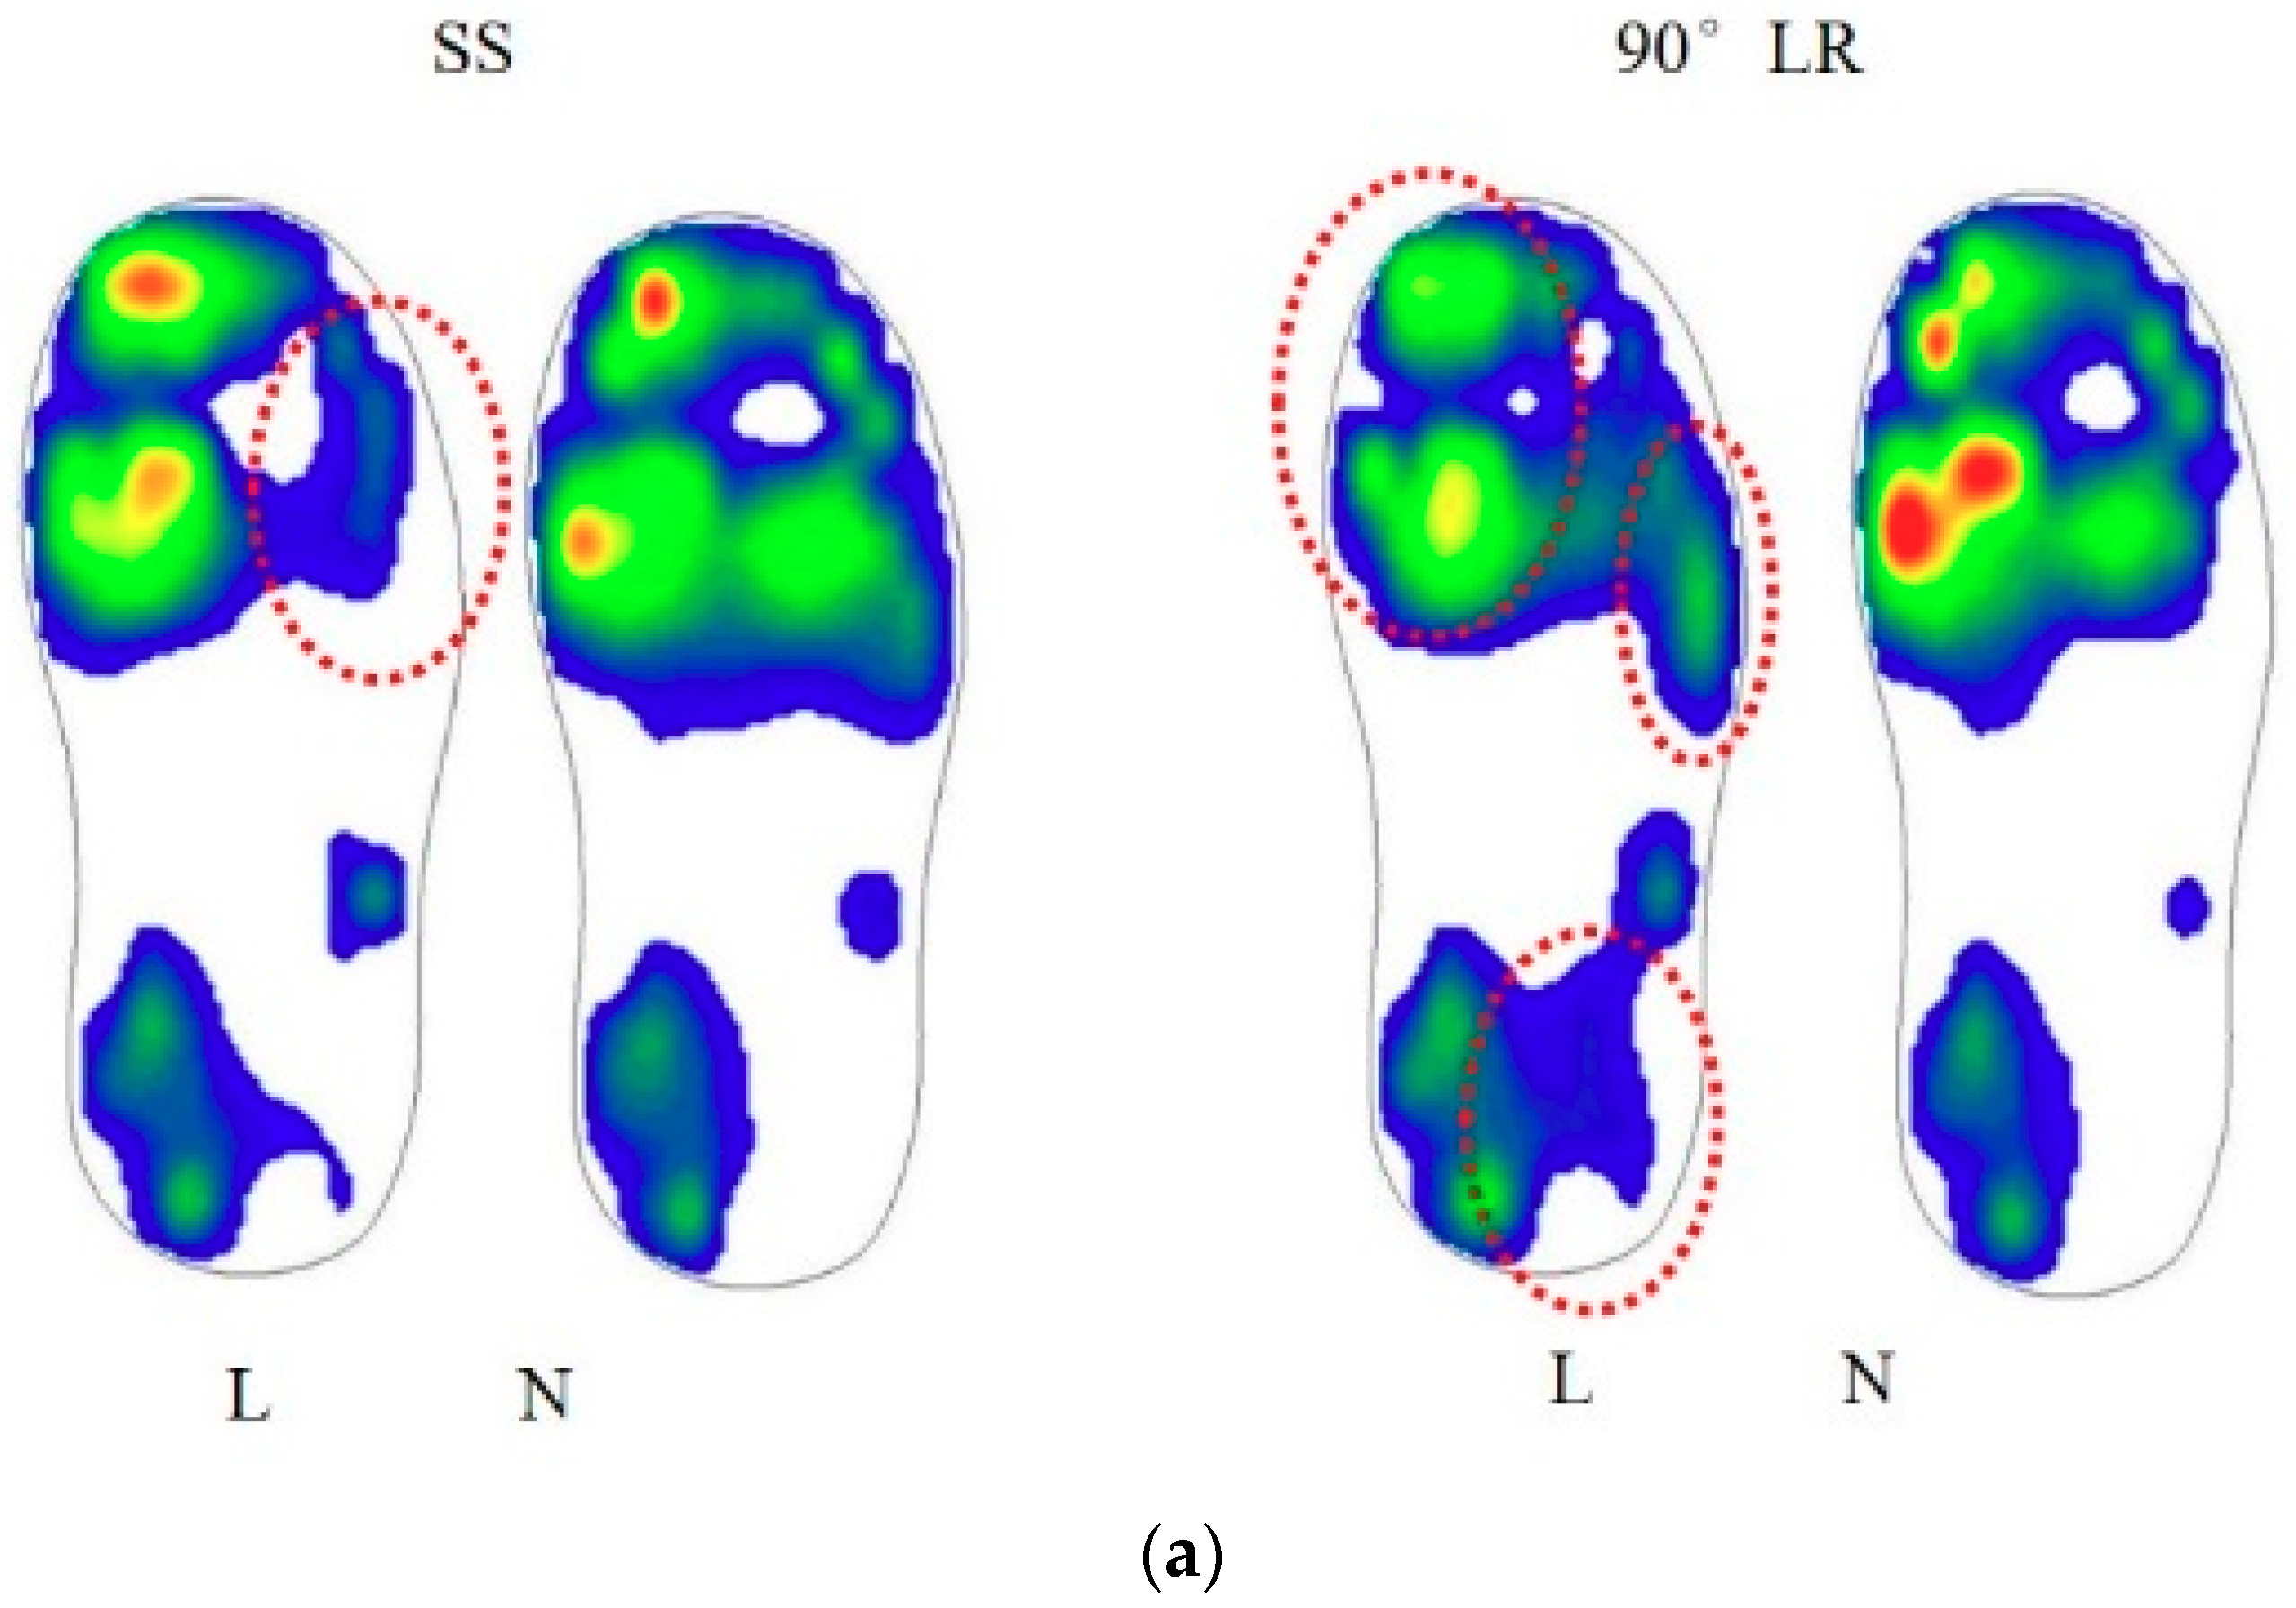
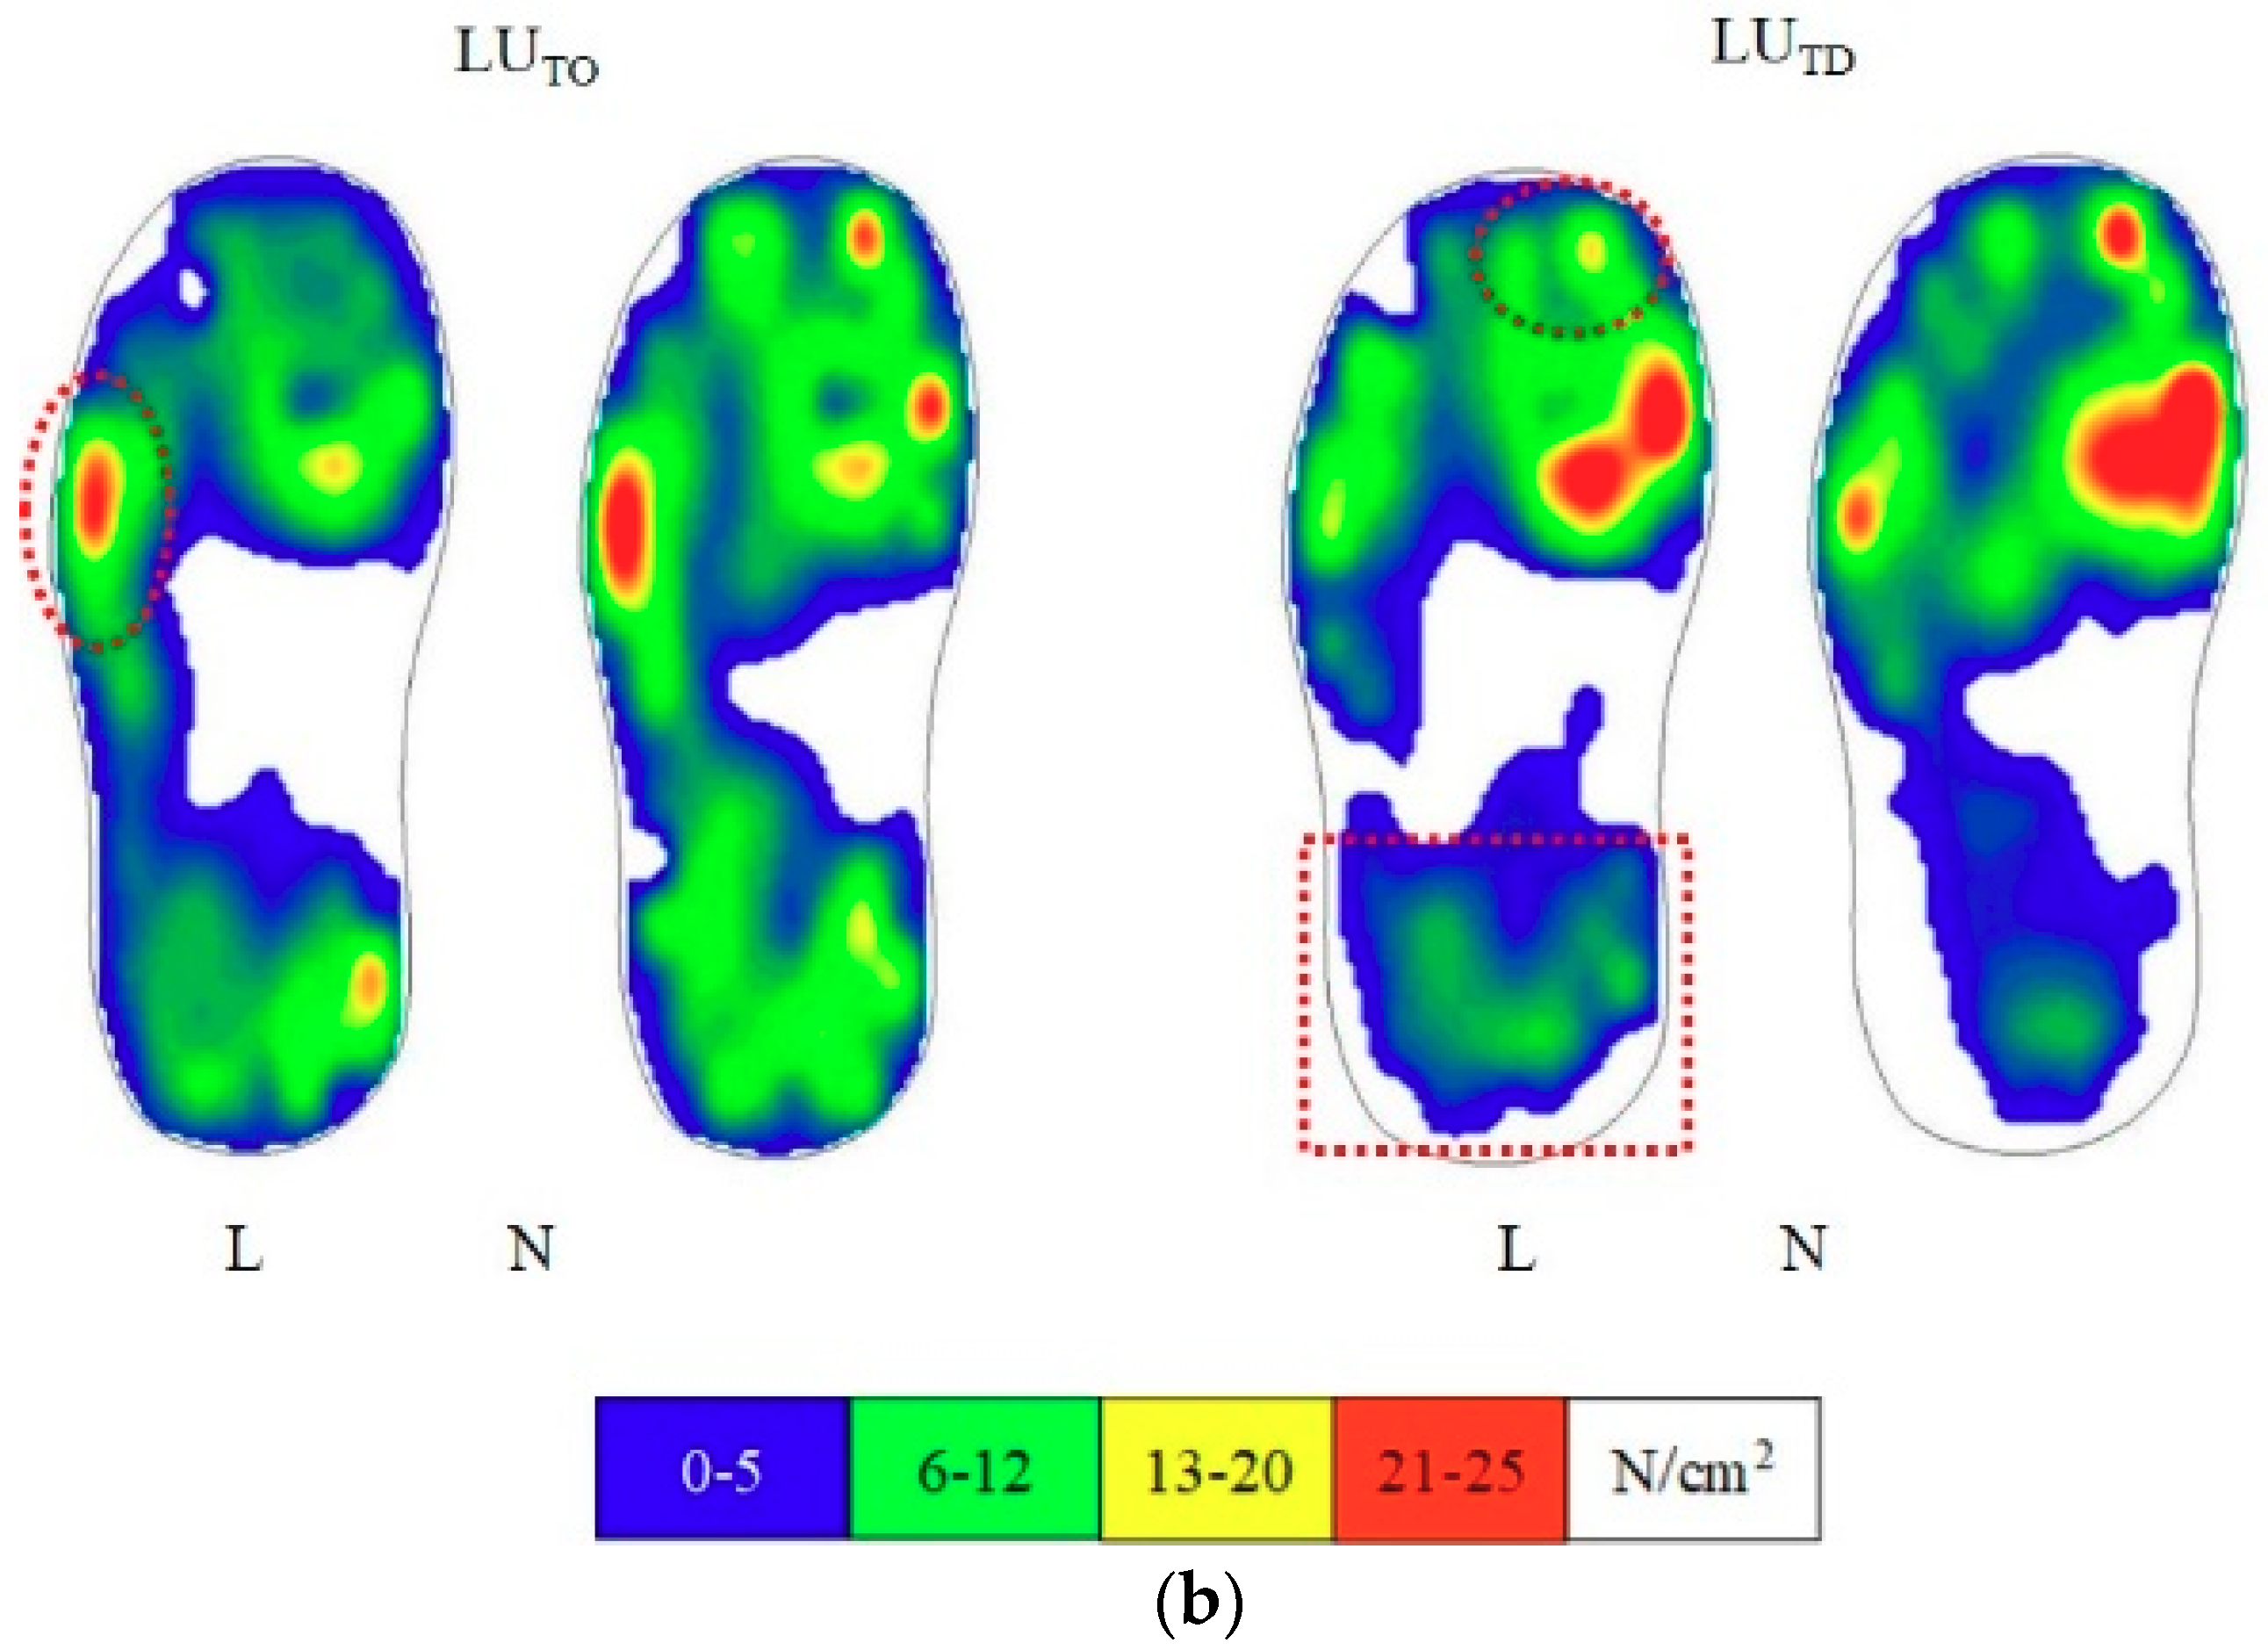
Figure 6.
Effect of different basketball shoes (N vs. L) on general fit.
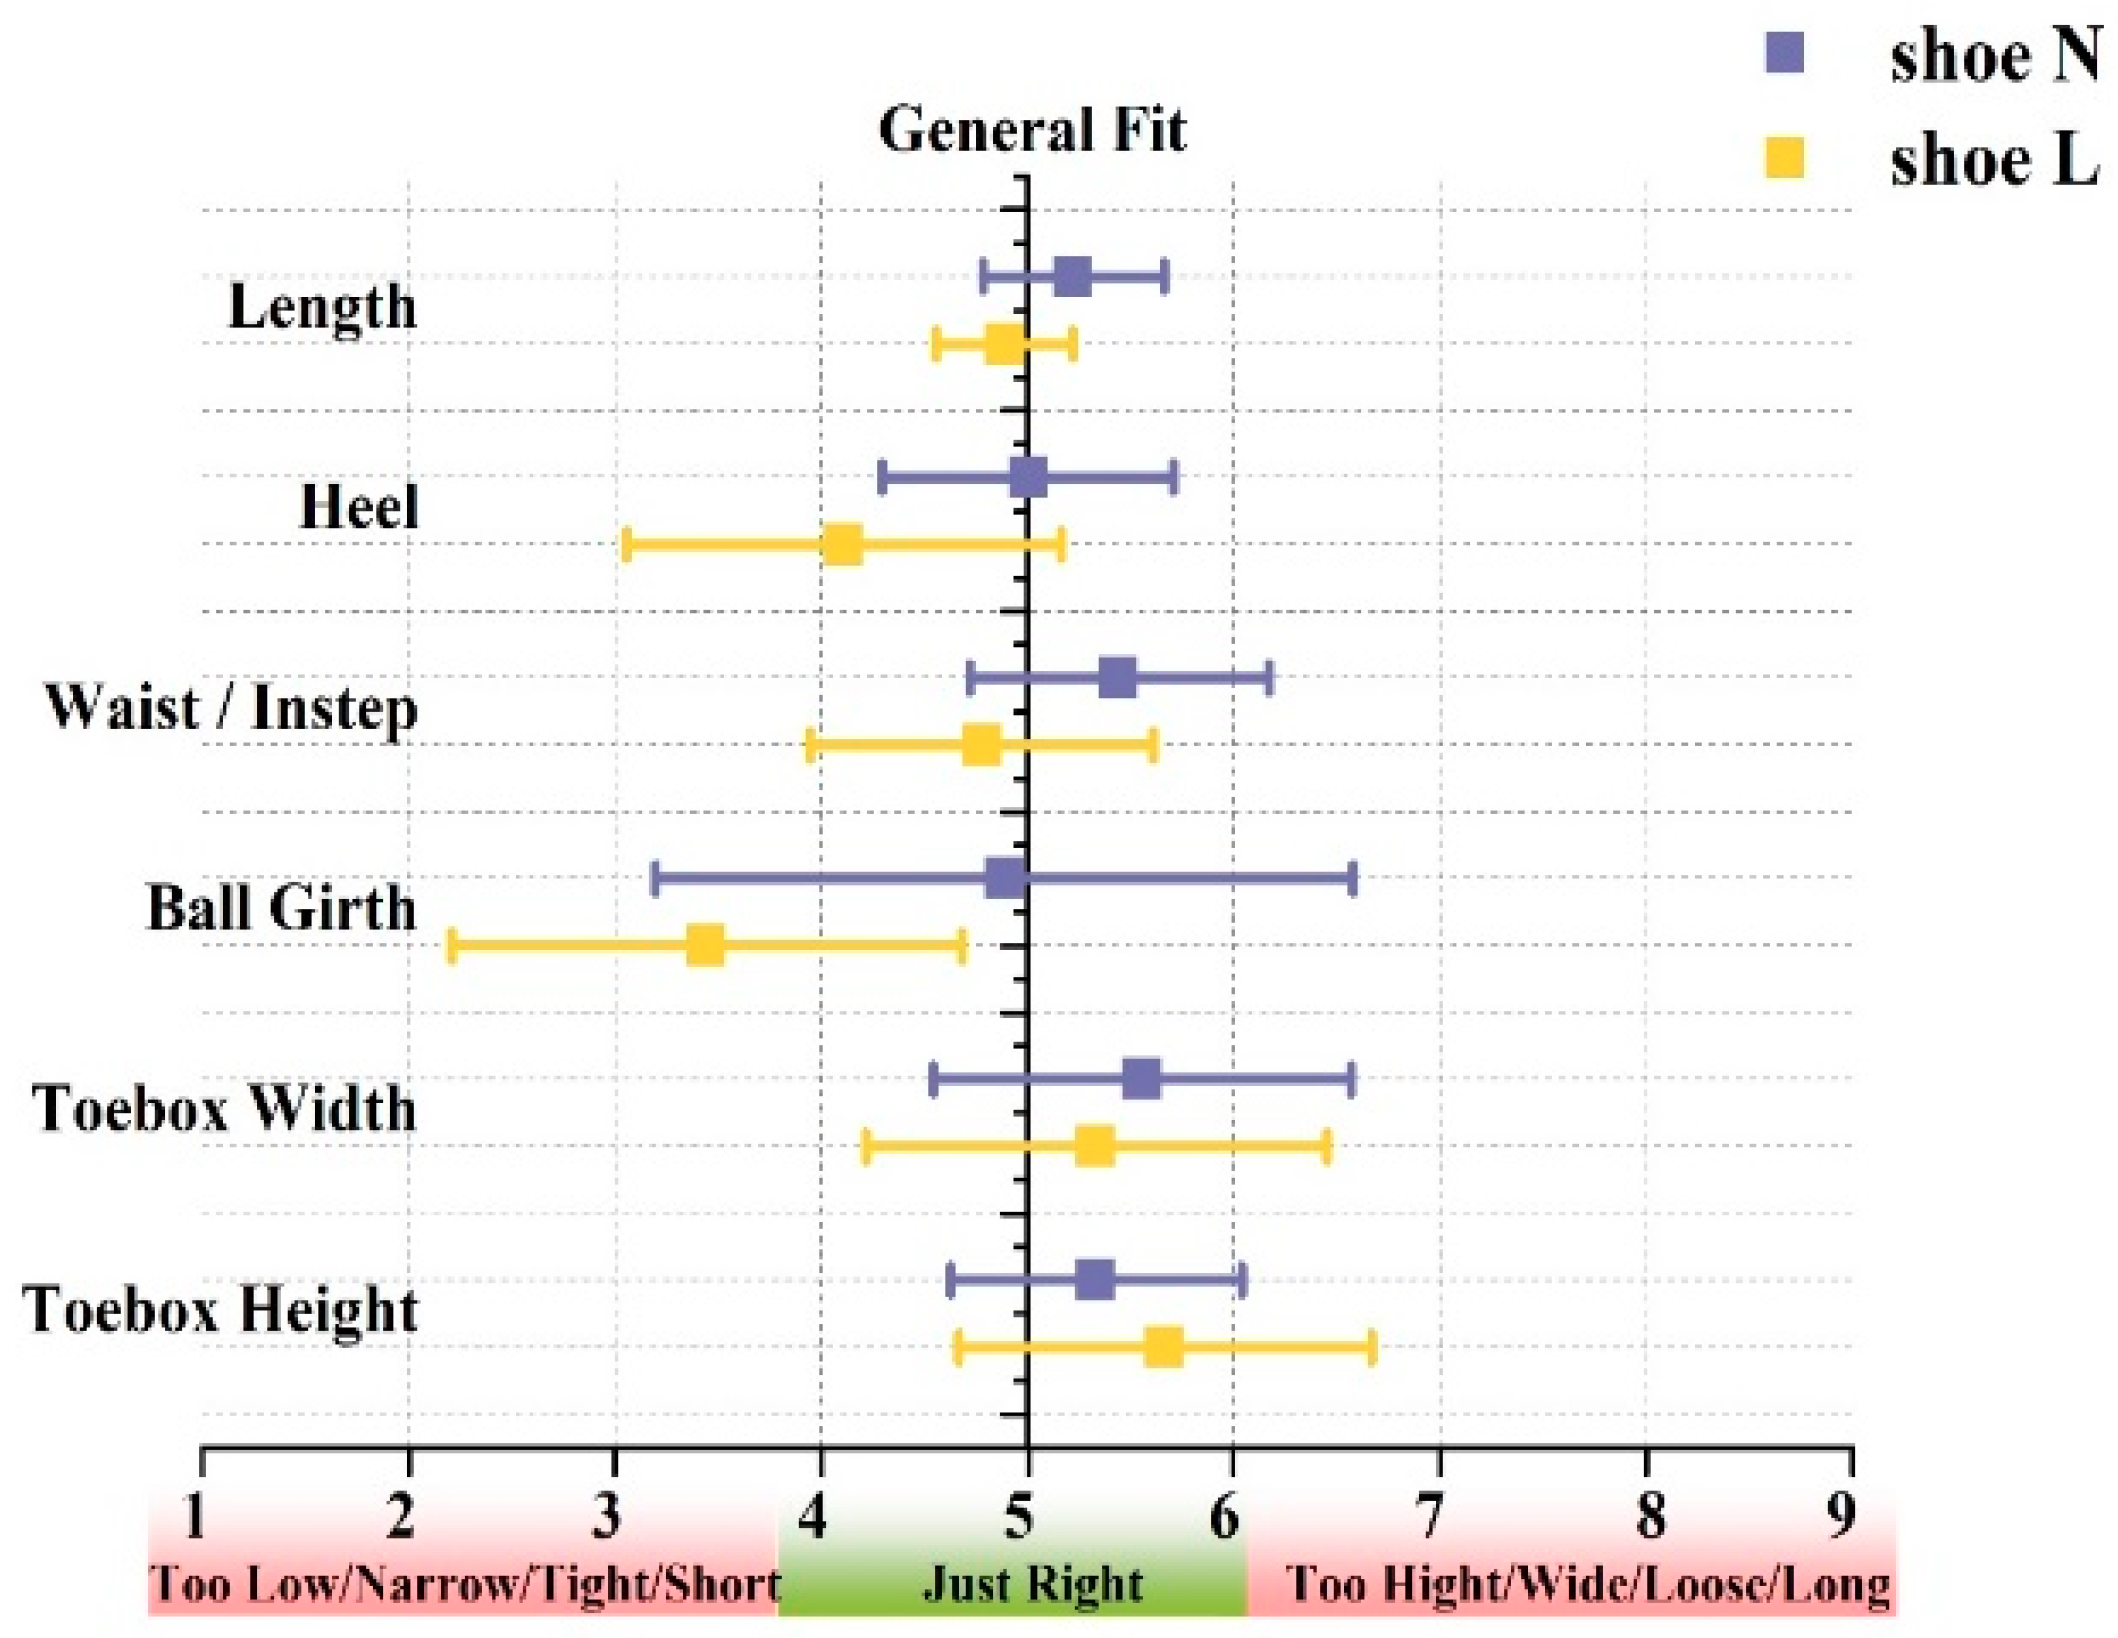
Figure 7.
(a) Effect of different basketball shoes (N vs. L) on preference of dynamic scale; (b) effect of different basketball shoes (N vs. L) on intensity in dynamic scale.
Figure 7.
(a) Effect of different basketball shoes (N vs. L) on preference of dynamic scale; (b) effect of different basketball shoes (N vs. L) on intensity in dynamic scale.

Table 1.
Effect of different basketball shoes on ground reaction force during side-step cutting, 90° L-direction running, and lay-up toe-off and lay-up touch-down maneuvers.
Table 1.
Effect of different basketball shoes on ground reaction force during side-step cutting, 90° L-direction running, and lay-up toe-off and lay-up touch-down maneuvers.
| Maneuvers | Shoes | Fz (BW) | tF (ms) | Gz (BW/ms) | tG (ms) |
|---|---|---|---|---|---|
| SS | L | 1.92 ± 0.32 | 74.4 ± 30.2 | 0.26 ± 0.18 | 27.2 ± 21.8 |
| N | 2.02 ± 0.43 | 63.3 ± 28.1 | 0.17 ± 0.06 | 19.7 ± 11.4 | |
| 90° LR | L | 2.47 ± 0.61 | 55.4 ± 25.6 | 0.35 ± 0.08 | 13.4 ± 12.6 |
| N | 2.25 ± 0.71 | 54.8 ± 26.4 | 0.21 ± 0.07 | 13.2 ± 9.7 | |
| LUTO | L | 3.53 ± 0.43 | 130.7 ± 47.6 | ||
| N | 3.55 ± 0.67 | 124.8 ± 42.1 | |||
| LUTD | L | 6.33 ± 3.10 | 26.4 ± 9.7 | 1.13 ± 0.87 | 10.3 ± 4.2 |
| N | 9.72 ± 3.42 | 28.6 ± 13.8 | 0.93 ± 0.32 | 11.9 ± 4.8 | |
Notes: GRF is ground reaction force, Fz is peak vertical GRF, Gz is peak loading rate, tF is time to peak vertical GRF, tG is time to peak loading rate, BW is bodyweight, SS is side-step cutting, 90° LR is 90° L-direction running, LUTO is lay-up toe-off, and LUTD is lay-up touch-down.
Table 2.
Effect of different basketball shoes on maximum pressure of each plantar region during side-step cutting, 90° L-direction running, and lay-up toe-off and lay-up touch-down maneuvers.
Table 2.
Effect of different basketball shoes on maximum pressure of each plantar region during side-step cutting, 90° L-direction running, and lay-up toe-off and lay-up touch-down maneuvers.
| Maneuvers | Shoe | Maximum Pressure of Each Plantar Region (N/kg/cm2) | |||||
|---|---|---|---|---|---|---|---|
| Entire | Forefoot | Midfoot | Heel | Lateral | Medial | ||
| SS | L | 0.028 ± 0.008 * | 0.037 ± 0.018 | 0.011 ± 0.012 ** | 0.024 ± 0.014 | 0.026 ± 0.013 | 0.033 ± 0.005 |
| N | 0.032 ± 0.006 | 0.043 ± 0.022 | 0.023 ± 0.016 | 0.029 ± 0.014 | 0.031 ± 0.015 | 0.035 ± 0.008 | |
| 90° -LR | L | 0.028 ± 0.018 | 0.048 ± 0.031 | 0.020 ± 0.015 | 0.026 ± 0.018 | 0.026 ± 0.018 | 0.033 ± 0.023 |
| N | 0.030 ± 0.019 | 0.051 ± 0.034 | 0.023 ± 0.021 | 0.025 ± 0.017 | 0.027 ± 0.019 | 0.035 ± 0.024 | |
| LUTO | L | 0.061 ± 0.008 | 0.098 ± 0.014 | 0.048 ± 0.009 ** | 0.080 ± 0.018 | 0.072 ± 0.009 | 0.054 ± 0.010 |
| N | 0.063 ± 0.012 | 0.093 ± 0.018 | 0.061 ± 0.014 | 0.082 ± 0.020 | 0.075 ± 0.014 | 0.053 ± 0.012 | |
| LUTD | L | 0.064 ± 0.011 | 0.081 ± 0.019 | 0.050 ± 0.017 ** | 0.093 ± 0.038 | 0.063 ± 0.011 ** | 0.067 ± 0.019 |
| N | 0.071 ± 0.012 | 0.082 ± 0.022 | 0.064 ± 0.017 | 0.099 ± 0.038 | 0.070 ± 0.011 | 0.076 ± 0.023 | |
Notes: SS is side-step cutting, 90° LR is 90° L-direction running, LUTO is lay-up toe-off, and LUTD is lay-up touch-down. * p < 0.05; ** p < 0.01.
© 2019 by the authors. Licensee MDPI, Basel, Switzerland. This article is an open access article distributed under the terms and conditions of the Creative Commons Attribution (CC BY) license (http://creativecommons.org/licenses/by/4.0/).
Share and Cite
MDPI and ACS Style
Zhang, X.; Luo, Z.; Wang, X.; Yang, Y.; Niu, J.; Fu, W. Shoe Cushioning Effects on Foot Loading and Comfort Perception during Typical Basketball Maneuvers. Appl. Sci. 2019, 9, 3893. https://doi.org/10.3390/app9183893
AMA Style
Zhang X, Luo Z, Wang X, Yang Y, Niu J, Fu W. Shoe Cushioning Effects on Foot Loading and Comfort Perception during Typical Basketball Maneuvers. Applied Sciences. 2019; 9(18):3893. https://doi.org/10.3390/app9183893
Chicago/Turabian StyleZhang, Xini, Zhen Luo, Xi Wang, Yang Yang, Jiaxin Niu, and Weijie Fu. 2019. "Shoe Cushioning Effects on Foot Loading and Comfort Perception during Typical Basketball Maneuvers" Applied Sciences 9, no. 18: 3893. https://doi.org/10.3390/app9183893
Note that from the first issue of 2016, this journal uses article numbers instead of page numbers. See further details here.