Article

Investigation of the Broadband Microwave Absorption of Citric Acid Coated Fe3O4/PVDF Composite Using Finite Element Method

by
Lawal Lanre Adebayo
1,*,
Hassan Soleimani
1,*,
Noorhana Yahya
1,
Zulkifly Abbas
2,
Ayinla Tobi Ridwan
1 and
Fatai Adisa Wahaab
1
1
Fundamental and Applied Science Department, Universiti Teknologi PETRONAS, Bandar Seri Iskandar, Perak Darul Ridzuan 32610, Malaysia
2
Department of Physics, Faculty of science, Universiti Putra Malaysia, UPM Serdang, Selangor Darul Ehsan 43400, Malaysia
*
Authors to whom correspondence should be addressed.
Appl. Sci. 2019, 9(18), 3877; https://doi.org/10.3390/app9183877
Submission received: 3 July 2019 / Revised: 25 July 2019 / Accepted: 25 July 2019 / Published: 16 September 2019
(This article belongs to the Section Materials Science and Engineering)

Abstract

:
Magnetite (Fe3O4) have been thoroughly investigated as microwave absorbing material due to its excellent electromagnetic properties (permittivity and permeability) and favorable saturation magnetization. However, large density and impedance mismatch are some of the limiting factors that hinder its microwave absorption performance (MAP). Herein, Fe3O4 nanoparticles prepared by facile co-precipitation method have been coated with citric acid and embedded in a polyvinylidene fluoride (PVDF) matrix. The coated Fe3O4 nanoparticles were characterized by X-ray diffraction spectrometer (XRD), field emission scanning electron microscopy (FESEM), Fourier transform infrared spectroscopy (FTIR), and vibrating sample magnetometer (VSM). COMSOL Multiphysics based on the finite element method was used to simulate the rectangular waveguide at X-band and Ku-band frequency range in three-dimensional geometry. The citric acid coated Fe3O4/PVDF composite with 40 wt.% filler loading displayed good microwave absorption ability over the studied frequency range (8.2–18 GHz). A minimum reflection loss of −47.3 dB occurs at 17.9 GHz with 2.5 mm absorber thickness. The composite of citric acid coated Fe3O4 and PVDF was thus verified as a potential absorptive material with improved MAP. These enhanced absorption coefficients can be ascribed to favorable impedance match and moderate attenuation.

1. Introduction

Technological advances and rapid proliferation of wireless gadgets that operate at super high frequency range have led to the continuous rise in electromagnetic (EM) interference with electronic equipment, likewise EM pollution that endangers human health [1]. For instance, it has been reported that the long exposure of human to EM radiation could increase morbidity, particularly in pregnant women and children [2]. Fabrication of EM wave absorptive materials which can dissipate the undesirable EM energy have been widely explored as an effective way to tackle this problem [3,4]. The desired features of an efficient microwave absorbing materials (MAM) includes strong absorption, light-weight, wide operating bandwidth, thin thickness, and low cost [5]. Magnetite (Fe3O4), a member of the spinel class of ferrite is endowed with excellent complex permeability and permittivity, which are significant governing parameters in EM wave absorption. In addition, it possesses high magnetization saturation (Ms) at ambient temperature, high Curie temperature and low production cost which attracted much interest in the field of EM wave absorption. However, Fe3O4 as an absorptive material have some limitations such as the rapid decrease in permeability value at microwave frequency, large density, ease of oxidation and mismatch of impedance which impedes its performance as an ideal MAM [6,7].
Recently, several research efforts have been geared towards improving the microwave absorption performance (MAP) of Fe3O4. For example, Mingxu et al. [8] fabricated hollow Fe3O4 nanoparticles via solvothermal route, with the aim of reducing its density while retaining good magnetic properties for efficient MAP. They established improved EM wave absorption with increasing particle size and change in morphology. Maximum EM absorption with RL value of −55.14 dB at 11.76 GHz was achieved with an absorber thickness of 2.07 mm. Guiquig et al. [9] synthesized nano-Fe3O4 by an innovative wet chemical route, employing hydrazine hydrate as anti-oxidation agent. The synthesized Fe3O4 nanoparticle of average diameter of 77 nm possessed high magnetization saturation and coercivity value of 72.36 emu/g and 95 Oe, respectively. The minimum RL value of −21.2 dB was achieved with 6 mm thickness. Similarly, optimization of the MAP of Fe3O4 via design and fabrication of hierarchical nanostructure have also been explored. Chaomie et al. [10] exploit one-step and template-free synthesis method to prepare octahedral Fe3O4 nanostructure by direct decomposition of an iron organic compound with molten salt. The sample annealed at 800 °C displayed maximum EM absorption of −23.67 dB at 15.24 GHz at a thickness of 1.4 mm. The enhanced microwave absorption (MA) at a thin thickness (1.4 mm) was attributed to the morphology, proper attenuation value, and good impedance matching. Xueai et al. [11] prepared flower-like Fe3O4 with porous nanostructures which displayed enhanced MAP, with minimum RL value of −28.3 dB achieved with 2 mm thickness.
Highly efficient MAM is required to possess high absorption at a thin thickness and low density for practical application. Herein, citric acid coated Fe3O4 (C-Fe3O4) was prepared by facile co-precipitation method and embedded in polyvinylidene fluoride (PVDF) matrix by an in situ solvent mixing technique. This was proposed with the aim of achieving high absorption coefficient at a reduced density and thickness without the design of a complex hierarchical structure. The Fe3O4 was coated with citric acid to introduce carboxyl and hydroxyl functional groups. It has been reported that the presence of these functional groups within an absorptive material can provide additional polarization centers to enhance the EM wave absorption [12]. PVDF as a dielectric matrix possesses unique properties such as lightweight, flexibility, heat and chemical corrosion resistance, which are favorable for practical applications as absorptive material. The synergistic effect between Fe3O4 nanoparticles and dielectric matrix is beneficial for enhancing the MAP of composites [13]. In this study, transmission line and waveguide method was used to measure the EM parameters (permittivity and permeability) of the C-Fe3O4/PVDF nanocomposites loaded in the rectangular waveguide at X-band (8.2–12.4 GHz) and Ku-band (12.4–18 GHz) frequency range. Furthermore, COMSOL Multiphysics based on finite element method (FEM) was used to simulate the MA properties of the synthesized C-Fe3O4/PVDF nanocomposites. The optimal loading of C-Fe3O4 in the PVDF matrix for efficient EM wave absorption was investigated using the FEM formulation. The electric field (E-Field) variation within the different regions of the rectangular waveguide was analyzed. In addition, the relationship between the density of the EM energy and absorption coefficient was investigated. Conclusively, the MA properties of the sample containing 40 wt.% C-Fe3O4 in PVDF nanocomposites displayed superior MAP. The good dissipation of EM wave by the sample can be associated to impedance matching, multiple polarization mechanism, and suitable EM attenuation ability.

2. Methodology

2.1. Synthesis of C-Fe3O4 Nanoparticles

Anhydrous ferric chloride (FeCl3), citric acid monohydrate (C6H8O7·H2O), ferrous chloride tetrahydrate (FeCl2·4H2O), N-Methyl-2-pyrrolidone (NMP), and ammonium hydroxide (NH4OH, 30 wt.% NH3 in water) were bought from R & M chemicals. Polyvinyl fluoride (PVDF) pallet was bought from Sigma Aldrich (Sigma Aldrich, Subang Jaya, Malaysia). All chemicals were analytical grade and used as collected without additional purification.
A conventional co-precipitation method according to [14] was adopted for the synthesis of Fe3O4 nanoparticles, with modification in the molar ratio and concentration of the iron precursors. Firstly, 0.16 M FeCl3 and 0.32 M FeCl2·4H2O (molar ratio 1:2) were dissolved in 100 mL of deionized water at room temperature. The solution was heated at 80 °C under vigorous stirring for 15 min to completely dissolve the iron salts. Thereafter, 10 mL of 30% NH4OH was introduced into the mixture to raise the pH of the solution to 9.5 and initiate precipitation of Fe3O4. The mixture was continuously stirred vigorously for an additional 30 min with the temperature maintained at 80 °C to aid the formation of Fe3O4. The reaction formula is as follows.
2 FeCl 3 + FeCl 2 + 8 NH 3 + 4 H 2 O Fe 3 O 4 + 8 NH 4 Cl
To prepare C-Fe3O4 nanoparticles, 2.5 mL C6H8O7·H2O solution (1.5 g of C6H8O7·H2O dissolved in 2.5 mL deionized water) was added to the magnetic fluid and continuously stirred at 95 °C for 90 minutes. Subsequently, the solution was allowed to cool down to ambient temperature, and the C-Fe3O4 nanoparticles were retrieved by magnetic decantation. The product was purified multiple times with deionized water to remove impurities and then dried in an oven at 65 °C for 5 h. Finally, the pure crystalline sample was obtained by calcinating the product at 400 °C for 2 h in a tube furnace with a ramping rate of 5 °C/min under N2 atmosphere.

2.2. Preparation of C-Fe3O4/PVDF Nanocomposites

PVDF pellets were dissolved in NMP solution at a mass ratio of 1:2 and heated at 100 °C for 80 minutes to prepare PVDF solution. The C-Fe3O4 nanoparticles (Figure 1a) were dispersed in the PVDF solution with varying mass ratio of 10 wt.%, 20 wt.%, and 40 wt.% denoted as M10, M20, and M40 respectively. To achieve homogenous dispersion, the mixture was subjected to continuous vigorous stirring for 30 min using an electric stirrer. Afterward, the C-Fe3O4/PVDF mixture was poured in a bath of deionized water and allowed to solidify (Figure 1b) for 15 min and finally dried at ambient temperature for 12 h.

2.3. Electromagnetic Properties Measurement

The EM parameters of all samples were measured by the transmission line and waveguide method using the WR90 and WR62 rectangular waveguides. A sample denoted as M0 was prepared by homogeneously mixing 50 wt.% of the C-Fe3O4 in paraffin wax solution. While, the C-Fe3O4/PVDF nanocomposites (M10, M20, and M40) were compressed by hot pressing at 180 °C. All samples were molded into a rectangular shape with the dimensions of 10.16 × 22.86 mm3 for measurements at X-band frequency and 7.90 × 15.80 mm3 for Ku-band frequency (Figure 1c). All samples were tightly fitted onto a WR-90 and WR62 waveguides for the EM parameters measurement with Keysight E5071C vector network analyzer (Keysight, USA) in the studied frequency ranges. The VNA was calibrated using a two-port through reflection line (TRL) calibration procedure to eliminate possible systematic experimental errors which could arise due to system imperfections [15]. To avoid EM wave leakage the samples were snugly fitted such that no gap exists between the sample holder and the material as shown in Figure S1.

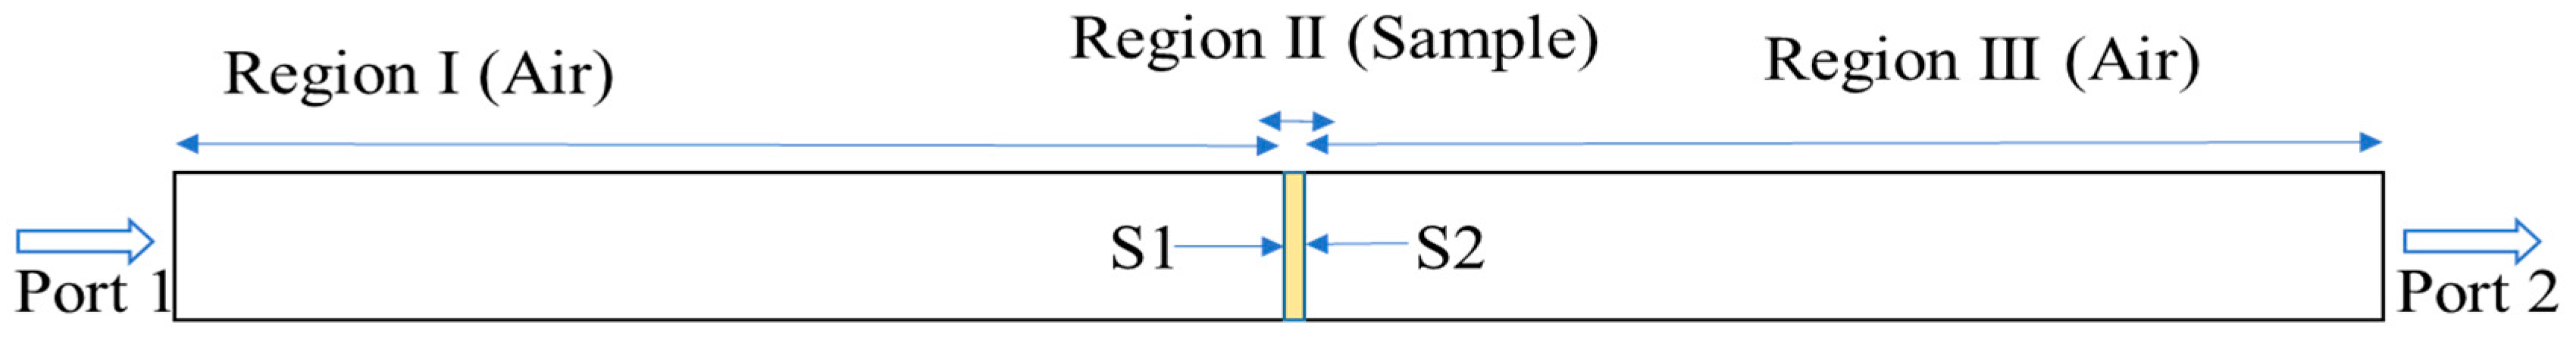
2.4. The Finite Element Method

In this work, the FEM was used to study the MA properties of C-Fe3O4/PVDF in a rectangular waveguide. In setting up the geometry, the WR90 and WR62 rectangular waveguides were modeled in 3D with schematic shown in Figure 2. The complex permeability and permittivity value from measurement with VNA were used in simulating the MA properties. All boundaries of the waveguide were simulated as a perfect electric conductor except two boundaries marked as port 1 and port 2 for wave excitation. The geometry has 3 domains, the first and third domain was modelled as free space while the second domain contains the material. Then a mesh consisting of tetrahedral elements was generated. The complete mesh consists 10,574 domain elements, 2256 boundary elements, and 264 edge elements. The EM propagating mode used in this study was the TE10 mode. The fundamental TE10 is the mode with the lowest cut-off frequency that can propagate through a rectangular waveguide. Then, the scattering parameters were evaluated at the position S1 and S2, respectively and used in calculating the MA properties.
In this model, the radio frequency (RF) module’s port boundary condition was used for the wave excitation. With this boundary condition, the magnitude of the reflection/transmission and reflection loss can be estimated [16]. The wave equation of the propagating electric field “E” based on the Maxwell equation is given below.
× μ r 1 ( × E ) k o 2 ( ε r j σ ω ϵ o ) E
where ε r , µ r , σ, ω ( 2 π f ) , f, ϵ o , k are the relative permittivity, relative permeability, conductivity, frequency, permittivity of free space and wave vector, respectively. The E-field within the waveguide was discretized by means of tetrahedron elements [16]. Therefore, within each element, the EM field can be interpolated from the individual node value with the first order polynomial as follows:
ρ e ( x , y , z ) = a e + b e x + c e y + d e z
The E-Field in the rectangular waveguide using FEM is
E e = i = 1 6 N i e E i e ( X . Y . Z )
where N i e , i = 1, 2, 3, …, 6 are the complex intensities of the E-Field correlated with six edges of the element, and E i e ( x , y , z ) is the vector basis function related to the i-th edge of the element. Applying boundary conditions, the integration over the volume of one element is:
1 μ r · ( i = 1 6 N i e ( × W j · × W i K 0 2 ε r W i · W j ) dv 2 ( jw μ μ r ) · Y 0 I · W j · e o ( x , y ) ds ( jw μ μ r ) i = 1 6 N i e p = 0 Y p I ( W j e p ( x , y ) ds · W i · e p ( x , y ) ds ) )
The matrix equation after simplification of Equation (5) can be written as:
( S 11 e S 16 e S 61 e S 66 e ) ( N 1 e N 6 e ) = ( V 1 e V 6 e )
where the elements of the matrices are defined as
S e 1 ( j , i ) = 1 μ r ( × W J × × W I k 0 2 ε r W i × W j ) dv + ( jw μ μ r ) p = 0 Y p I ( W j × e p ( x , y ) ds · W i · e p ( x , y ) ds )
V ( j ) = 2 ( jw μ μ r ) × Y 0 I · W j × e 0 ( x , y ) ds
where V can be obtained from the boundary conditions. These elements matrices can be accumulated across the whole tetrahedron elements in the region filled with C-Fe3O4/PVDF nanocomposites to achieve the over-all matrix equation:
[ S ] × { N I } = { V }
Then, the solution of Equation (9) was subsequently used by the software to evaluate the magnitude of the transmission and reflection.

2.5. Characterizations

X-ray diffraction spectrometer (XRD, Malvern Panalytical, Malvern, UK) with Cu Kα radiation (λ = 0.15406 nm, 40 mA and 45 kV) was used to characterize the phase compositions and crystallinity of the C-Fe3O4 nanoparticles. The morphology and nanostructure of the sample were analyzed by Field emission scanning electron microscopy (FESEM, SUPRA 55VP Carl Zeiss AG, city, Germany). Fourier transform infrared spectroscopy (FTIR, Cary 630, Agilent, Santa Clara, CA, USA) was used to ascertain the presence of the functional groups in the sample. The magnetic properties of the C-Fe3O4 were analyzed at room temperature by vibrating sample magnetometer (VSM 648 series, Lakeshore, Westerville, OH, USA).

3. Results and Discussion

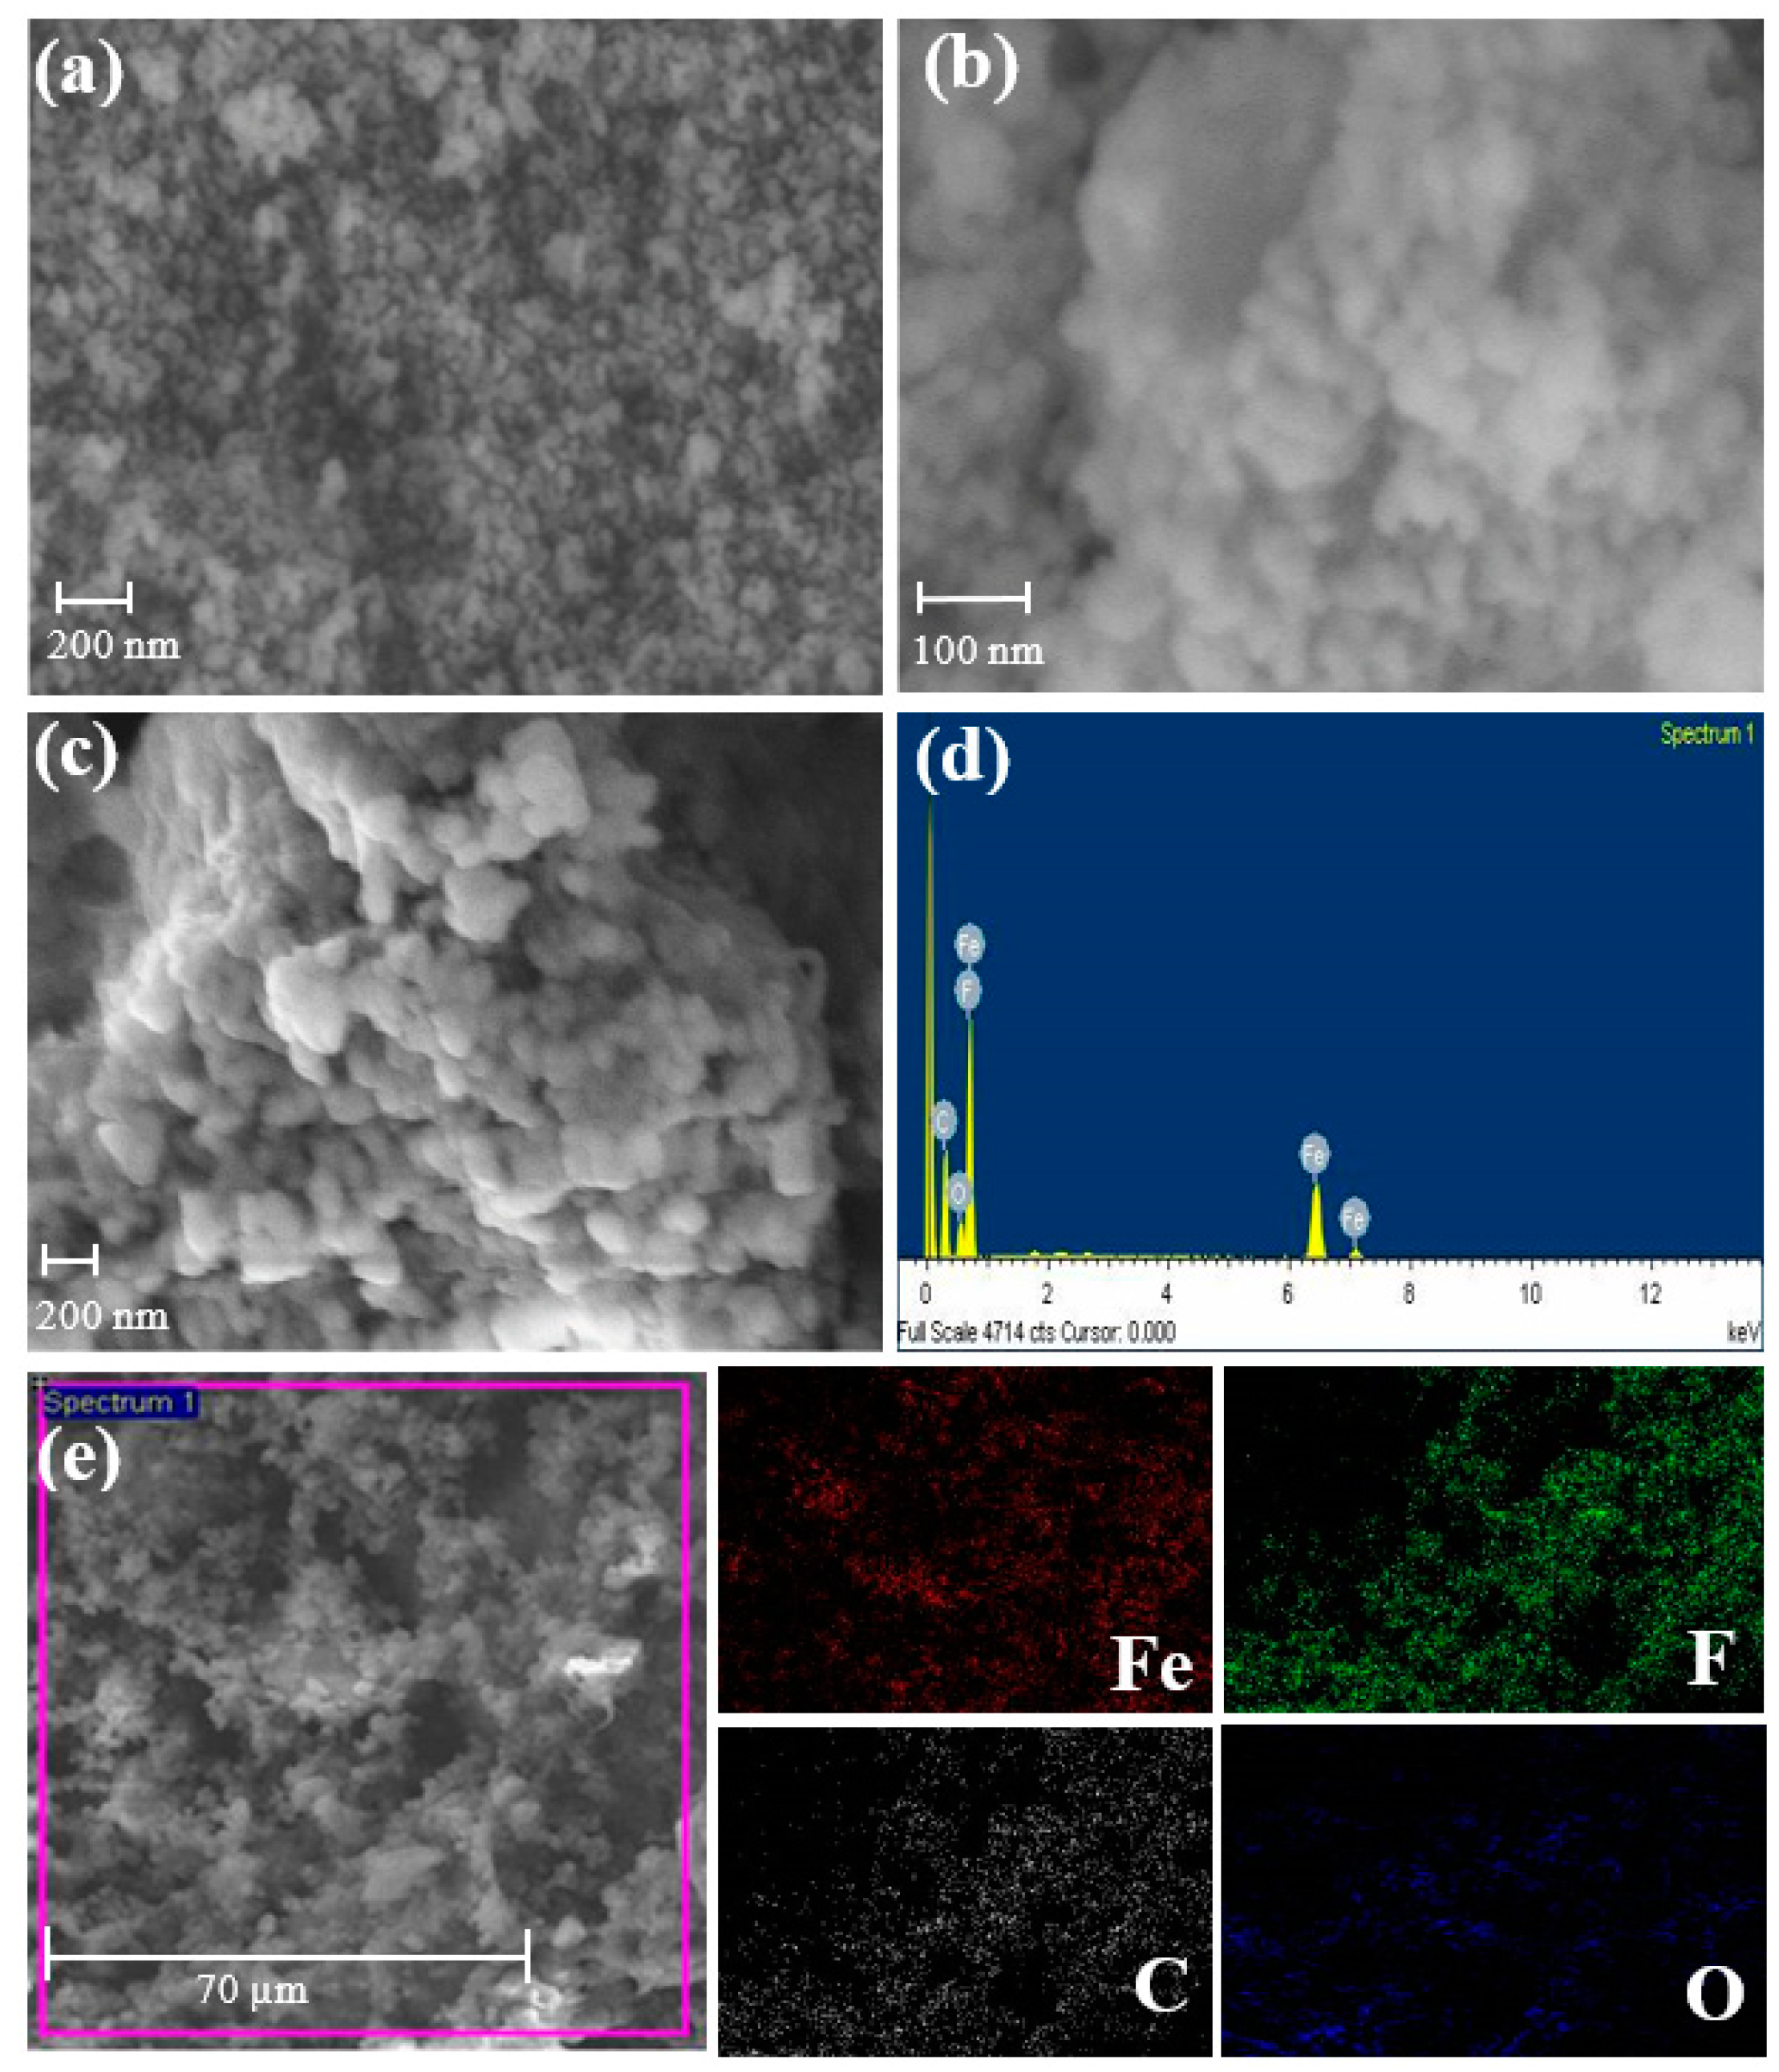
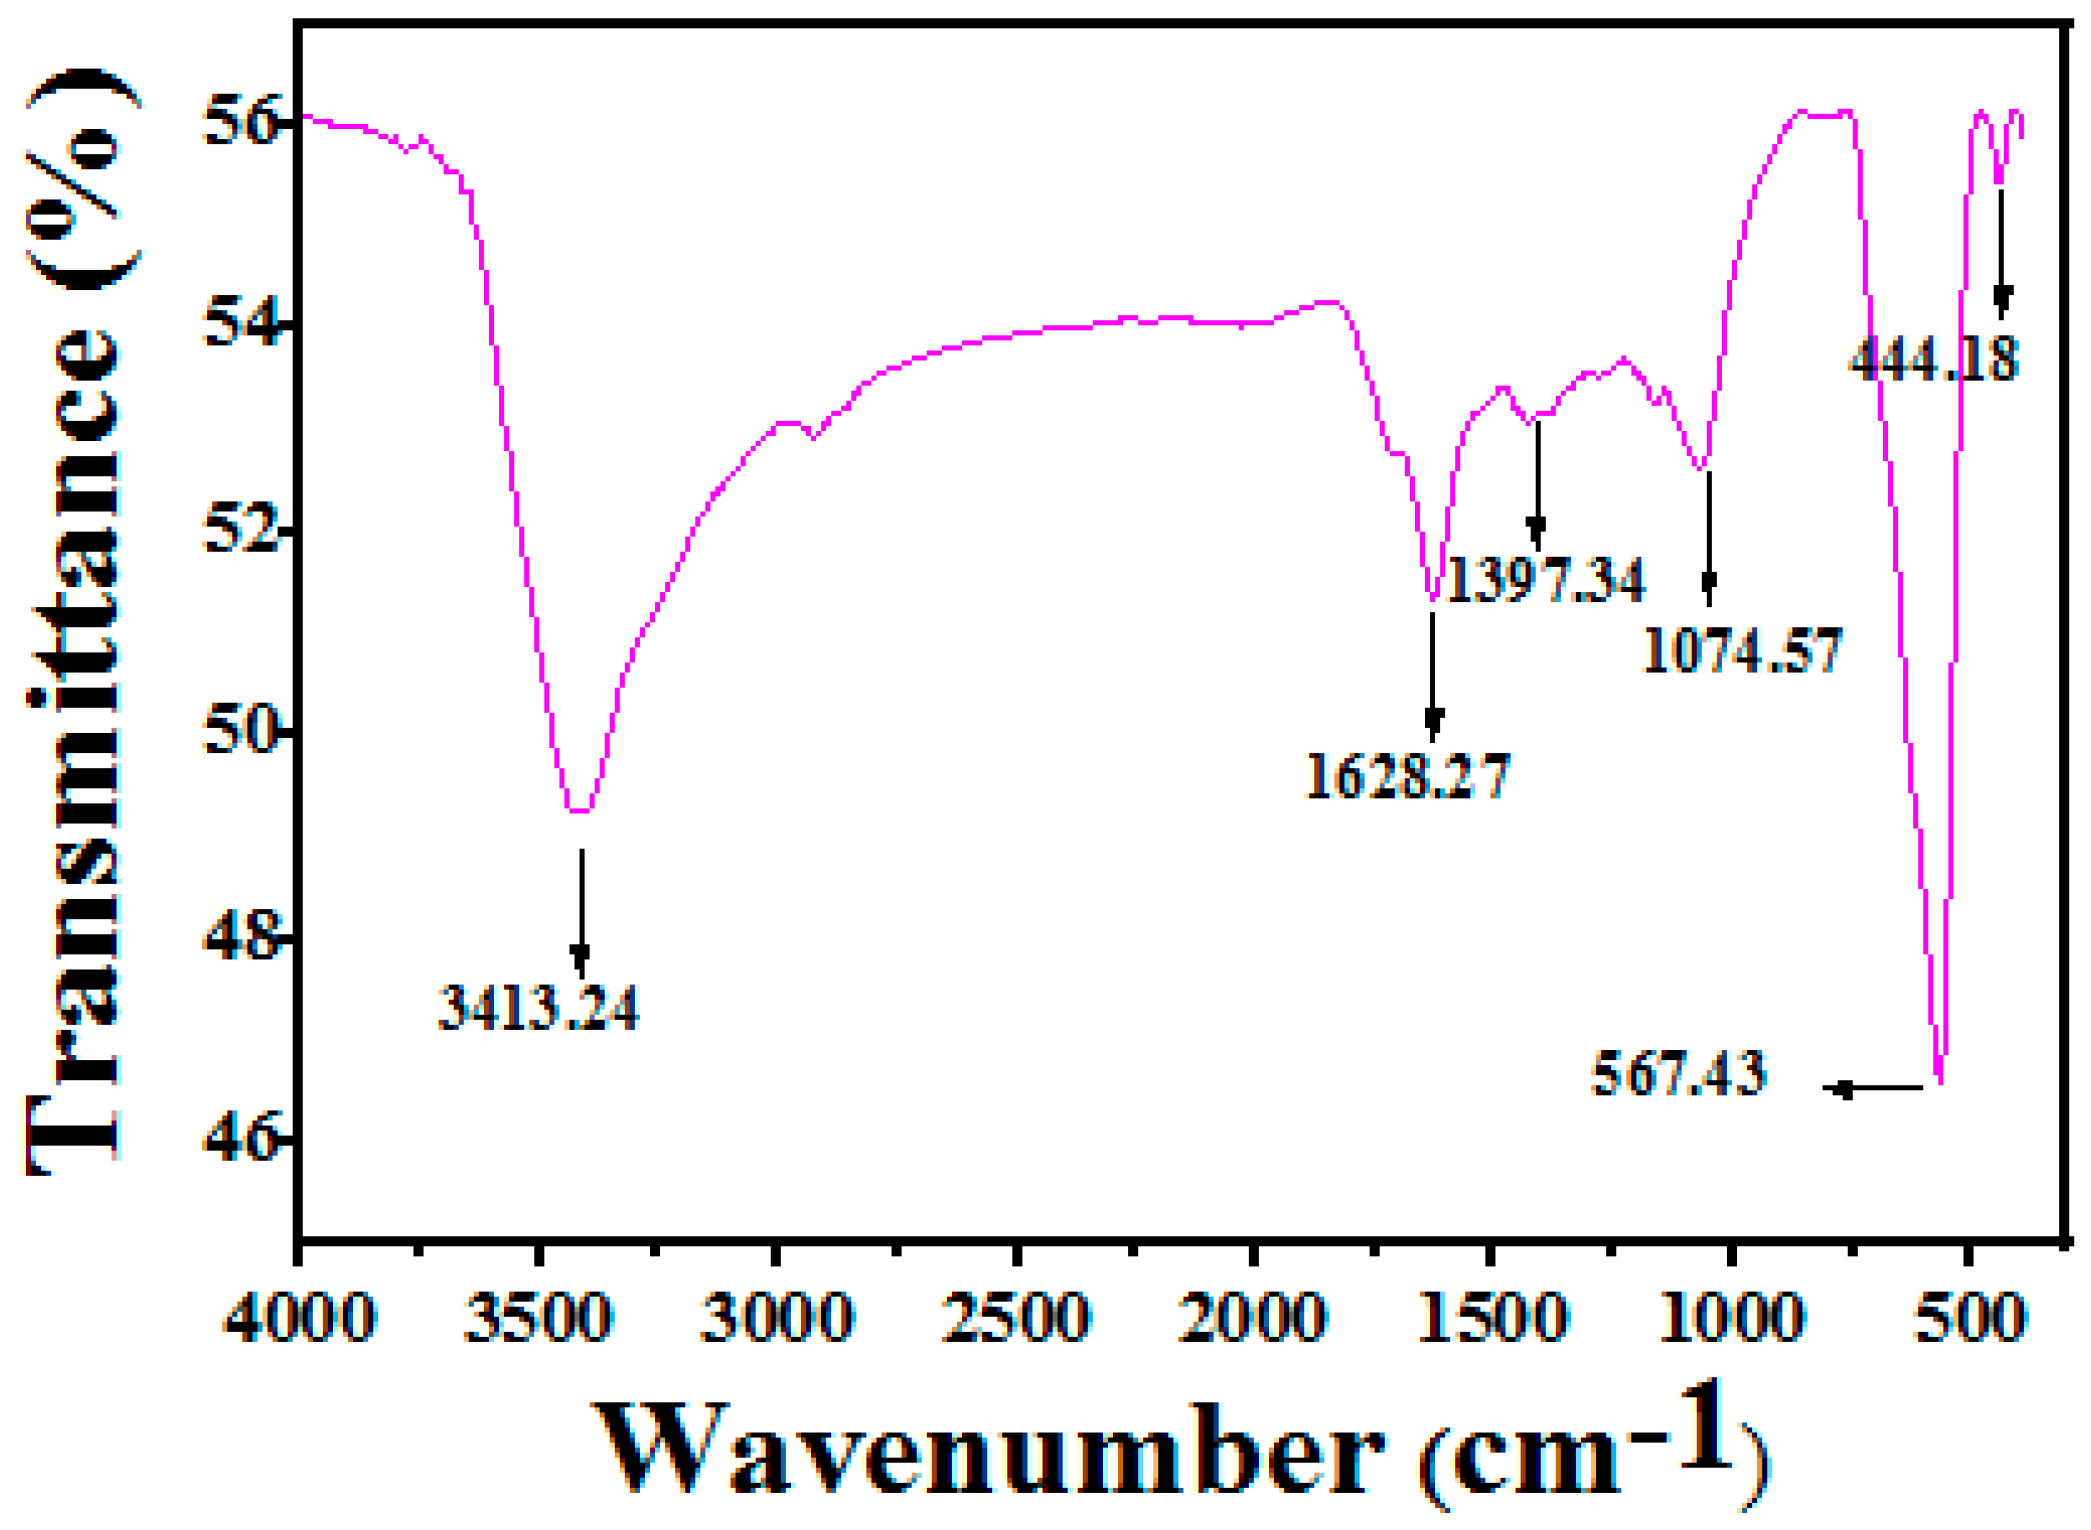
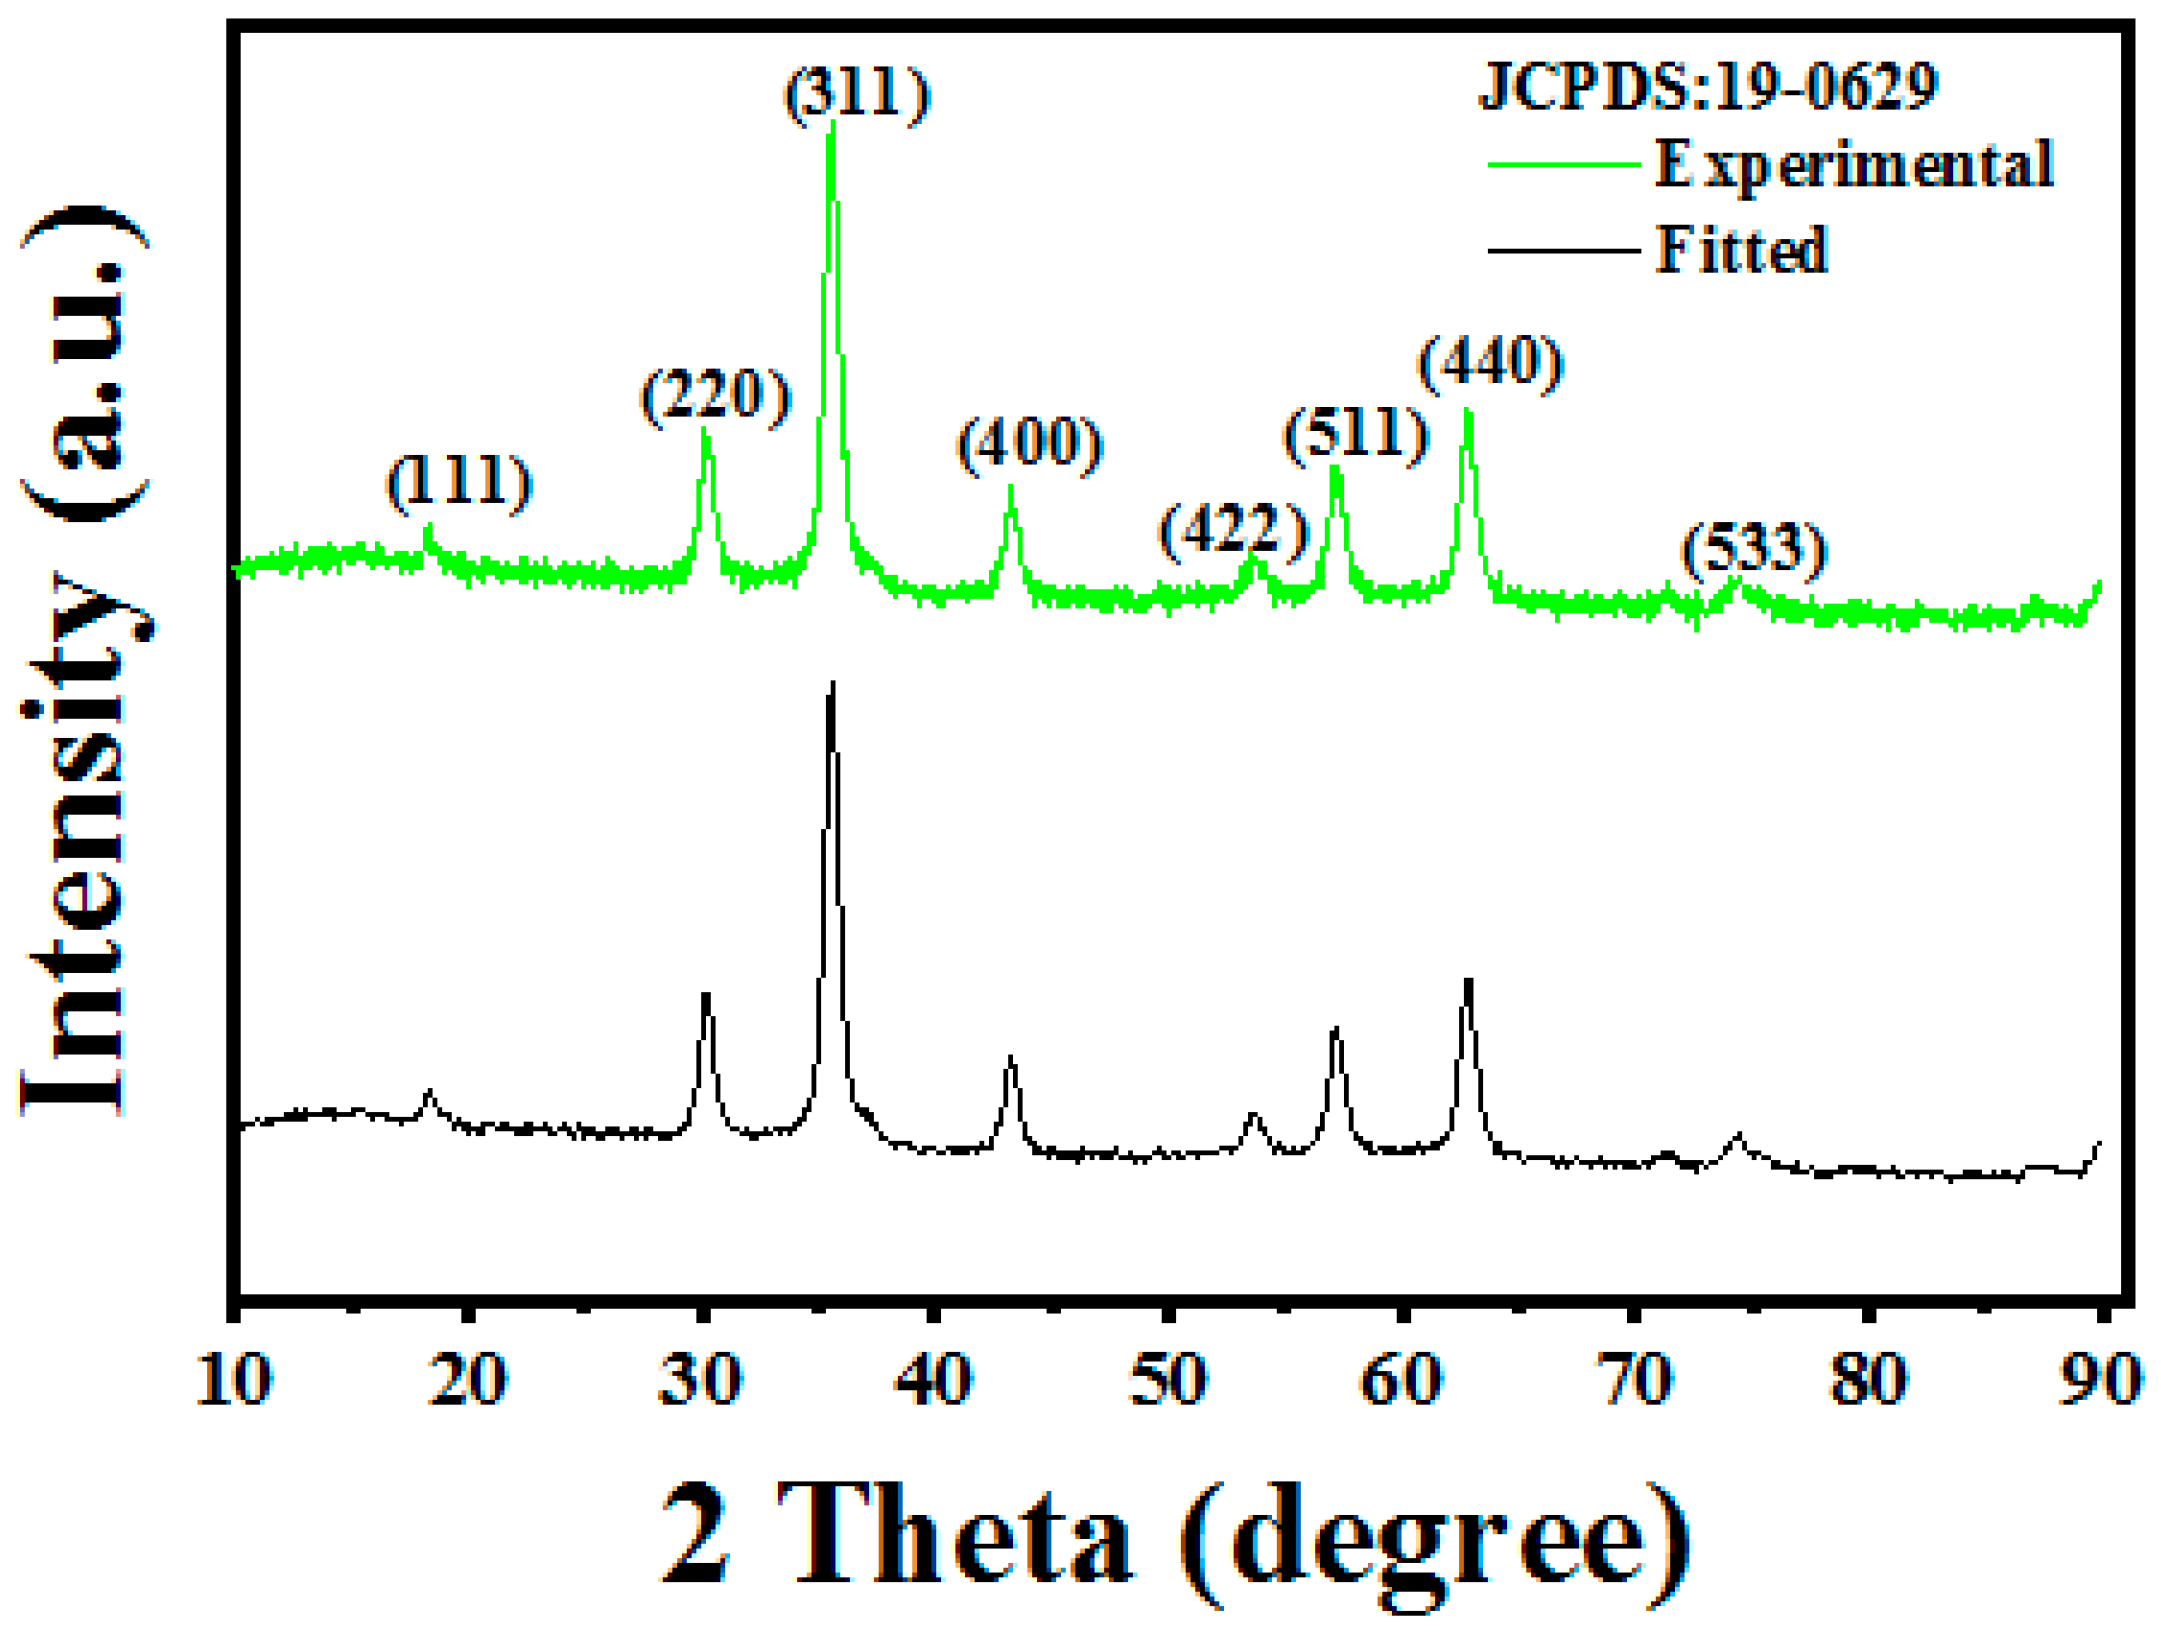
3.1. Structure and Morphology Analysis

The XRD pattern of the C-Fe3O4 nanoparticles is presented in Figure 3. Clearly, all diffraction peaks located at 18.3, 30.1, 35.4, 43.1, 53.4, 56.9, 62.5 and 73.9° can be indexed to the crystal planes of (111), (220), (311), (400), (422), (511), (440), and (533) of Fe3O4 (JCPDS no. 19-0629). The average crystal size of the C-Fe3O4 nanoparticles was calculated using the Scherrer equation as follows.
D = k λ β cos θ
where D, K, λ, β and θ are the average crystal size, Scherrer constant (0.94), wavelength of the X-ray sources (0.15406 nm), peak width at half the maximum peak, and angle correlated with highest diffraction peak, respectively. The calculated average crystal size from Scherrer equation was 8.85 nm. The nanostructure and morphology were investigated by FESEM. Figure 4a shows that the sample is made up of nanoparticles with an interconnected porous structure. This porous network would provide multiple pathways for the propagation of the EM wave. The magnified image shown in Figure 4b reveals that the C-Fe3O4 nanoparticles are compacted with high agglomeration despite the citric acid coating and displays spherical nanostructure. The high agglomeration could be attributed to strong inter-particles Van der Waals force and strong magnetic attraction among the particles. Figure 4c presents the magnified image of C-Fe3O4/PVDF (M40), which shows that C-Fe3O4 nanoparticles are tightly anchored on the PVDF matrix and retain a spherical structure after the electrical stirring. The energy dispersive X-ray spectrum (EDS) analysis of M40 was carried out (Figure 4d) which reveals the presence of Fe, O, C, and F. Elemental mapping was also conducted (Figure 4e) to investigate the spatial distribution of the elements present. The obtained image depicts that the M40 comprises of homogenous distribution of Fe, O, C and F. FTIR results presented in Figure 5 was used to further investigate the chemical bonds presents in the sample. The strong peak at 567.43 cm−1 and a weak peak at 444.18 cm−1 can be attributed to the stretching of Fe-O vibration, which confirms the sample as Fe3O4 [17], and the absorption bands at 1628.27 cm−1 and 1397.34 cm−1 are vibrational characteristics of the C=O emanating from the C6H8O7·H2O coating [14]. The peak around 3413.24 cm−1 are also vibrational characteristics of the hydroxyl functional group (H-O-H) [18]. These analyses confirm the successful doping of Fe3O4 with carboxyl and hydroxyl group.

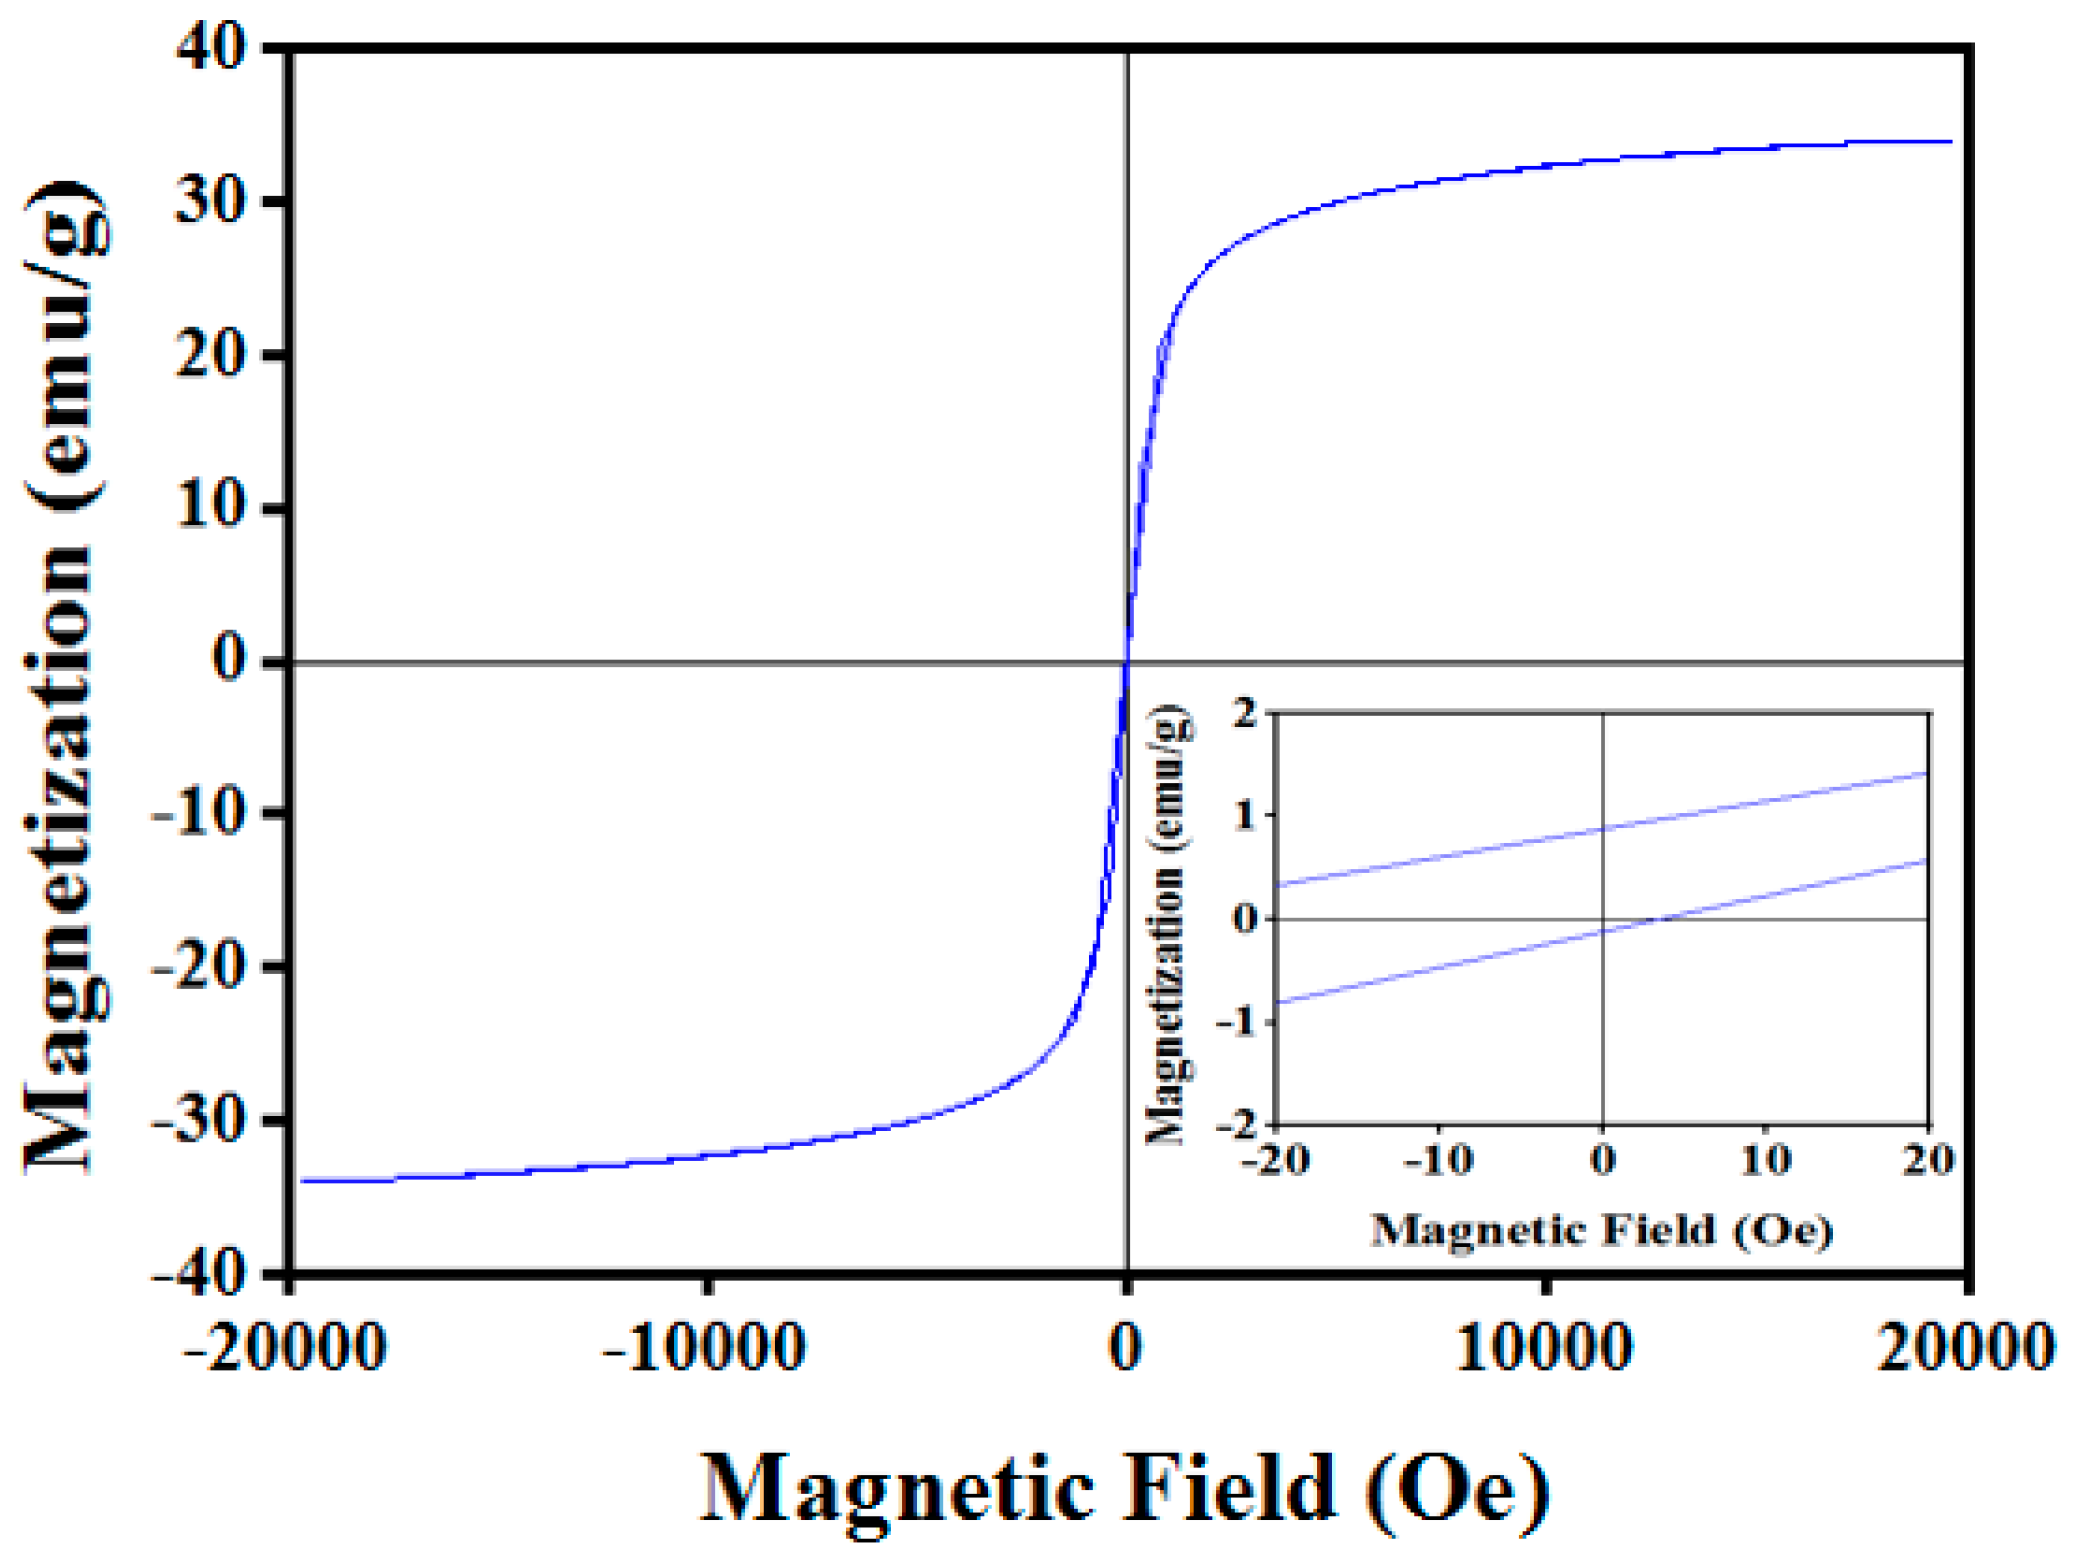
3.2. Magnetic Properties of C-Fe3O4

Figure 6 presents the hysteresis loop of the synthesized C-Fe3O4 nanoparticles. It depicts that the sample possesses remnant magnetization (Ms) value of 33.9 emu/g with coercivity (Hc) value of 17.7 Oe at room temperature. This indicates that the synthesized C-Fe3O4 is composed of small nanoparticles [19]. This magnetic moment confirms that the C-Fe3O4 nanoparticles are ferromagnetic and can be used to attenuate EM waves.

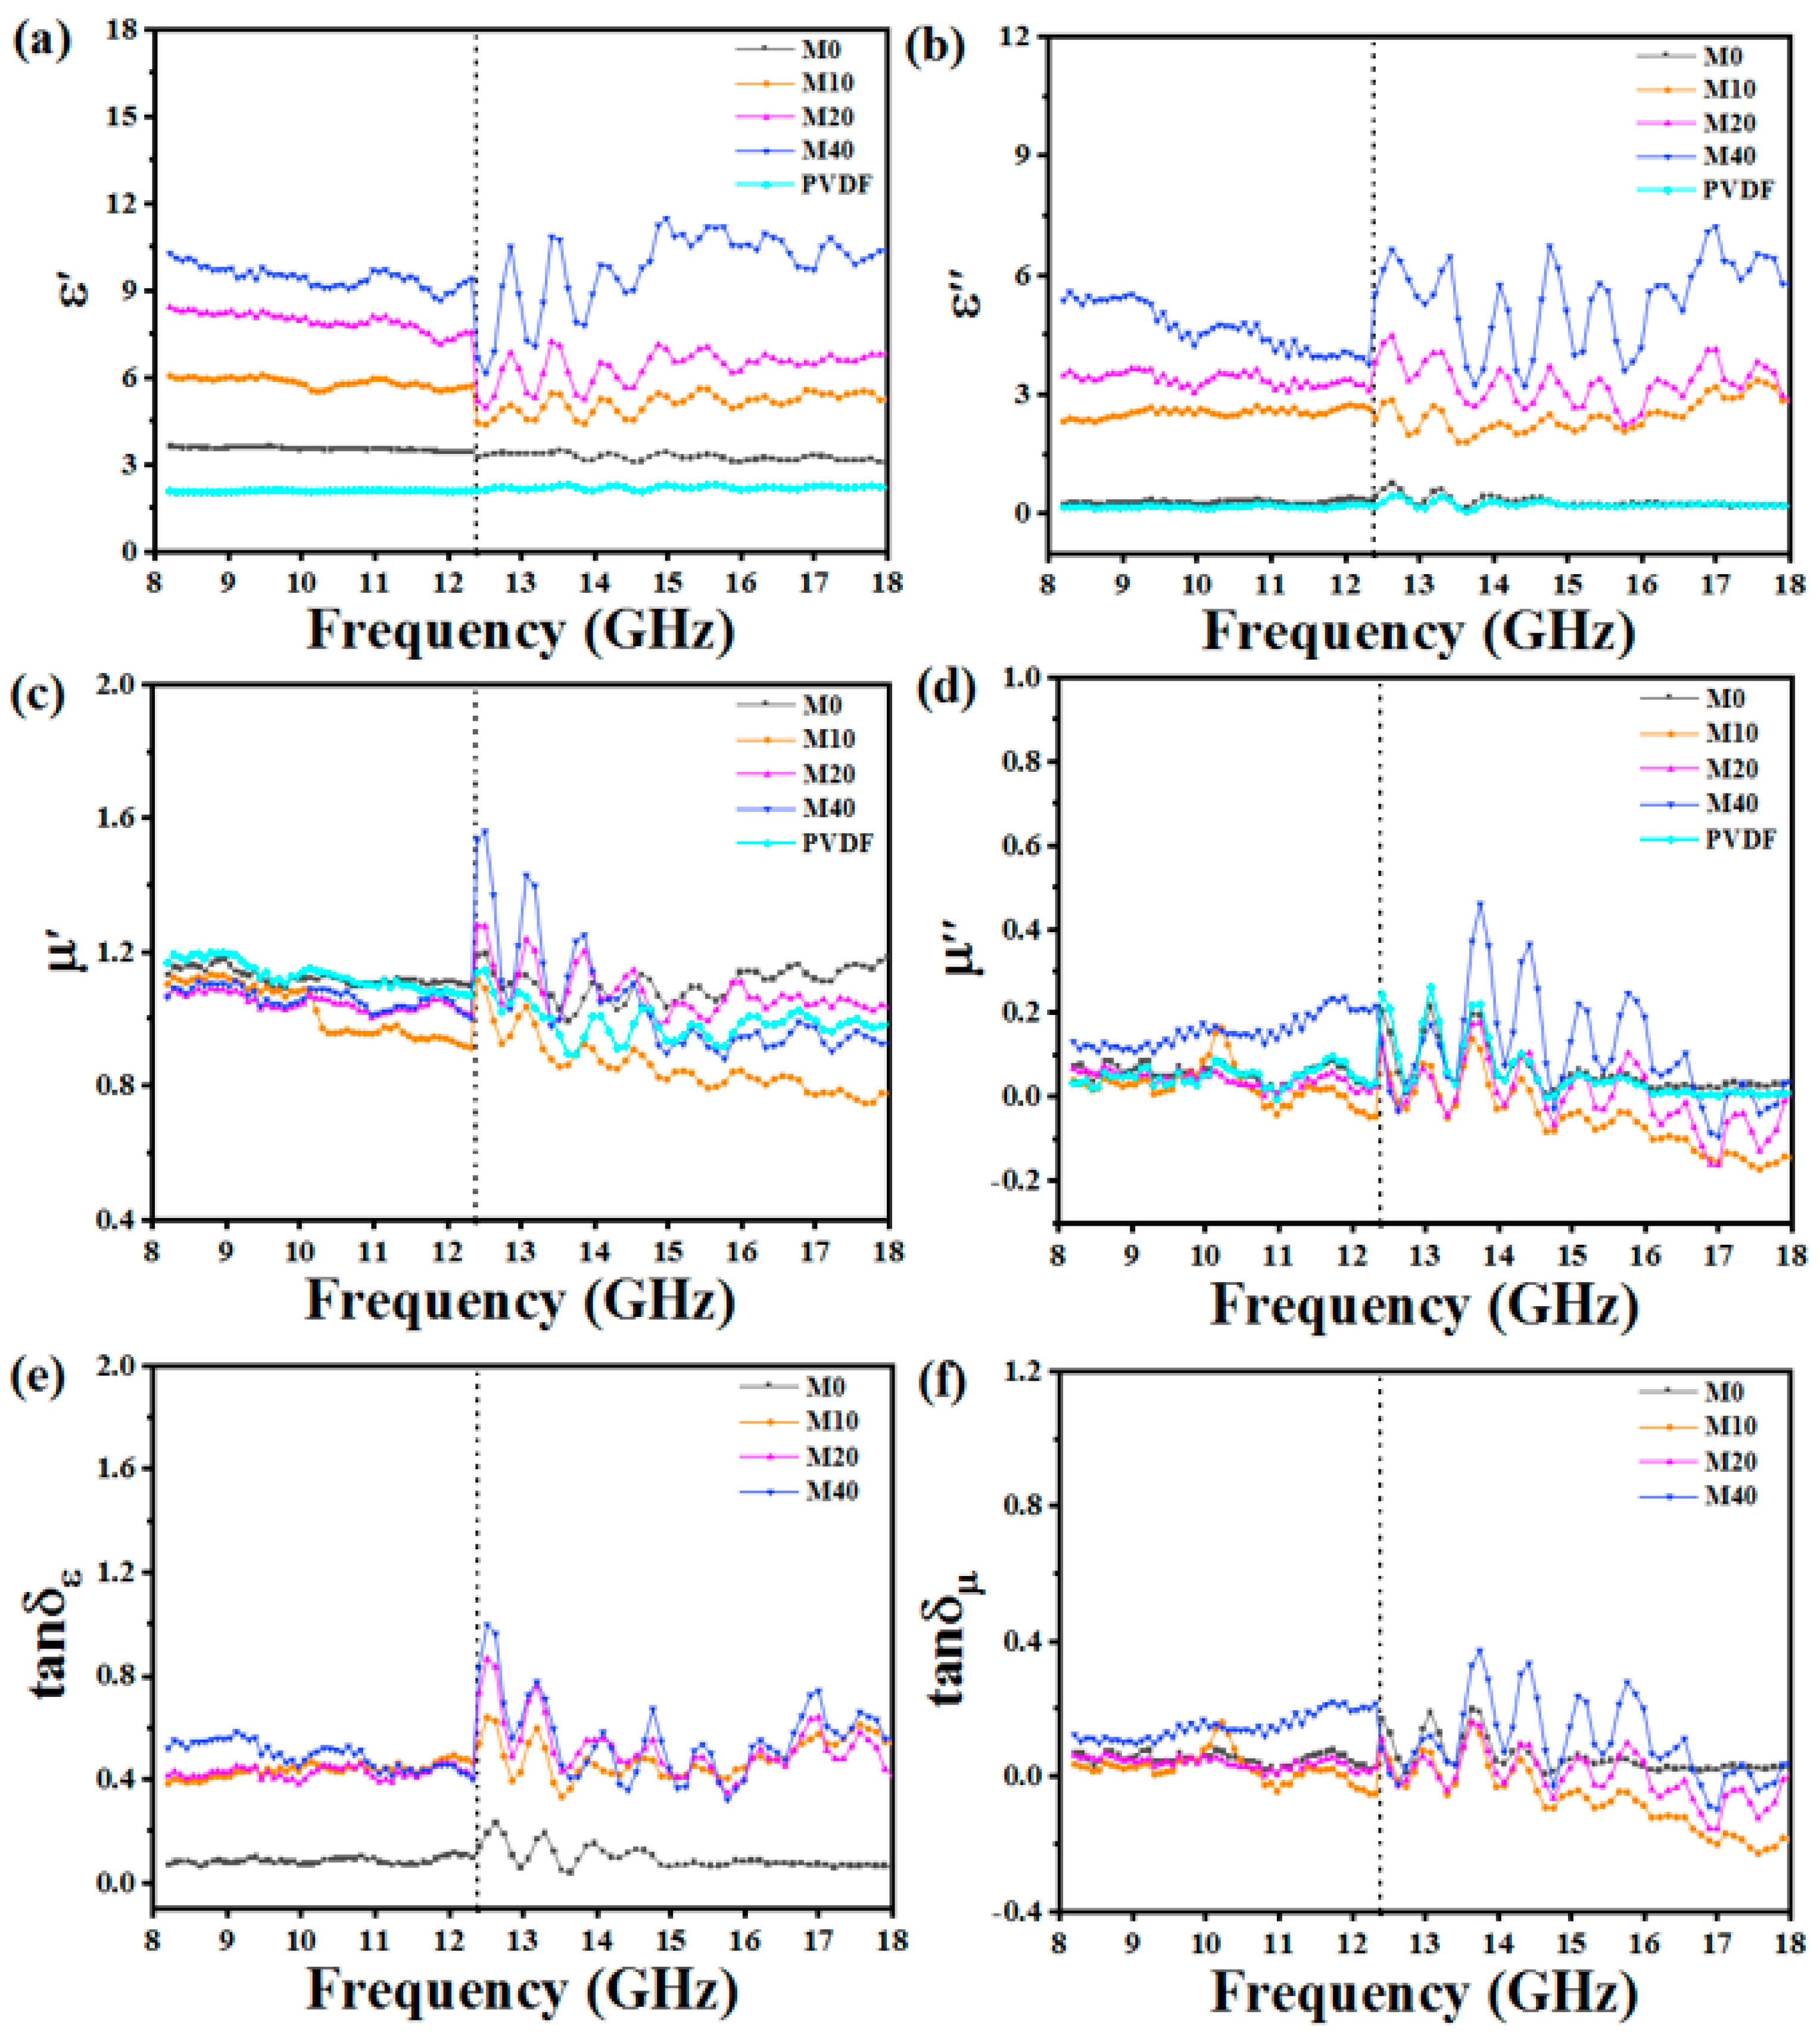
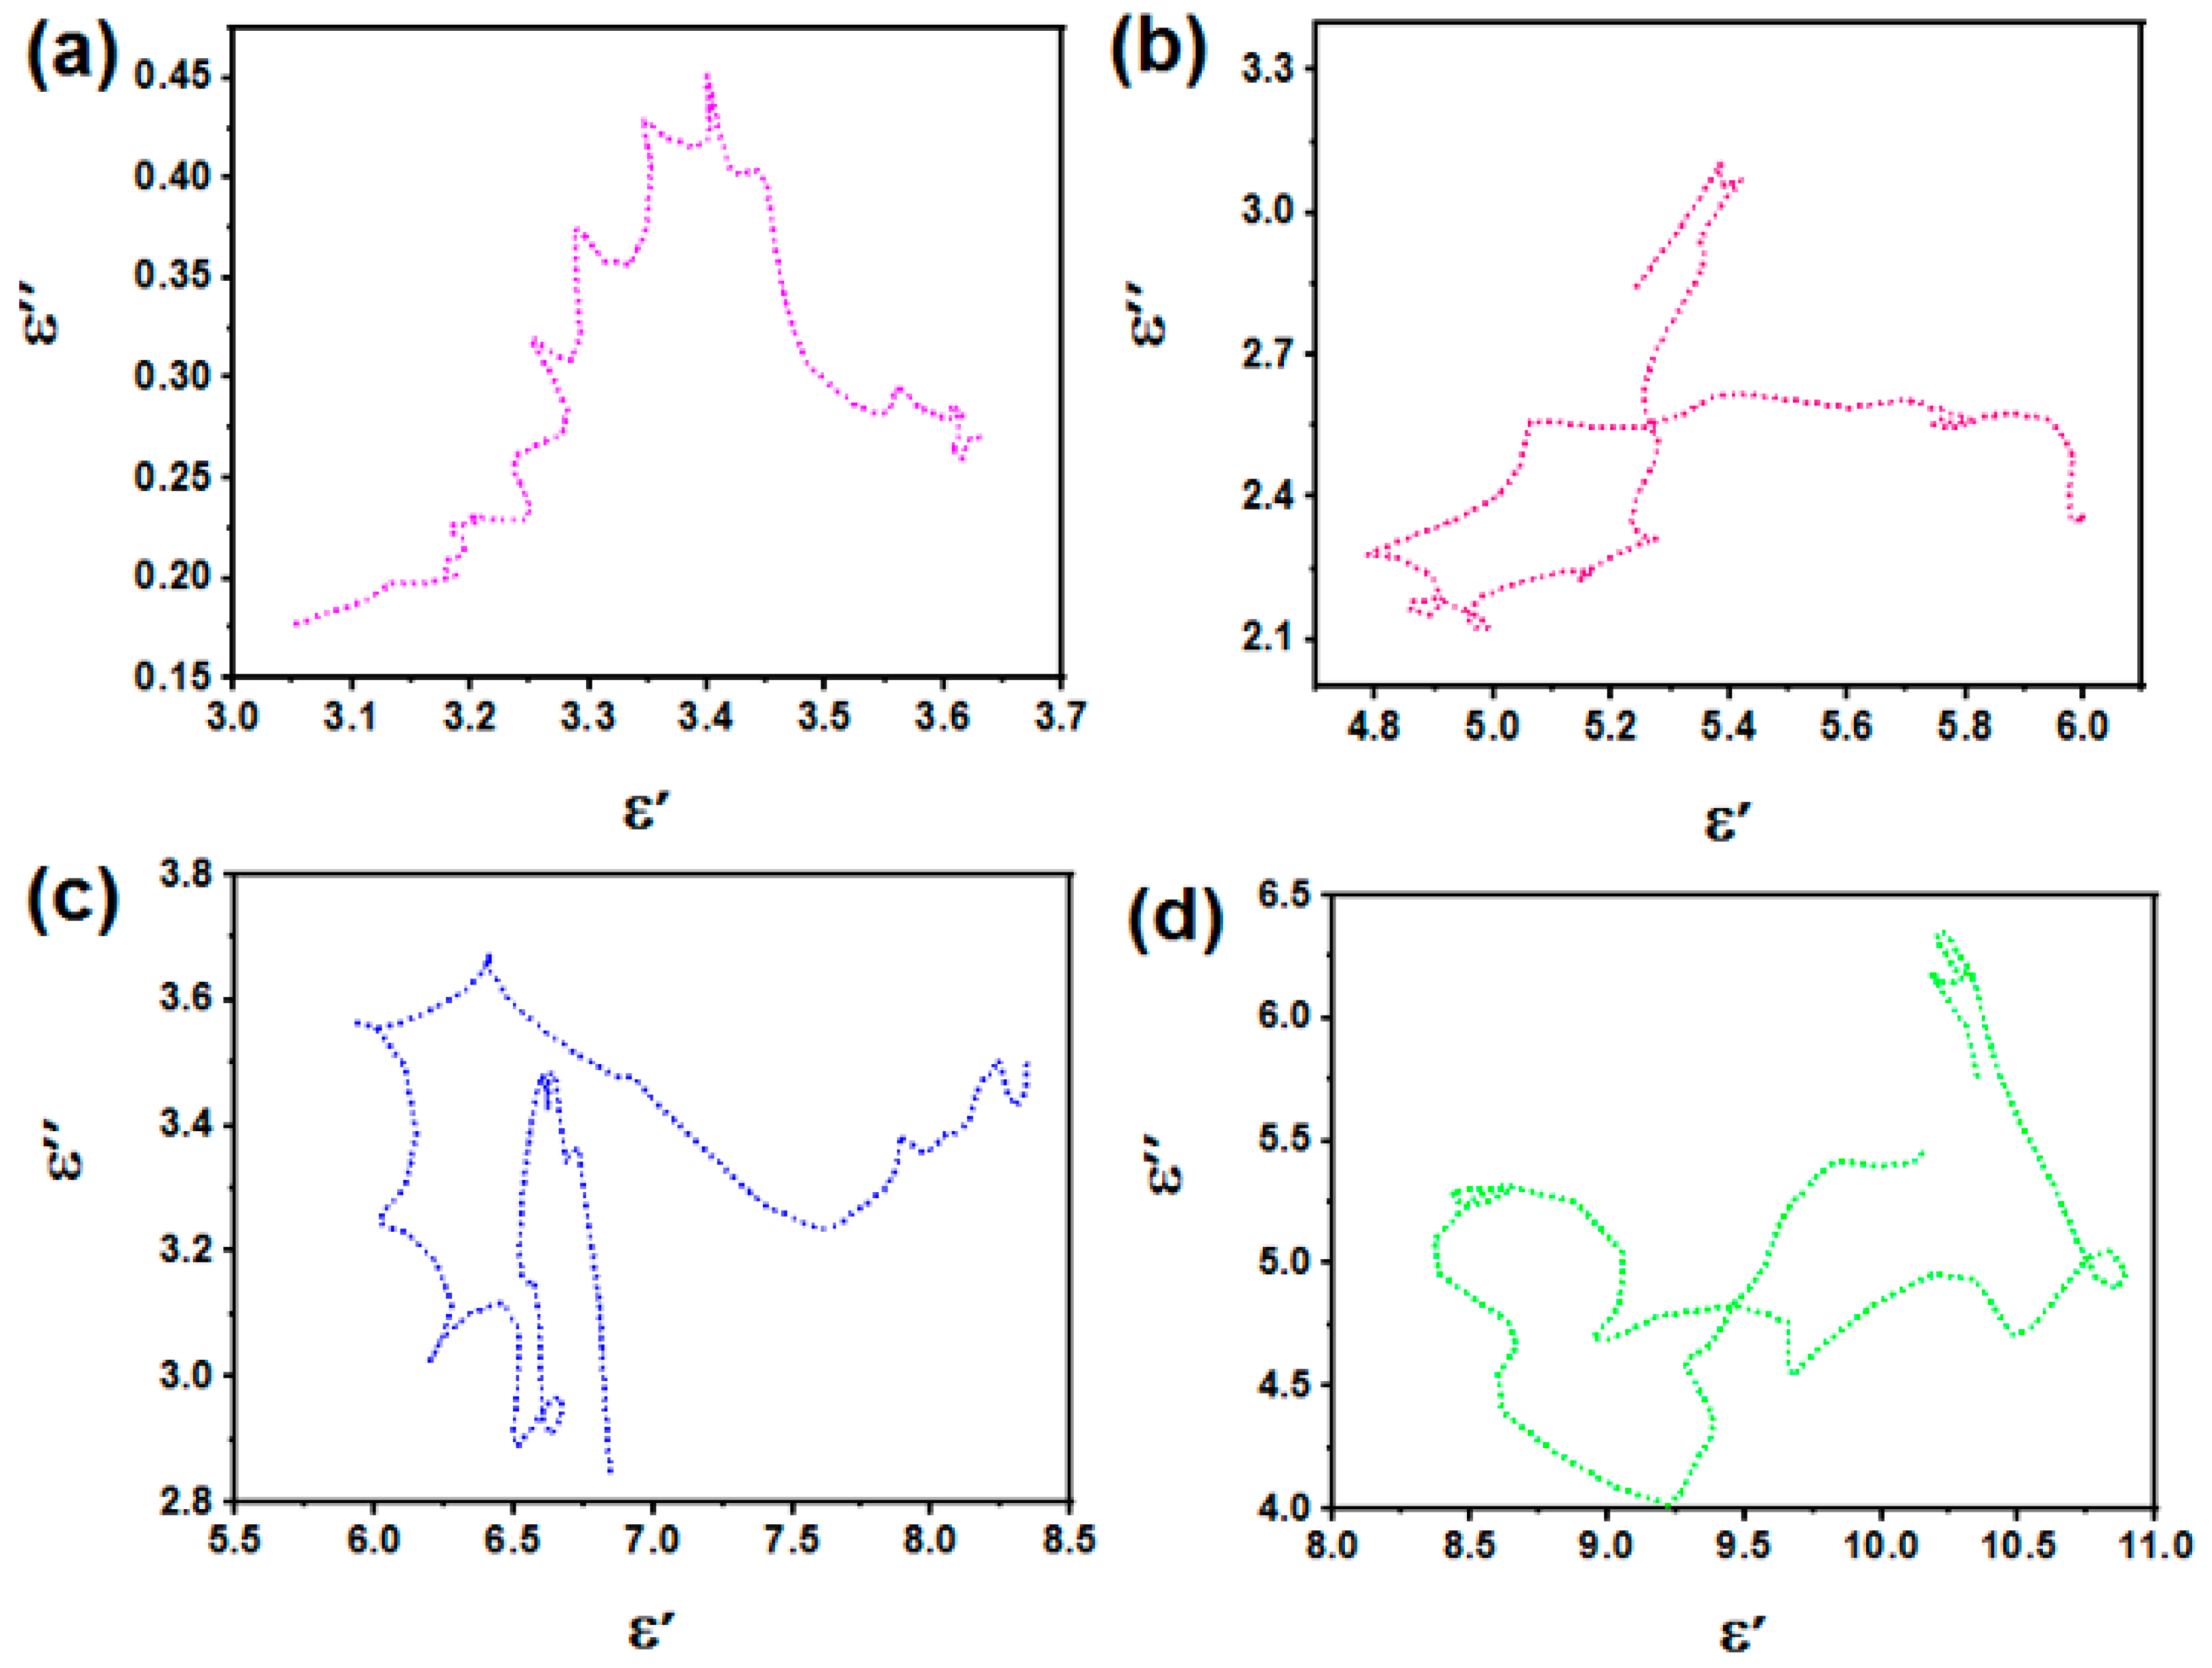
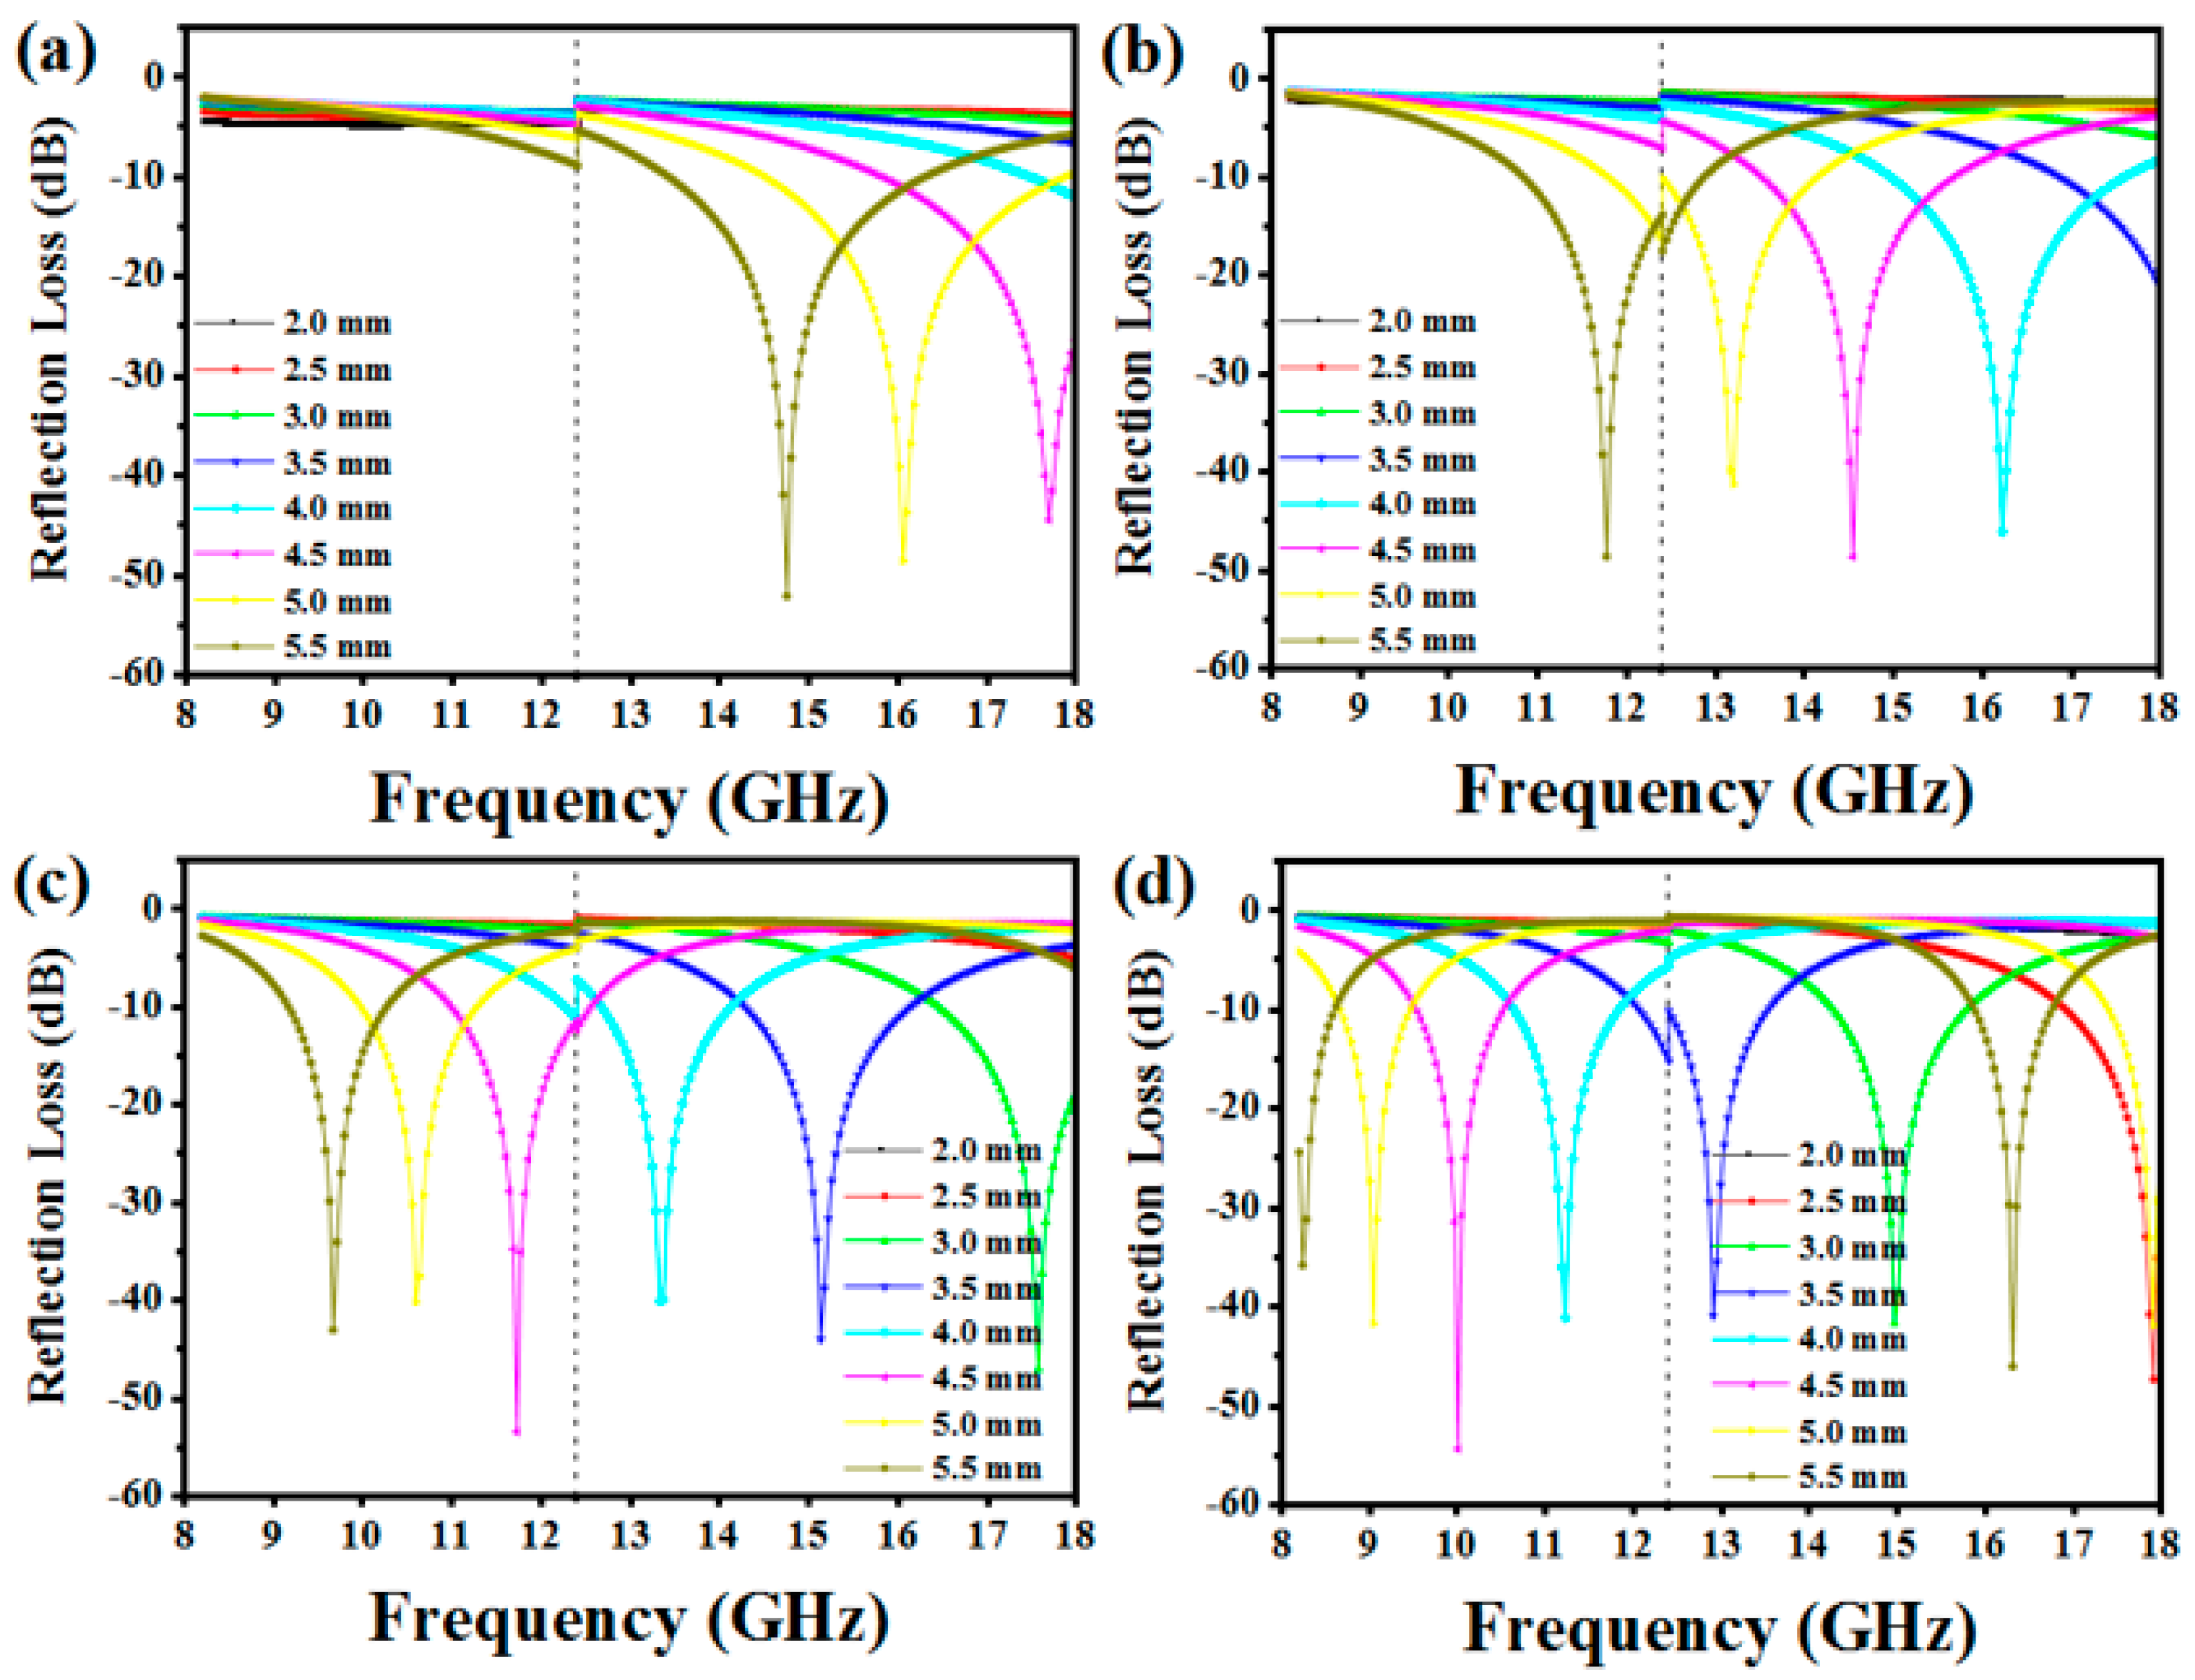
3.3. EM Wave Absorption Properties

The EM properties of all the samples were measured within the frequency range of 8.2–18 GHz. The EM parameters include relative complex permeability ( μ r = µ j µ ) and permittivity ( ε r = ε j ε ) . The real parts of these EM parameters (ε′ and µ′) indicates the electric and magnetic storage ability, while the imaginary parts (ε″ and µ″) are related to the dielectric and magnetic energy dissipation, respectively [20]. An ideal absorptive material is required to possess good impedance matching characteristics, which demands that the material possess optimized EM parameters. As shown in Figure 7a,b, the synthesized C-Fe3O4 has the least ε′ and ε″ among the samples which indicate poor dielectric loss properties. Therefore, the C-Fe3O4 was loaded in PVDF matrix at different percentage loading. The ε′ and ε″ of the composite progressively improved with an increase in the amount of C-Fe3O4 loaded in the PVDF matrix. This enhancement could be associated with improved conductivities, and this alternatively shows consistency with the effective medium theory [21]. Figure 7a shows that the ε′ decreased slowly with an increase in frequency (X-band) showing a distinctive frequency dispersion seen in many Fe3O4-based composites [12,22,23]. Such phenomenon occurs when dipoles could not respond quickly to the high-frequency alternating E-Field, resulting in a decrease in the magnitude ε′ and ε″ [24]. In compliance with the free electron theory,
ε = σ / 2 π ε o f
where f, σ, ε o are the frequency, conductivity, and the dielectric constant of vacuum, respectively. It can be deduced that increase in conductivity (σ) will increase the ε″, and thus favors the absorption of the EM wave [25]. It can be observed that the samples show several resonance peaks, particularly at Ku-band frequency. This behavior can be seen in previous reported Fe3O4-based composites [9,26]. Furthermore, the resonance was observed to rise with an increase in the amount of C-Fe3O4 loaded in the PVDF matrix. This finding suggested that multiple polarization mechanisms occur in the samples with alteration of the EM field frequency [27]. Firstly, electron mobility between Fe2+ and Fe3+ ions as the wave travel within the material can generate dipole polarization. Also, the presence of heterogeneous component with different permittivity and conductivity can generate Maxwell-Wagner polarization often referred to as interfacial polarization [13]. In addition, the porous network and void spaces that exist in the C-Fe3O4 nanoparticles as observed in the FESEM images, can also provide multiple path ways for EM propagation and attenuation. The conjugation of C-Fe3O4 and PVDF increased the degree of polarization which further contributes to higher values of ε″. Hence, since the ε′ and ε″ accounts for EM storage and dissipation, it is clear that the C-Fe3O4/PVDF possesses high dielectric loss ability which would greatly enhance its MAP.
Figure 7c,d presents the µ′ and µ″ values of the samples, which reveals that all samples exhibit moderate magnetic loss ability. The values of µ′ and µ″ are generally lesser in magnitude as compared with the dielectric loss and can be seen to decrease as frequency increases. This abrupt decrease in permeability values of ferromagnetic materials at microwave frequency have been reported in the literature [28,29,30]. This can be explained by the fact that the skin depth for the propagation of the EM field into the materials at these frequencies is generally less than the sizes of the fundamental ferromagnetic domains. Thus, the domain mechanism important for microwave magnetization will breakdown, since the applied field ceases to be effective throughout the volume of a domain [31]. Noticeably, negative values of µ″ are observed as frequency increases. This occurrence could be associated with the conversion of magnetic to electric energy [12]. The µ′ and µ″ were observed to decay towards unity and zero, respectively, as the frequency approaches 12 GHz and beyond, such behavior can be attributed to zero magnetic properties at high frequency [32].
The magnitude of the losses or energy dissipation can be estimated by evaluating the dielectric and magnetic loss tangents (tanδε and tanδµ). Figure 7e,f present the dielectric loss and magnetic loss tangent respectively. General observation shows that the tan δ µ values are generally smaller compared to the tan δ ε . Hence, the dielectric loss is the dominating attenuation mechanism of all samples presented in this study. To analyse the dielectric loss mechanism of the samples, the Debye dipolar relaxation was employed. The complex permittivity according to this model is as follows:
ε r = ε j ε = ε + ε s ε 1 + j ω τ
where τ, ε s , ω = 2πf, ε , denotes the relaxation time, static permittivity, angular frequency, and relative permittivity at the maximum frequency. The ε′ and ε″ can then be described as
ε = ε + ε s ε 1 + ω 2 τ 2
ε = ω τ + ε s ε 1 + ω 2 τ 2
With the above equations, the correlation between ε′ and ε″ can be expressed as
( ε ε s + ε 2 ) 2 + ( ε ) 2 = ( ε s ε 2 ) 2
This model establishes the relationship between (ε′ and ε″), which is termed the Cole-Cole semicircle. It implies that the plot of ε″ against ε′ will exist as a semicircle indicating a polarization process [25]. Figure 8a–d presents the Cole-Cole plots of all samples in the frequency range of 8.2–18 GHz. The plots show obvious several semi-circles, which may be attributed to the nano size of the C-Fe3O4. Meanwhile, the existence of carboxyl and hydroxyl functional groups in the sample as confirmed by the FTIR and EDS analysis could provide additional polarization centers resulting in interfacial polarization that contributes to enhance absorption of EM wave. The abundant hetero-interfaces between C-Fe3O4/paraffin and C-Fe3O4/PVDF and the adsorbed functional groups can also induce strong interfacial polarization and multiple polarization relaxation [13]. The semicircles show several distortions which indicate that an additional loss mechanism (e.g., conduction loss) may be present, resulting in enhanced dielectric loss [33].
The magnetic loss is also an important loss mechanism for Fe3O4-based composites which should be explored. The magnetic loss ( tan δ µ ) often originates from relaxation processes during magnetization, such as domain wall resonance, exchange resonance, natural resonance, hysteresis, and eddy current [7]. Hysteresis loss is mostly insignificant in a low magnetization field, whereas the domain wall resonance typically appear in the frequency range of 1–100 MHz, and therefore can be excluded in this case [34]. Analysis of the dependence of C o = µ ( µ ) 2 f 1 on frequency is often used to investigate magnetic loss from eddy current. Should the magnitude of C o remained constant with increase in frequency, eddy current loss can thus inferred as the dominant magnetic loss mechanism [35]. As shown in Figure 9, the C o values of all samples tend to decrease with an increase in applied frequency which indicates that attenuation of EM wave by magnetic loss mechanism does not result from eddy current resonance. These findings reveal that the magnetic loss comes from natural and exchange resonance.
The magnitude of EM wave absorption represented by reflection loss (RL) of all samples were calculated from Equations (16)–(18) below based on the transmission line theory [25], using the FEM formulation.
RL ( dB ) = 20 log 10 | Г |
Г = Z in Z o Z in + Z o
Z in = Z o ε r μ r tanh ( j 2 π fd c ϵ r μ r )
where Zin, Zo, εr, µr, c, f, d, and Г are the characteristic impedance of the absorptive material, impedance of free space, complex permittivity, complex permeability, the velocity of EM wave propagation in vacuum, microwave frequency, absorber thickness, and the reflection coefficient, respectively. Generally, RL value of −10 dB or −20 dB correspond to 90% or 99% EM wave absorption, respectively [36]. The range of frequency equivalent to this reflection loss (RL < −10 dB) in a single absorber thickness can be regarded as the effective absorption bandwidth (EAB) [20]. The variation of the RL curves of all samples at layer thicknesses in the range 2.0–5.5 mm from 8.2–18 GHz is presented in Figure 10. The absorption coefficient of the samples strongly depends on the filler loadings. As presented in Figure 10a, sample M0 (i.e., ordinary C-Fe3O4) displayed poor absorption over the X-band frequency range and some EM wave absorption capacity at large thickness in the Ku-band frequency range. This finding confirms large density (≥50 wt.%) and high thickness (≥5.0 mm) as drawbacks of Fe3O4. As such, composites formation with PVDF as a dielectric matrix was employed to regulate its EM parameters and optimize its MAP. Logically, the MAP of M10 (Figure 10b) is improved as compared with C-Fe3O4. Within X-band, minimum RL value −48.6 dB at a large absorber thickness of 5.5 mm was achieved at 11.7 GHz. At Ku-band, minimum RL of −46.1 dB at 16.2 GHz was achieved at a reduced absorber thickness (4.0 mm), with an operating bandwidth of 2.4 GHz. The MAP improved significantly with M20 and M40 (Figure 10c,d) with the operating bandwidth spanning the whole X-band and Ku-band frequency range. Furthermore, with M40 the optimal thickness can effectively be reduced to 2.5 mm, with minimum RL of −47.3 dB at 17.9 GHz. Table 1 presents the EM absorption properties of some Fe3O4-based absorbers reported in the literature. The composite reported in this work displayed enhanced MAP as compared with those reported works.
The EM wave attenuation coefficient which describes the capability of the absorptive material to rapidly attenuate and dissipate EM wave via its inherent magnetic and dielectric loss power can be measured by the attenuation constant (∝) [25].
  = 2 π f c × ( µ ε µ ε ) + ( µ ε µ ε ) 2 + ( µ ε + µ ε ) 2
Figure 11 clarifies that the attenuation of the samples intensifies with increase in C-Fe3O4 in the PVDF matrix. The samples possess moderate attenuation with M40 displaying the highest attenuation which favors the absorption of EM wave. This finding reveal that combined moderate attenuation and good impedance matching promotes the EM wave absorption reported in this study.

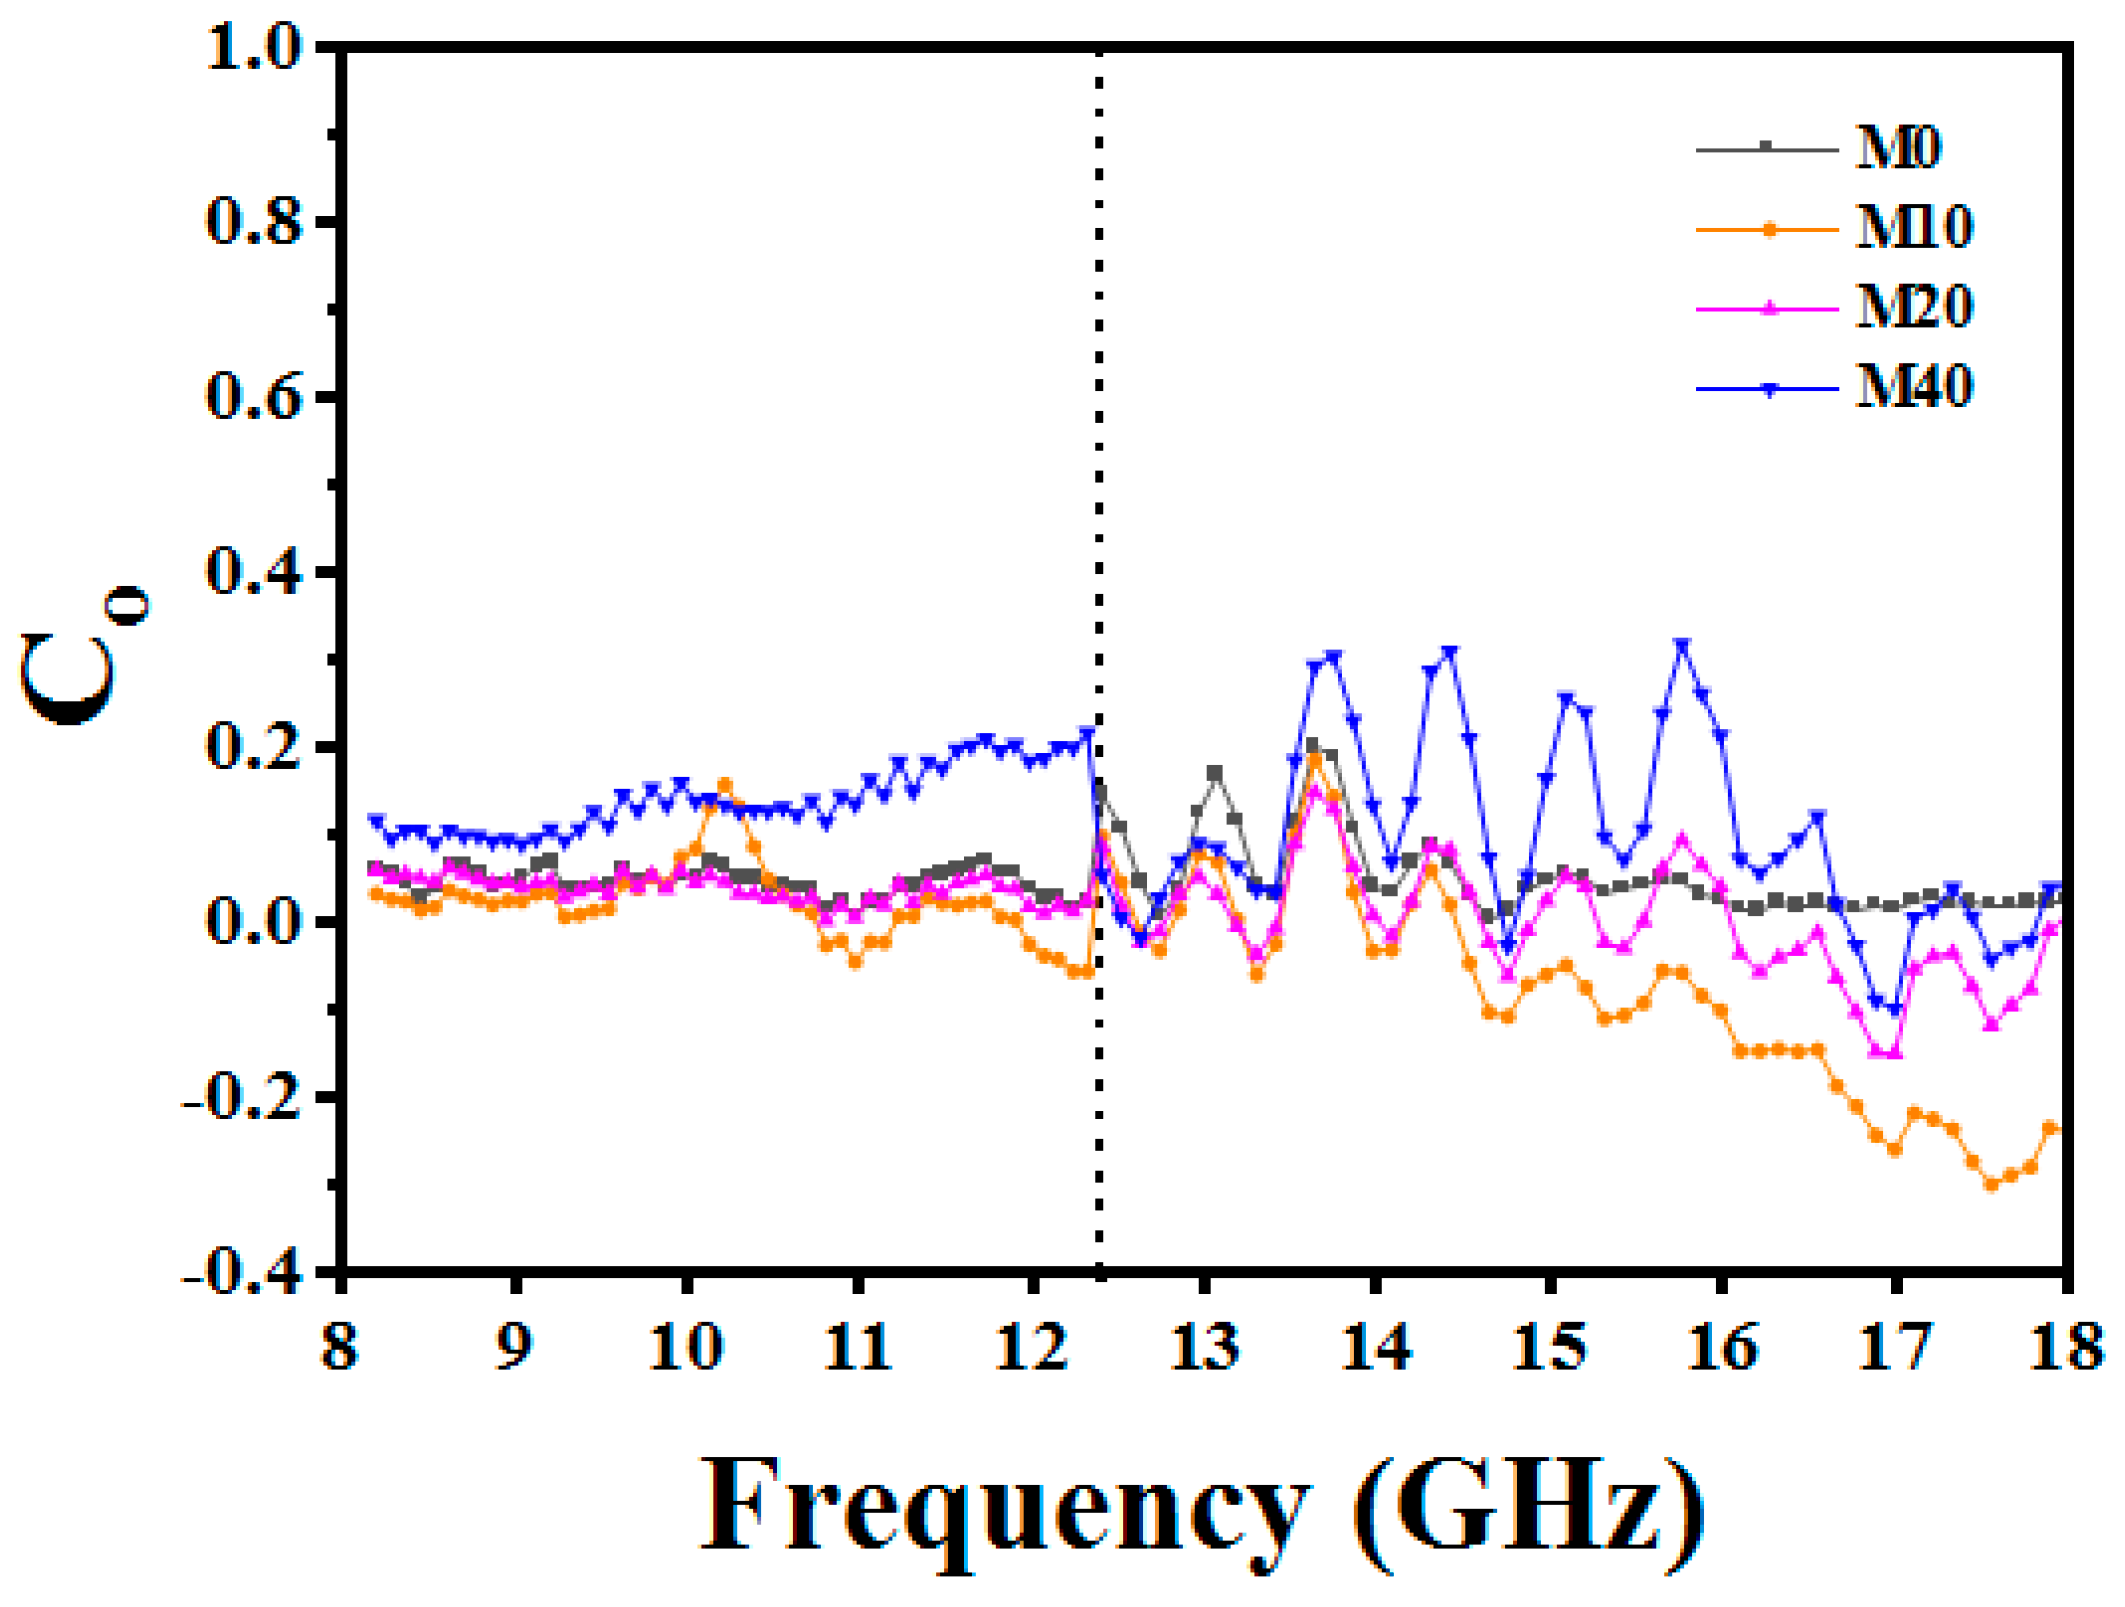
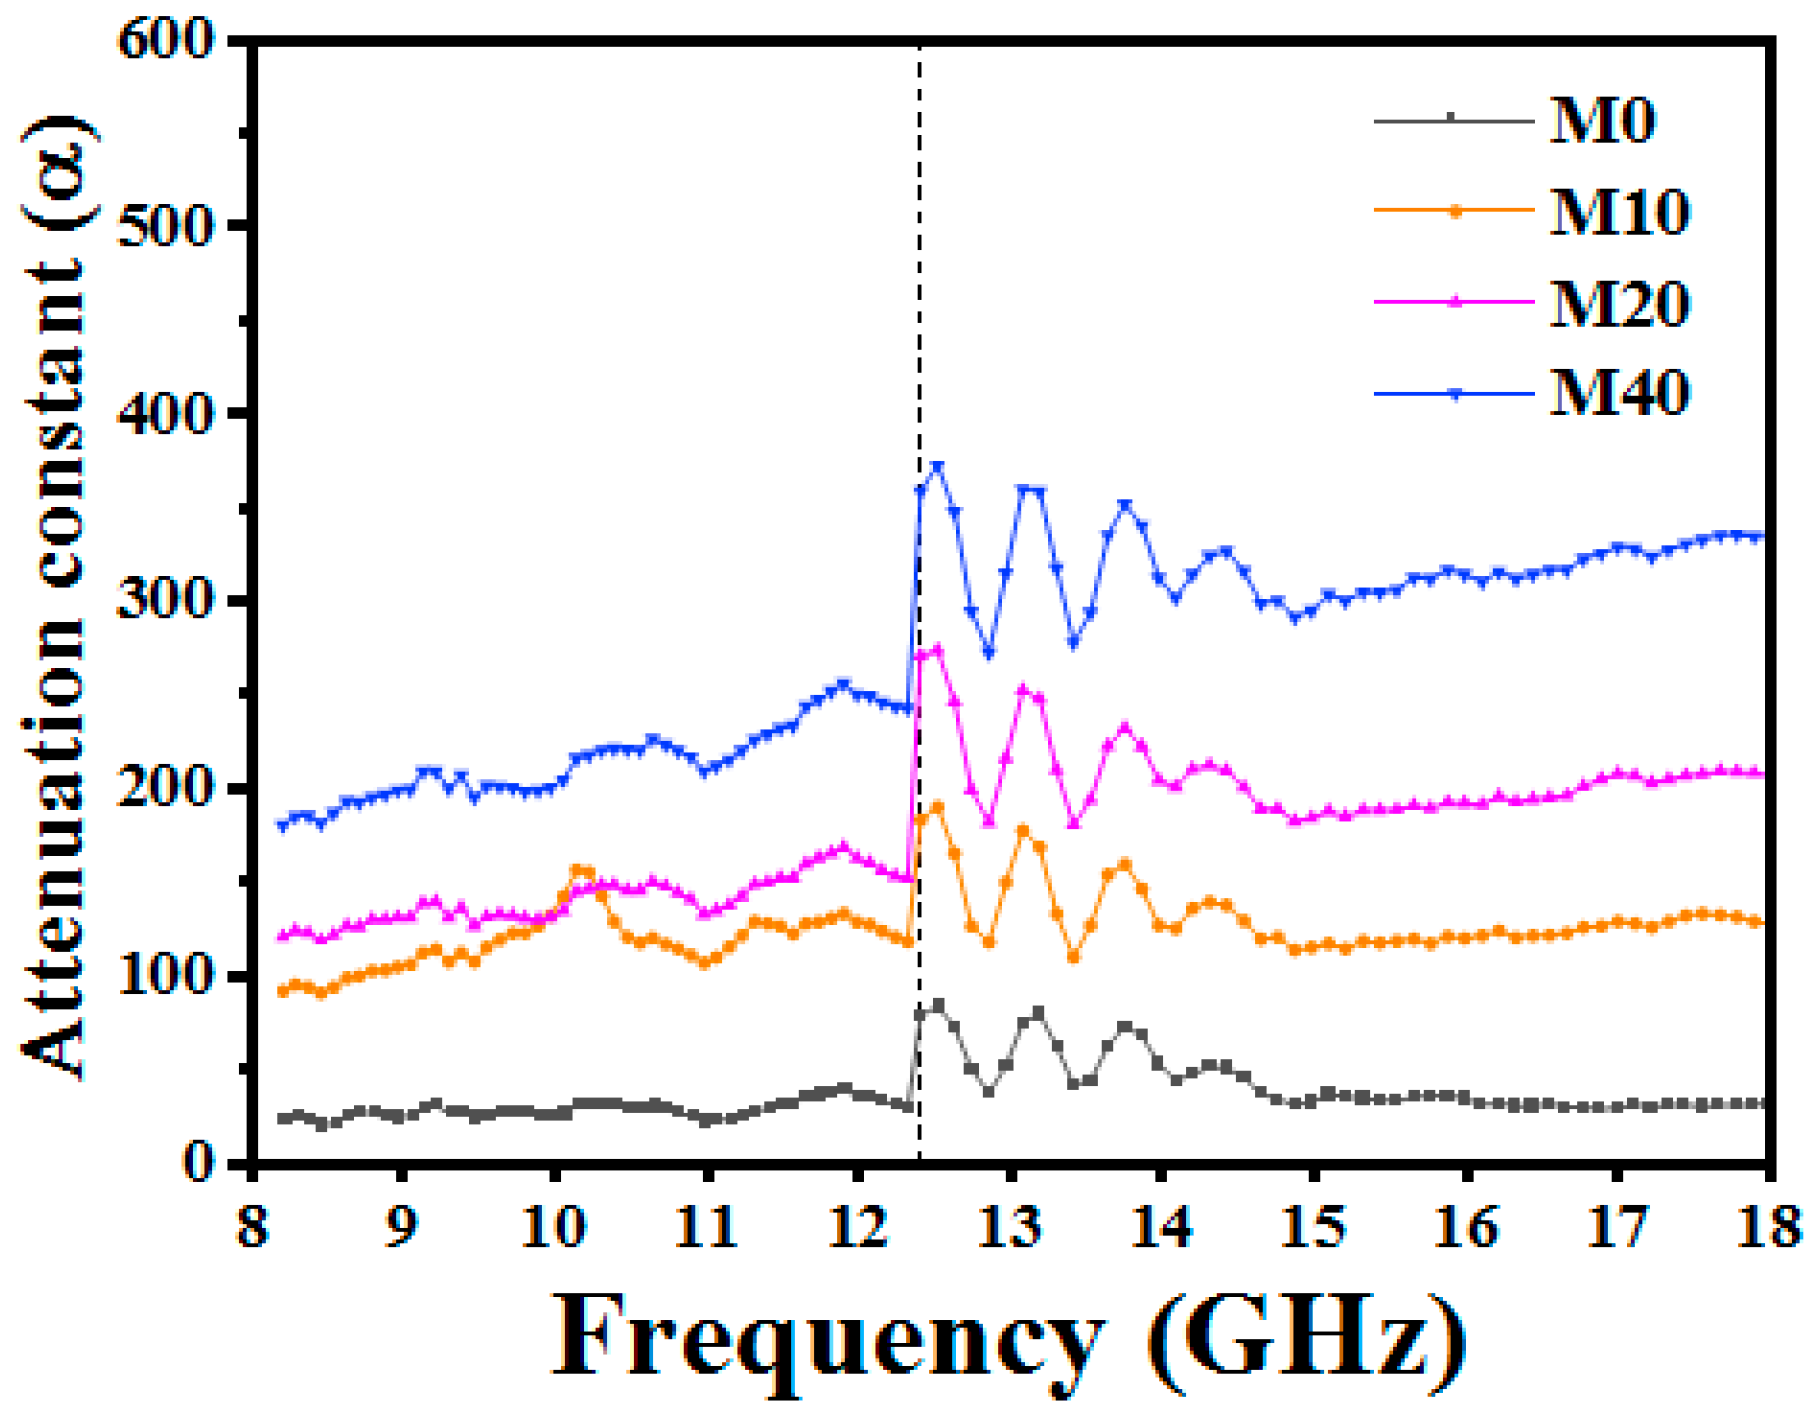
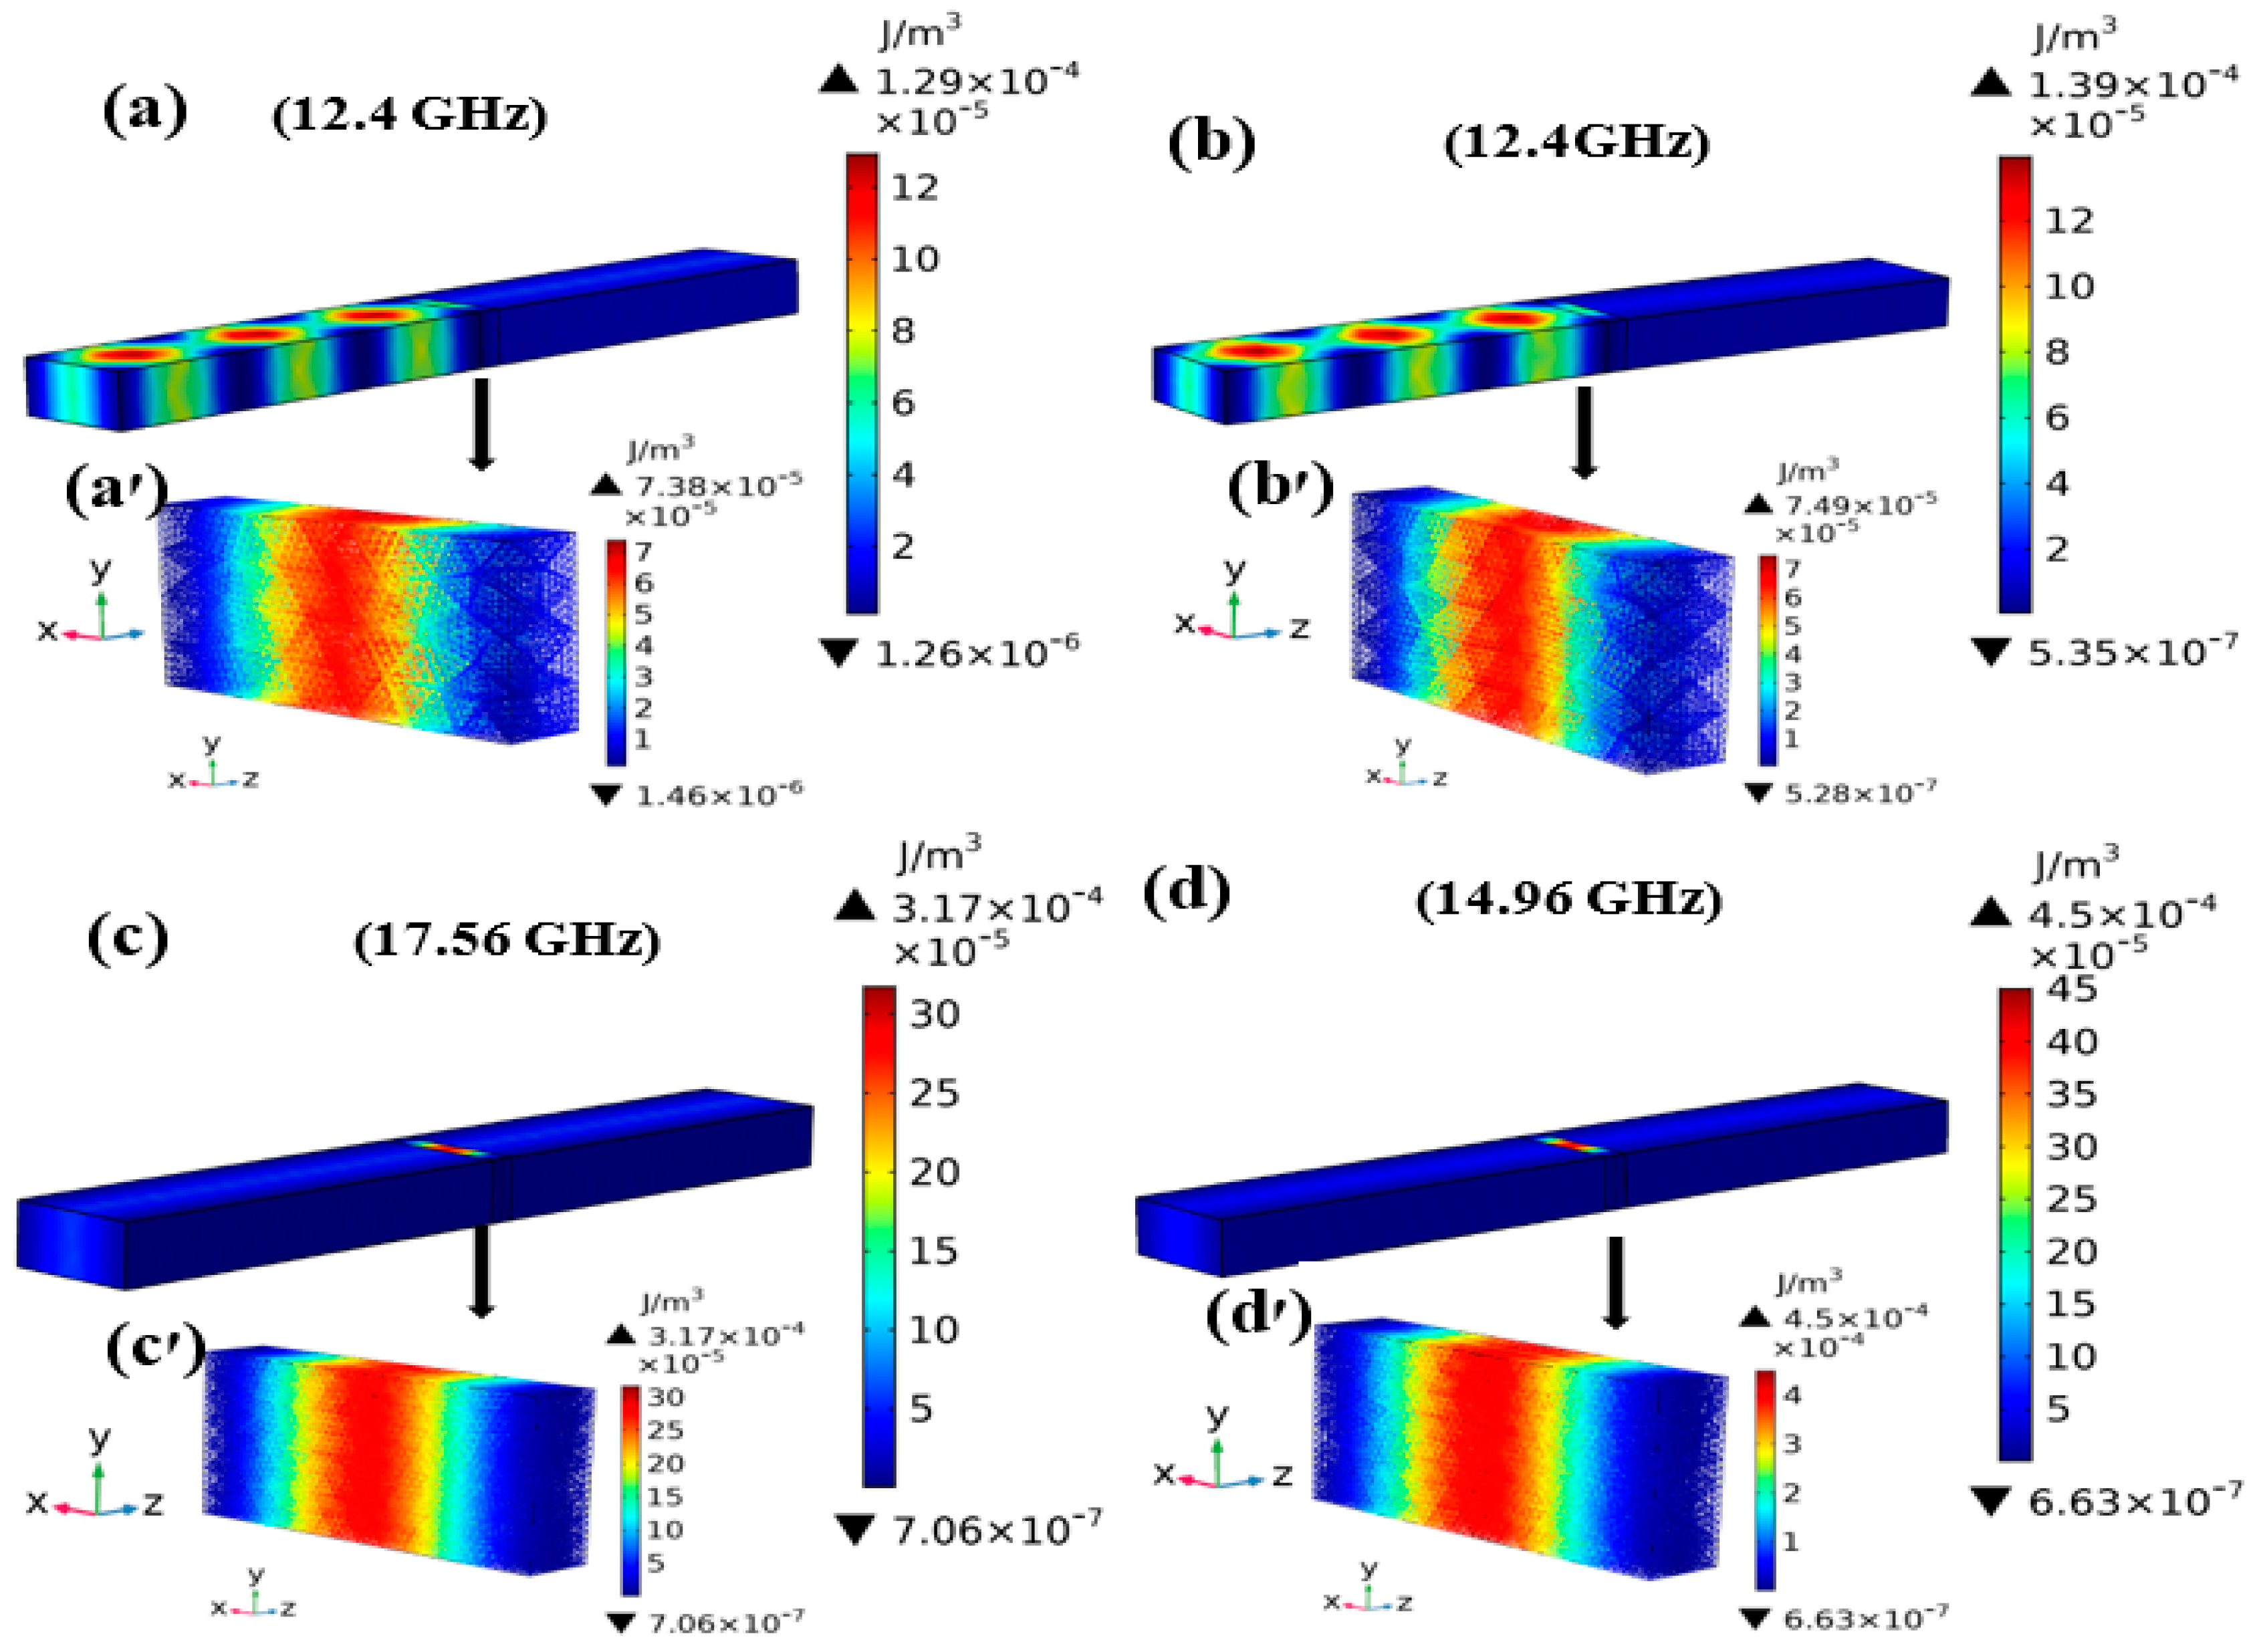
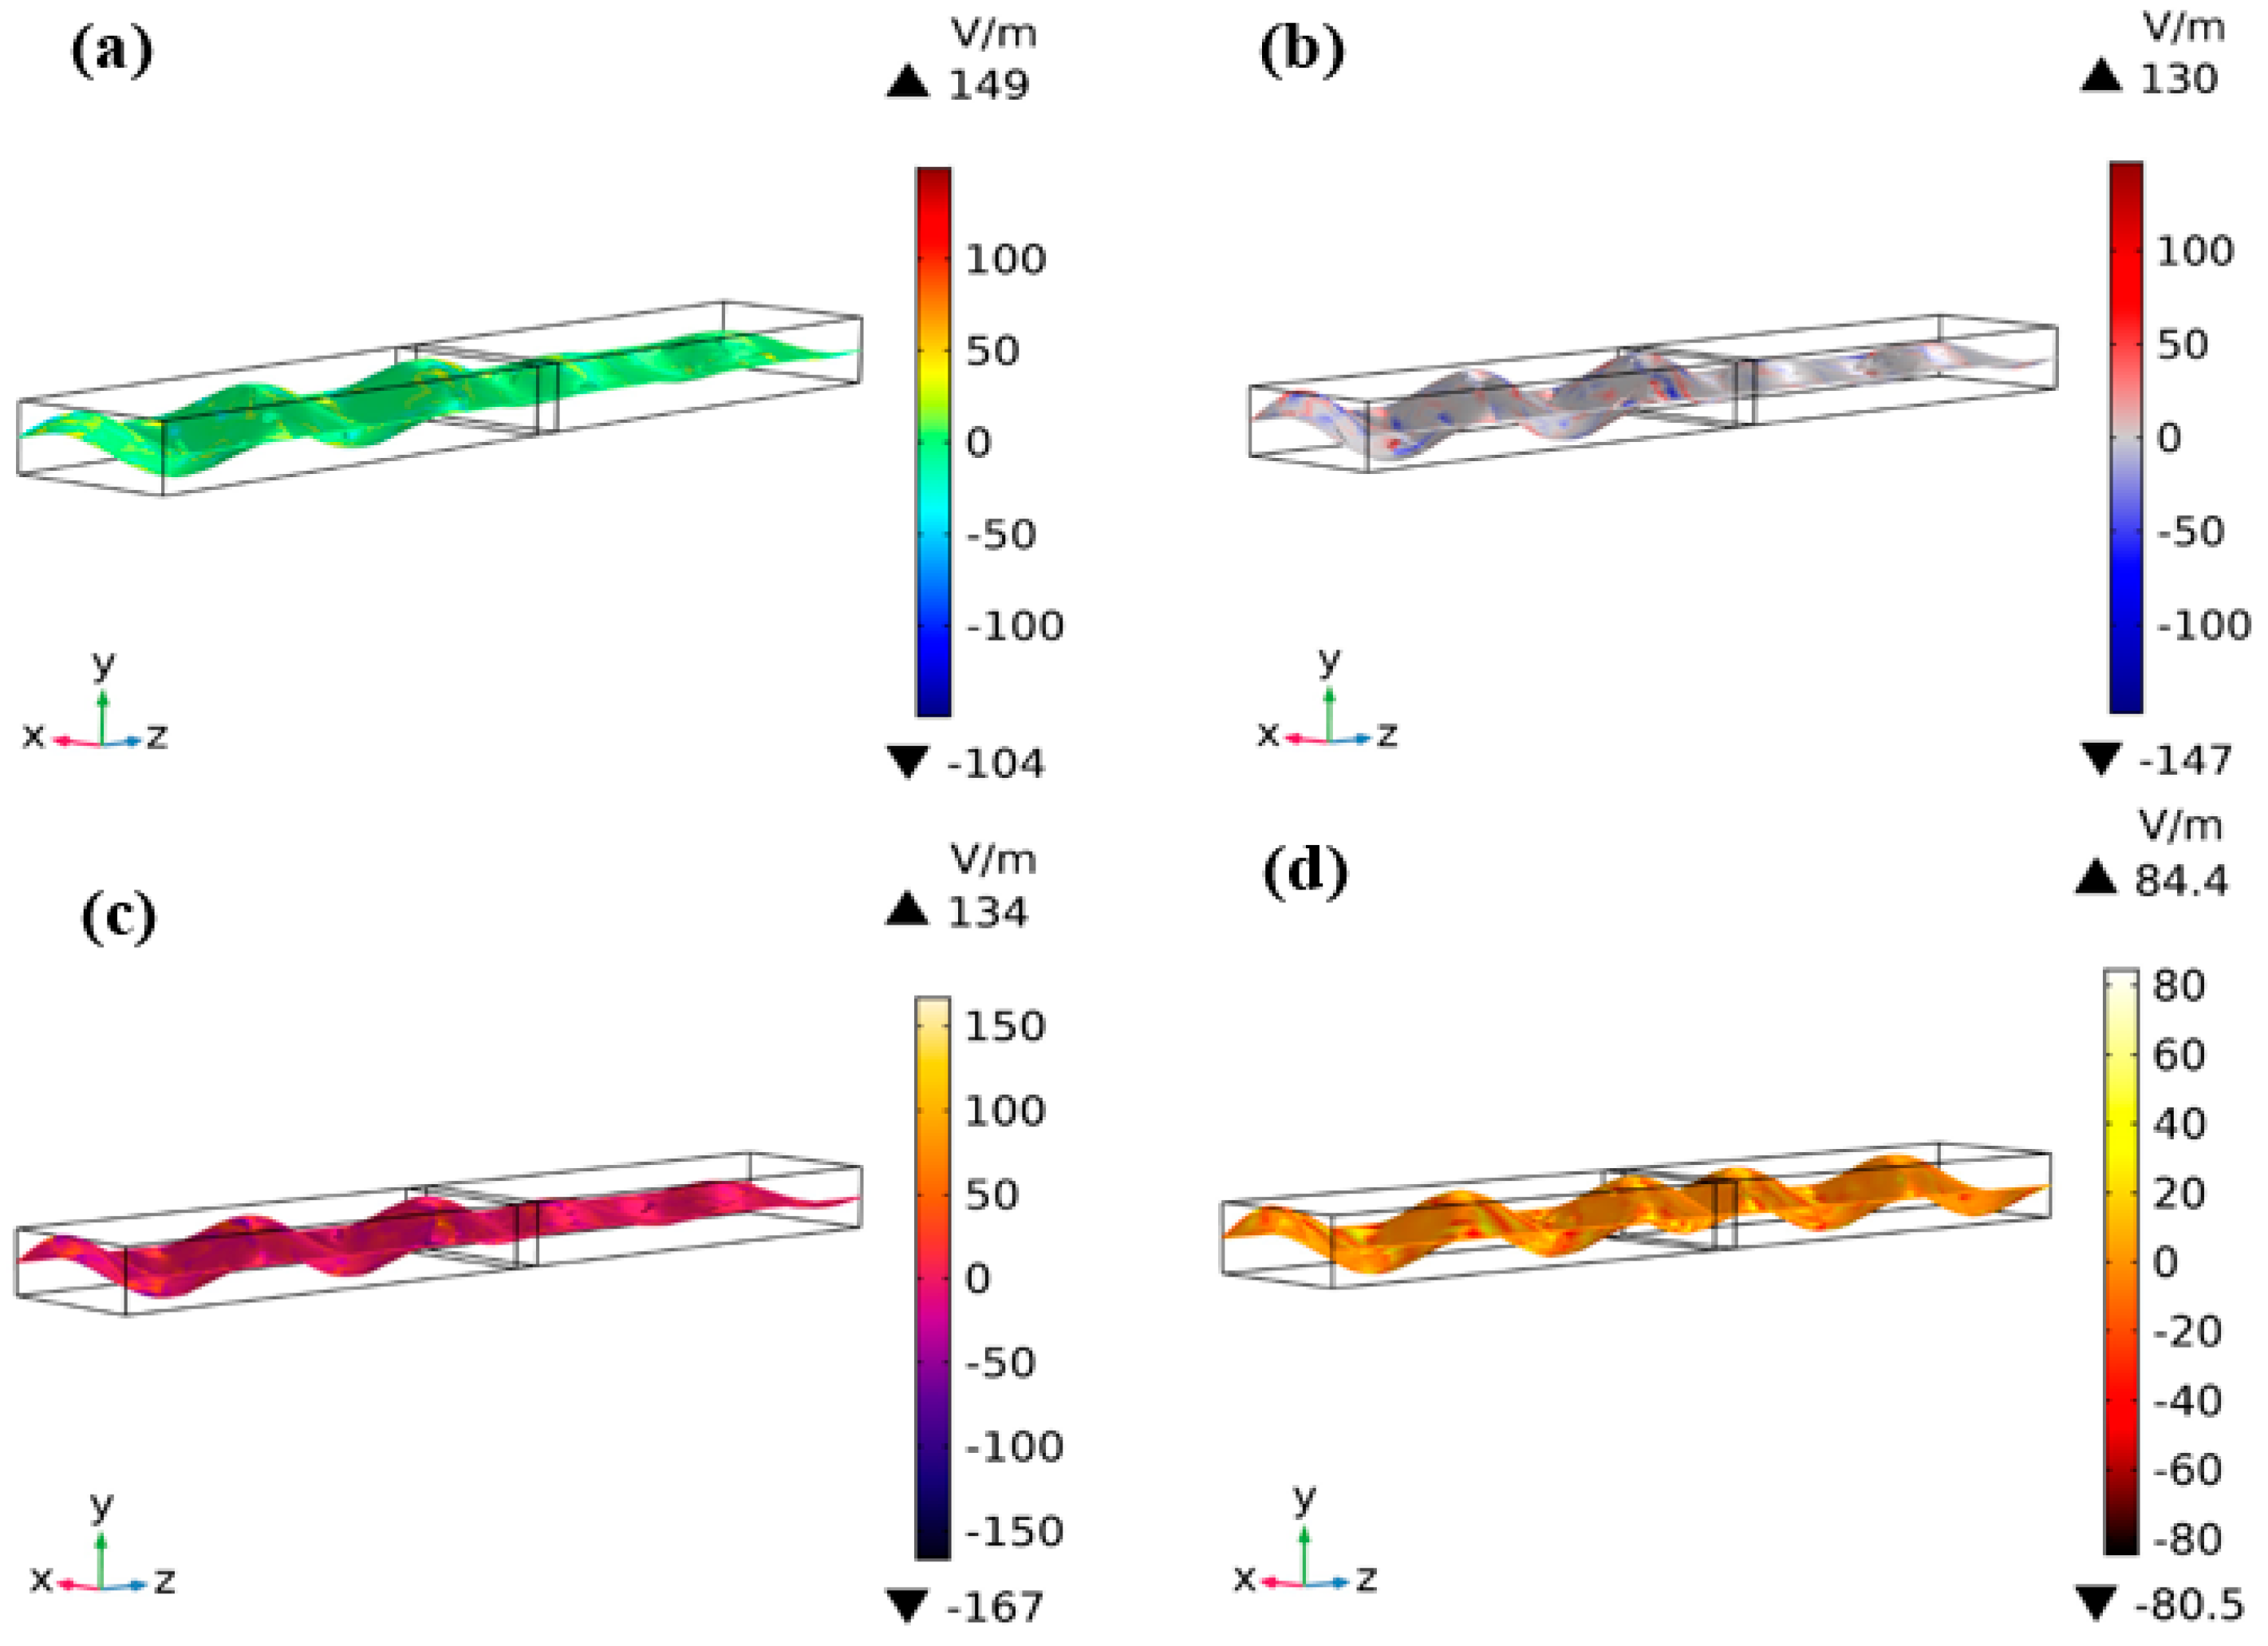
3.4. E-Field Distribution and EM Energy Density Analysis

The E-Field distribution within a rectangular waveguide with the sample properties was studied. As stated earlier, the propagating mode employed in this work is the TE10 mode, and as such the direction of the propagating wave will be along the z-direction of the waveguide as presented in Figure 12. The figure shows the 3D slice plot of the z-component of the E-Field within the simulated rectangular waveguide at X-band frequency for all samples at a thickness of 4.0 mm. The significant differences in the propagated E-Field intensity through mediums of different refractive index at 11.2 GHz can be seen. For M0 (Figure 12a) the maximum amplitude of the E-Field at a point within the waveguide is 149 V/m. When the EM wave was excited from port 1, large fractions of the propagated EM wave was reflected at S1, indicating large reflection coefficient at the interface. Similarly, M10 and M20 (Figure 12b,c) also displayed the same high reflectivity at the presented thickness and frequency. This could be attributed to mismatch of impedance resulting in a small fraction of the wave propagating into the sample. In contrast, a large amount of the propagated E-Field transmits through M40 (Figure 12d) from region I to region II of the waveguide. This indicates low reflectivity at the boundary, resulting from a good match of impedance between the material’s interface and free space resulting in minimum RL value of −42 dB.
To further investigate the reflection coefficient at the interface (plane S1), the density of the EM energy that transmits into the sample loaded in the waveguide was studied and presented. Figure 13 shows the 3D volume plot of EM energy density of the simulated waveguide at a thickness of 3 mm and selected frequencies. For M0 and M10, the magnitude of the EM energy within the waveguide at 12.4 GHz are 129 µJ/m3 and 139 µJ/m3, respectively (Figure 13a,b). The EM energy within the region filled with samples was less dense, calculated as 73.8 µJ/m3 and 74.9 µJ/m3 (Figure 10a′,b′), with poor RL value of −2.3 dB and −1.5 dB respectively. Whereas, the density of the EM energy within the waveguide loaded with M20 was 316 µJ/m3 (Figure 13c), while for M40 the density of the EM energy was 450 µJ/m3 (Figure 13d). As evident in Figure 13c′,d′, the total EM energy evaluated for the region filled with the samples are 317 µJ/m3 and 450 µJ/m3, respectively indicating almost zero reflection at the interface. Within this region, the samples would attenuate the EM wave and dissipate the EM energy and/or convert it to heat by their intrinsic dielectric and magnetic loss mechanism. This validates the enhanced MAP achieved with M20 and M40 with RL value of −47 dB and −41 dB, respectively which corresponds to 99.9% EM wave absorption. These findings reveal a directly dependent relationship between the density of EM energy within an absorptive material and the magnitude of the EM wave absorption. An efficient absorptive material is thus required to possess a low reflection coefficient, which requires good impedance matching characteristics and proper attenuation ability to dissipate the EM wave. The EM absorption of C-Fe3O4/PVDF reported herein can be described in terms of mutual benefits of magnetic loss from C-Fe3O4 and dielectric loss from the PVDF matrix. As Fe3O4 nanoparticle exists in the single domain at the nanoscale, more energy will be absorbed by the ferromagnetic resonance. Also, the great surface effect of the C-Fe3O4 at the nanoscale would influence its anisotropy coefficient and damping parameters [36], thus increasing its MAP. The interfaces between Fe3O4 and adsorbed functional groups, air, and PVDF also promotes interfacial polarization giving rise to improved dielectric relaxation and enhanced EM wave absorption. As a result, of the superior MAP displayed by the M40 sample, it can be inferred that the optimal loading of C-Fe3O4 in the PVDF matrix is 40 wt.%.

4. Conclusions

C-Fe3O4 nanoparticle was successfully prepared using co-precipitation method and embedded in PVDF matrix. COMSOL multiphysics based on FEM was adopted to investigate the MAP and analyze the E-Field distribution. The sample containing 40 wt.% loading of C-Fe3O4 in the PVDF matrix exhibits good MAP. Minimum RL value of −47.3 dB was achieved at an optimal thickness of 2.5 mm. The operating bandwidth spans the whole X-band and Ku-band frequency range with tunable absorber thickness of 2.5–5.5 mm. Analysis of the electric field distribution reveals that low reflectivity is the basic prerequisite to ensure large magnitude of EM wave propagate through the material interface and promote the EM wave absorption. The study of the EM energy density also validates the high absorption coefficient achieved in this work. The MAP can be accredited to good impedance matching, interfacial polarization and great attenuation ability resulting from high dielectric and magnetic loss mechanism.

Supplementary Materials

The following are available online at https://www.mdpi.com/2076-3417/9/18/3877/s1, Figure S1: VNA measurement experimental set-up.

Author Contributions

Conceptualization, H.S. and N.Y.; Data curation, A.T.R. and F.A.W.; Methodology, L.L.A., H.S. and F.A.W.; Software, L.L.A. and A.T.R.; Writing – original draft, L.L.A.; Writing – review & editing, Z.A.

Funding

This research is funded by Yayassan Universiti Teknologi Petronas (YUTP) grant with cost centre 015LC0-143.

Acknowledgments

The authors wish to acknowledge the support of Yayasan Universiti Teknologi PETRONAS (YUTP) research grant through cost centre 015LC0-143, and Universiti Teknologi PETRONAS graduate assistant scheme.

Conflicts of Interest

The authors declare no conflict of interest.

References

  1. Yadav, P.; Rattan, S.; Tripathi, A.; Kumar, S. Swift heavy-ions irradiated Nano-magnetite/Exfoliated-nanographite/Polymethylmethacrylate nanocomposites with excellent microwave-absorption performance. Mater. Lett. 2019, 253, 222–225. [Google Scholar] [CrossRef]
  2. Melvin, G.J.H.; Zhu, Y.; Ni, Q.Q. Nanomaterials: Electromagnetic Wave Energy Loss. In Nanotechnology: Applications in Energy, Drug and Food; Springer International Publishing: Cham, Switzerland, 2019; pp. 73–79. [Google Scholar]
  3. Zou, T.; Wu, Y.; Li, H. Electromagnetic and microwave absorbing properties of carbon-encapsulated cobalt nanoparticles. Mater. Lett. 2018, 214, 280–282. [Google Scholar] [CrossRef]
  4. Shu, R.; Zhang, G.; Zhang, J.; Wang, X.; Wang, M.; Gan, Y.; Shi, J.; He, J. Synthesis and high-performance microwave absorption of reduced graphene oxide/zinc ferrite hybrid nanocomposite. Mater. Lett. 2018, 215, 229–232. [Google Scholar] [CrossRef]
  5. Lv, L.; Liu, J.; Liu, H.; Liu, C.; Lu, Y.; Sun, K.; Fan, R.; Wang, N.; Lu, N.; Guo, Z. An overview of electrically conductive polymer nanocomposites toward electromagnetic interference shielding. Eng. Sci. 2018, 2, 26–42. [Google Scholar] [CrossRef]
  6. Shanenkov, I.; Sivkov, A.; Ivashutenko, A.; Zhuravlev, V.; Guo, Q.; Li, L.; Li, G.; Wei, G.; Han, W. Magnetite hollow microspheres with a broad absorption bandwidth of 11.9 GHz: Toward promising lightweight electromagnetic microwave absorption. Phys. Chem. Phys. Chem. 2017, 19, 19975–19983. [Google Scholar] [CrossRef]
  7. Wu, N.; Liu, C.; Xu, D.; Liu, J.; Liu, W.; Shao, Q.; Guo, Z. Enhanced Electromagnetic Wave Absorption of Three-Dimensional Porous Fe3O4/C Composite Flowers. ACS Sustain. Chem. Eng. 2018, 6, 12471–12480. [Google Scholar] [CrossRef]
  8. Sui, M.; Sun, X.; Lou, H.; Li, X.; Lv, X.; Li, L.; Gu, G. Synthesis of hollow Fe3O4 particles via one-step solvothermal approach for microwave absorption materials: Effect of reactant concentration, reaction temperature and reaction time. J. Mater. Sci. 2018, 29, 7539–7550. [Google Scholar] [CrossRef]
  9. Wang, G.; Chang, Y.; Wang, L.; Liu, L.; Liu, C. Facilely preparation and microwave absorption properties of Fe3O4 nanoparticles. Mater. Res. Bull. 2013, 48, 1007–1012. [Google Scholar] [CrossRef]
  10. Shang, C.; Ji, G.; Liu, W.; Zhang, X.; Lv, H.; Du, Y. One-pot in situ molten salt synthesis of octahedral Fe3O4 for efficient microwave absorption application. RSC Adv. 2015, 5, 80450–80456. [Google Scholar] [CrossRef]
  11. Li, X.; Zhang, B.; Ju, C.; Han, X.; Du, Y.; Xu, P. Morphology-controlled synthesis and electromagnetic properties of porous Fe3O4 nanostructures from iron alkoxide precursors. J. Phys. Chem. C 2011, 115, 12350–12357. [Google Scholar] [CrossRef]
  12. Li, C.; Ge, Y.; Jiang, X.; Waterhouse, G.I.N.; Zhang, Z.; Yu, L. Porous Fe3O4/C microspheres for efficient broadband electromagnetic wave absorption. Ceram. Int. 2018, 44, 19171–19183. [Google Scholar] [CrossRef]
  13. Liu, X.; Chen, Y.; Cui, X.; Zeng, M.; Yu, R.; Wang, G.S. Flexible nanocomposites with enhanced microwave absorption properties based on Fe3O4/SiO2 nanorods and polyvinylidene fluoride. J. Mater. Chem. A 2015, 3, 12197–12204. [Google Scholar] [CrossRef]
  14. Liu, J.; Dai, C.; Hu, Y. Aqueous aggregation behavior of citric acid coated magnetite nanoparticles: Effects of pH, cations, anions, and humic acid. Environ. Res. 2018, 161, 49–60. [Google Scholar] [CrossRef]
  15. Micheli, D.; Pastore, R.; Vricella, A.; Delfini, A.; Marchetti, M.; Santoni, F. Electromagnetic Characterization of Materials by Vector Network Analyzer Experimental Setup. In Spectroscopic Methods for Nanomaterials Characterization; Elsevier: Amsterdam, The Netherlands, 2017; pp. 195–236. [Google Scholar]
  16. Soleimani, H.; Yahya, N.; Sabet, M.; Abbas, Z.; Soleimani, H.; Kozlowski, G.; Ghotbi, M.Y. Electromagnetic properties of lanthanum iron garnet filled PVDF-polymer composite at microwave frequencies using finite element method (FEM) and Nicholson–Ross–Weir (NRW) method. Dig. J. Nanomater. Biostruct. 2014, 9, 53–60. [Google Scholar]
  17. Shahid, M.K.; Kim, Y.; Choi, Y.G. Magnetite synthesis using iron oxide waste and its application for phosphate adsorption with column and batch reactors. Chem. Eng. Res. Des. 2019, 148, 169–179. [Google Scholar] [CrossRef]
  18. Talbot, D.; Abramson, S.; Griffete, N.; Bee, A. pH-sensitive magnetic alginate/γ-Fe2O3 nanoparticles for adsorption/desorption of a cationic dye from water. J. Water Process Eng. 2018, 25, 301–308. [Google Scholar] [CrossRef]
  19. Du, Y.; Liu, W.; Qiang, R.; Wang, Y.; Han, X.; Ma, J.; Xu, P. Shell thickness-dependent microwave absorption of core–shell Fe3O4@C composites. ACS Appl. Mater. Interfaces 2014, 6, 12997–13006. [Google Scholar] [CrossRef]
  20. Wang, C.; Murugadoss, V.; Kong, J.; He, Z.; Mai, X.; Shao, Q.; Chen, Y.; Guo, L.; Liu, C.; Angaiah, S.; et al. Overview of carbon nanostructures and nanocomposites for electromagnetic wave shielding. Carbon 2018, 140, 696–733. [Google Scholar] [CrossRef]
  21. Jiang, J.; Li, D.; Geng, D.; An, J.; He, J.; Liu, W.; Zhang, Z. Microwave absorption properties of core double-shell FeCo/C/BaTiO3 nanocomposites. Nanoscale 2014, 6, 3967–3971. [Google Scholar] [CrossRef]
  22. Xiang, Z.; Song, Y.; Xiong, J.; Pan, Z.; Wang, X.; Liu, L.; Liu, R.; Yang, H.; Lu, W. Enhanced electromagnetic wave absorption of nanoporous Fe3O4 @ carbon composites derived from metal-organic frameworks. Carbon 2019, 142, 20–31. [Google Scholar] [CrossRef]
  23. Zhang, K.; Zhang, Q.; Gao, X.; Chen, X.; Wang, Y.; Li, W.; Wu, J. Effect of absorbers’ composition on the microwave absorbing performance of hollow Fe3O4 nanoparticles decorated CNTs/graphene/C composites. J. Alloy. Compd. 2018, 748, 706–716. [Google Scholar] [CrossRef]
  24. Meng, F.; Wang, H.; Huang, F.; Guo, Y.; Wang, Z.; Hui, D.; Zhou, Z. Graphene-based microwave absorbing composites: A review and prospective. Compos. Part B Eng. 2018, 137, 260–277. [Google Scholar] [CrossRef]
  25. Zhao, B.; Deng, J.; Zhang, R.; Liang, L.; Fan, B.; Bai, Z.; Shao, G.; Park, C.B. Recent advances on the electromagnetic wave absorption properties of Ni based materials. Eng. Sci. 2018, 3, 5–40. [Google Scholar] [CrossRef]
  26. Cheng, Y.; Zhao, H.; Yang, Z.; Lv, J.; Cao, J.; Qi, X.; Ji, G.; Du, Y. An unusual route to grow carbon shell on Fe3O4 microspheres with enhanced microwave absorption. J. Alloy. Compd. 2018, 762, 463–472. [Google Scholar] [CrossRef]
  27. Liu, P.; Huang, Y.; Yan, J.; Zhao, Y. Magnetic graphene@PANI@porous TiO2 ternary composites for high-performance electromagnetic wave absorption. J. Mater. Chem. C 2016, 4, 6362–6370. [Google Scholar] [CrossRef]
  28. Zhang, T.; Huang, D.; Yang, Y.; Kang, F.; Gu, J. Fe3O4/carbon composite nanofiber absorber with enhanced microwave absorption performance. Mater. Sci. Eng. B 2013, 178, 1–9. [Google Scholar] [CrossRef]
  29. Li, Z.; Li, X.; Zong, Y.; Tan, G.; Sun, Y.; Lan, Y.; He, M.; Ren, Z.; Zheng, X. Solvothermal synthesis of nitrogen-doped graphene decorated by superparamagnetic Fe3O4 nanoparticles and their applications as enhanced synergistic microwave absorbers. Carbon 2017, 115, 493–502. [Google Scholar] [CrossRef]
  30. Movassagh-Alanagh, F.; Bordbar Khiabani, A.; Salimkhani, H. Improvement in magnetic and microwave absorption properties of nano-Fe3O4@CFs composites using a modified multi-step EPD process. Appl. Surf. Sci. 2017, 420, 726–739. [Google Scholar] [CrossRef]
  31. Kittel, C. Theory of the dispersion of magnetic permeability in ferromagnetic materials at microwave frequencies. Phys. Rev. 1946, 70, 281. [Google Scholar] [CrossRef]
  32. Micheli, D.; Pastore, R.; Delfini, A.; Giusti, A.; Vricella, A.; Santoni, F.; Marchetti, M.; Tolochko, O.; Vasilyeva, E. Electromagnetic characterization of advanced nanostructured materials and multilayer design optimization for metrological and low radar observability applications. Acta Astronaut. 2017, 134, 33–40. [Google Scholar] [CrossRef]
  33. Liu, X.; Hao, C.; Jiang, H.; Zeng, M.; Yu, R. Hierarchical NiCo2O4/Co3O4/NiO porous composite: A lightweight electromagnetic wave absorber with tunable absorbing performance. J. Mater. Chem. C 2017, 5, 3770–3778. [Google Scholar] [CrossRef]
  34. Kong, L.; Wang, C.; Yin, X.; Fan, X.; Wang, W.; Huang, J. Electromagnetic wave absorption properties of a carbon nanotube modified by a tetrapyridinoporphyrazine interface layer. J. Mater. Chem. C 2017, 5, 7479–7488. [Google Scholar] [CrossRef]
  35. Zhao, Y.; Liu, L.; Jiang, K.; Fan, M.; Jin, C.; Han, J.; Wu, W.; Tong, G. Distinctly enhanced permeability and excellent microwave absorption of expanded graphite/Fe3O4 nanoring composites. RSC Adv. 2017, 7, 11561–11567. [Google Scholar] [CrossRef]
  36. Idris, F.M.; Hashim, M.; Abbas, Z.; Ismail, I.; Nazlan, R.; Ibrahim, I.R. Recent developments of smart electromagnetic absorbers based polymer-composites at gigahertz frequencies. J. Magn. Magn. Mater. 2016, 405, 197–208. [Google Scholar] [CrossRef]
  37. Zhou, W.; Hu, X.; Bai, X.; Zhou, S.; Sun, C.; Yan, J.; Chen, P. Synthesis and electromagnetic, microwave absorbing properties of core-shell Fe3O4-poly(3, 4-ethylenedioxythiophene) microspheres. ACS Appl. Mater. Interfaces 2011, 3, 3839–3845. [Google Scholar] [CrossRef]
  38. Liu, X.; Cui, X.; Chen, Y.; Zhang, X.J.; Yu, R.; Wang, G.S.; Ma, H. Modulation of electromagnetic wave absorption by carbon shell thickness in carbon encapsulated magnetite nanospindles–poly (vinylidene fluoride) composites. Carbon 2015, 95, 870–878. [Google Scholar] [CrossRef]
  39. Hou, C.L.; Li, T.H.; Zhao, T.K.; Liu, H.G.; Liu, L.H.; Zhang, W.J. Electromagnetic wave absorbing properties of multi-wall carbon nanotube/Fe3O4 hybrid materials. New Carbon Mater. 2013, 28, 184–190. [Google Scholar] [CrossRef]
  40. Osouli-Bostanabad, K.; Hosseinzade, E.; Kianvash, A.; Entezami, A. Modified nano-magnetite coated carbon fibers magnetic and microwave properties. Appl. Surf. Sci. 2015, 356, 1086–1095. [Google Scholar] [CrossRef]
  41. Osouli-Bostanabad, K.; Aghajani, H.; Hosseinzade, E.; Maleki-Ghaleh, H.; Shakeri, M. High microwave absorption of nano-Fe3O4 deposited electrophoretically on carbon fiber. Mater. Manuf. Process. 2016, 31, 1351–1356. [Google Scholar] [CrossRef]
  42. Liu, X.; Guo, H.; Xie, Q.; Luo, Q.; Wang, L.S.; Peng, D.L. Enhanced microwave absorption properties in GHz range of Fe3O4/C composite materials. J. Alloy. Compd. 2015, 649, 537–543. [Google Scholar] [CrossRef]
Figure 1. Digital image of (a) C-Fe3O4 (b) C-Fe3O4/PVDF (M40) (c) rectangular shaped M40.
Applsci 09 03877 g001
Figure 2. Rectangular waveguide loaded with C-Fe3O4/PVDF Sample.
Applsci 09 03877 g002
Figure 3. XRD pattern of the C-Fe3O4 nanoparticles.
Applsci 09 03877 g003
Figure 4. FESEM images of (a,b) C-Fe3O4 nanoparticles, (c) C-Fe3O4/PVDF (M40), (d) EDS spectrum of M40, and (e) elemental mapping of M40.
Applsci 09 03877 g004
Figure 5. FTIR spectrum of C-Fe3O4 nanoparticles.
Applsci 09 03877 g005
Figure 6. Hysteresis loop of the C-Fe3O4 nanoparticles, inset is the magnified low field hysteresis curve.
Applsci 09 03877 g006
Figure 7. (a) Real (ε′) and (b) imaginary (ε″) parts of permittivity, (c) real (µ′) and (d) imaginary (µ″) parts of permeability, (e) dielectric (tanδε) and (f) magnetic (tanδµ) loss tangents of all samples at 8.2–18 GHz frequency.
Applsci 09 03877 g007
Figure 8. The Cole-Cole plots of (a) M0, (b) M10, (c) M20 and (d) M40.
Applsci 09 03877 g008
Figure 9. Frequency dependency of C o = μ ι ι ( μ ι ) 2 f 1 values for all samples.
Applsci 09 03877 g009
Figure 10. RL curves for (a) M0, (b) M10, (c) M20, and (d) M40 with different thickness at x-band (8.2–12.4 GHz) and Ku-band (12.4–18 GHz) frequency.
Applsci 09 03877 g010
Figure 11. Attenuation constant (α) of all samples.
Applsci 09 03877 g011
Figure 12. 3D electric field slice plot of X-band FEM simulated rectangular waveguides of all samples at 4.0 mm thickness and 11.2 GHz frequency.
Applsci 09 03877 g012
Figure 13. 3D plot EM energy density of Ku-band simulated rectangular waveguide of samples at 3.0 mm thickness at a frequency of (a) 12.4 GHz, (b) 12.4 GHz, (c) 17.56 GHz and (d) 14.96 GHz. The magnified view of EM energy density of region filled with samples at frequency of (a′) 12.4 GHz, (b′) 12.4 GHz, (c′) 17.56 GHz and (d′) 14.96 GHz.
Applsci 09 03877 g013
Table 1. MAP of some Fe3O4-based composites reported in previous references and this work.
AbsorbersFilling Ratio (wt.%)Optimal RL (dB) (Corresponding Frequency GHz)Thickness (mm)Bandwidth (RL < −dB)References
Fe3O4 nanoparticles60−21.2 (5.7)2.03.6[9]
Fe3O4@ PEDOT20−30.0 (9.5)4.04.2[37]
Fe3O4/C/PVDF 60−36.5 (11.1)5.02.3[38]
MWCNT/Fe3O470−18.2 (12.04)2.01.04[39]
Fe3O4/CF50−8.0 (9.2)2.00.7[40]
Fe3O4/C flowers50−54.6 (5.7)4.276.0[7]
Fe3O4/SiO2/PVDF40−28.6 (8.10)2.52.11[13]
Fe3O4/CF50−11.0 (10.37)1.701.03[41]
Fe3O4/C60−46.0 (15.50)2.56.80[42]
C-Fe3O4/PVDF20−43.9 (15.13)3.52.45This work
C-Fe3O4/PVDF40−41.75 (14.96)3.02.01This work

