Modelling the Effects of Aerosol on Mei-Yu Frontal Precipitation and Physical Processes

 , ,
, ,
Abstract
Featured Application
Abstract
1. Introduction
2. Model Description and Experimental Design
2.1. Numerical Framework
2.2. Microphysical Scheme
2.3. Initialization
- (i)
- Meridional geostrophic wind Vg is:
- (ii)
- Initial zonal wind velocity u0(y, z) is:where the assigned parameter values are , , , and .
- (iii)
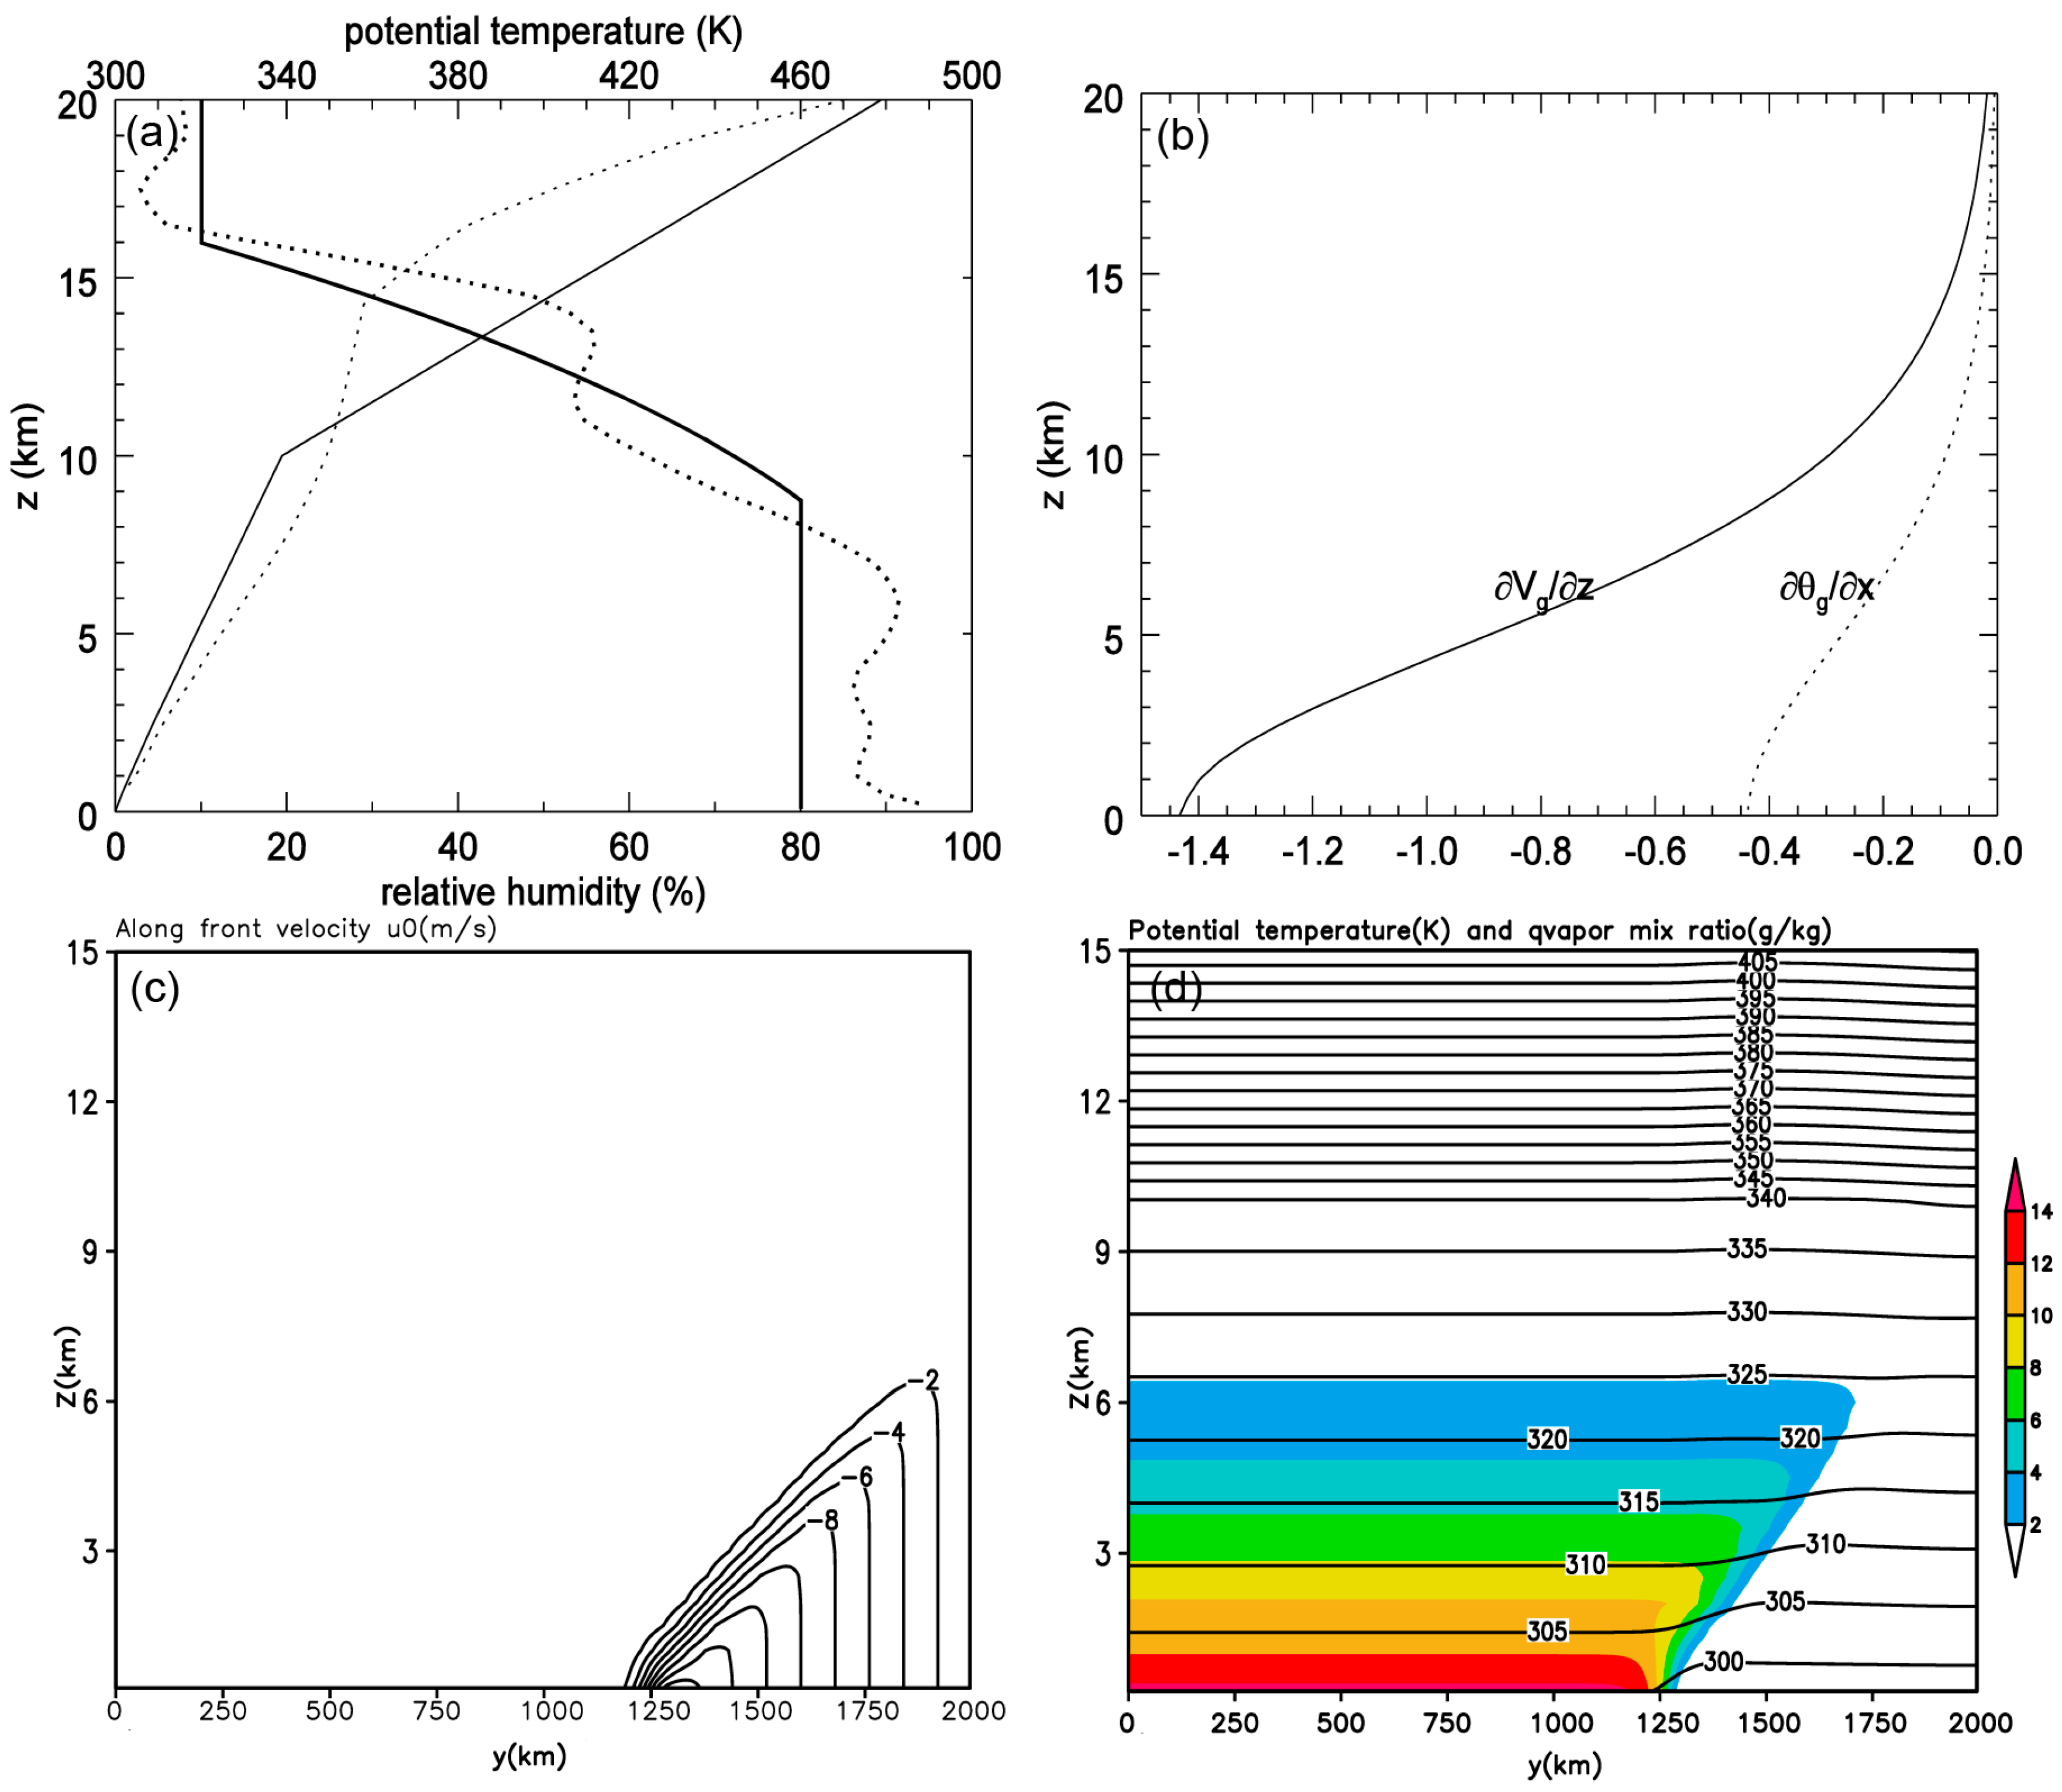
- Initial potential temperature and water vapor mixture ratio are broken down into basic-state and plus disturbances and Specifically:The basic-state sounding comes from an average measured distribution over the region [110°–125° E, 28°–32° N], taken from a typical Mei-Yu front weather conditions on 12 July 2010 at 00 UTC. Its convective available potential energy (CAPE) was approximately 1000 J kg−1. Specific parameter values used are the same as Peng et al. [60]. The distributions are shown in Figure 1.
2.4. Experimental Design
3. Results
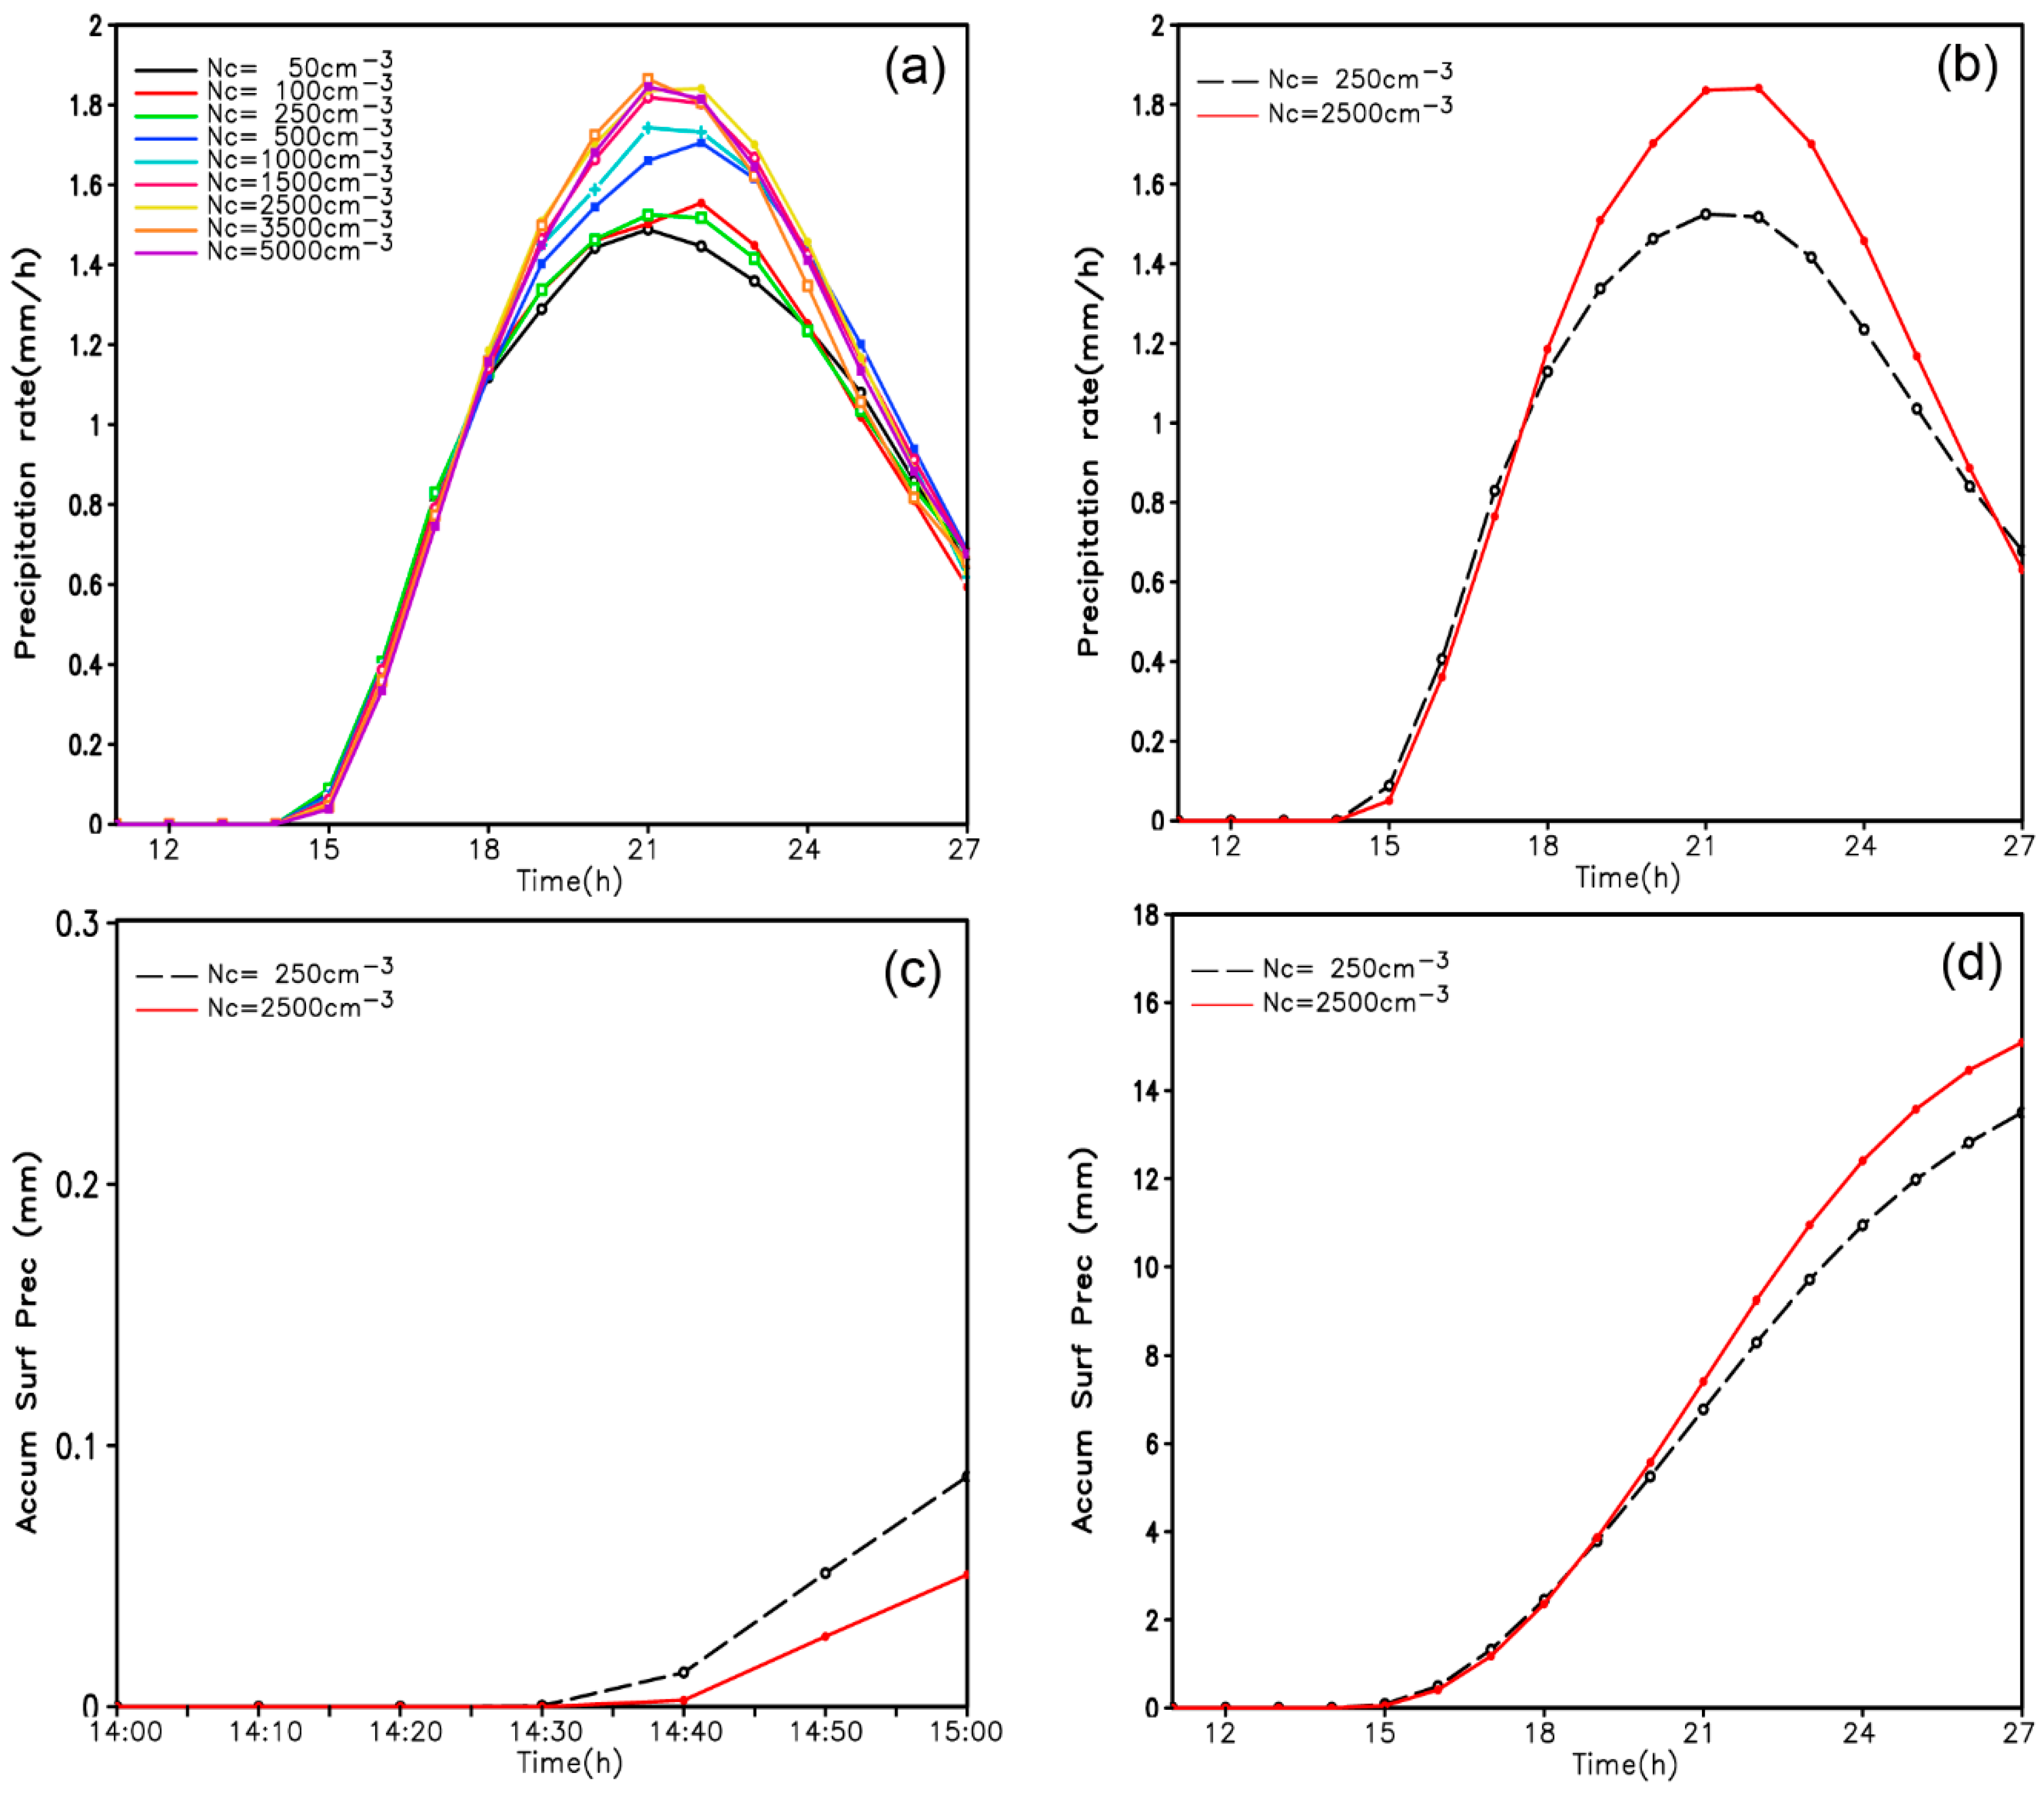
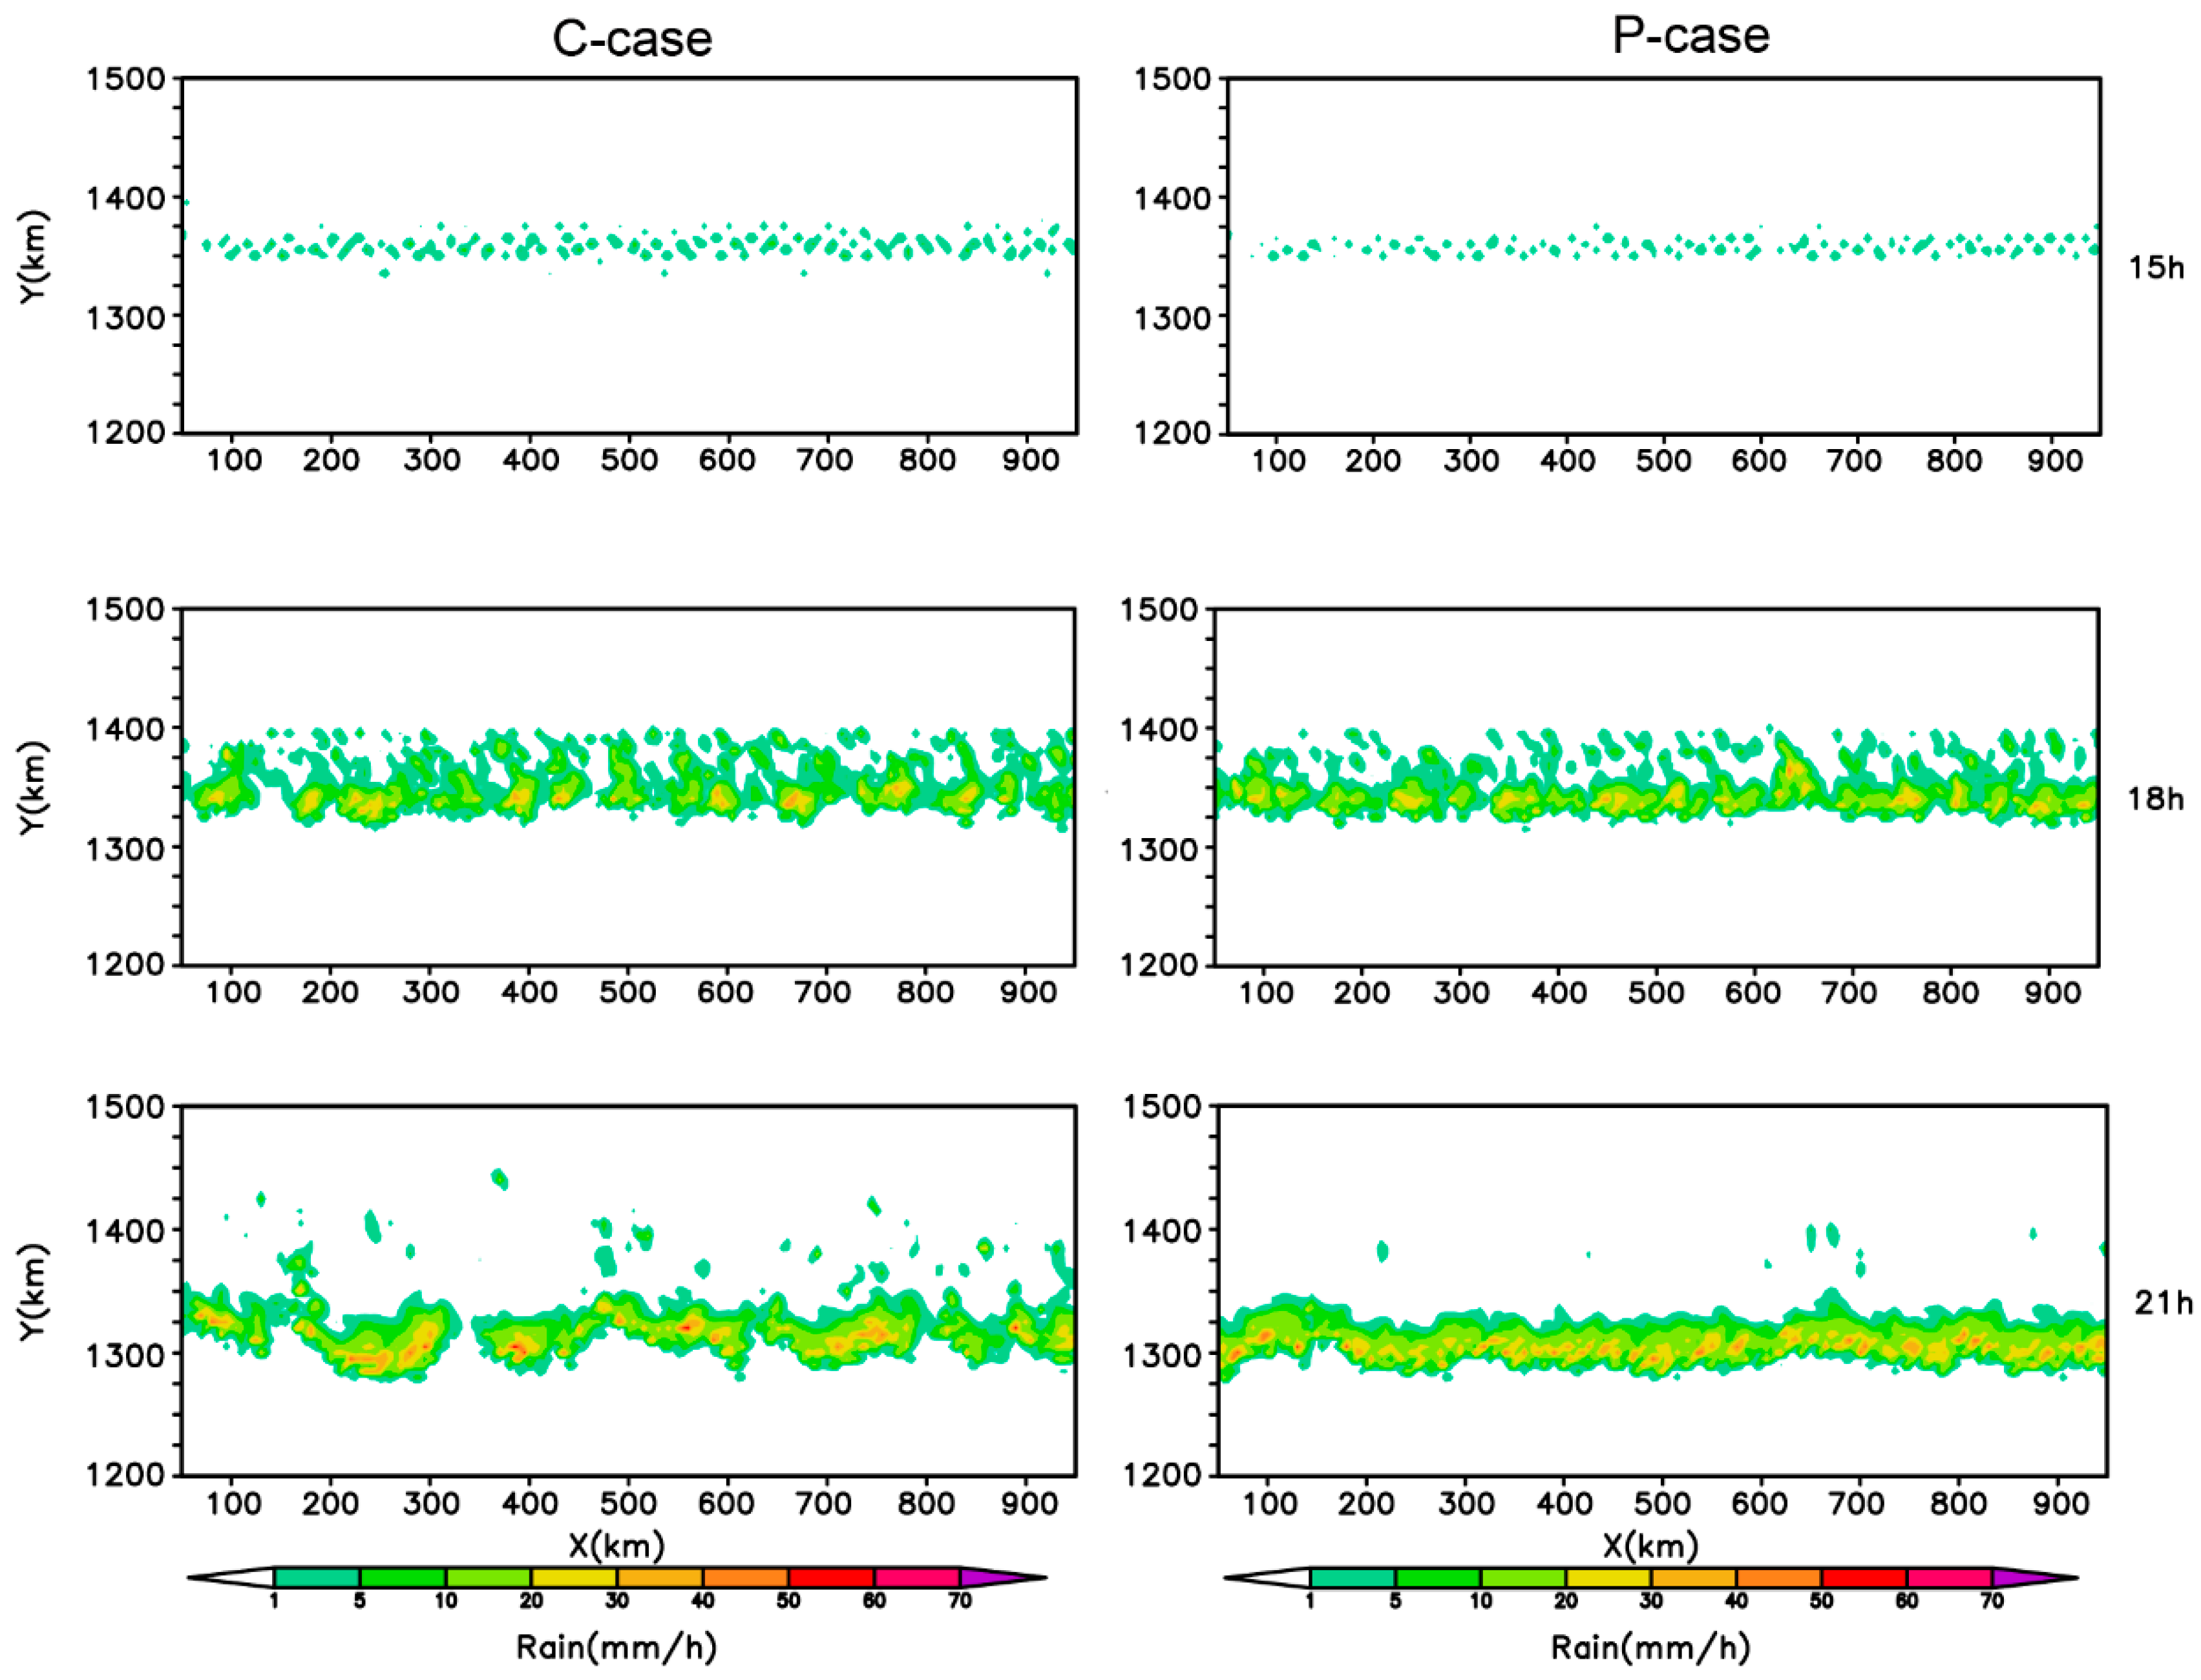
3.1. Effects on the Intensity and Distribution of Precipitation
3.2. Effects on Cloud Microphysical Processes
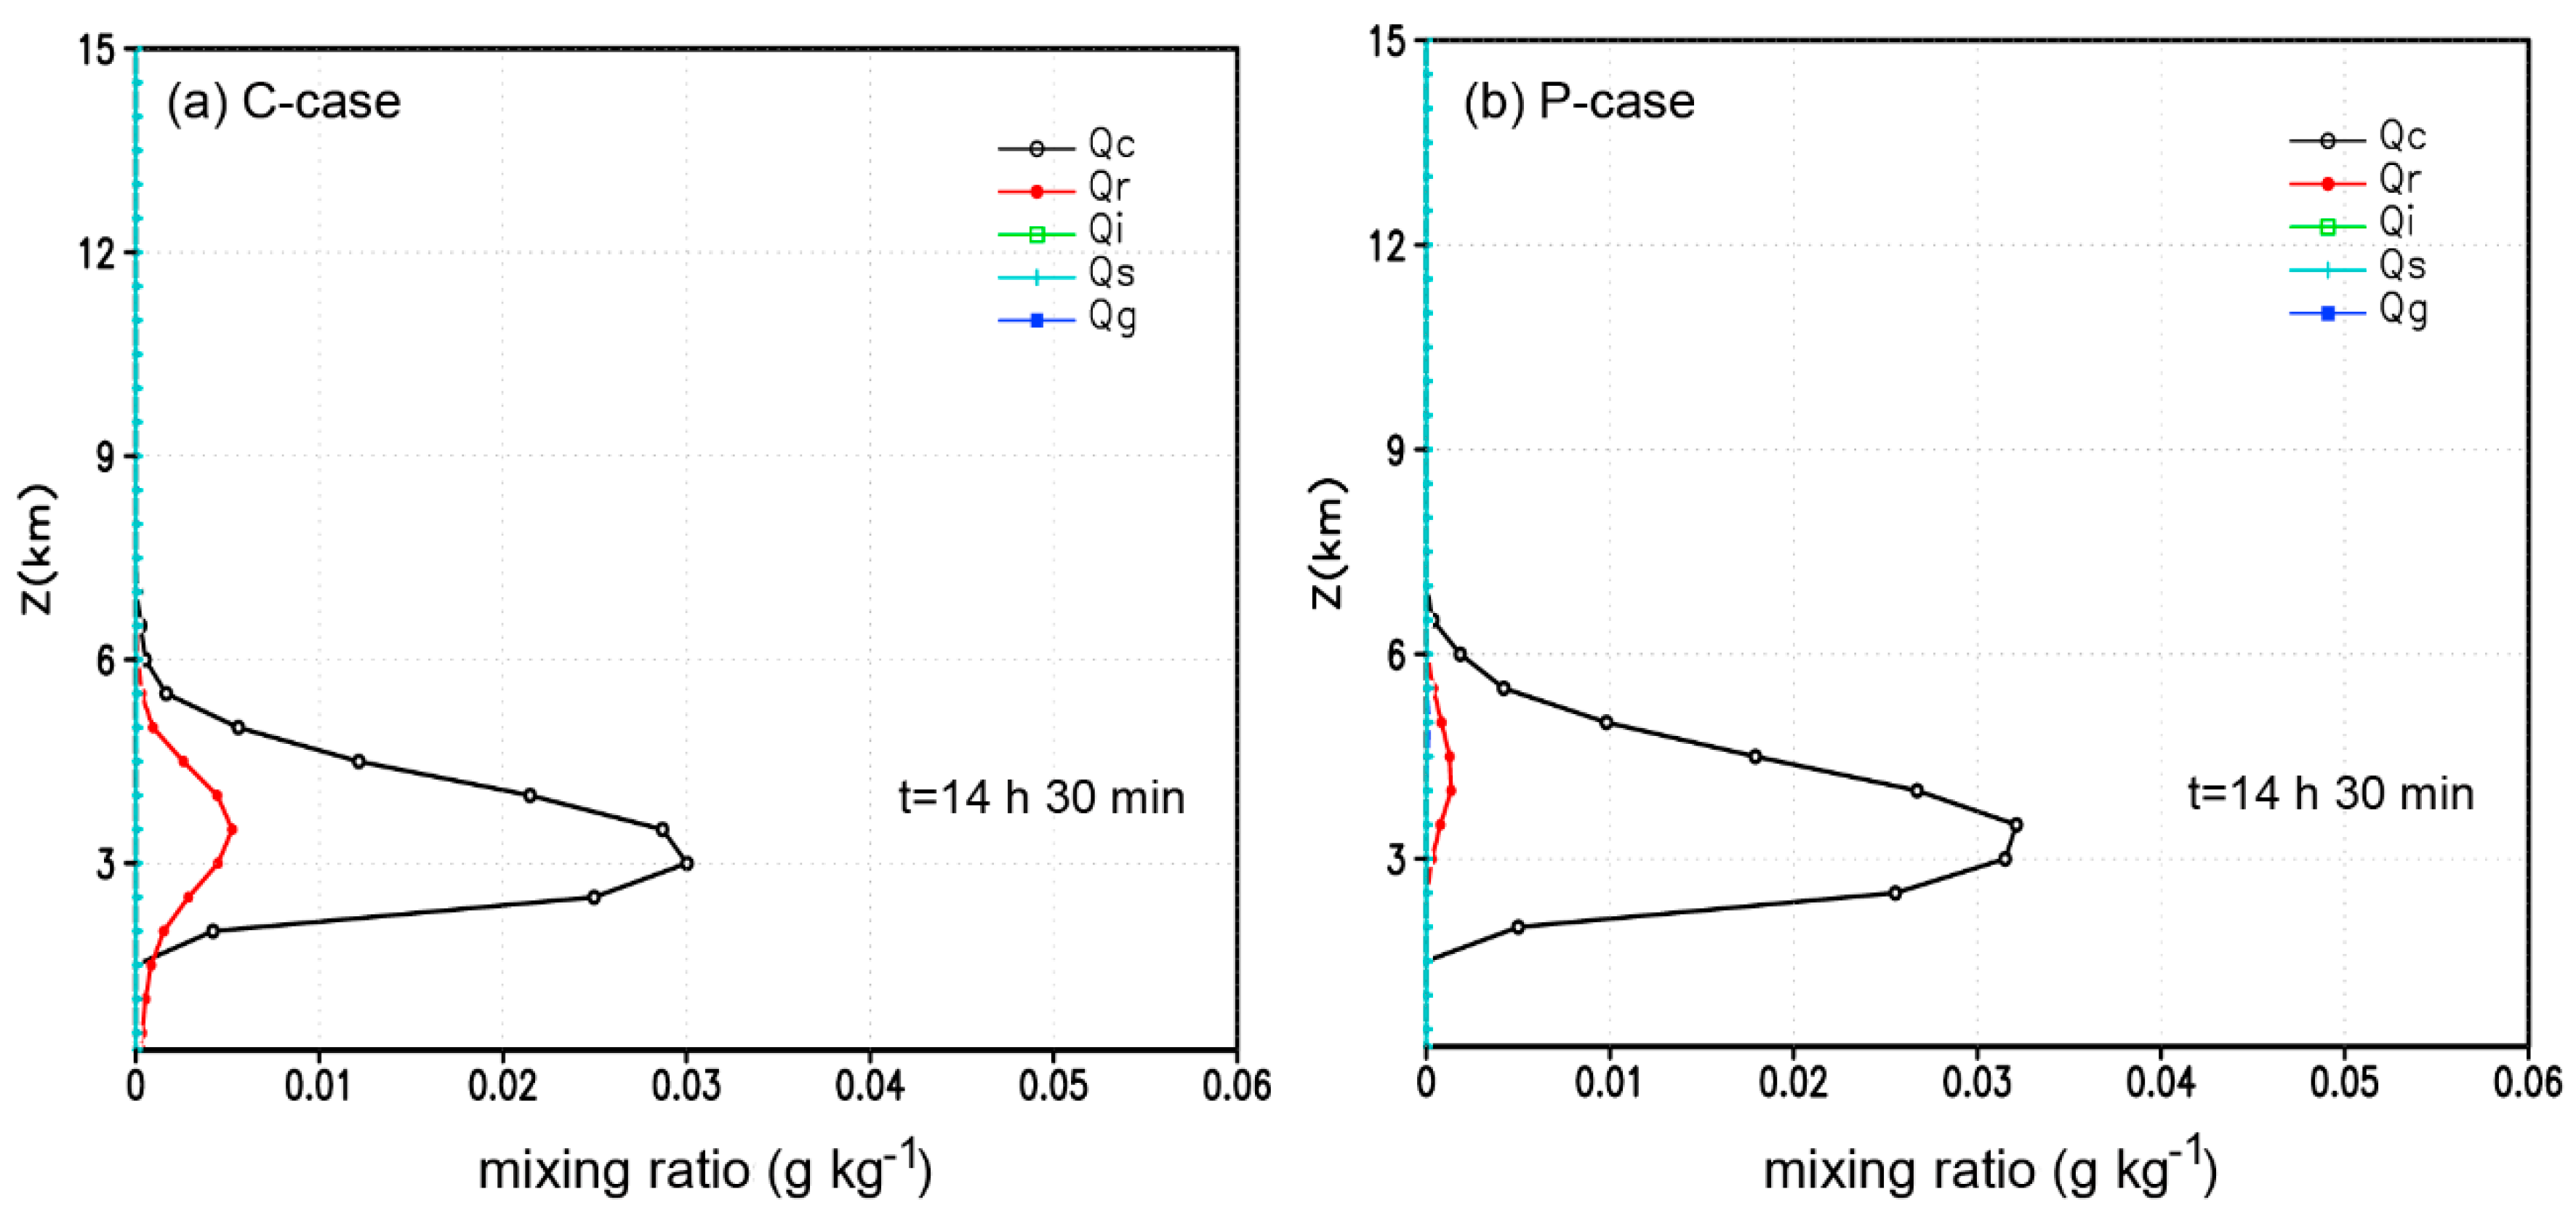
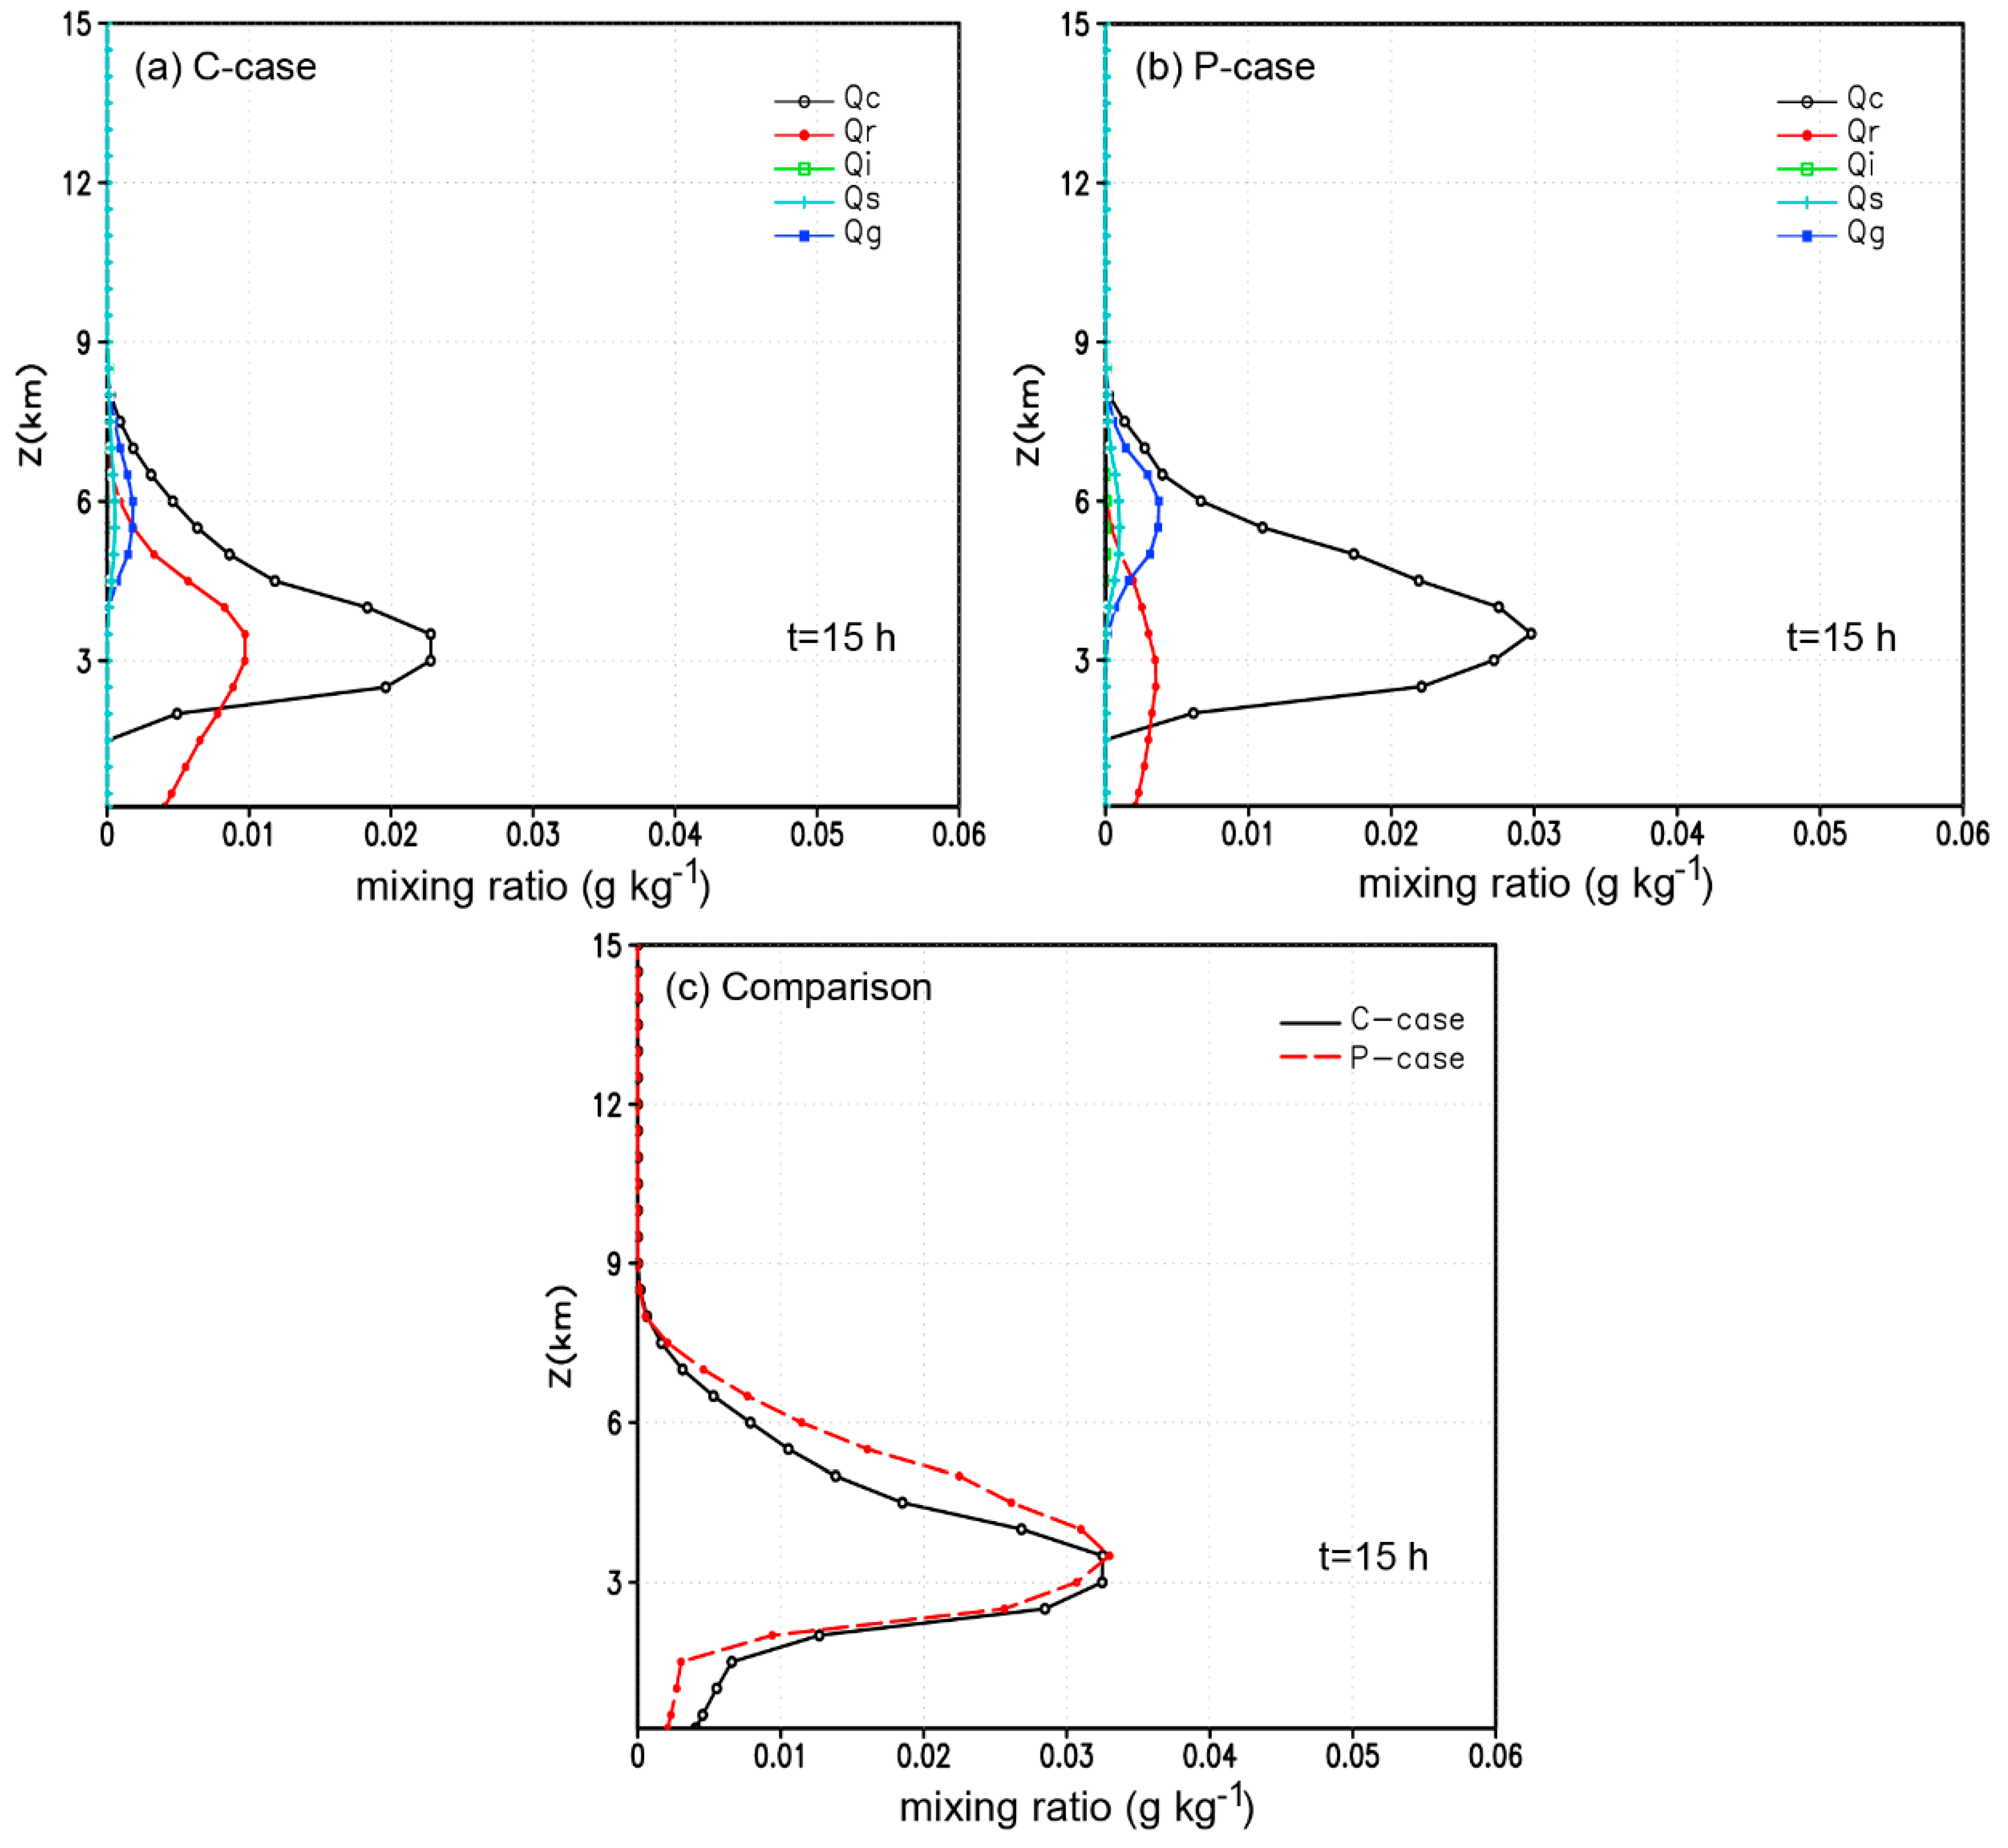
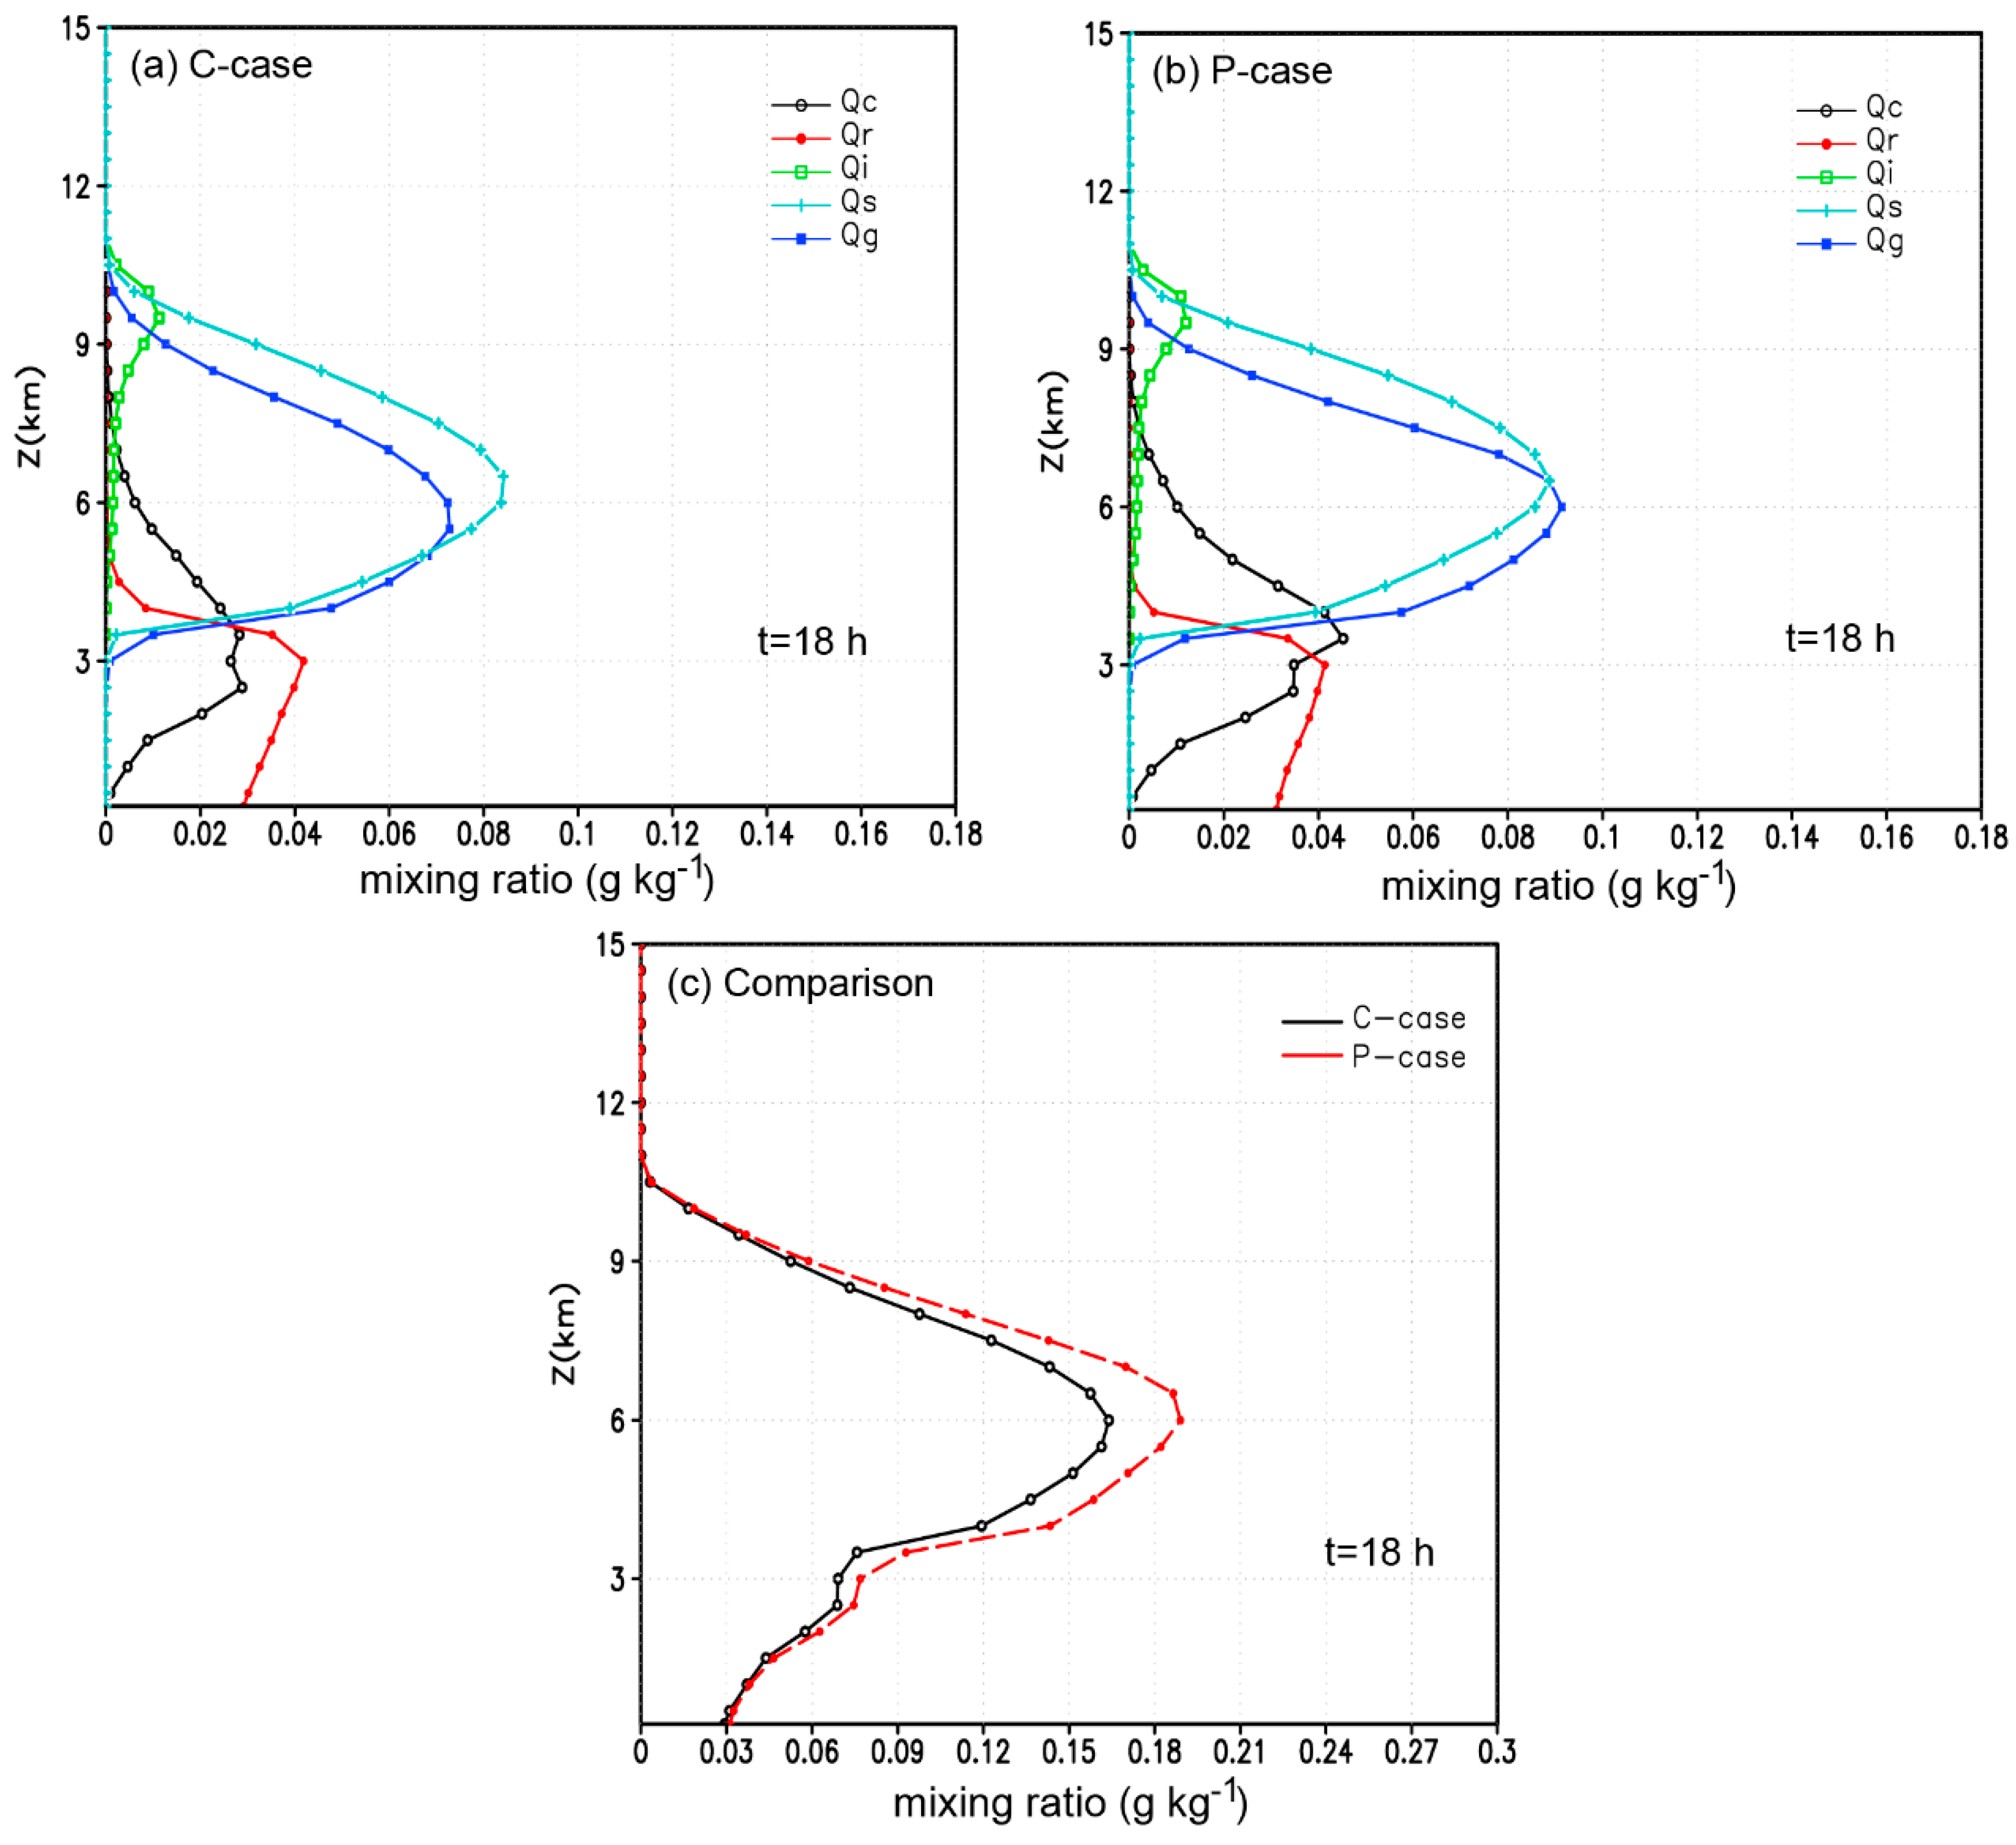
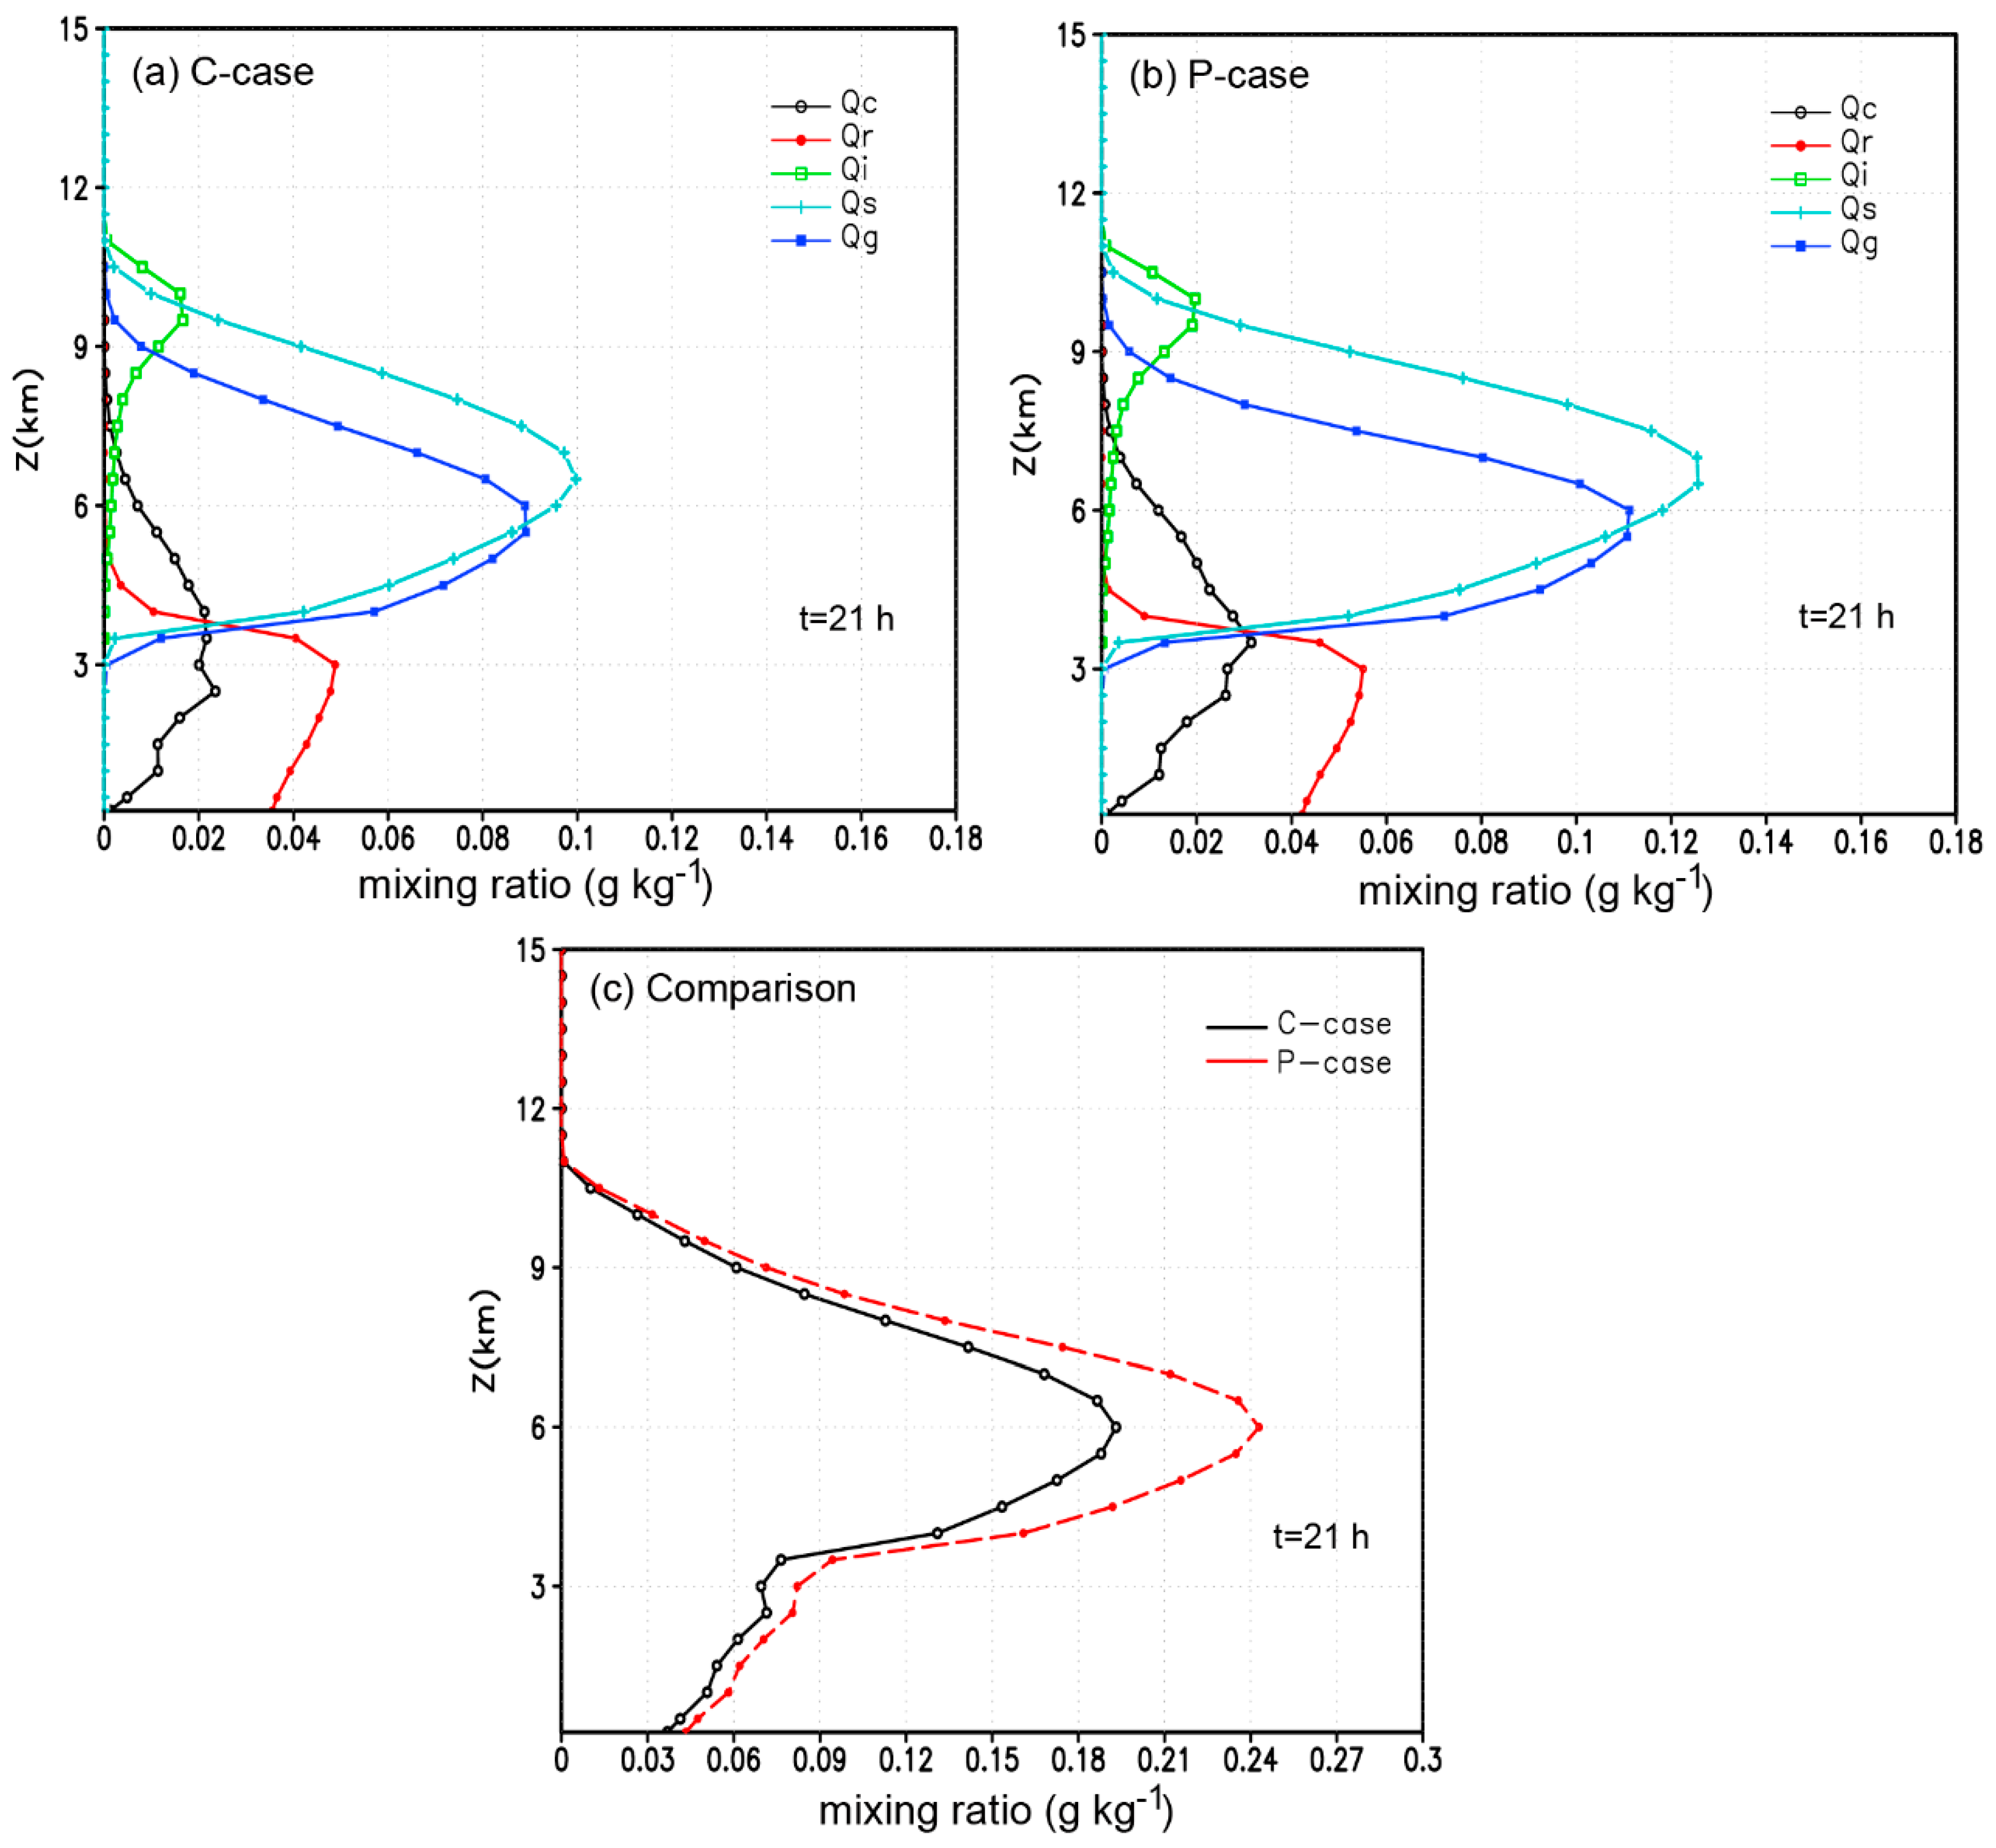
3.2.1. Cloud Microphysical Quantities
3.2.2. Cloud Microphysical Processes
Microphysical Processes of Rain Formation
Microphysical Processes of Graupel Formation
Microphysical Processes of Snow Formation
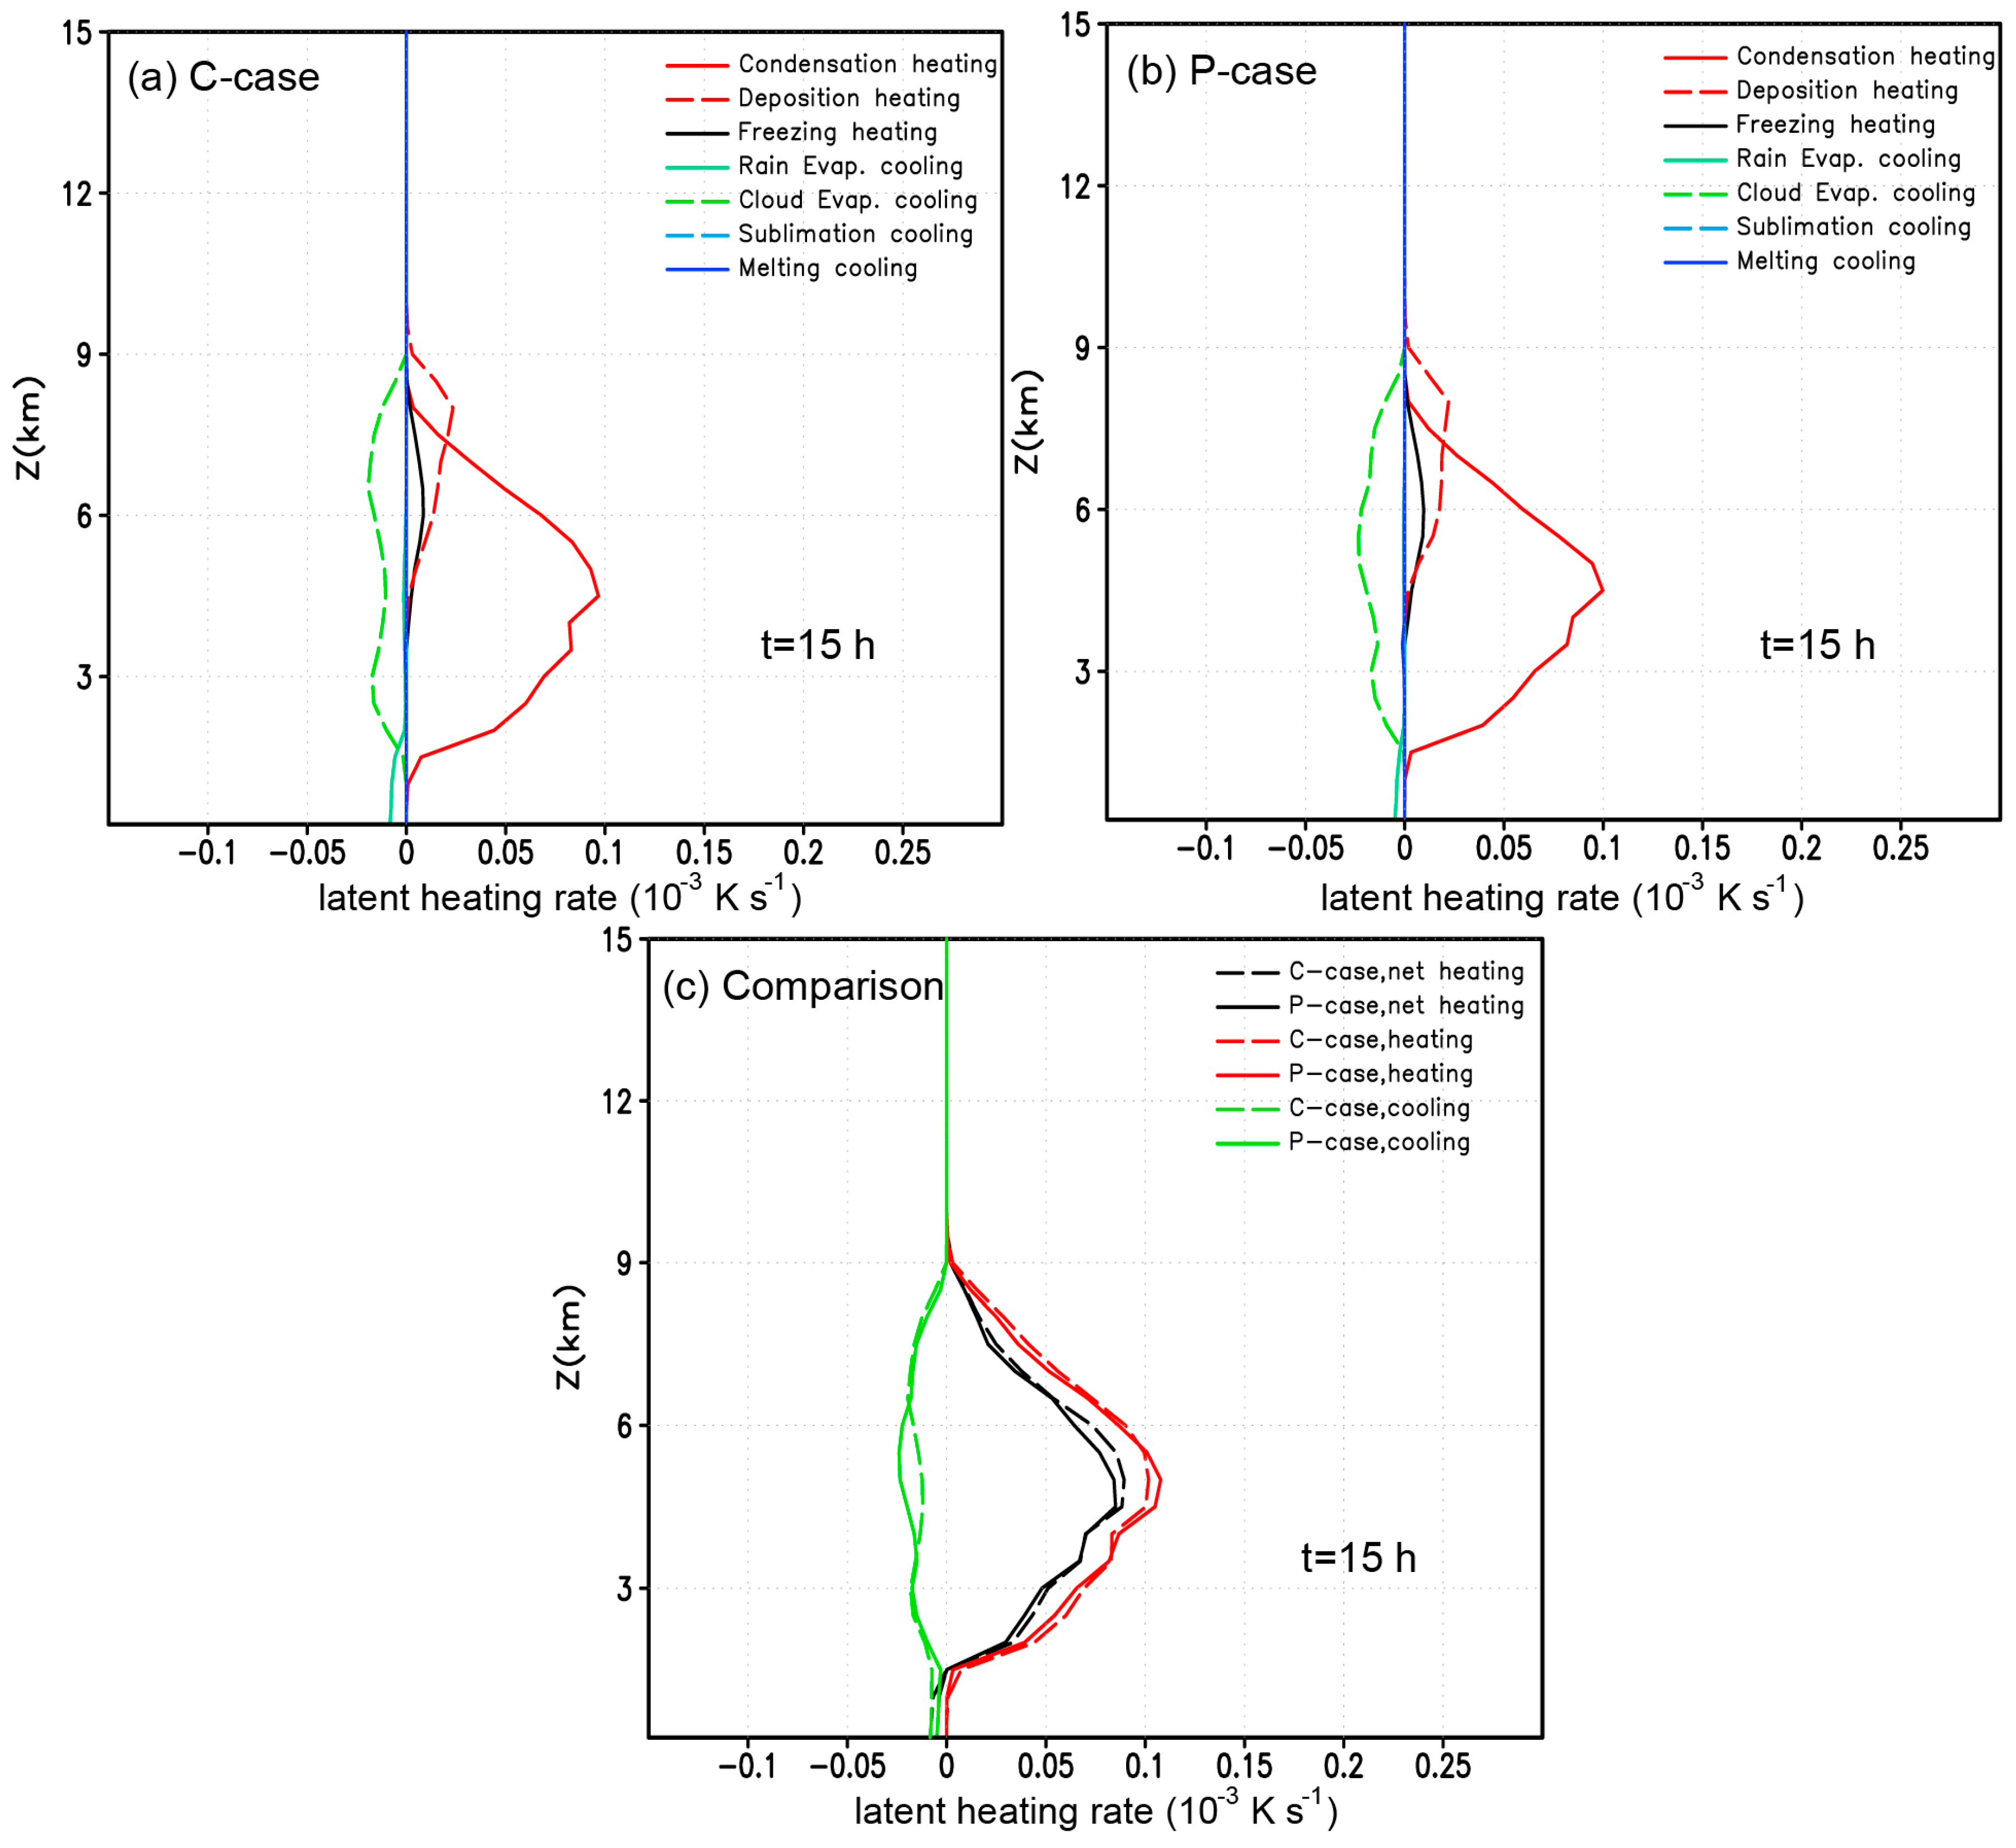
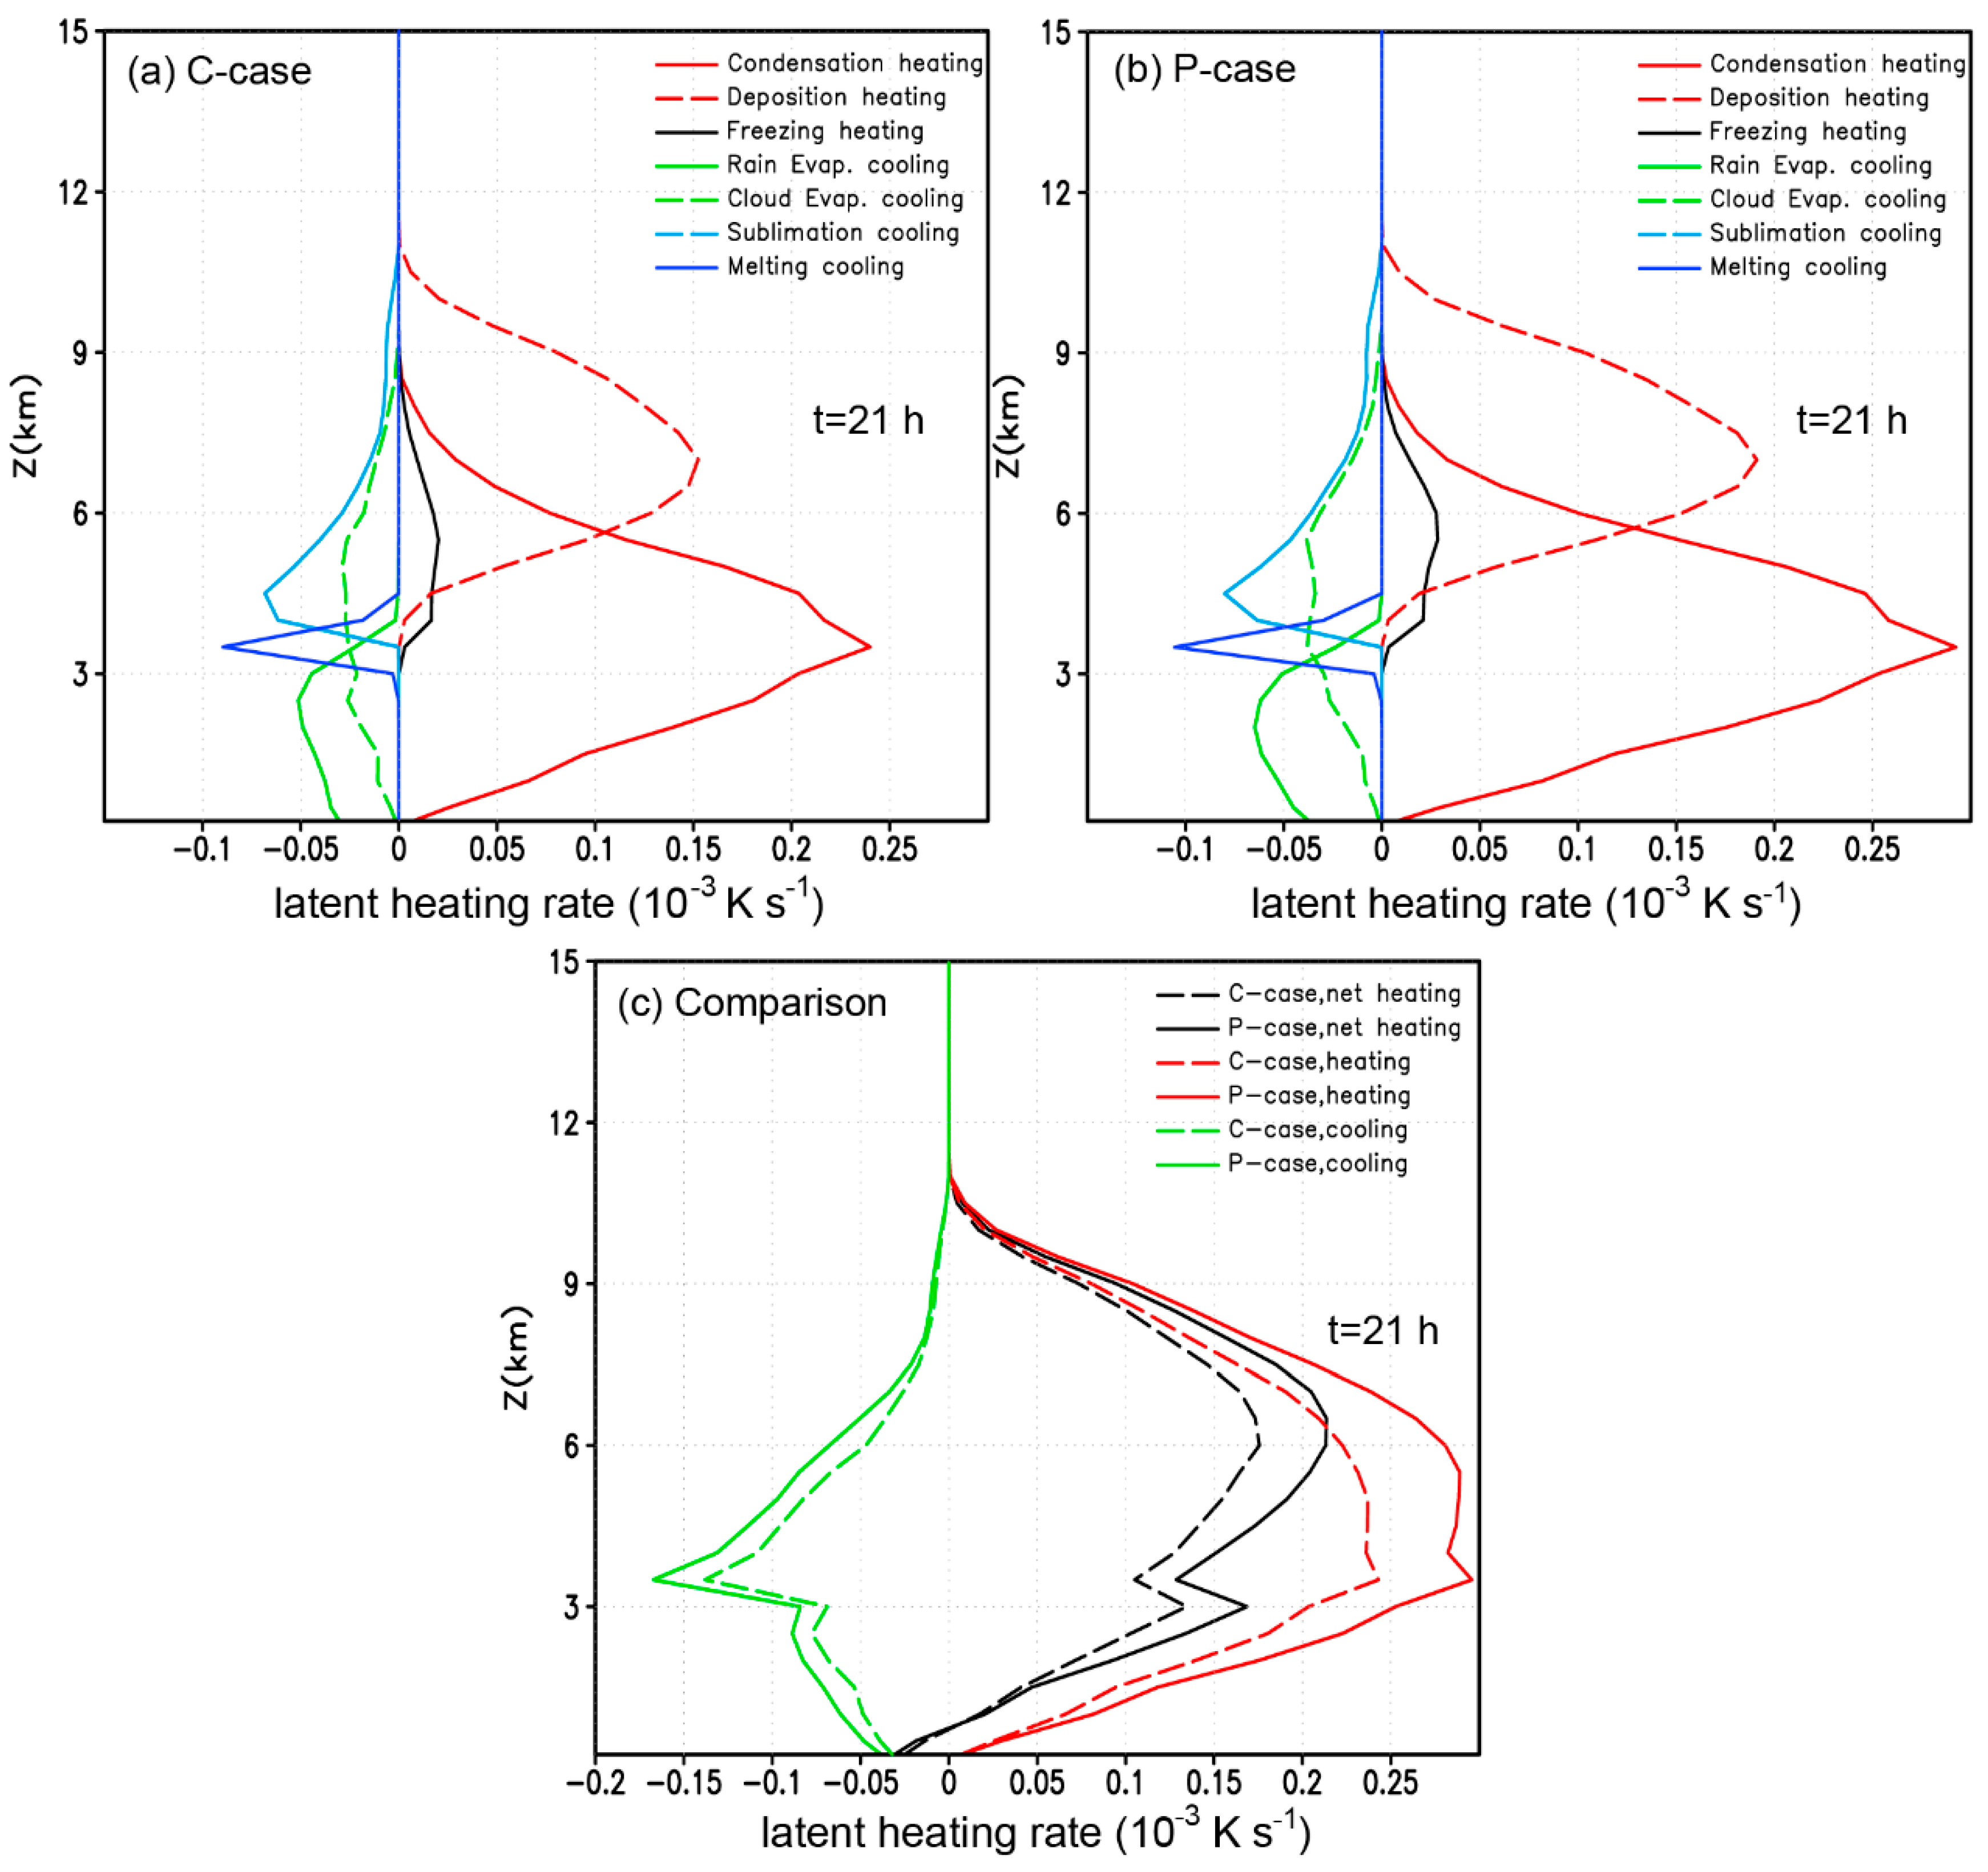
3.3. Effects on Latent Heat
4. The Dynamic Effects
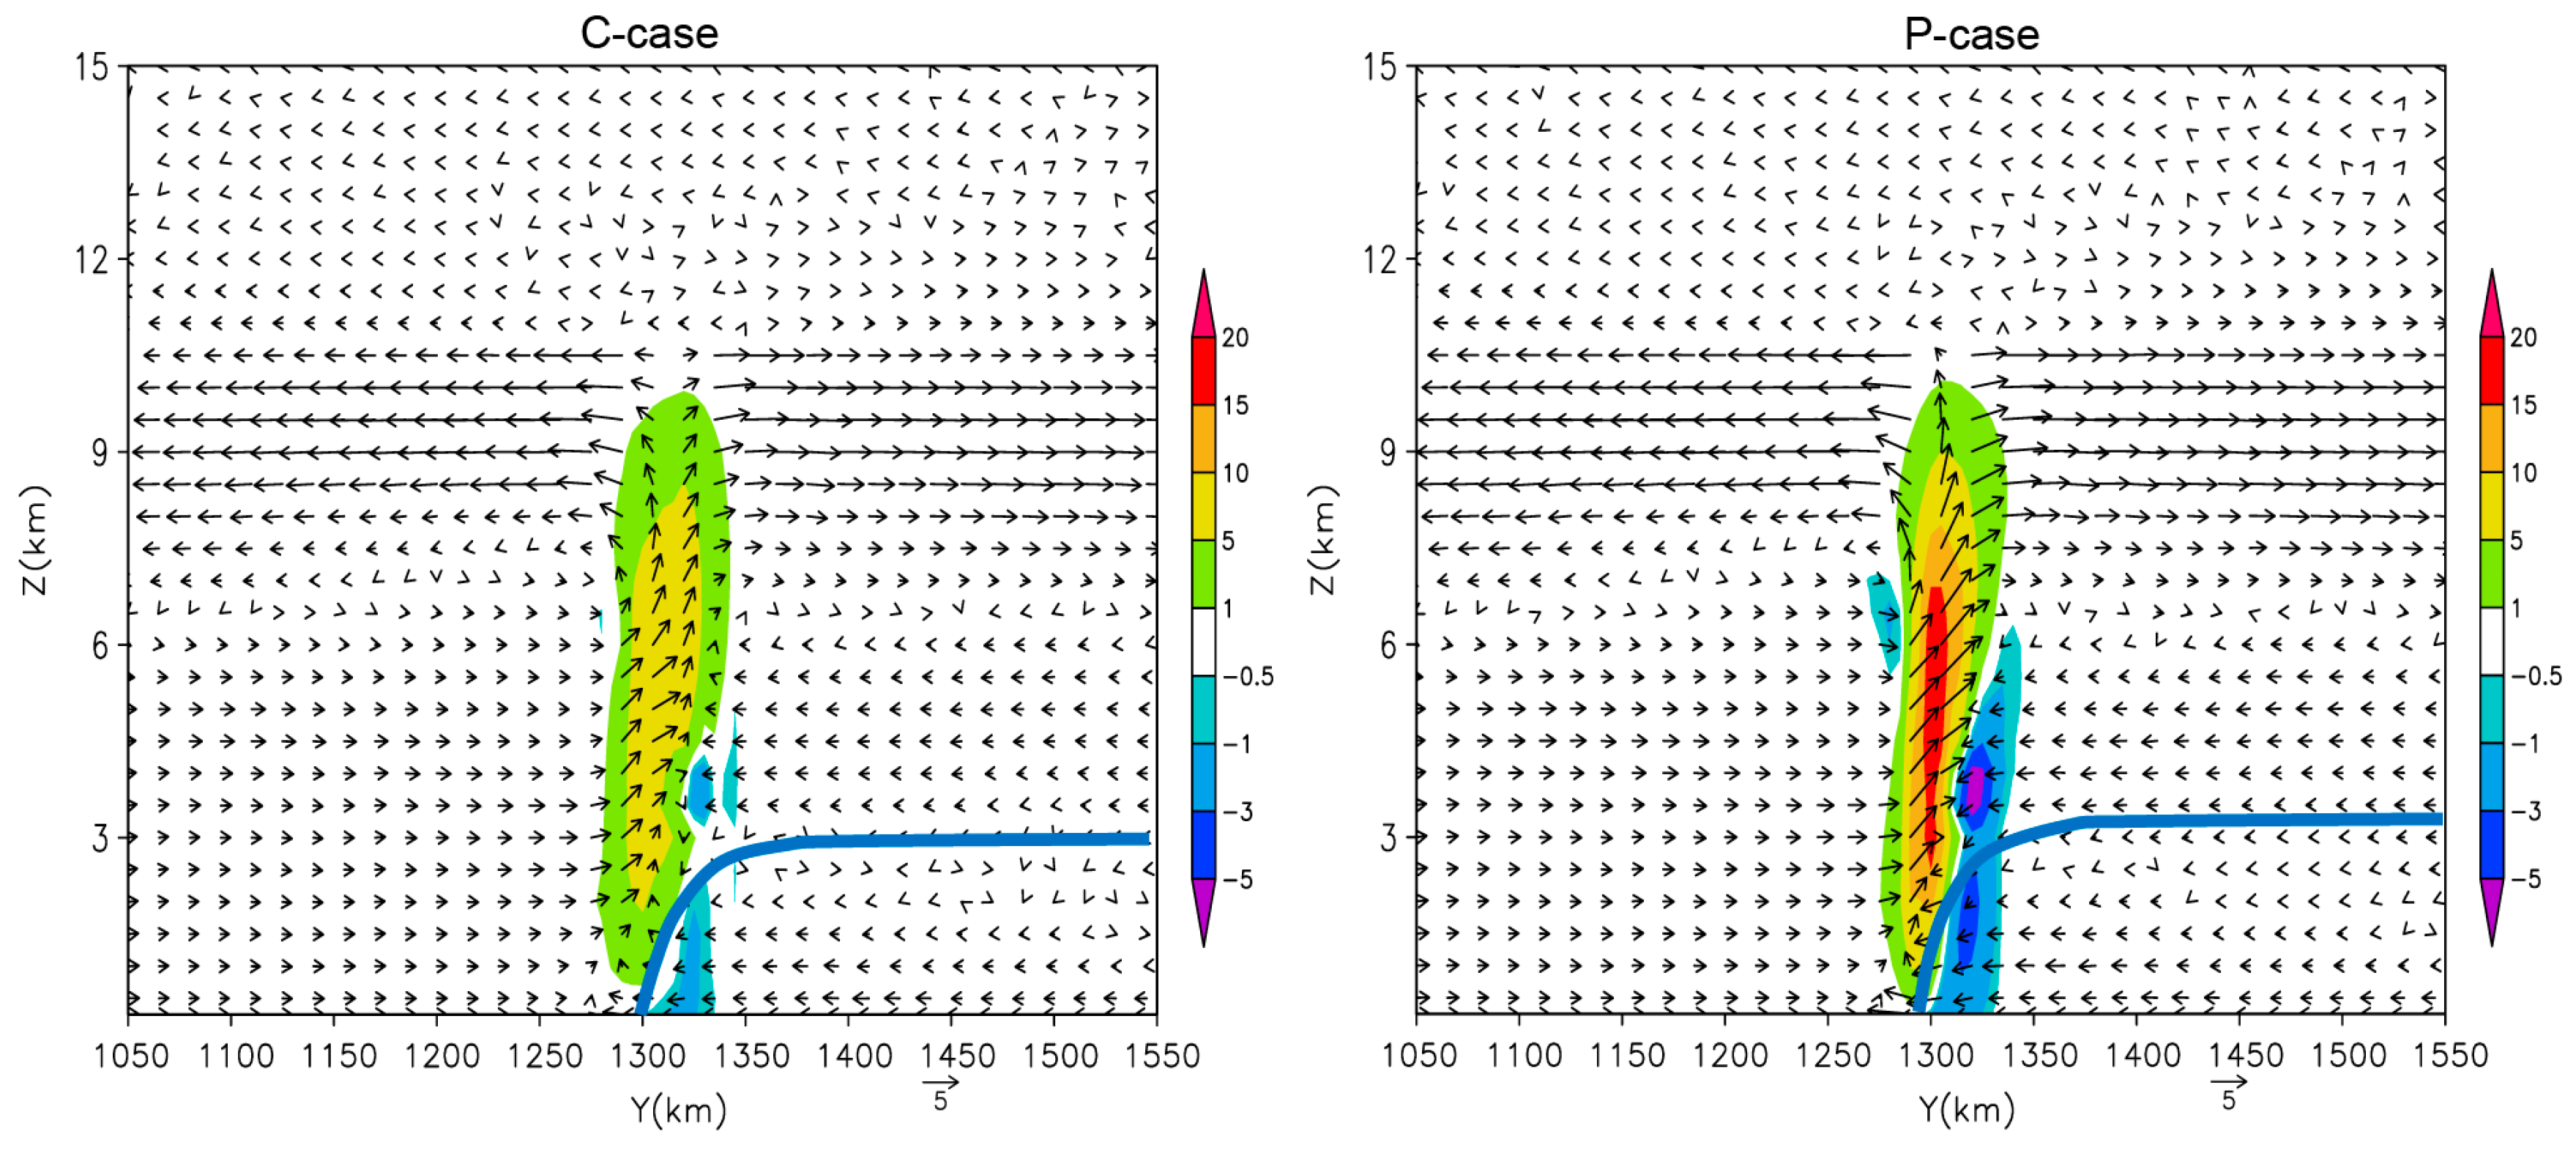
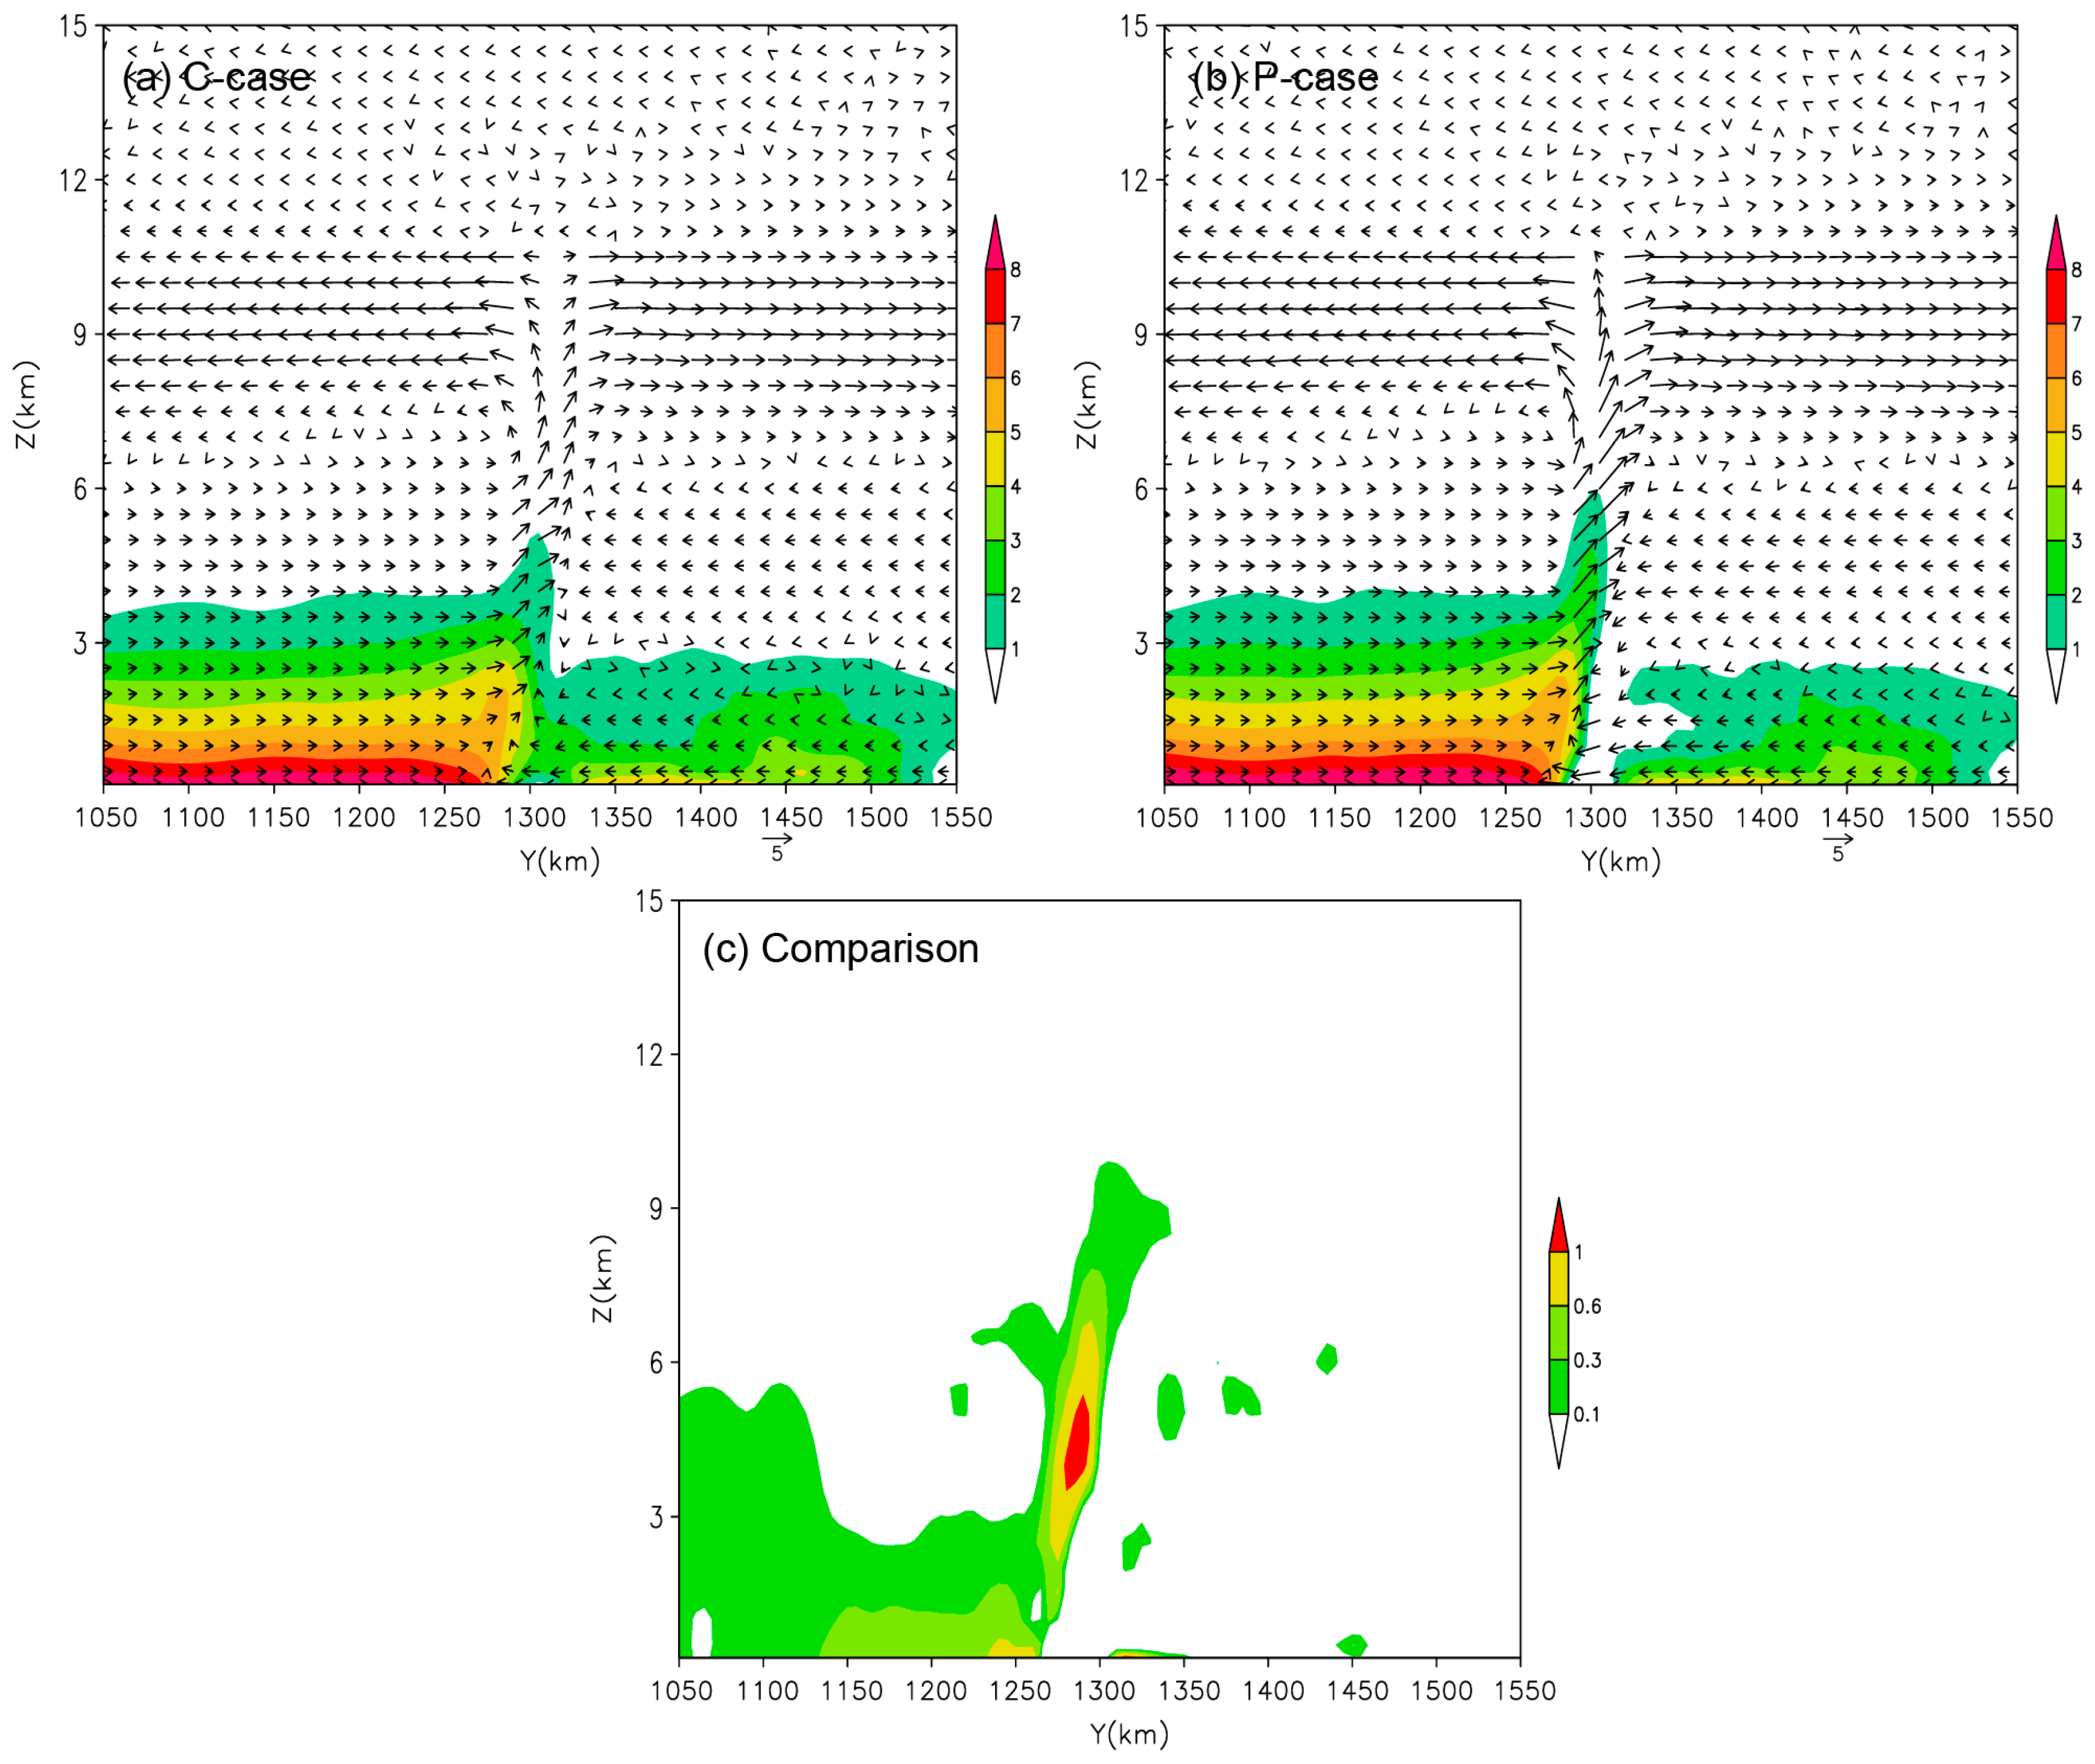
4.1. Direct Dynamic Effect
4.2. Frontogenesis Dynamic Effect
4.2.1. Impacts on Frontogenesis
4.2.2. The Frontogenesis Effect
4.3. Third Dynamic Effect: The Water Vapor Pump Effect
5. Physical Mechanism Discussion
6. Summary and Conclusions
- (1)
- Aerosols play an important role in affecting local precipitation around Mei-Yu fronts. Polluted conditions delay the onset of precipitation but strengthen precipitation during the intense precipitation period and increase the amount of total precipitation. This may be one of the reasons for the increased frequency of the intense Mei-Yu precipitation in recent years. Note that anthropogenic pollution has a significant effect on Mei-Yu front precipitation. This may be an important feature influencing climate change in East Asia.
- (2)
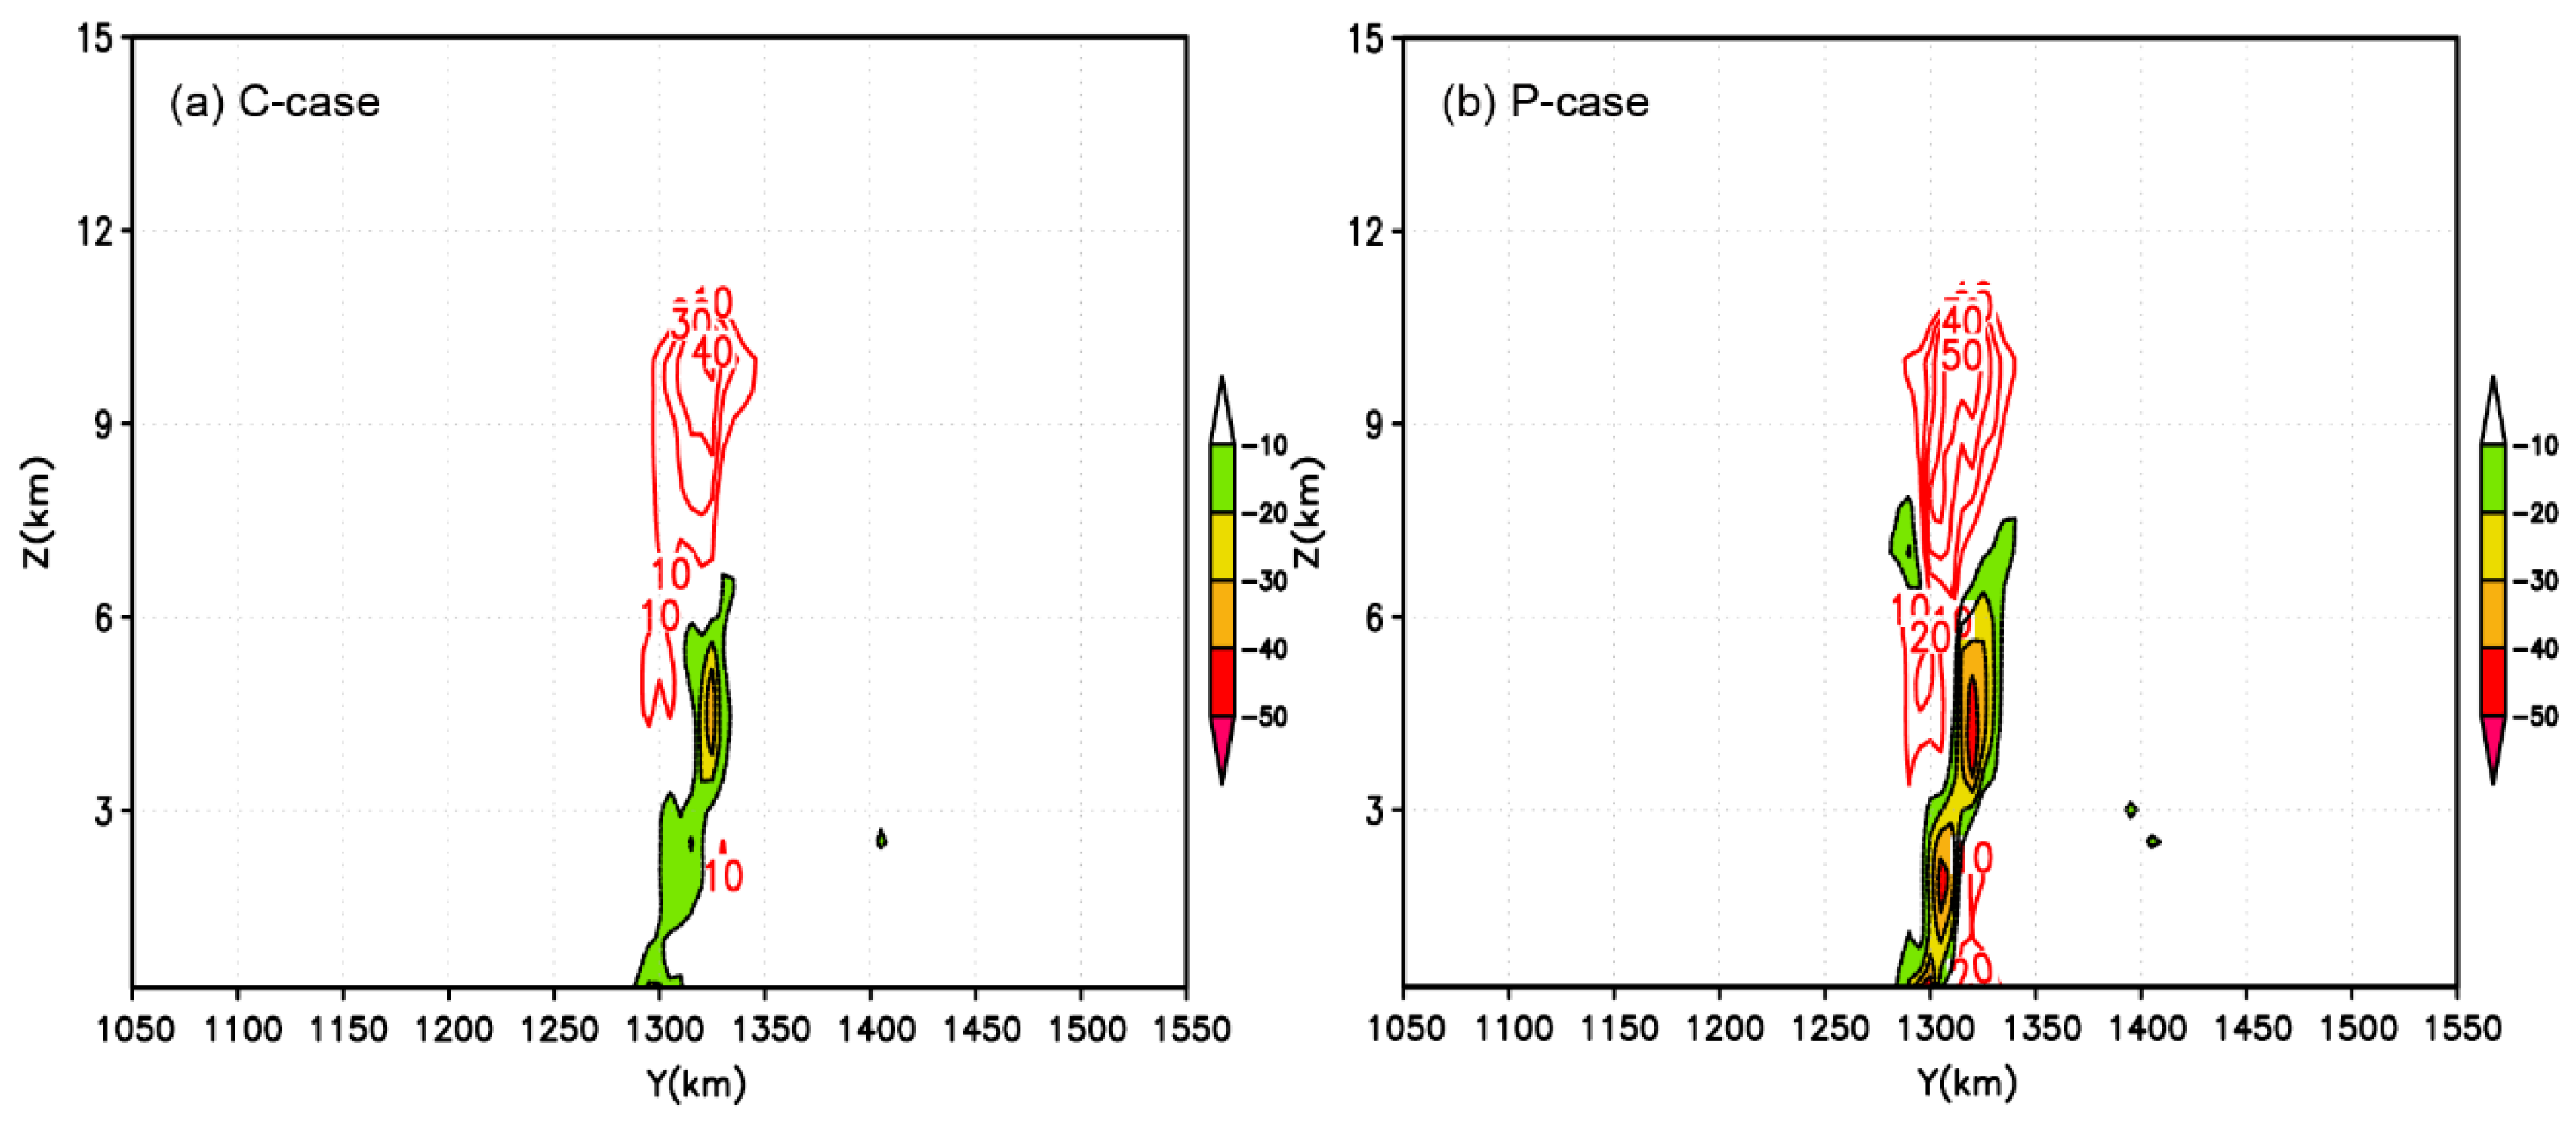
- Aerosols affect Mei-Yu frontal precipitation by first changing microphysical processes. Under polluted conditions, these more numerous and smaller cloud droplets suppressed auto-conversion and collision–coalescence processes, and hence resulted in late raindrop formation, which initially delays the onset of Mei-Yu precipitation. However, a larger amount of cloud water is transported to above the freezing level, increasing ice-phase particle growth by riming and the WBF processes, and producing large amounts of snow and graupel. The melting of snow and graupel is the main reason why rain increases. Furthermore, during the developing and mature stages, cold rain processes are more vigorous under polluted conditions. With cold-cloud processes “towing”, warm-cloud progresses are encouraged. Thus, cold-cloud and warm-cloud interactions mutually boost each other. This is perhaps the more complicated and particular microphysical mechanism by which aerosols affects Mei-Yu frontal precipitation.
- (3)
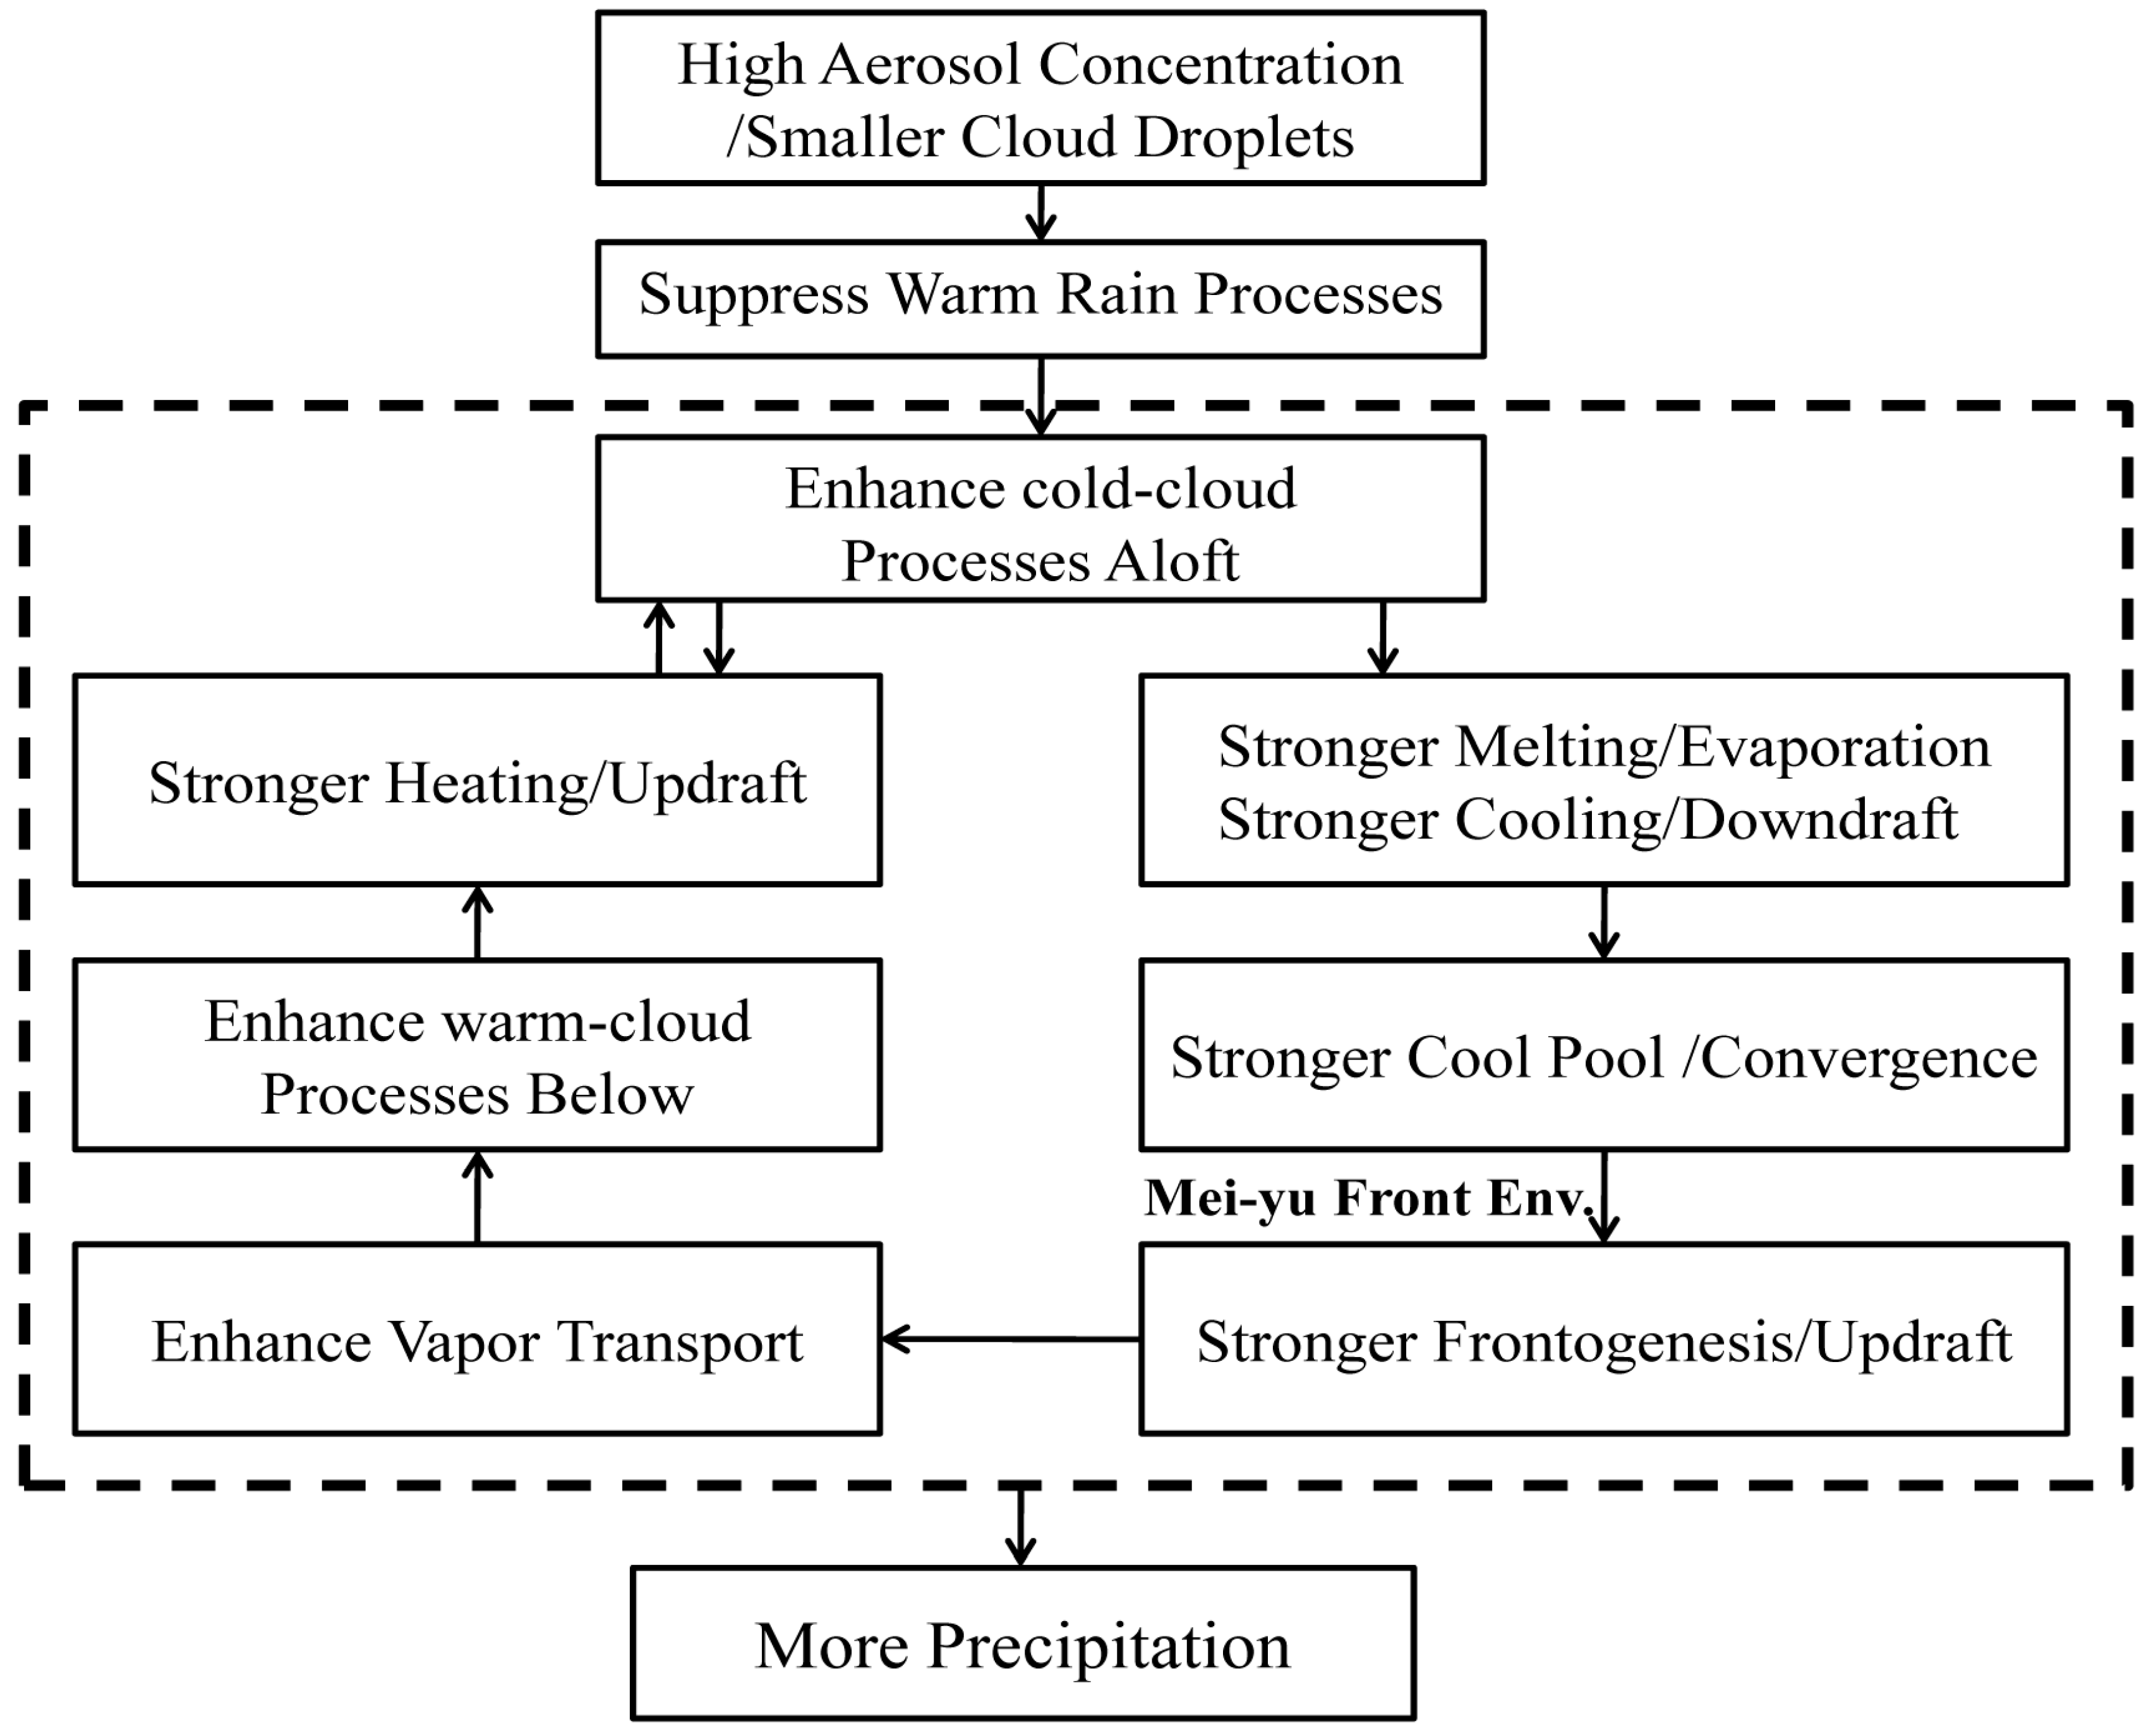
- High aerosol concentrations first influence cloud microphysical processes, enhance latent heat release, and then strengthen updrafts, downdrafts, and low-level convergence, forming DDE. In turn, DDE further strengthens microphysical processes and creates the first positive feedback loop. In Mei-Yu frontal environments, the enhanced DDE and the cool pool effect result in stronger frontogenesis, which strengthens frontal dynamic processes. This further increases both vertical and horizontal transportation of water vapor and form VPE, which in turn strengthens microphysical processes and creates the second positive feedback loop. Many physical processes and effects interact with each other, forming and strengthening both microphysical–dynamic feedback loops, leading to the well-organized Mei-Yu front precipitation system. Overall, the combined effect is to increase Mei-Yu front precipitation. The interaction of microphysical processes and dynamic processes, and the positive feedback loops they create, are the main physical mechanisms behind the impacts of aerosol on Mei-Yu frontal precipitation.
Author Contributions
Funding
Conflicts of Interest
References
- Xu, X.; Ren, W. Prediction of Air Pollution Concentration Based on mRMR and Echo State Network. Appl. Sci. 2019, 9, 1811. [Google Scholar] [CrossRef]
- Błaszczak, B.; Widziewicz-Rzońca, K.; Zioła, N.; Klejnowski, K.; Juda-Rezler, K. Chemical Characteristics of Fine Particulate Matter in Poland in Relation with Data from Selected Rural and Urban Background Stations in Europe. Appl. Sci. 2019, 9, 98. [Google Scholar] [CrossRef]
- Guo, J.J.; Zhang, X.X.; Wu, Y.Y.; Zhaxi, Y.; Che, H.Z.; La, B.; Wang, W.; Li, X.W. Spatio-temporal variation trends of satellite-based aerosol optical depth in China during 1980–2008. Atmos. Environ. 2011, 45, 6802–6811. [Google Scholar] [CrossRef]
- Chen, T.; Guo, J.; Li, Z.; Zhao, C.; Liu, H.; Cribb, M.; Wang, F.; He, J. A CloudSat perspective on the cloud climatology and its association with aerosol perturbations in the vertical over eastern China. J. Atmos. Sci. 2016, 73, 3599–3616. [Google Scholar] [CrossRef]
- Huo, F.; Ma, H.; Song, J.; Dai, A.; Jiang, Z. Impact of Chinese Urbanization and Aerosol Emissions on the East Asian Summer Monsoon. J. Clim. 2017, 30, 1019–1039. [Google Scholar]
- Li, Z.; Niu, F.; Fan, J.; Liu, Y.; Rosenfeld, D.; Ding, Y. Long-term impacts of aerosols on the vertical development of clouds and precipitation. Nat. Geosci. 2011, 4, 888–894. [Google Scholar] [CrossRef]
- Xin, J.; Wang, Y.; Pan, Y.; Ji, D.; Liu, Z.; Wen, T.; Wang, Y.; Li, X.; Sun, Y.; Sun, J.; et al. The Campaign on Atmospheric Aerosol Research Network of China: CARE-China. Bull. Am. Meteorol. Soc. 2015, 96, 1137–1155. [Google Scholar] [CrossRef]
- Braun, R.A.; Dadashazar, H.; Macdonald, A.B.; Aldhaif, A.M.; Maudlin, L.C.; Crosbie, E.; Aghdam, M.A.; Mardi, A.H.; Sorooshian, A. Impact of Wildfire Emissions on Chloride and Bromide Depletion in Marine Aerosol Particles. Environ. Sci. Technol. 2017, 51, 9013–9021. [Google Scholar] [CrossRef]
- Li, Z.Q.; Xu, H.; Li, K.T.; Li, D.H.; Xie, Y.S.; Li, L.; Zhang, Y.; Gu, X.F.; Zhao, W.; Tian, Q.J.; et al. Comprehensive Study of Optical, Physical, Chemical, and Radiative Properties of Total Columnar Atmospheric Aerosols over China: An Overview of Sun–Sky Radiometer Observation Network (SONET) Measurements. Bull. Am. Meteorol. Soc. 2018, 99, 739–755. [Google Scholar] [CrossRef]
- Sorooshian, A.; Anderson, B.; Bauer, S.E.; Braun, R.A.; Cairns, B.; Crosbie, E.; Dadashazar, H.; Diskin, G.; Ferrare, R.; Flagan, R.C.; et al. Aerosol–Cloud–Meteorology Interaction Airborne Field Investigations: Using Lessons Learned from the U.S. West Coast in the Design of ACTIVATE off the U.S. East Coast. Bull. Am. Meteorol. Soc. 2019, 100, 1511–1528. [Google Scholar] [CrossRef]
- Liu, Q.; Quan, J.; Jia, X.; Sun, Z.; Li, X.; Gao, Y.; Liu, Y. Vertical Profiles of Aerosol Composition over Beijing, China: Analysis of in Situ Aircraft Measurements. J. Atmos. Sci. 2019, 76, 231–245. [Google Scholar] [CrossRef]
- Niu, F.; Li, Z. Systematic variations of cloud top temperature and precipitation rate with aerosols over the global tropics. Atmos. Chem. Phys. 2012, 12, 8491–8498. [Google Scholar] [CrossRef]
- Wang, F.; Guo, J.; Wu, Y.; Zhang, X.; Deng, M.; Li, X.; Zhang, J.; Zhao, J. Satellite observed aerosol-induced variability in warm cloud properties under different meteorological conditions over eastern China. Atmos. Environ. 2014, 84, 122–132. [Google Scholar] [CrossRef]
- Peng, J.; Li, Z.; Zhang, H.; Liu, J.; Cribb, M. Systematic Changes in Cloud Radiative Forcing with Aerosol Loading for Deep Clouds in the Tropics. J. Atmos. Sci. 2016, 73, 231–249. [Google Scholar] [CrossRef]
- Ackerman, S.A.; Platnick, S.; Bhartia, P.K.; Duncan, B.; L’Ecuyer, T.; Heidinger, A.; Skofronick-Jackson, G.; Loeb, N.; Schmit, T.; Smith, N. Satellites See the World’s Atmosphere. Meteorol. Monogr. 2018, 59, 4.1–4.53. [Google Scholar] [CrossRef]
- Lohmann, U. A glaciation indirect effect caused by soot aerosols. Geophys. Res. Lett. 2002. [Google Scholar] [CrossRef]
- Rosenfeld, D. Suppression of rain and snow by urban and industrial air pollution. Science 2000, 287, 1793–1796. [Google Scholar] [CrossRef] [PubMed]
- Khain, A.; Pokrovsky, A.; Pinsky, M.; Seigert, A.; Phillips, V. Simulation of effects of atmospheric aerosols on deep turbulent convective clouds using a spectral microphysics mixed-phase cumulus cloud model. Part I: Model description and possible applications. J. Atmos. Sci. 2004, 61, 2983–3001. [Google Scholar] [CrossRef]
- Khain, A.; Pokrovsky, A. Simulation of effects of atmospheric aerosols on deep turbulent convective clouds using a spectral microphysics mixed-phase cumulus cloud model. Part II: Sensitivity study. J. Atmos. Sci. 2004, 61, 2963–2982. [Google Scholar] [CrossRef]
- Givati, A.; Rosenfeld, D. Quantifying Precipitation Suppression Due to Air Pollution. J. Appl. Meteorol. 2004, 43, 1038–1056. [Google Scholar] [CrossRef]
- Borys, R.D.; Lowenthal, D.H.; Cohn, S.A.; Brown, W.O.J. Mountaintop and radar measurements of anthropogenic aerosol effects on snow growth and snowfall rate. Geophys. Res. Lett. 2003, 30, 1538. [Google Scholar] [CrossRef]
- Duan, J.; Mao, J. Progress in Researches on Interaction between Aerosol and Cloud. Adv. Earth Sci. 2008, 23, 252–261. [Google Scholar]
- Xiao, H.; Yin, Y. A Numerical Study of Polluted Aerosol Effects on Precipitation in Shanxi Province. Chin. J. Atmos. Sci. 2011, 35, 235–246. [Google Scholar]
- Rosenfeld, D.; Woodley, W.L. Deep convective clouds with sustained supercooled liquid water down to—37.5 °C. Nature 2000, 405, 440–442. [Google Scholar] [CrossRef] [PubMed]
- Khain, A.; Rosenfeld, D.; Pokrovsky, A. Aerosol impact on the dynamics and microphysics of deep convective clouds. Q. J. R. Meteorol. Soc. 2005, 131, 2639–2663. [Google Scholar] [CrossRef]
- Fan, J.; Zhang, R.; Li, G.; Tao, W.-K. Effects of aerosols and relative humidity on cumulus clouds. J. Geophys. Res. 2007, 112, 14204. [Google Scholar] [CrossRef]
- Lin, J.C.; Matsui, T.; Pielke, R.A.; Kummerow, C. Effects of biomass-burning-derived aerosols on precipitation and clouds in the Amazon Basin: A satellite-based empirical study. J. Geophys. Res. 2006, 111, 19204. [Google Scholar] [CrossRef]
- Heever, S.C.V.D.; Carrió, G.G.; Cotton, W.R.; DeMott, P.J.; Prenni, A.J. Impact of nucleating aerosol on Florida storms, Part 1: Mesoscale simulations. J. Atmos. Sci. 2006, 63, 1752–1775. [Google Scholar] [CrossRef]
- Zhang, H.; McFarquhar, G.M.; Saleeby, S.M.; Cotton, W.R. Impacts of Saharan dust as CCN on the evolution of an idealized tropical cyclone. Geophys. Res. Lett. 2007, 34, 14812. [Google Scholar] [CrossRef]
- Tao, W.-K.; Li, X.; Khain, A.; Matsui, T.; Lang, S.; Simpson, J. Role of atmospheric aerosol concentration on deep convective precipitation: Cloud-resolving model simulations. J. Geophys. Res. 2007, 112. [Google Scholar] [CrossRef]
- Lynn, B.H.; Khain, A.; Dudhia, J.; Rosenfeld, D.; Rovsky, A.P.; Seifert, A. Spectral (bin) microphysics coupled with a mesoscale model (MM5) Part II: Simulation of a CAPE rain event with a squall line. Mon. Weather Rev. 2005, 133, 59–71. [Google Scholar] [CrossRef]
- Seifert, A.; Beheng, K.D. A two-moment cloud microphysics parameterization for mixed-phase clouds. Part 2: Maritime vs. continental deep convective storms. Meteorol. Atmos. Phys. 2006, 92, 67–82. [Google Scholar] [CrossRef]
- Cotton, W.R.; Zhang, H.; McFarquhar, G.M.; Saleeby, S.M. Should we consider polluting hurricanes to reduce their intensity. J. Weather Modif. 2007, 39, 70–73. [Google Scholar]
- Khain, A.; Lynn, B.; Dudhia, A.J. Aerosol Effects on Intensity of Landfalling Hurricanes as Seen from Simulations with the WRF Model with Spectral Bin Microphysics. J. Atmos. Sci. 2010, 67, 365–384. [Google Scholar] [CrossRef]
- Rosenfeld, D.; Woodley, W.L.; Khain, A.; Cotton, W.R.; Carrió, G.; Ginis, I.; Golden, J.H. Aerosol Effects on Microstructure and Intensity of Tropical Cyclones. Bull. Am. Meteorol. Soc. 2012, 93, 987–1001. [Google Scholar] [CrossRef]
- Jiang, B.; Huang, B.; Lin, W.; Xu, S. Investigation of the Effects of Anthropogenic Pollution on Typhoon Precipitation and Microphysical Processes Using WRF-Chem. J. Atmos. Sci. 2016, 73, 1593–1610. [Google Scholar] [CrossRef]
- Saleeby, S.M.; Posselt, D.J.; Igel, A.L.; Heever, S.C.V.D.; Naud, C.M. Sensitivity of Warm-Frontal Processes to Cloud-Nucleating Aerosol Concentrations. J. Atmos. Sci. 2013, 70, 1768–1783. [Google Scholar]
- Thompson, G.; Eidhammer, T. A Study of Aerosol Impacts on Clouds and Precipitation Development in a Large Winter Cyclone. J. Atmos. Sci. 2014, 71, 3636–3658. [Google Scholar] [CrossRef]
- Sampe, T.; Xie, S.P. Large-Scale Dynamics of the Meiyu-Baiu Rainband: Environmental Forcing by the Westerly Jet. J. Clim. 2010, 23, 113–134. [Google Scholar] [CrossRef]
- Kuwano-Yoshida, A.; Taguchi, B.; Xie, S.P. Baiu Rainband Termination in Atmospheric and Coupled Atmosphere–Ocean Models. J. Clim. 2013, 26, 10111–10124. [Google Scholar] [CrossRef]
- Ninomiya, K.; Akiyama, T. Multi-scale Features of Baiu, the Summer Monsoon over Japan and the East Asia. J. Meteorol. Soc. Jpn. 1992, 70, 467–495. [Google Scholar] [CrossRef]
- Yoshizaki, M.; Kato, T.; Tanaka, Y.; Takayama, H.; Shoji, Y.; Seko, H.; Arao, K.; Manabe, K.; Members of X-BAIU-98 Observation. Analytical and Numerical Study of the 26 June 1998 Orographic Rainband Observed in Western Kyushu, Japan. J. Meteorol. Soc. Jpn. 2000, 78, 835–856. [Google Scholar] [CrossRef]
- Ding, Y.H.; Chan, J.C.L. The East Asian summer monsoon: An overview. Meteorol. Atmos. Phys. 2005, 89, 117–142. [Google Scholar]
- Xu, Q. Recent strong decadal change of Mei-yu in 121 years. Adv. Water Sci. 2007, 18, 327–335. [Google Scholar]
- Zhang, D.-E. A Study of the Large Scale Flooding over Eastern China in 1755. Adv. Clim. Chang. Res. 2012, 3, 128–137. [Google Scholar] [CrossRef]
- Ma, Y.; Chen, W.; Wang, L. A comparative study of the interannual variation of summer rain-fall anomolies between the Huaihe Mei-yu season and the Jiangnan Meiyu season and their climate background. Acta Meteorol. Sin. 2011, 69, 334–343. [Google Scholar]
- Wu, Z.; Zhang, Y.; Zhang, L.; Hao, X.; Lei, H.; Zheng, H. Validation of GPM Precipitation Products by Comparison with Ground-Based Parsivel Disdrometers over Jianghuai Region. Water 2019, 11, 1260. [Google Scholar] [CrossRef]
- Sun, Y.; Yin, D.P.; Yao, L.N.; Cao, S.Y. Temporal and spatial distribution and circulation features of the Mei-yu precipitation anomaly in Jiangsu in the latest 50 years. Torrential Rain Disasters 2012, 31, 149–154. [Google Scholar]
- Huang, W.; Yu, R.C.; Li, J. Analysis of changes in precipitation intensity in later-summer over southeast coast of china in 1967–2006. Adv. Clim. Chang. Res. 2012, 8, 164–170. [Google Scholar]
- Duan, J.; Mao, J.T. Study on the distribution and variation trends of atmospheric aerosol optical depth over the Yangtze River Delta. Acta Sci. Circumst. 2007, 27, 537–543. [Google Scholar]
- Yu, X.; Zhu, B.; Yin, Y.; Fan, S.; Chen, A. Seasonal variation of columnar aerosol optical properties in Yangtze River Delta in China. Adv. Atmos. Sci. 2011, 28, 1326–1335. [Google Scholar] [CrossRef]
- Luo, Y.X.; Chen, J.; Zheng, X.B.; Zhao, T.L. Climatology of aerosol optical depth over China from recent 10 years of MODIS remote sensing data. Ecol. Environ. Sci. 2012, 21, 876–883. [Google Scholar] [CrossRef]
- Yu, X.; Ma, J.; Kumar, K.R.; Zhu, B.; An, J.; He, J.; Li, M. Measurement and analysis of surface aerosol optical properties over urban Nanjing in the Chinese Yangtze River Delta. Sci. Total Environ. 2016, 542, 277–291. [Google Scholar] [CrossRef] [PubMed]
- Zhuang, B.; Wang, T.; Liu, J.; Li, S.; Xie, M.; Han, Y.; Chen, P.; Hu, Q.; Yang, X.Q.; Fu, C.; et al. The surface aerosol optical properties in the urban area of Nanjing, west Yangtze River Delta, China. Atmos. Chem. Phys. 2017, 17, 1143–1160. [Google Scholar] [CrossRef]
- Qin, Y.S.; Yin, Y.; Yang, S.Y.; Chen, K. Chemical characteristics of the aerosols and their effect on microphysical properties of clouds in spring and summer over Mt. Huang. Acta Meteorol. Sin. 2012, 70, 1334–1346. [Google Scholar]
- Yin, Y.; Chen, Q.; Jin, L.; Chen, B.; Zhu, S.; Zhang, X. The effects of deep convection on the concentration and size distribution of aerosol particles within the upper troposphere: A case study. J. Geophys. Res. Atmos. 2012, 117, D22. [Google Scholar] [CrossRef]
- Yue, Y.; Niu, S.; Sang, J.; lÜ, J. Observational study on the distribution of cloud condensation nuclei and its causes in drought region. China Environ. Sci. 2010, 30, 593–598. [Google Scholar]
- Ke, S.; Yu, W.; Cao, J.; Wang, T. Aerodynamic Force and Comprehensive Mechanical Performance of a Large Wind Turbine during a Typhoon Based on WRF/CFD Nesting. Appl. Sci. 2018, 8, 1982. [Google Scholar] [CrossRef]
- Skamarock, W.C.; Klemp, J.B.; Dudhia, J.; Gill, D.O.; Barker, D.M.; Duda, M.; Huang, X.-Y.; Wang, W.; Powers, J.G. A description of the advanced research WRF version 3. NCAR Tech. Note TN-475+STR. Cent. Atmos. Res. 2008. [Google Scholar] [CrossRef]
- Peng, J.; Zhang, L.; Luo, Y.; Zhang, Y. Mesoscale Energy Spectra of the Mei-Yu Front System. Part I: Kinetic Energy Spectra. J. Atmos. Sci. 2014, 71, 37–55. [Google Scholar] [CrossRef]
- Klemp, J.B.; Dudhia, J.; Hassiotis, A.D. An upper gravity-wave absorbing layer for NWP applications. Mon. Weather Rev. 2008, 136, 3987–4004. [Google Scholar] [CrossRef]
- Morrison, H. On the robustness of aerosol effects on an idealized super cell storm simulated with a cloud system-resolving model. Atmos. Chem. Phys. 2012, 12, 7689–7705. [Google Scholar] [CrossRef]
- Morrison, H.; Thompson, G.; Tatarskii, V. Impact of cloud microphysics on the development 20 of trailing stratiform precipitation in a simulated squall line: Comparison of one and two moment schemes. Mon. Weather Rev. 2009, 137, 991–1007. [Google Scholar] [CrossRef]
- Twomey, S. The influence of pollution on the shortwave albedo of clouds. J. Atmos. Sci. 1977, 34, 1149–1152. [Google Scholar] [CrossRef]
- Khain, A.; Lynn, B. Simulation of a supercell storm in clean and dirty atmosphere using weather research and forecast model with spectral bin microphysics. J. Geophys. Res. Atmos. 2009, 114, D19. [Google Scholar] [CrossRef]
- Lim, K.-S.S.; Hong, S.-Y.; Yum, S.S.; Dudhia, J.; Klemp, J.B. Aerosol effects on the development of a supercell storm in a double-moment bulk-cloud microphysics scheme. J. Geophys. Res. Space Phys. 2011, 116. [Google Scholar] [CrossRef]
- Simpson, J.; Woodley, W.L. Seeding Cumulus in Florida: New 1970 Results. Science 1971, 172, 117–126. [Google Scholar] [CrossRef]
- Cotton, W.R. Cloud physics: A review for 1975–1978 IUGG Quadrennial Report. Rev. Geophys. 1979, 17, 1840–1851. [Google Scholar] [CrossRef]
- Andreae, M.O.; Rosenfeld, D.; Artaxo, P.; Costa, A.A.; Frank, G.P.; Longo, K.M.; Silva-Dias, M.A.F. Smoking rain clouds over the Amazon. Science 2004, 303, 1337–1341. [Google Scholar] [CrossRef]
- Wang, Z.; Wang, T.; Guo, J.; Gao, R.; Xue, L.; Zhang, J.; Zhou, Y.; Zhou, X.; Zhang, Q.; Wang, W. Formation of secondary organic carbon and cloud impact on carbonaceous aerosols at Mount Tai, North China. Atmos. Environ. 2012, 46, 516–527. [Google Scholar] [CrossRef]
- Xia, X.; Li, Z.; Holben, B.; Wang, P.; Eck, T.; Chen, H.; Cribb, M.; Zhao, Y. Aerosol optical properties and radiative effects in the Yangtze Delta region of China. J. Geophys. Res. Space Phys. 2007, 112. [Google Scholar] [CrossRef]
- Dong, H.; Xu, H.M.; Luo, Y.L. Effects of Cloud Condensation Nuclei Concentration on Precipitation in Convection Permitting Simulations of a Squall Line Using WRF Model: Sensitivity to Cloud Microphysical Schemes. Chin. J. Atmos. Sci. 2012, 36, 145–169. [Google Scholar]
- Kawashima, M. Numerical Study of Precipitation Core-Gap Structure along Cold Fronts. J. Atmos. Sci. 2007, 64, 2355–2377. [Google Scholar] [CrossRef]
- Wang, P.; Yang, J. Observation and Numerical Simulation of Cloud Physical Processes Associated with Torrential Rain of the Meiyu Front. Adv. Atmos. Sci. 2003, 20, 77–96. [Google Scholar] [CrossRef]
- Zhang, Y.; Lei, H.; Pan, X.; Wang, C.; Xie, Y. Study on cloud micro-physical processes and precipitation formative mechanisms of a mesoscale convective system in Meiyu front in June 2004. Sci. Meteorol. Sin. 2009, 29, 434–446. [Google Scholar]
- Morrison, H.; Pinto, J.O. Mesoscale Modeling of Springtime Arctic Mixed-Phase Stratiform Clouds Using a New Two-Moment Bulk Microphysics Scheme. J. Atmos. Sci. 2005, 62, 3683–3704. [Google Scholar] [CrossRef]
- Han, J.-Y.; Baik, J.-J.; Khain, A. A Numerical Study of Urban Aerosol Impacts on Clouds and Precipitation. J. Atmos. Sci. 2012, 69, 504–520. [Google Scholar] [CrossRef]
- Tao, W.-K.; Chen, J.-P.; Li, Z.; Wang, C.; Zhang, C. Impact of Aerosols on Convective Clouds and Precipitation. Rev. Geophys. 2012, 50, 1–62. [Google Scholar] [CrossRef]
- Cheng, C.-T.; Wang, W.-C.; Chen, J.-P. Simulation of the effects of increasing cloud condensation nuclei on mixed-phase clouds and precipitation of a front system. Atmos. Res. 2010, 96, 461–476. [Google Scholar] [CrossRef]
- Ninomiya, K. Characteristics of Baiu Front as a Predominant Subtropical Front in the Summer Northern Hemisphere. J. Meteorol. Soc. Jpn. 1984, 62, 880–894. [Google Scholar] [CrossRef]
- Ross, B.B.; Orlanski, I. The Circulation Associated with a Cold Front. Part II: Moist Case. J. Atmos. Sci. 1978, 35, 445–465. [Google Scholar] [CrossRef]
- Rotunno, R.; Klemp, J.B.; Weisman, M.L. A theory for strong, long-lived squall lines. J. Atmos. Sci. 1988, 45, 463–485. [Google Scholar] [CrossRef]


| Process | Description | 15 h | 21 h | ||
|---|---|---|---|---|---|
| C-Case | P-Case | C-Case | P-Case | ||
| PRA | Accretion of droplets by rain | 0.7 | 0.4 | 1 | 1.8 |
| PRC | Auto-conversion of droplets to form rain | 0.0016 | 6 × 10⁻⁵ | 0.0012 | 5 × 10⁻⁵ |
| PSMLT | Melting of snow to form rain | 0.027 | 0.033 | 2.7 | 3.5 |
| PGMLT | Melting of graupel to form rain | 0.05 | 0.09 | 4.5 | 8 |
| PRACS | Collection of rain-snow to form rain | 0.0057 | 0.0087 | 0.18 | 0.25 |
| PRACG | Collection of rain-graupel to form rain | 0.0045 | 0.0017 | 0.5 | 0.8 |
| PRE | Evaporation of rain | −0.05 | −0.03 | −0.33 | −0.6 |
| Process | Description | 15 h | 21 h | ||
|---|---|---|---|---|---|
| C-Case | P-Case | C-Case | P-Case | ||
| PSACWG | Accretion of cloud droplets by graupel to form graupel | 0.39 | 0.66 | 0.8 | 2 |
| PRACG | Collection of raindrops by graupel to form graupel | 0.043 | 0.033 | 0.6 | 1.1 |
| PRDG | Deposition of graupel | 0.089 | 0.14 | 0.27 | 0.55 |
| PSACR | Collection of snow by super-cooled raindrop to form graupel | 0.025 | 0.04 | 0.14 | 0.22 |
| PGSACW | Collection of cloud droplets by snow to form graupel | 0.12 | 0.14 | 0.12 | 0.33 |
| PIACR | Ice-rain Collection to graupel | 0.09 | 0.04 | 0.24 | 0.5 |
| PGRACS | Collection of raindrops by snow to form graupel | 0.0003 | 0.0028 | 0.024 | 0.035 |
| MNUCCR | Freezing of raindrop to form graupel | 0.013 | 0.0008 | 0.01 | 0.0033 |
| Process | Description | 15 h | 21 h | ||
|---|---|---|---|---|---|
| C-Case | P-Case | C-Case | P-Case | ||
| PRACS | Collection of rain-snow to form snow | 0.0545 | 0.0715 | 0.24 | 0.35 |
| PSACWS | Accretion of super-cooled cloud droplets by snow (snow riming) | 0.036 | 0.047 | 0.16 | 0.24 |
| PRDS | Deposition of snow | 0.016 | 0.0083 | 0.45 | 0.65 |
| PRAI | Auto-conversion of ice to form snow | 0.0043 | 0.0048 | 0.014 | 0.024 |
| PRCI | Collection of ice crystals by snow | 0.011 | 0.001 | 0.013 | 0.024 |
| PRACIS | Accretion of ice by rain to form snow | 0.0001 | 1.3E-5 | 5E-05 | 2E-05 |
© 2019 by the authors. Licensee MDPI, Basel, Switzerland. This article is an open access article distributed under the terms and conditions of the Creative Commons Attribution (CC BY) license (http://creativecommons.org/licenses/by/4.0/).
Share and Cite
Zhang, Y.; Wu, Z.; Zhang, L.; Xie, Y.; Lei, H.; Zheng, H.; Ma, X. Modelling the Effects of Aerosol on Mei-Yu Frontal Precipitation and Physical Processes. Appl. Sci. 2019, 9, 3802. https://doi.org/10.3390/app9183802
Zhang Y, Wu Z, Zhang L, Xie Y, Lei H, Zheng H, Ma X. Modelling the Effects of Aerosol on Mei-Yu Frontal Precipitation and Physical Processes. Applied Sciences. 2019; 9(18):3802. https://doi.org/10.3390/app9183802
Chicago/Turabian StyleZhang, Yun, Zuhang Wu, Lifeng Zhang, Yanqiong Xie, Hengchi Lei, Hepeng Zheng, and Xiaolin Ma. 2019. "Modelling the Effects of Aerosol on Mei-Yu Frontal Precipitation and Physical Processes" Applied Sciences 9, no. 18: 3802. https://doi.org/10.3390/app9183802
APA StyleZhang, Y., Wu, Z., Zhang, L., Xie, Y., Lei, H., Zheng, H., & Ma, X. (2019). Modelling the Effects of Aerosol on Mei-Yu Frontal Precipitation and Physical Processes. Applied Sciences, 9(18), 3802. https://doi.org/10.3390/app9183802