Carbone Monoxide (CO) Detection Device Based on the Nickel Antimonate Oxide and a DC Electronic Circuit

 ,
, 
 , , and
Abstract
:Featured Application
Abstract
1. Introduction
2. CO Device Implementation
2.1. Synthesis of NiSb2O6 Oxide Powders
2.2. Physical Characterization of NiSb2O6 Powders
2.3. Pellet Fabrication and Sensitivity Test in CO Atmospheres
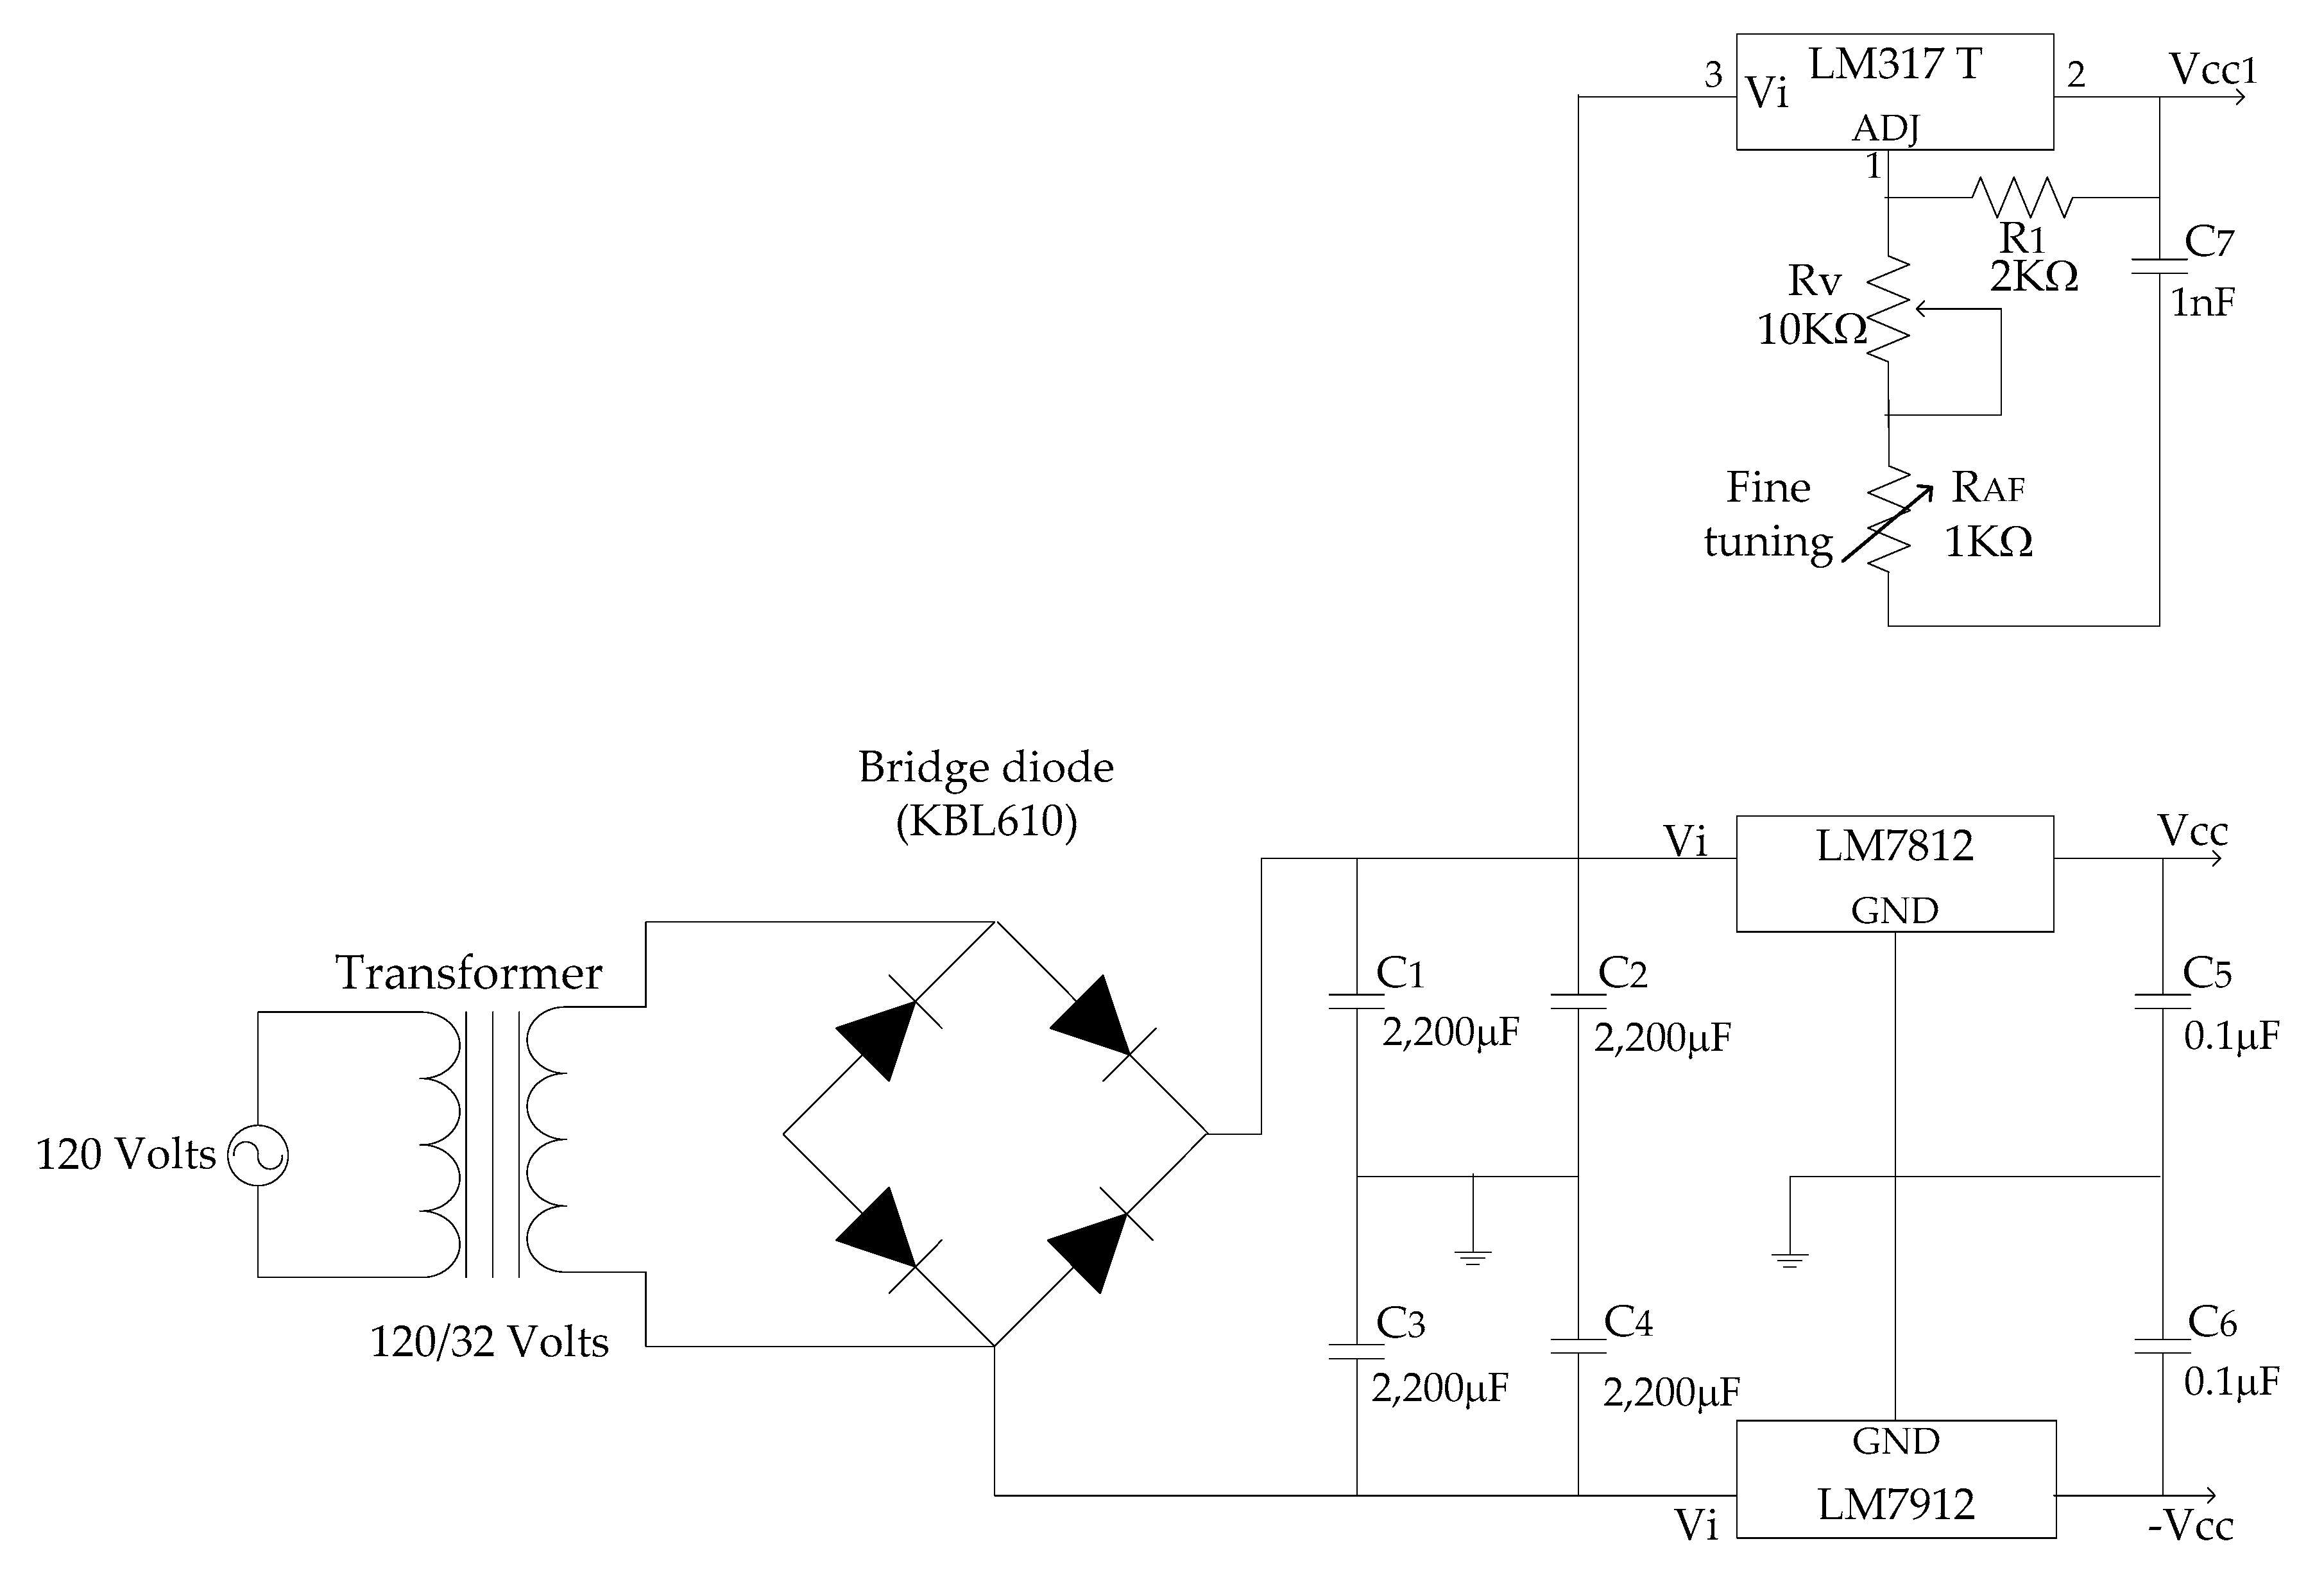
2.4. Electronic Circuit
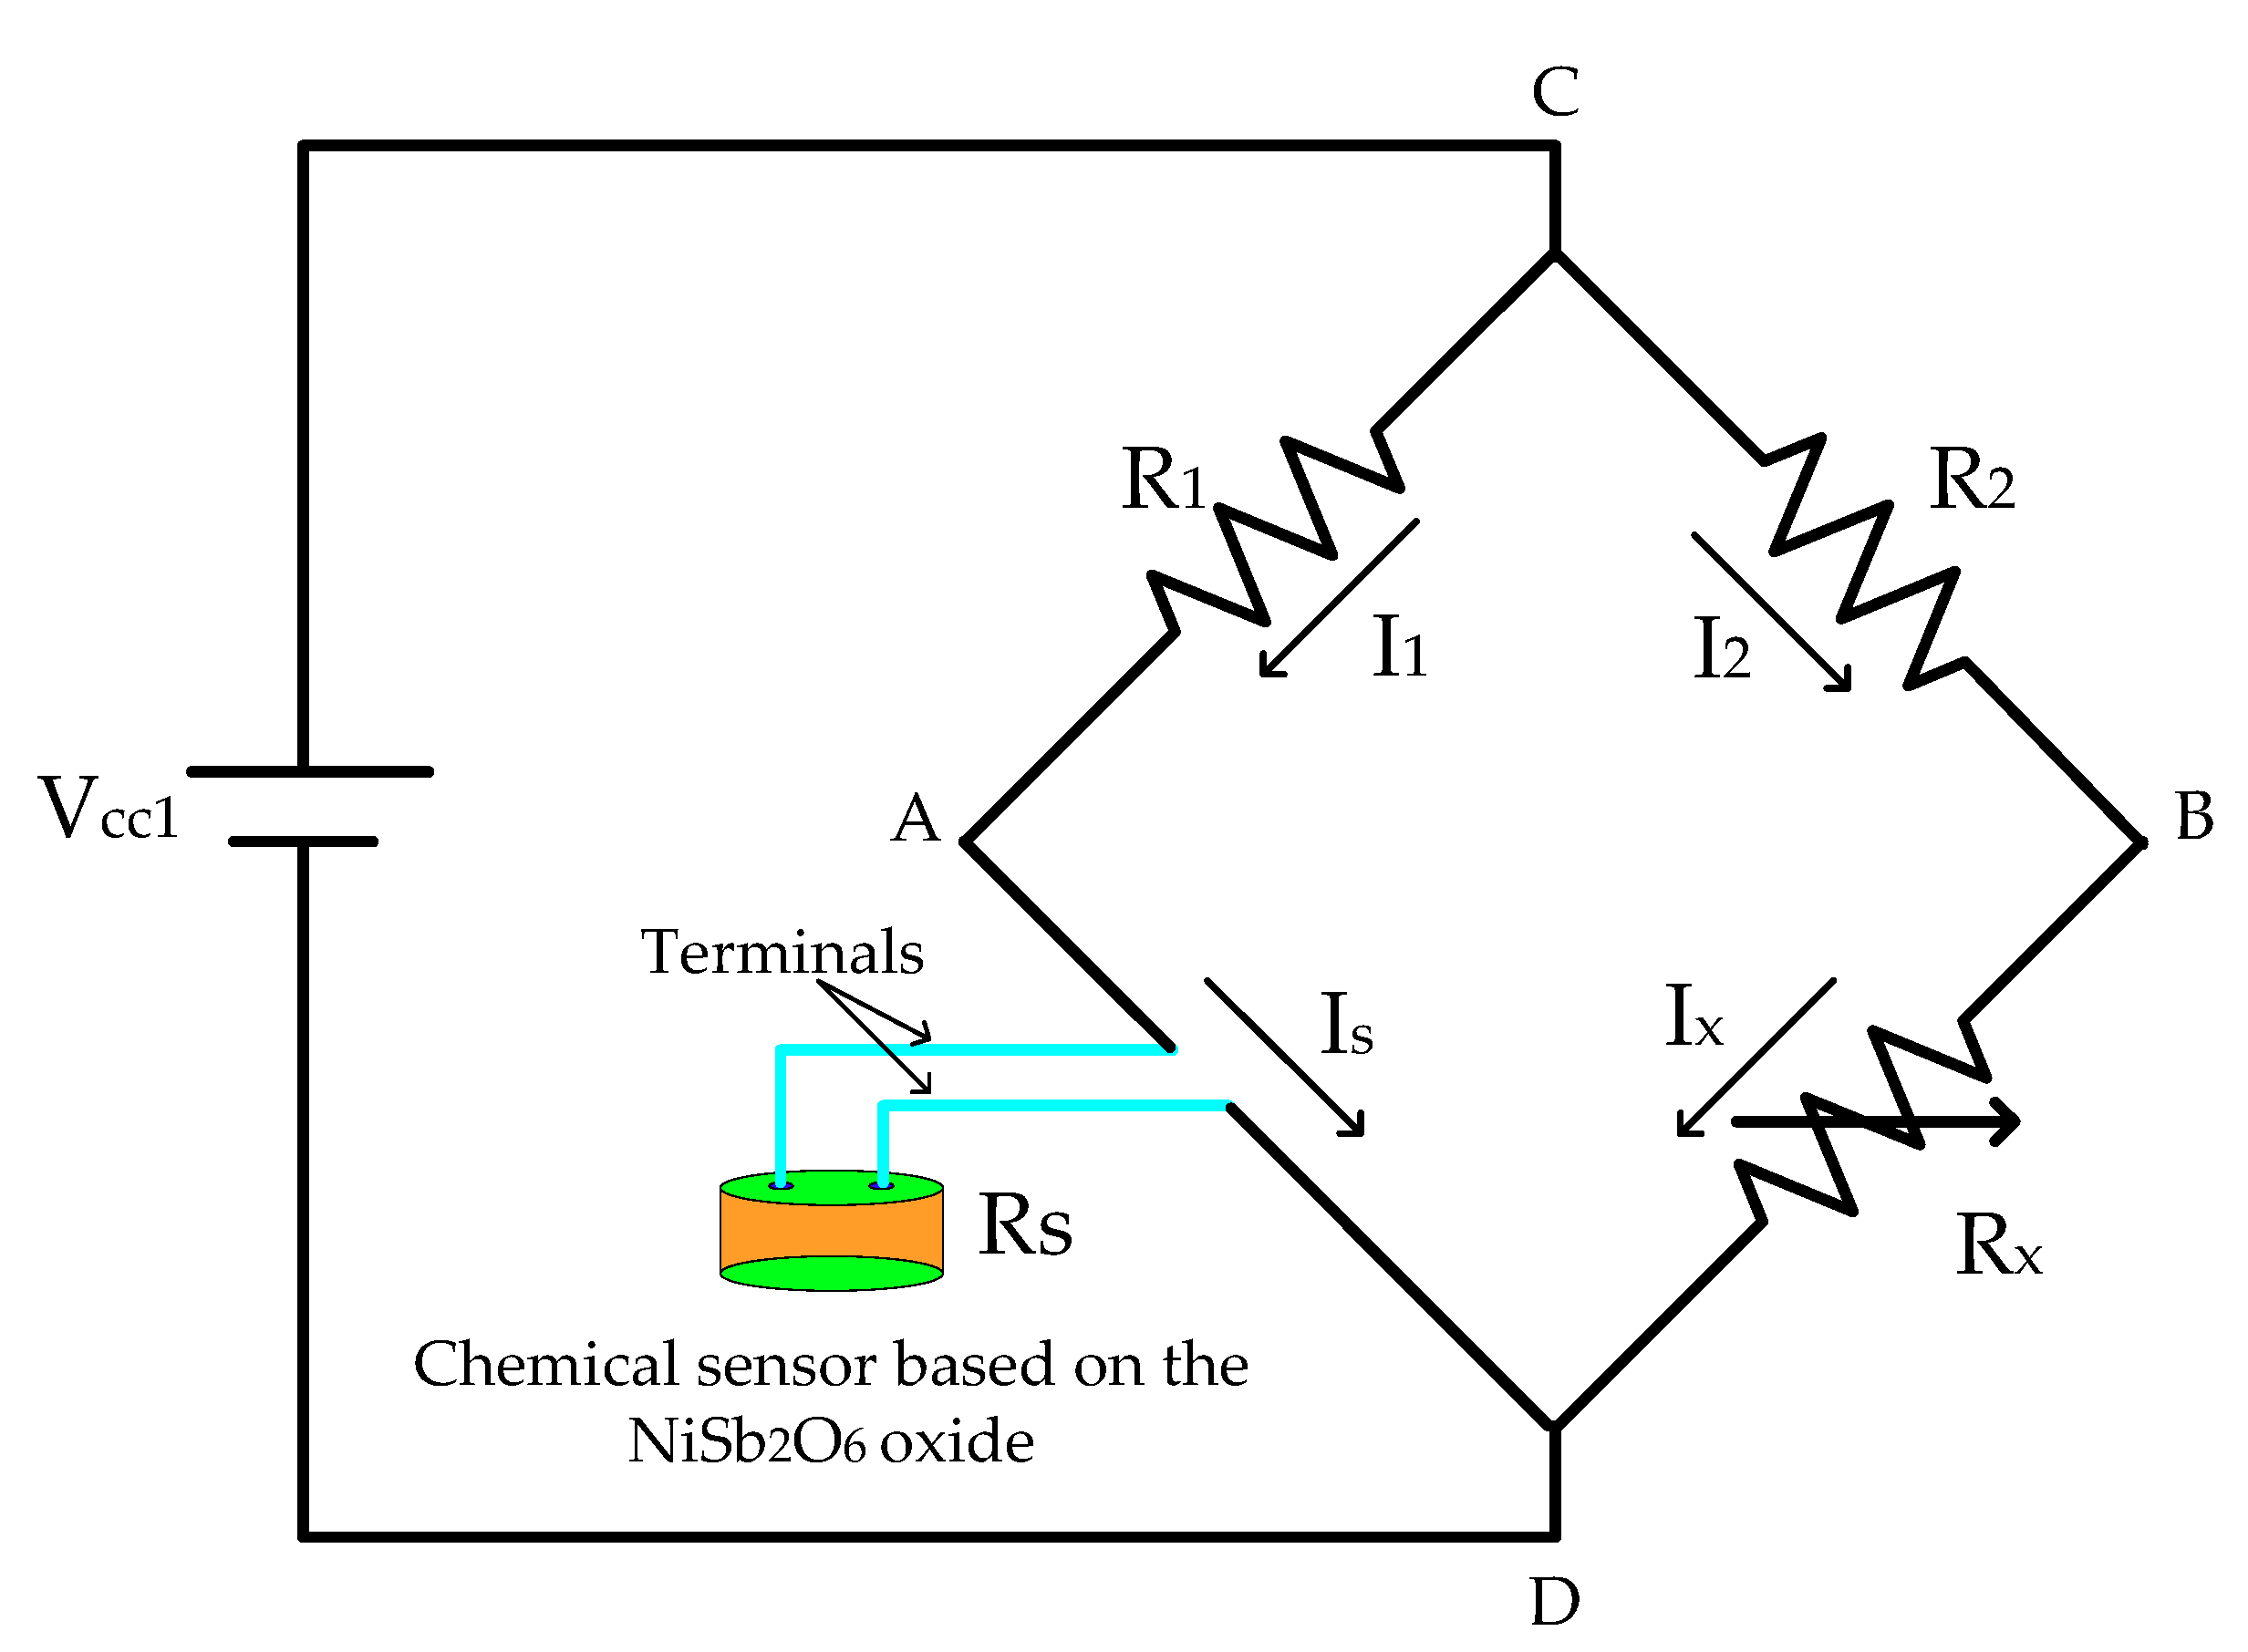
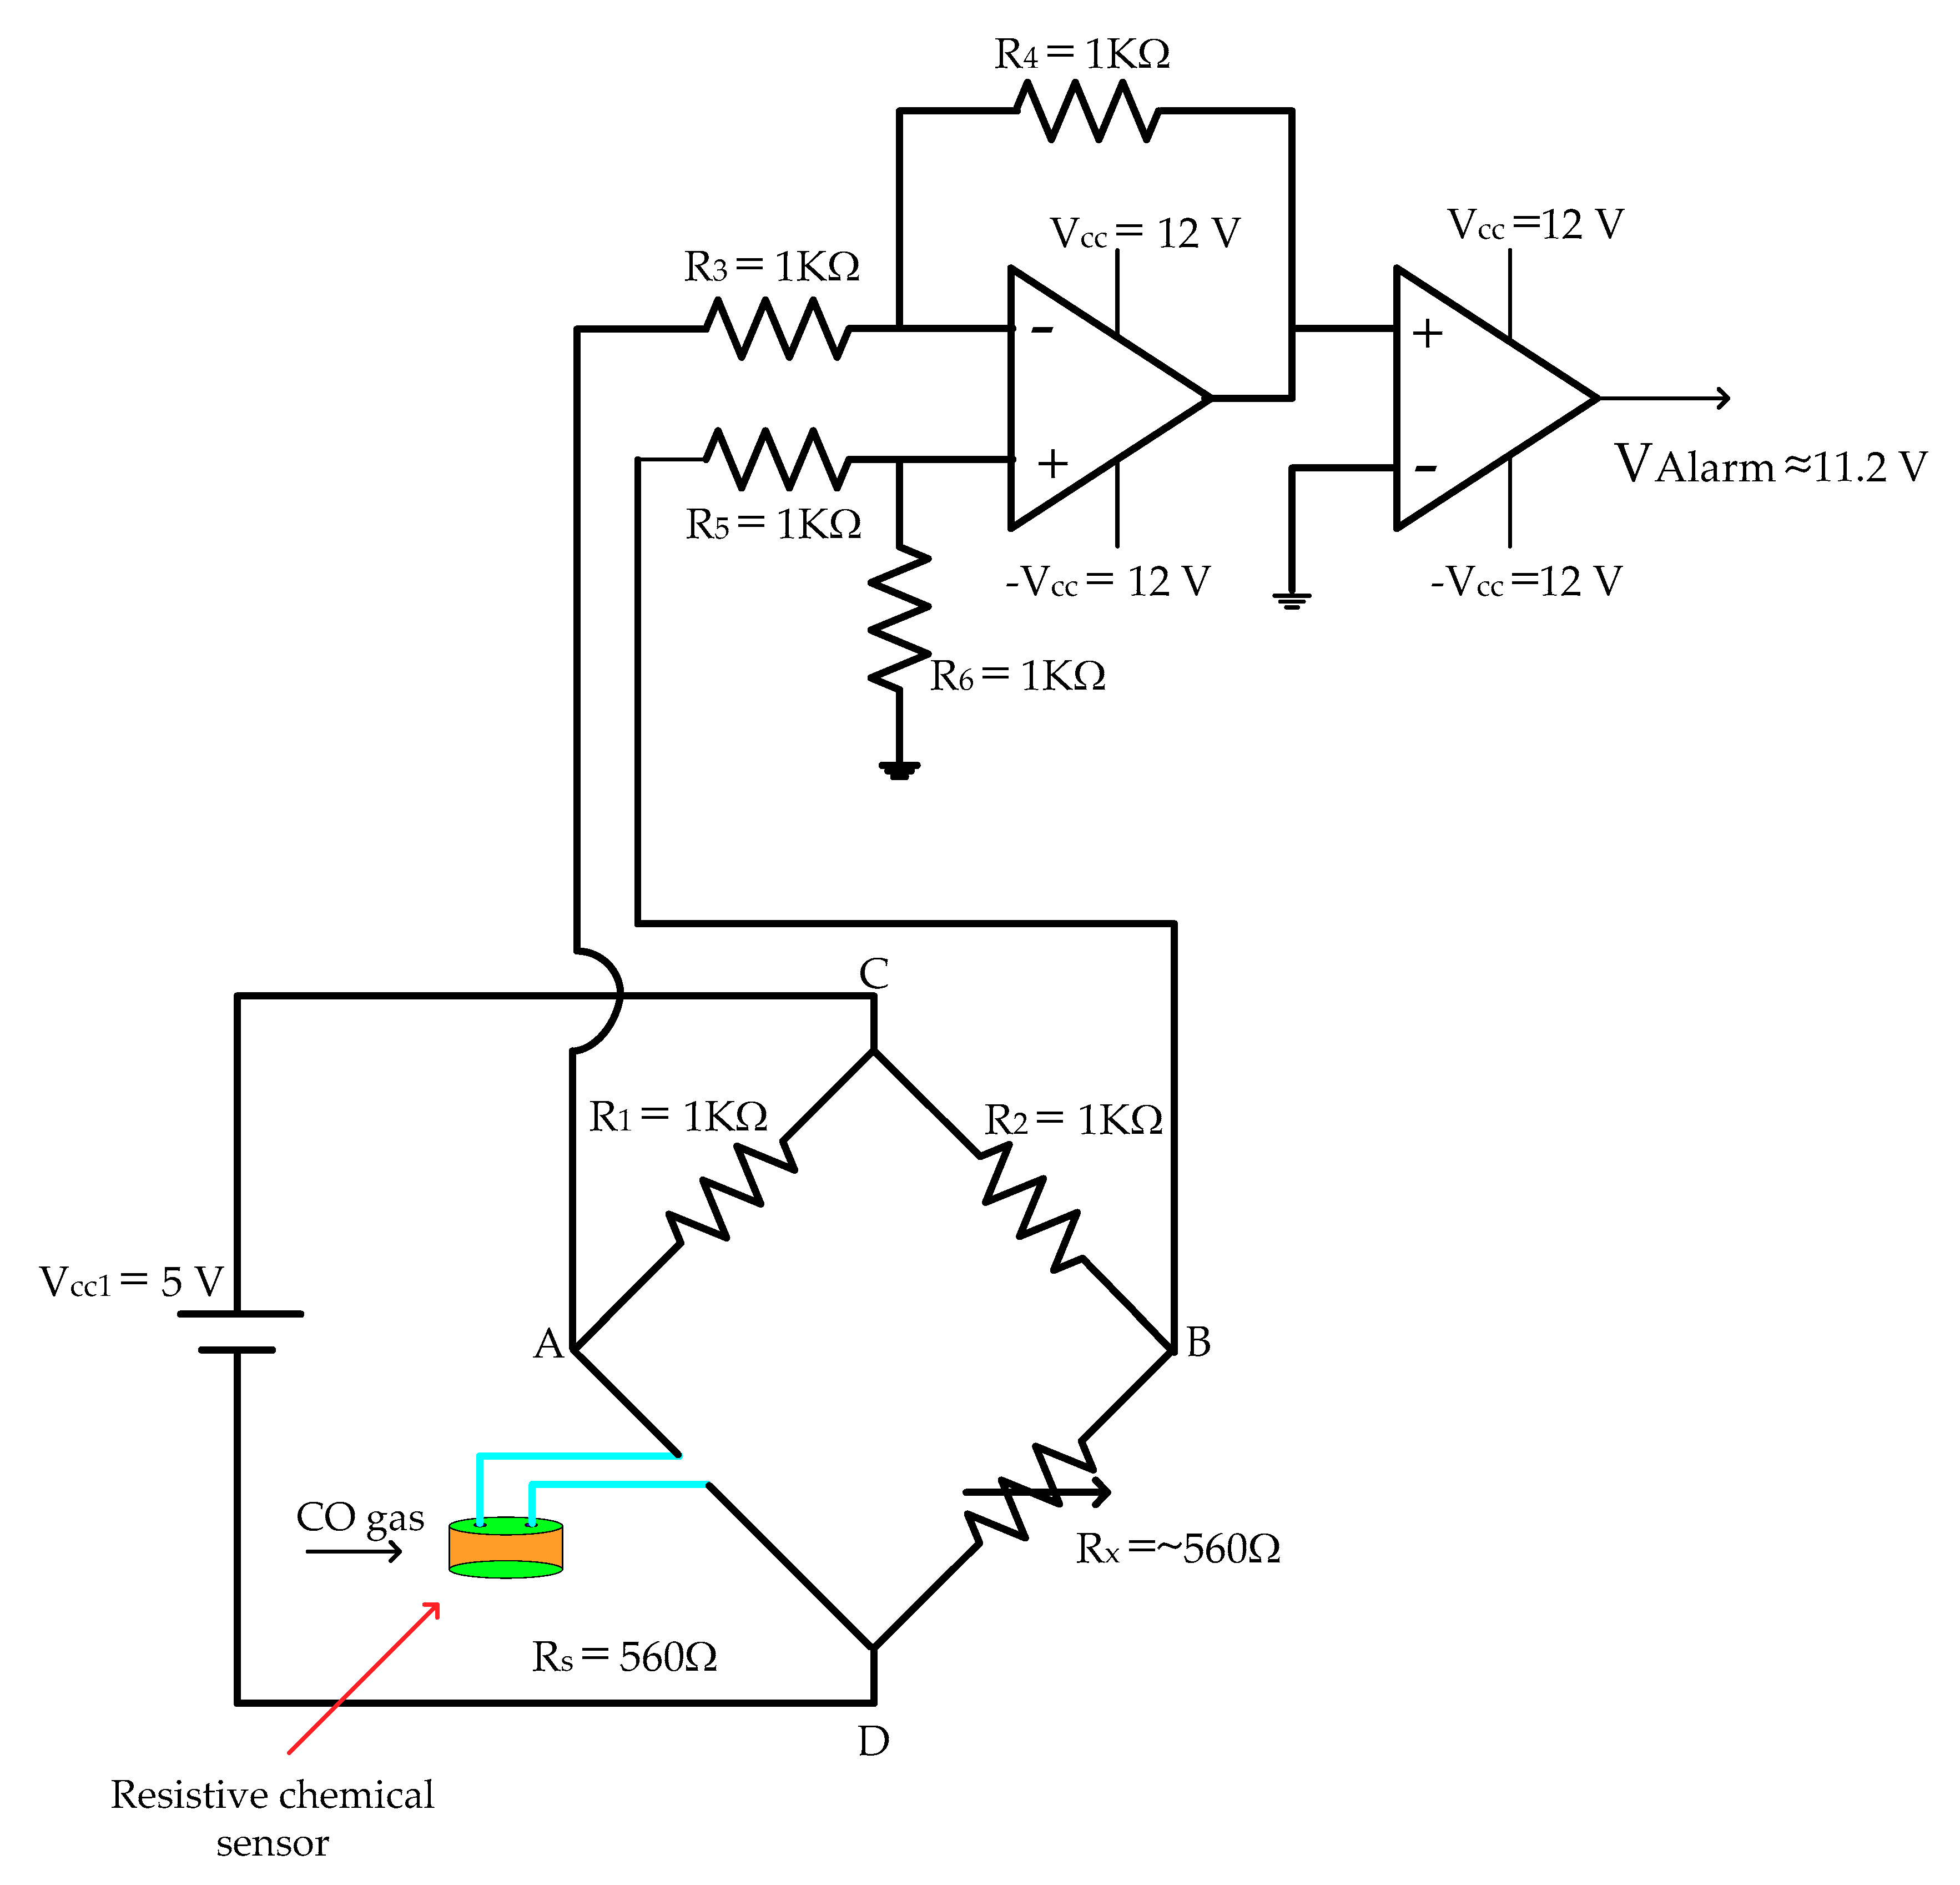
2.4.1. Signal Adaptation Circuit (Wheatstone Bridge Calibration)
2.4.2. Detection Circuit (Signal Adaptation + Signal Amplification)
3. Experimental Results
3.1. XRD Analysis
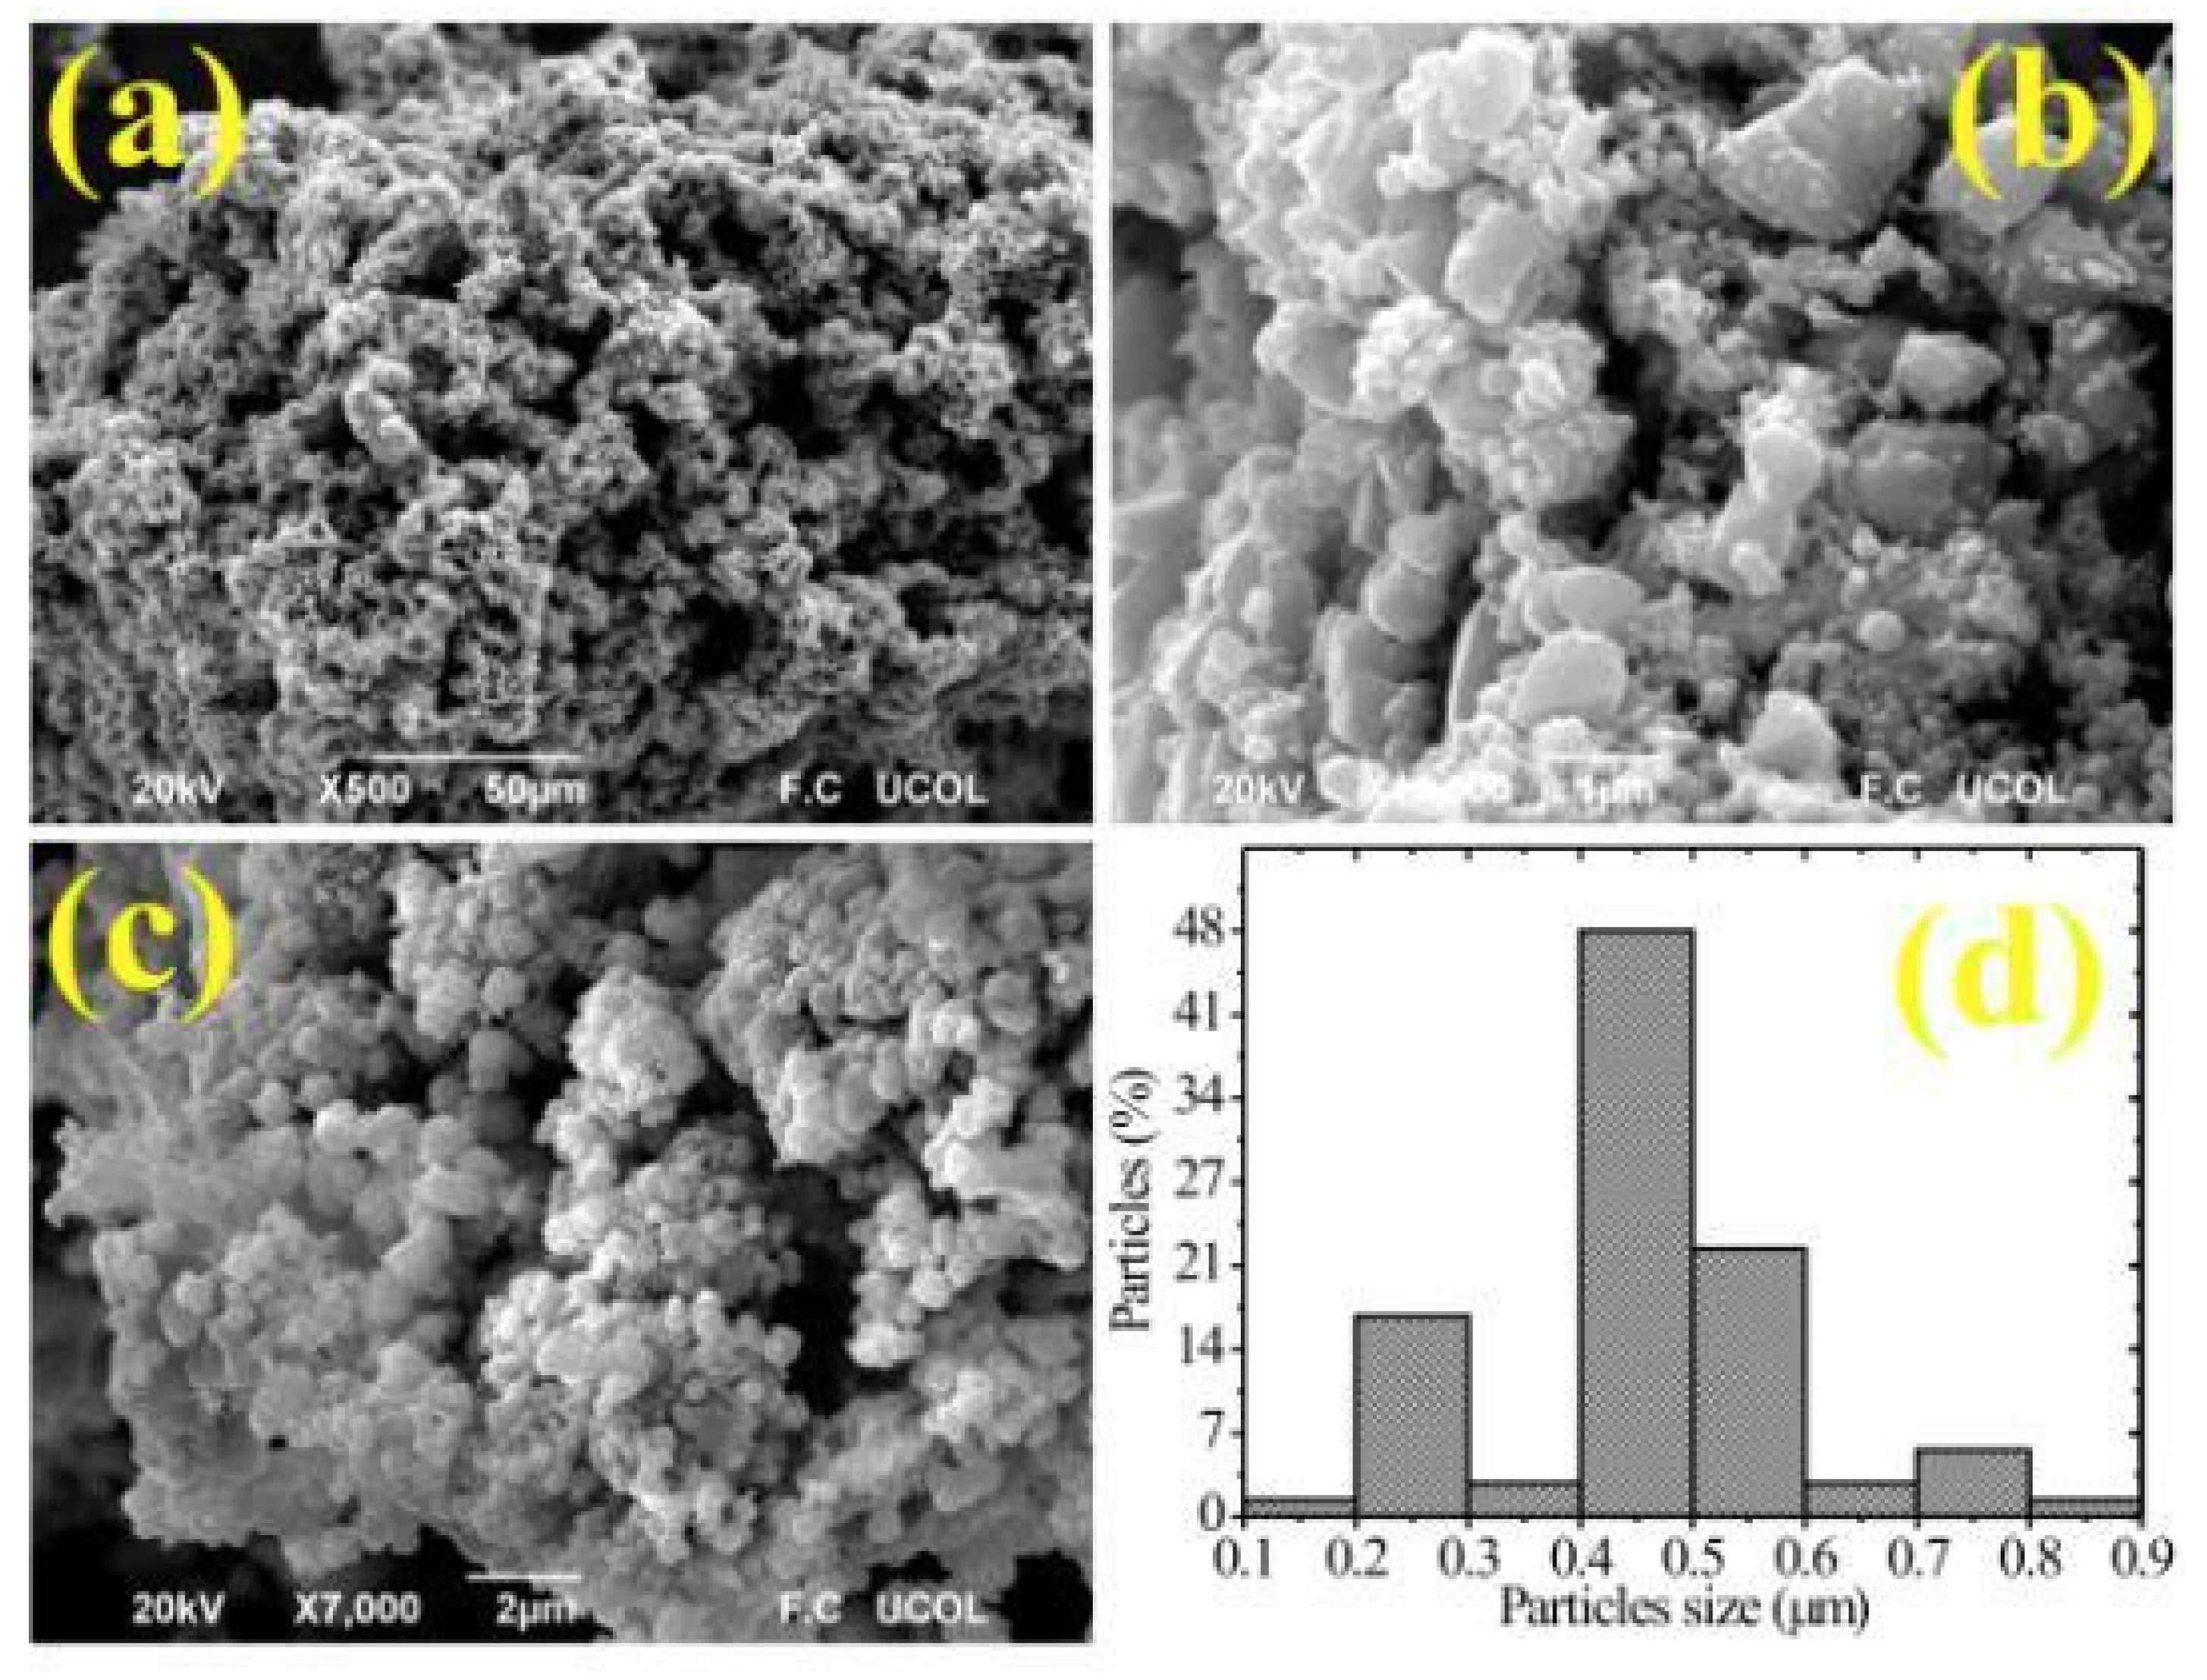
3.2. SEM Analysis
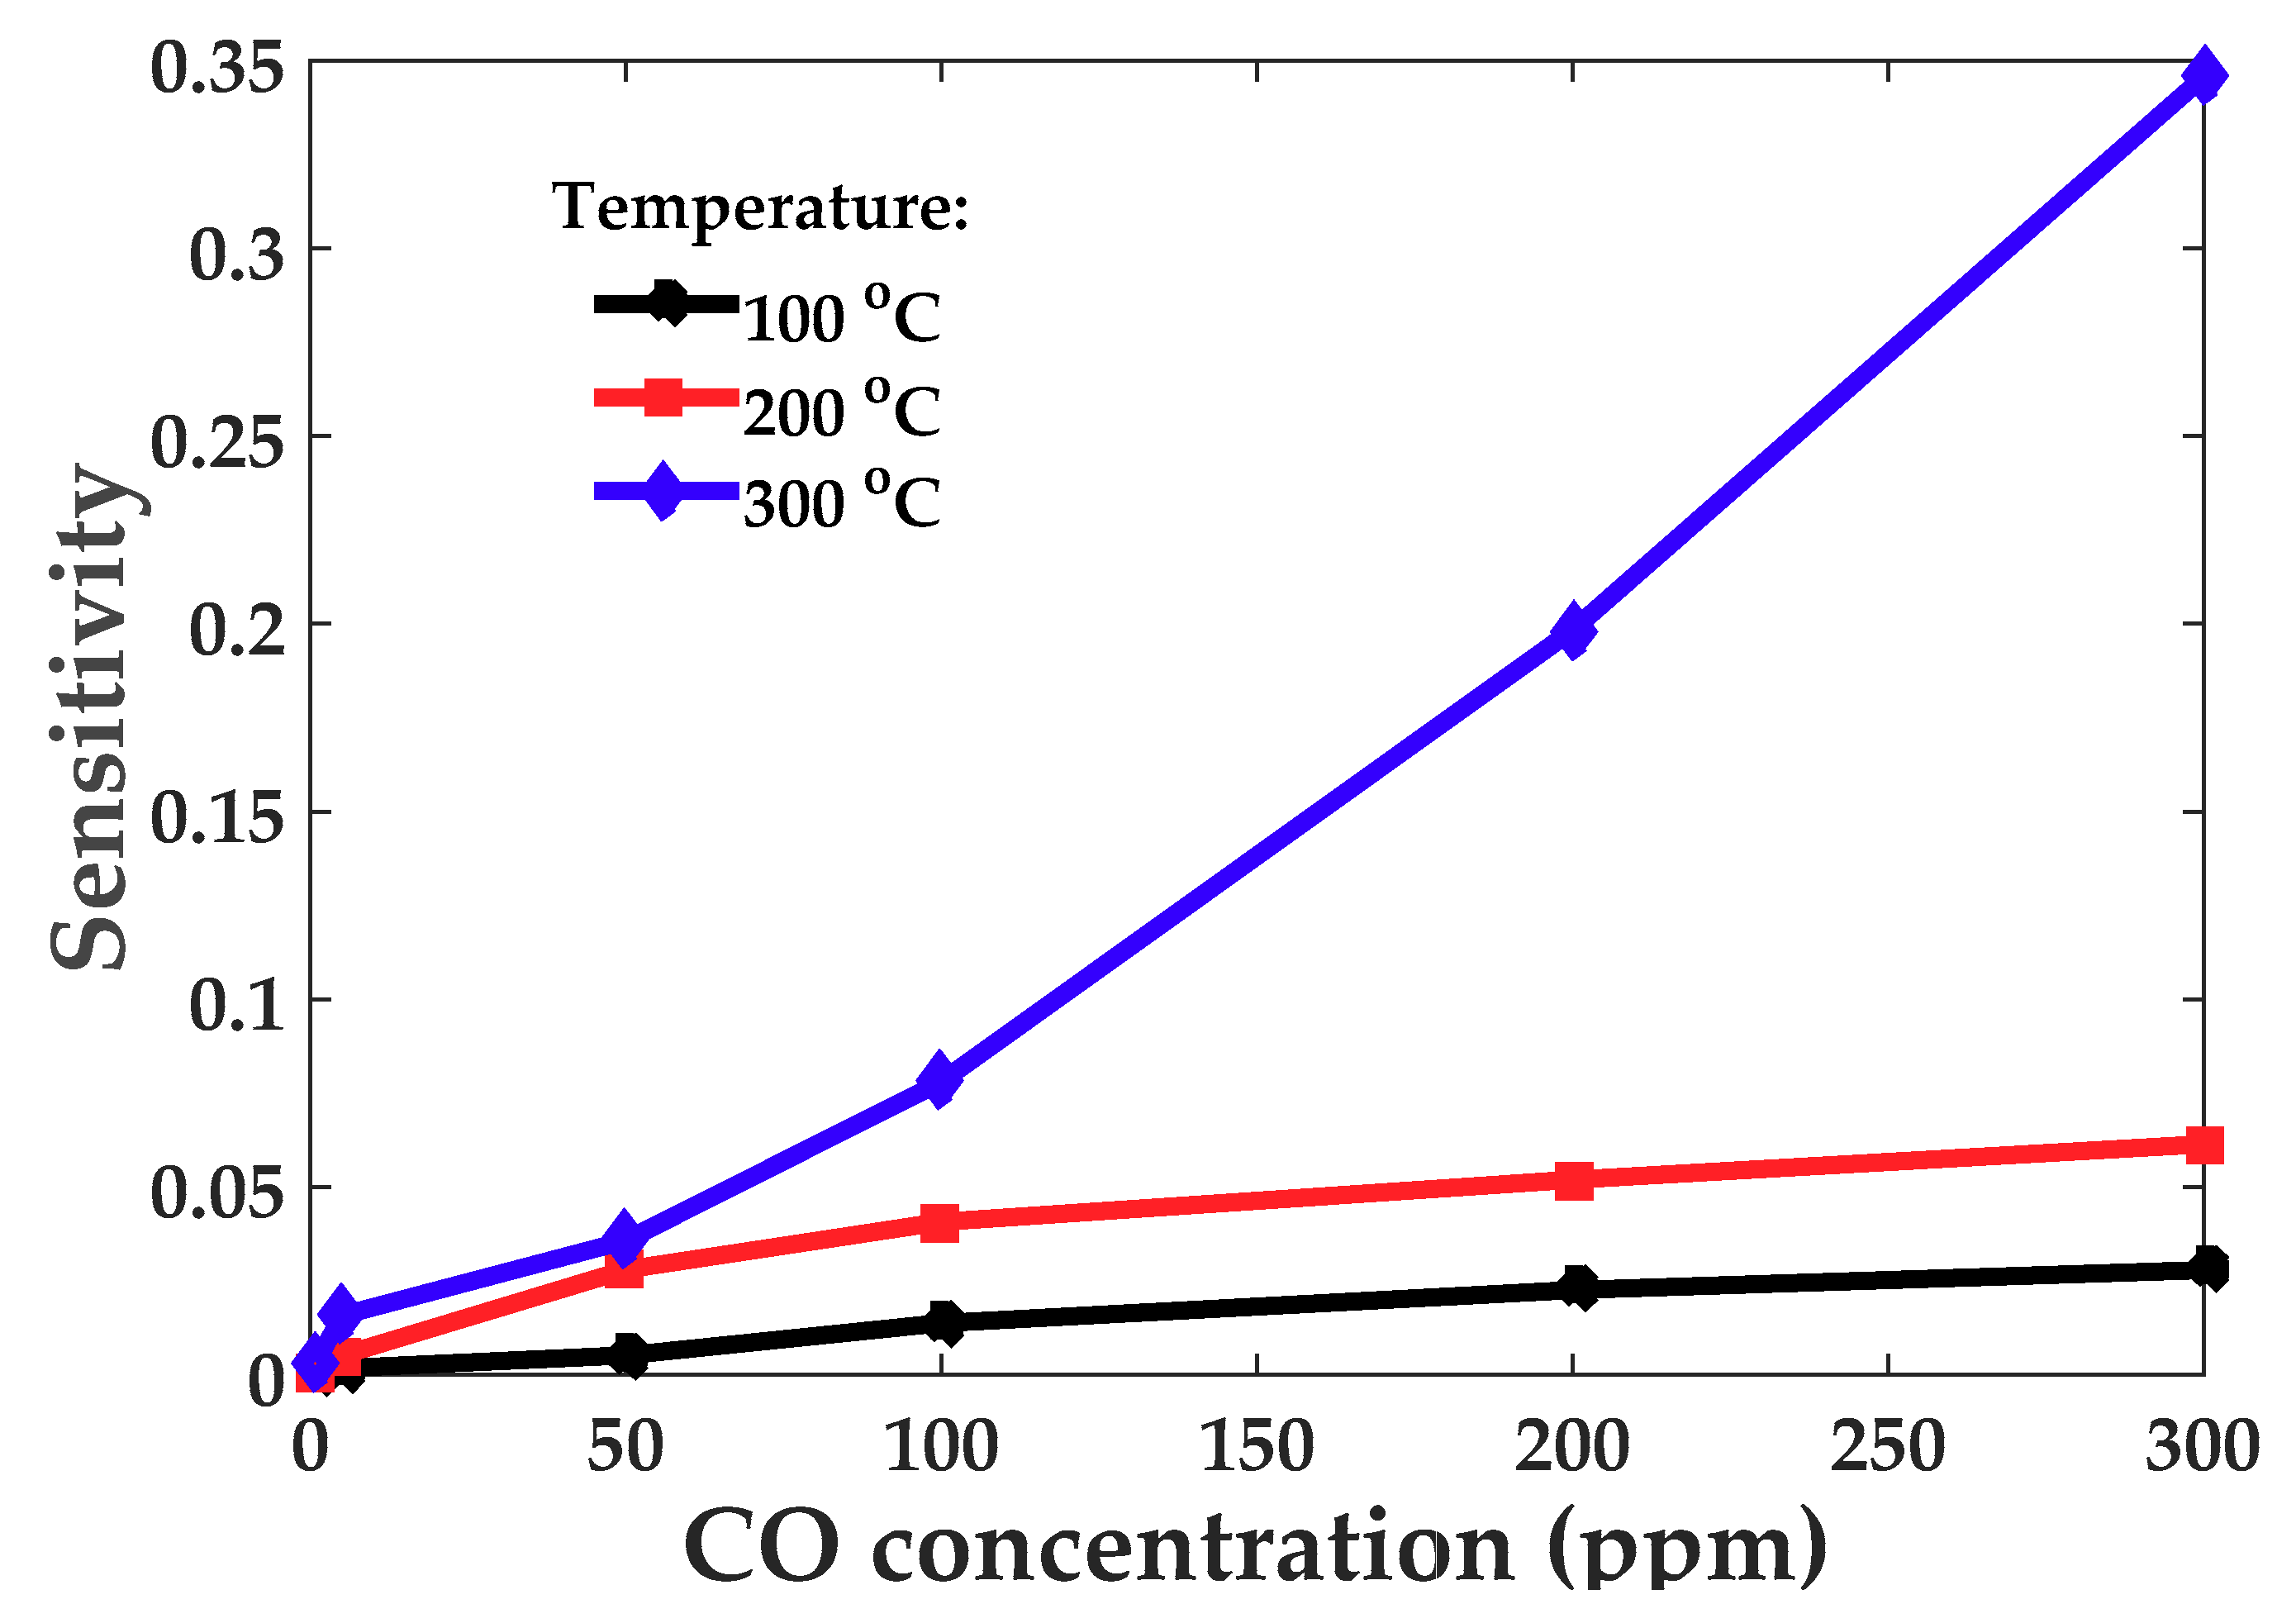
3.3. Sensing Properties Analysis
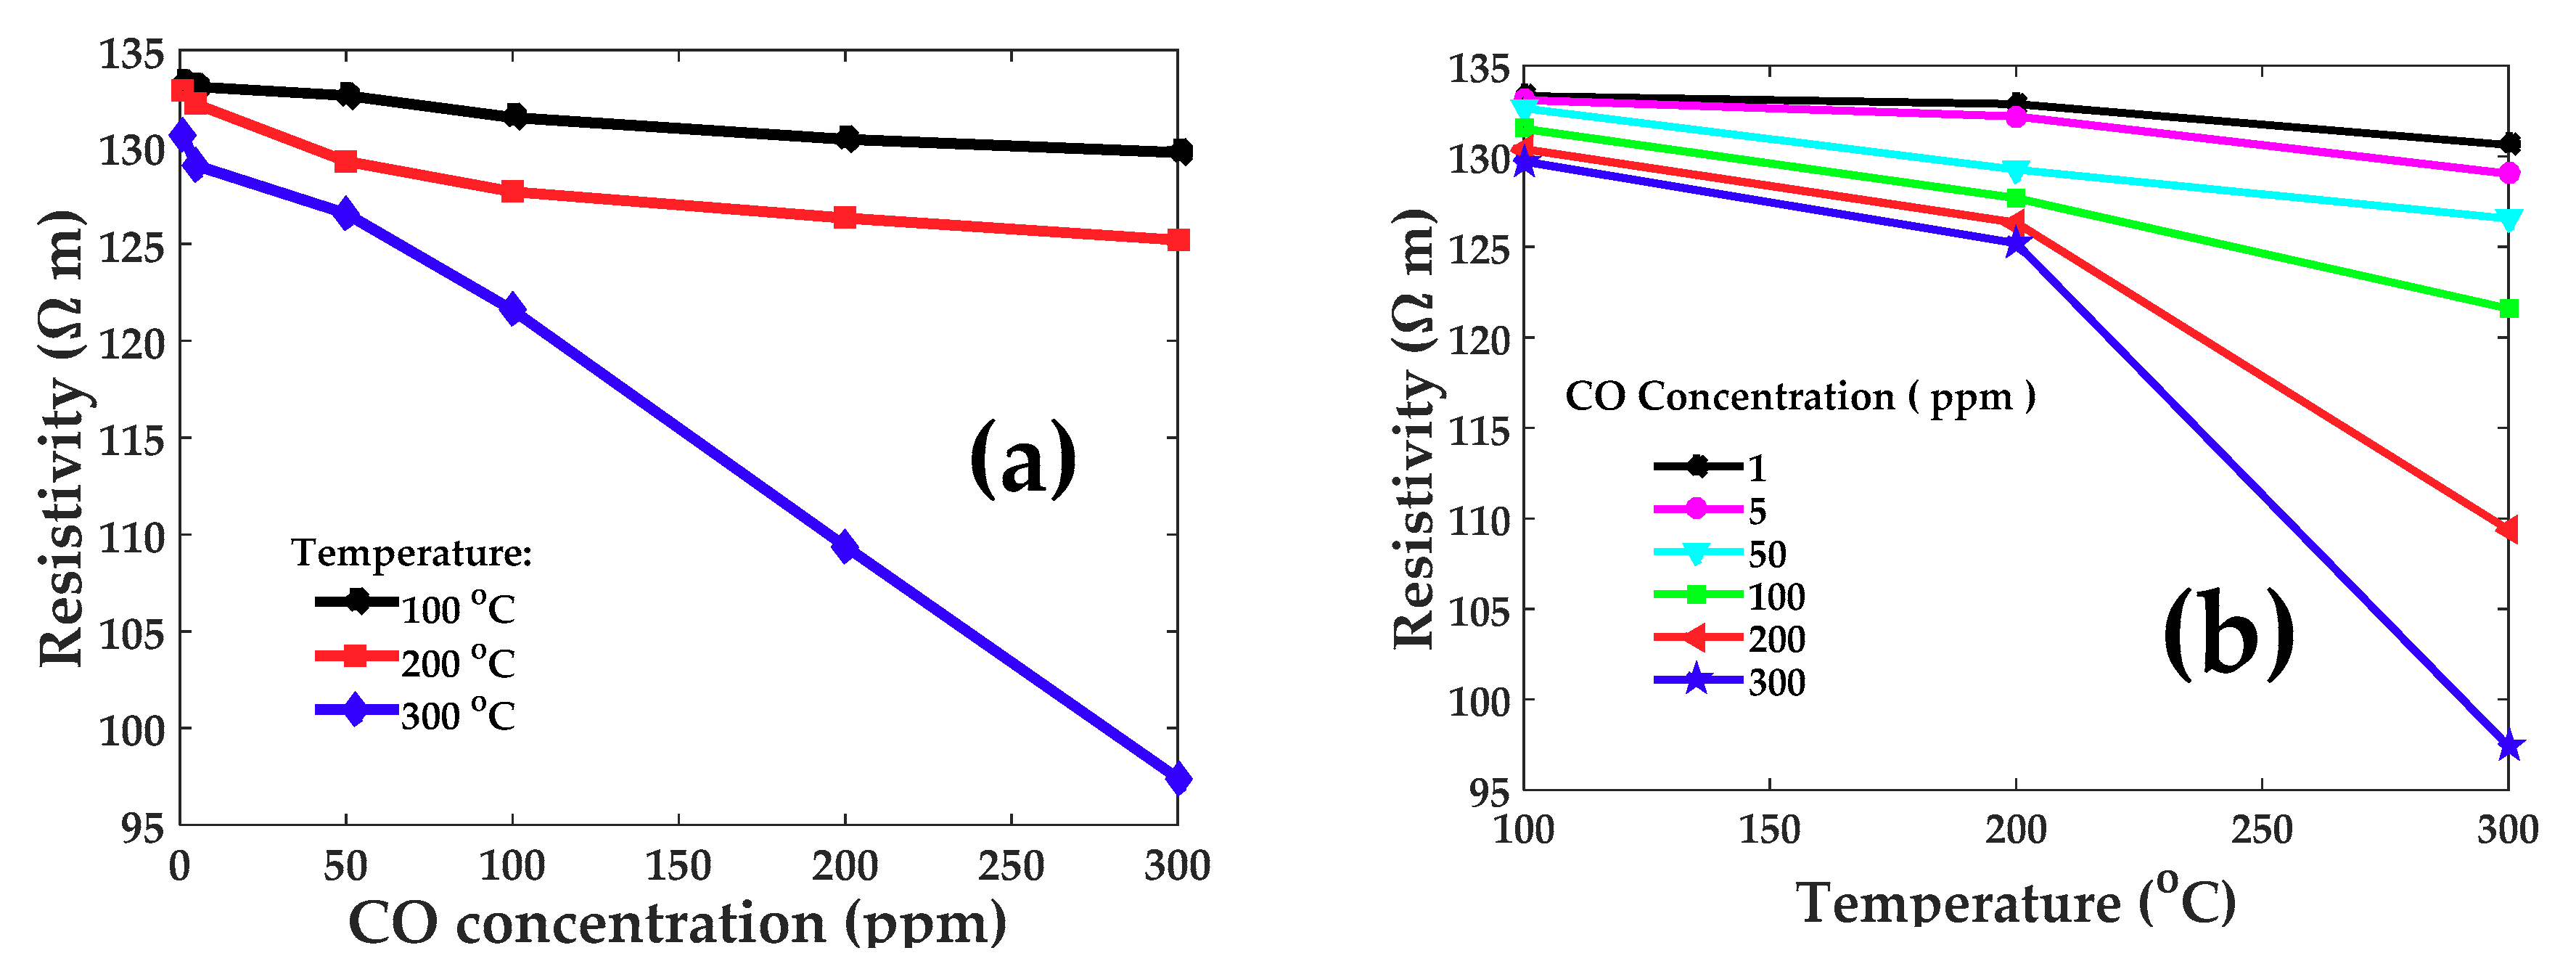
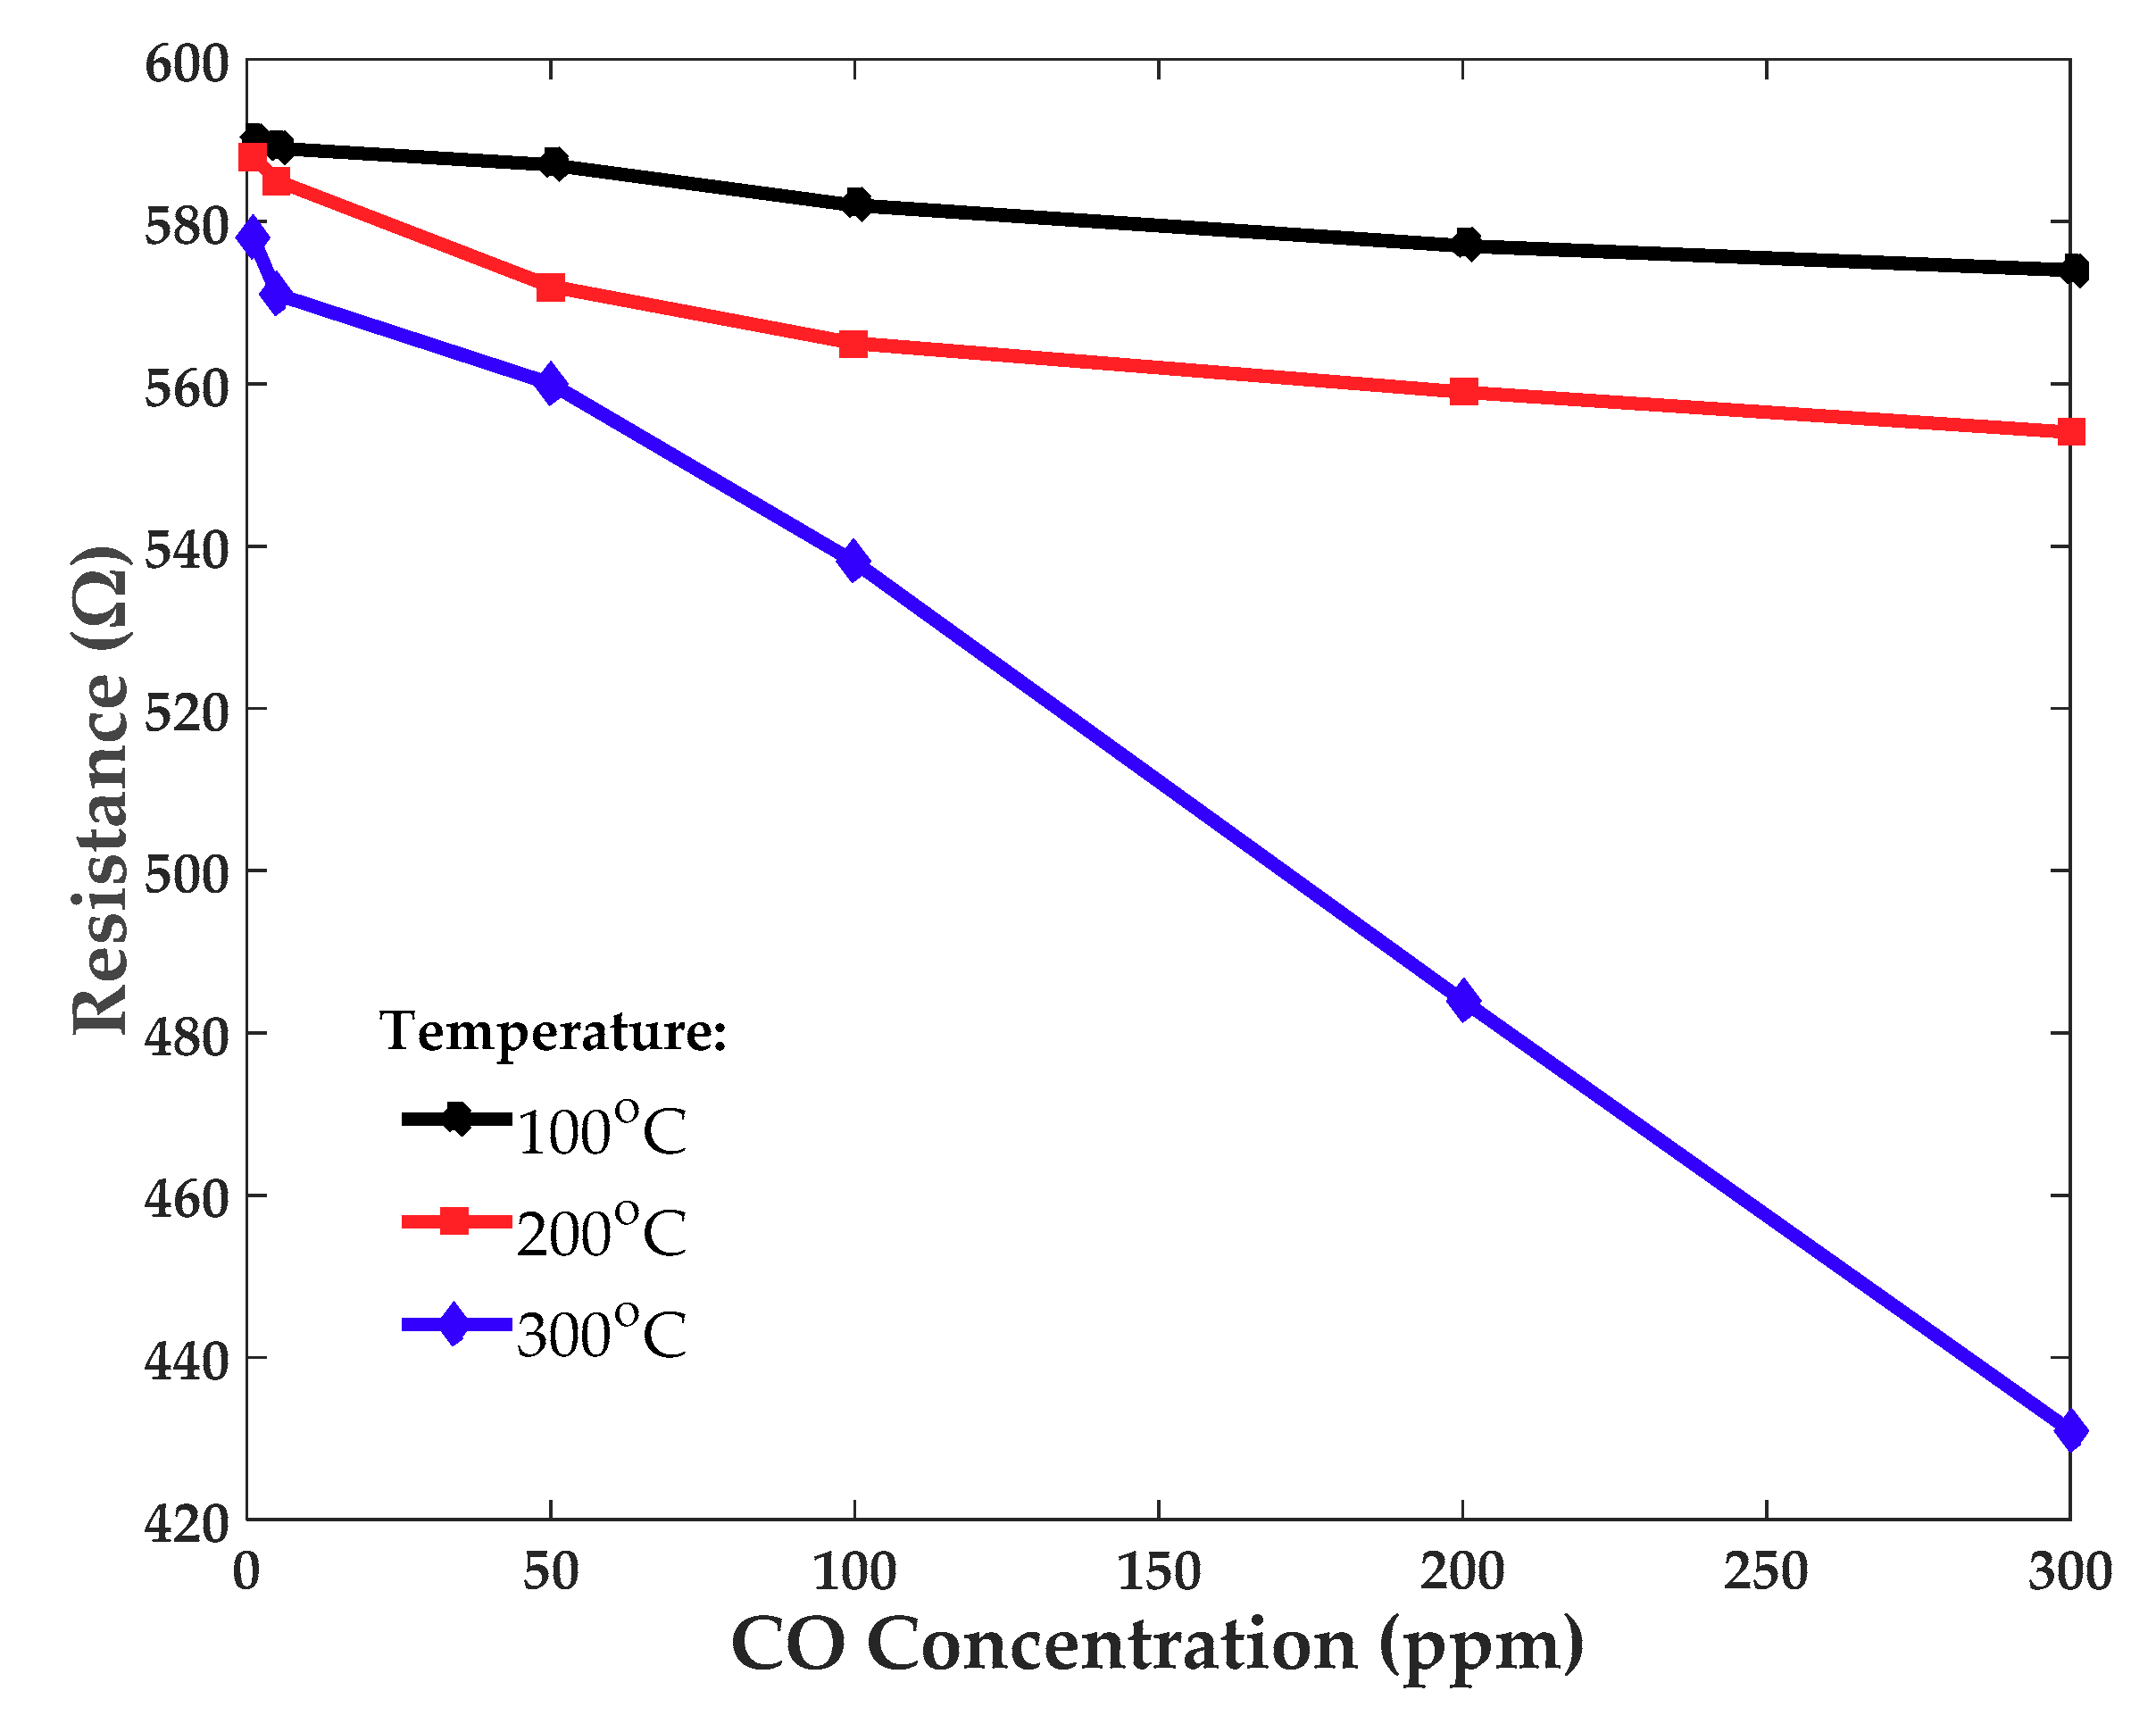
3.4. Resistance vs. CO Concentration
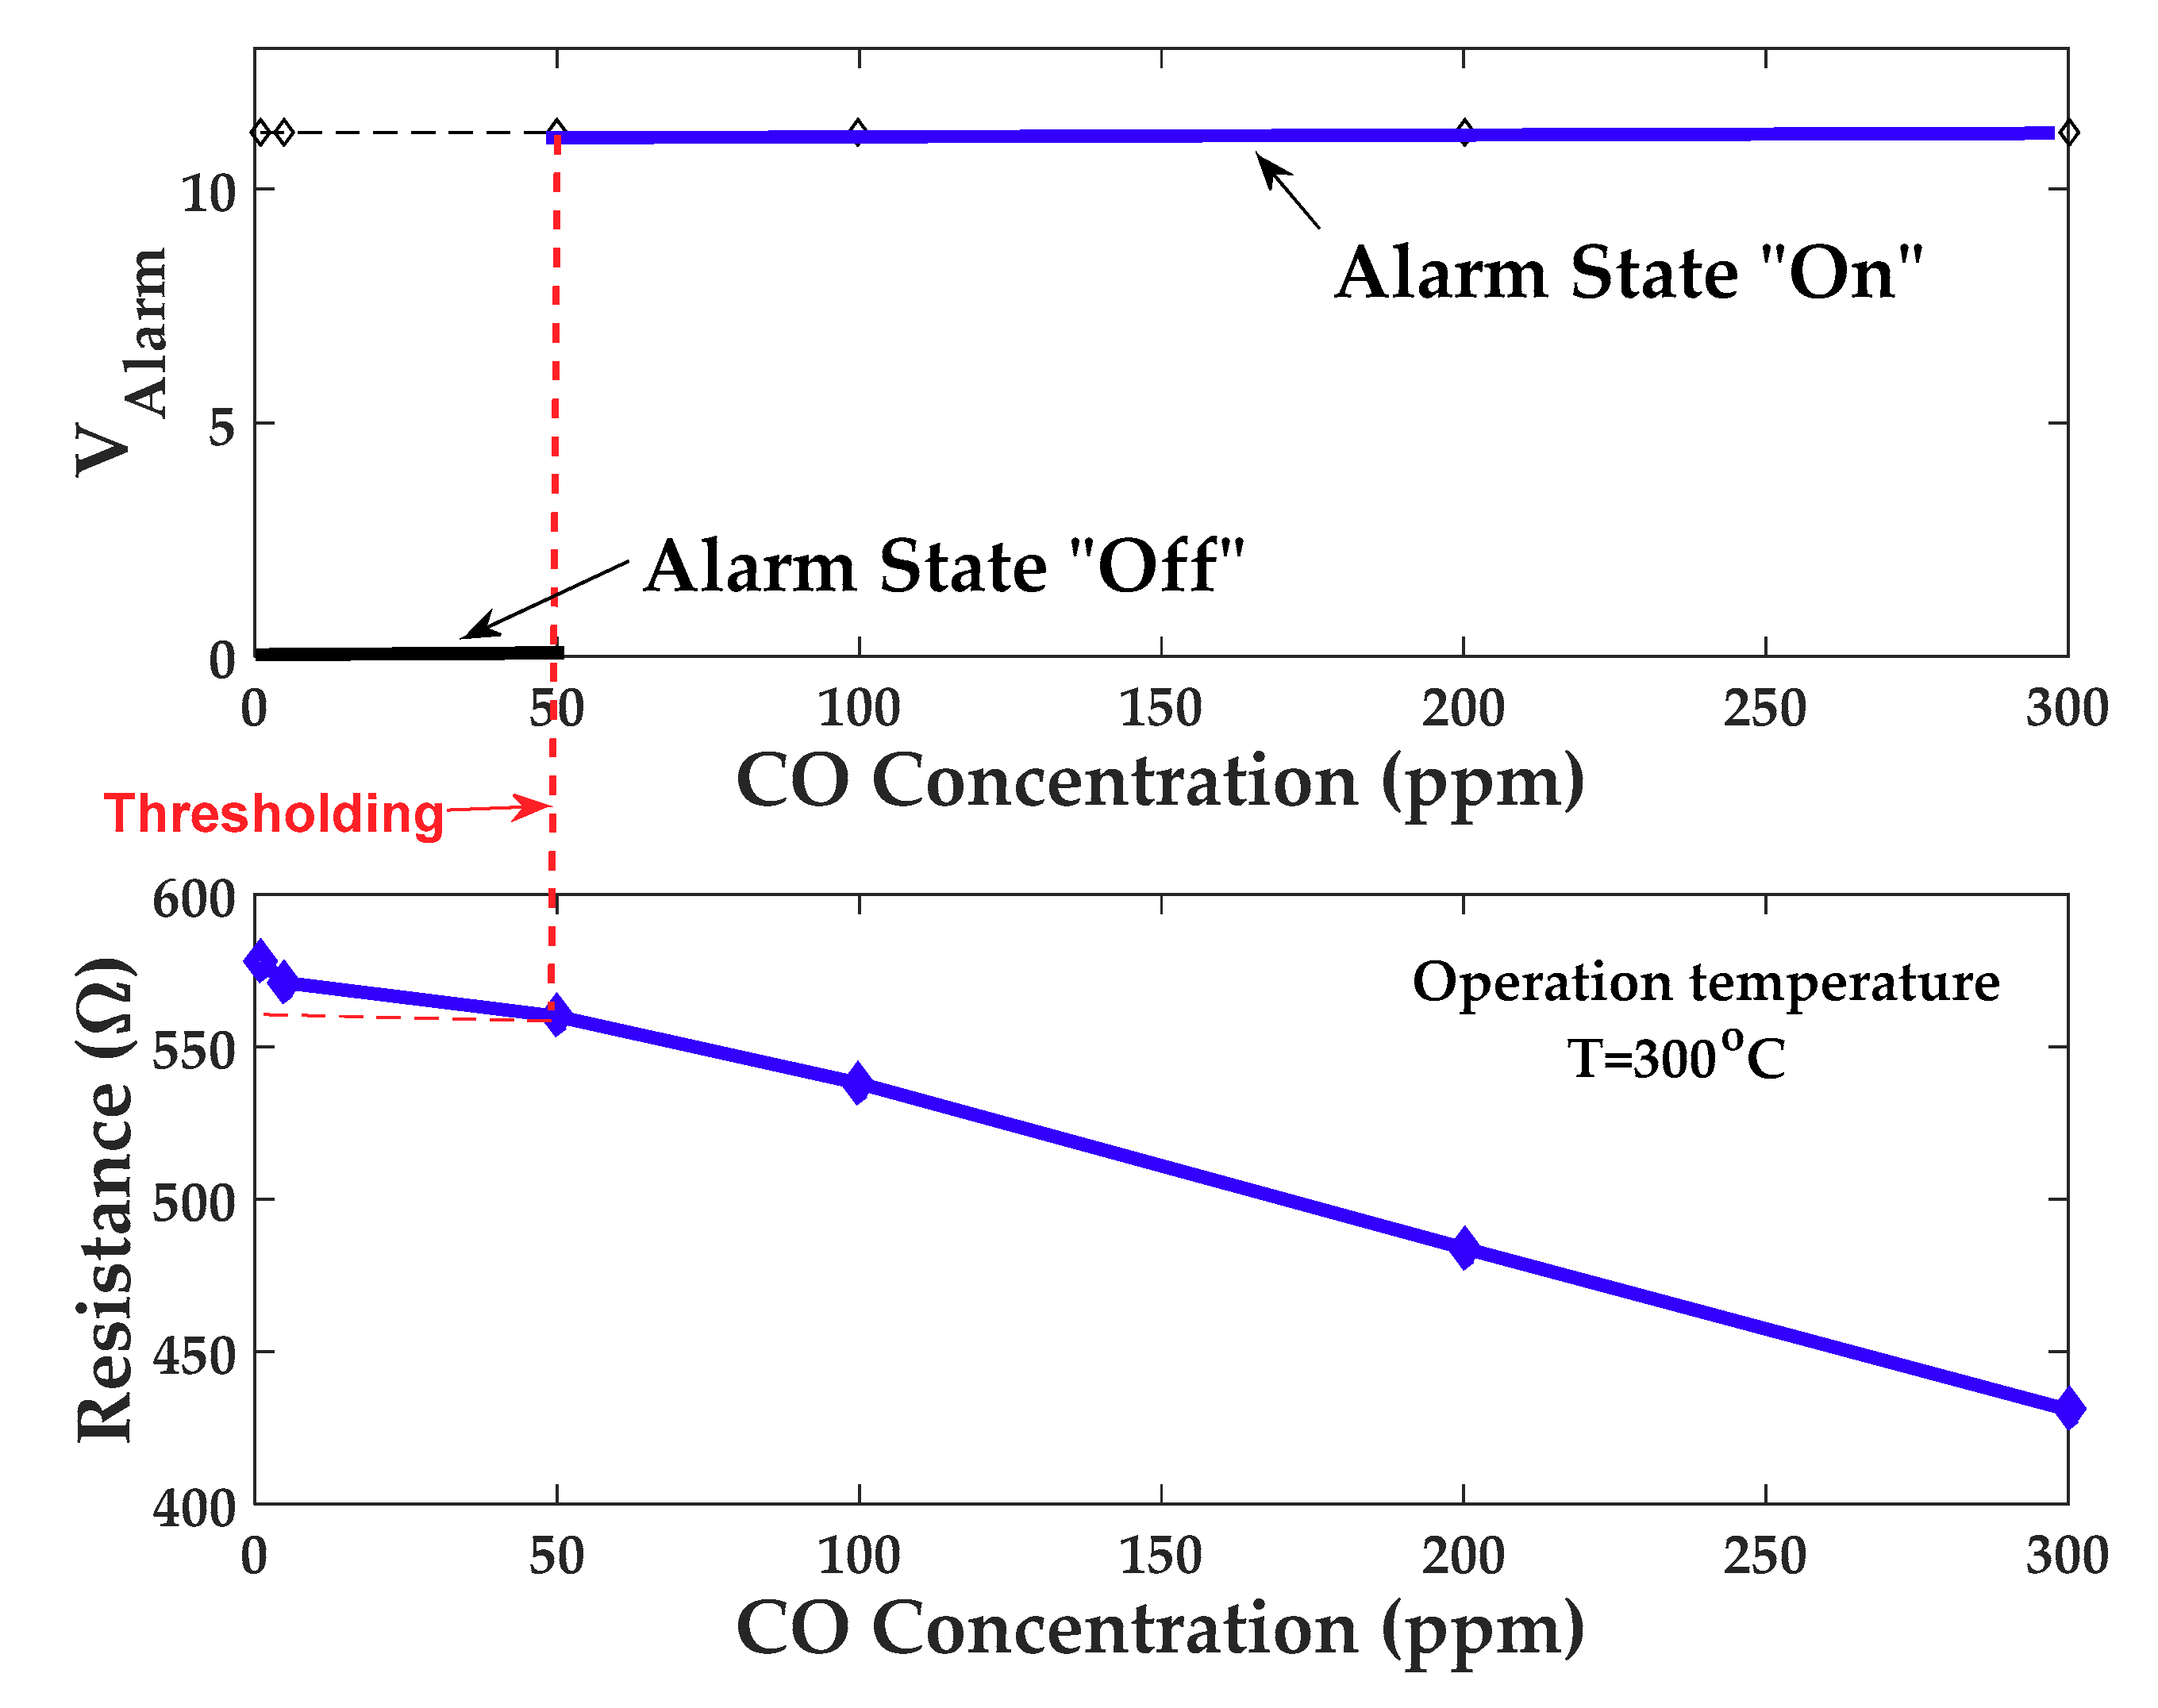
3.5. CO Detection Circuit
3.6. CO Detection Device
4. Discussion
5. Conclusions
Author Contributions
Funding
Acknowledgments
Conflicts of Interest
References
- Wetchakun, K.; Samerjai, T.; Tamaekong, N.; Liewhiran, C.; Siriwong, C.; Kruefu, V.; Wisitsoraat, A.; Tuantranont, A.; Phanichphant, S. Semiconducting metal oxides as sensors for environmentally hazardous gases. Sens. Actuators B 2011, 160, 580–591. [Google Scholar] [CrossRef]
- Niu, X.; Du, W.; Du, W. Preparation and gas sensing properties of ZnM2O4 (M. = Fe, Co, Cr). Sens. Actuators B 2004, 99, 405–409. [Google Scholar] [CrossRef]
- Navarro-Botella, P.; García-Aguilar, J.; Berenguer-Murcia, A.; Cazorla-Amorós, D. Pd and Cu-Pd nanoparticles supported on multiwall carbon nanotubes for H2 detection. Mater. Res. Bull. 2017, 93, 102–111. [Google Scholar] [CrossRef]
- Fleischer, M.; Meixner, H. Fast gas sensors based on metal oxides which are stable at high temperatures. Sens. Actuators B 1997, 43, 1–10. [Google Scholar] [CrossRef]
- Fiels, L.L.; Zheng, J.P.; Cheng, Y.; Xiong, P. Room-temperature low-power hydrogen sensor based on a single tin dioxide nanobelt. Appl. Phys. Lett. 2006, 88, 263102. [Google Scholar] [CrossRef]
- Yoon, J.W.; Grilli, M.L.; Di Bartolomeo, E.; Polini, R.; Traversa, E. The NO2 response of solid electrolyte sensors made using nano-sized LaFeO3 electrodes. Sens. Actuators B 2001, 76, 483–488. [Google Scholar] [CrossRef]
- Makri, A.; Stilianakis, N.I. Vulnerability to Air Pollution Health Effects. Int. J. Hyg. Environ. Health 2008, 211, 326–336. [Google Scholar] [CrossRef]
- Zuidema, T.; Nentjes, A. Health Damage of Air Pollution: An Estimate of a Dose Response Relationship for the Netherlands. Environ. Resour. Econ. 2007, 9, 291–308. [Google Scholar] [CrossRef]
- Brunekreef, B.; Holgate, S.T. Air pollution and health. Lancet 2002, 360, 1233–1242. [Google Scholar] [CrossRef]
- Sukunta, J.; Wisitsoraat, A.; Tuantranont, A.; Phanichphant, S.; Liewhiran, C. Highly-sensitive H2S sensors based on flame-made V-substituted SnO2 sensing films. Sens. Actuators B 2017, 242, 1095–1107. [Google Scholar] [CrossRef]
- Afzal, A.; Cioffi, N.; Sabbatini, L.; Torsi, L. NOx sensors based on semiconducting metal oxide nanostructures: Progress and perspectives. Sens. Actuators B 2012, 171–172, 25–42. [Google Scholar] [CrossRef]
- Kanazawa, E.; Sakai, G.; Shimanoe, K.; Kanmura, Y.; Teraoka, Y.; Miura, N.; Yamazoe, N. Metal oxide semiconductor N2O sensor for medical use. Sens. Actuators B 2001, 77, 72–77. [Google Scholar] [CrossRef]
- Addabbo, T.; Bertocci, F.; Fort, A.; Gregorkiewitz, M.; Mugnaini, M.; Spinicci, R.; Vignoli, V. Gas sensing properties and modeling of YCoO3 based perovskite materials. Sens. Actuators B 2015, 221, 1137–1155. [Google Scholar] [CrossRef]
- Yuan, Y.; Wang, B.; Wang, C.; Li, X.; Huang, J.; Zhang, H.; Xia, F.; Xiao, J. Effects of CoFe2O4 electrode microstructure on the sensing properties for mixed potential NH3. Sens. Actuators B 2017, 239, 462–466. [Google Scholar] [CrossRef]
- Zhao, J.; Liu, Y.; Li, X.; Lu, G.; You, L.; Liang, X.; Liu, F.; Zhang, T.; Du, Y. Highly sensitive humidity sensor based on high surface area mesoporous LaFeO3 prepared by a nanocasting route. Sens. Actuators B 2013, 181, 802–809. [Google Scholar] [CrossRef]
- Moseley, P.T.; Williams, D.E.; Norris, J.O.W.; Tofield, B.C. Electrical conductivity and gas sensitivity of some transition metal tantalates. Sens. Actuators 1988, 14, 79–91. [Google Scholar] [CrossRef]
- Wang, B.; Yu, Q.; Zhang, S.; Wang, T.; Sun, P.; Chuai, X.; Lu, G. Gas sensing with yolk-shell LaFeO3 microspheres prepared by facile hydrothermal synthesis. Sens. Actuators B 2018, 258, 1215–1222. [Google Scholar] [CrossRef]
- Yang, X.; Zhang, S.; Yu, Q.; Sun, P.; Liu, F.; Lu, H.; Yan, X.; Zhou, X.; Liang, X.; Gao, Y.; et al. Solvothermal synthesis of porous CuFe2O4 nanospheres for high performance acetone sensor. Sens. Actuators B 2018, 270, 538–544. [Google Scholar] [CrossRef]
- Guillén-Bonilla, H.; Gildo-Ortiz, L.; Olvera-Amador, M.D.L.L.; Santoyo-Salazar, J.; Rodríguez-Betancourtt, V.M.; Guillen-Bonilla, A.; Reyes-Gómez, J. Sensitivity of Mesoporous CoSb2O6 Nanoparticles to Gaseous CO and C3H8 at Low Temperatures. J. Nanomater. 2015, 2015, 308465. [Google Scholar] [CrossRef]
- Guillén-Bonilla, A.; Rodríguez-Betancourtt, V.M.; Guillén-Bonilla, J.T.; Sánchez-Martínez, A.; Gildo-Ortiz, L.; Santoyo-Salazar, J.; Morán-Lázaro, J.P.; Guillén-Bonilla, H.; Blanco-Alonso, O. A novel CO and C3H8 sensor made of CuSb2O6 nanoparticles. Ceram. Int. 2017, 43, 13635–13644. [Google Scholar] [CrossRef]
- Singh, A.; Singh, A.; Singh, S.; Tandon, P. Nickel antimony oxide (NiSb2O6) A fascinating nanostructured material for gas sensing application. Chem. Phys. Lett. 2016, 646, 41–46. [Google Scholar] [CrossRef]
- Guillén-Bonilla, H.; Flores-Martínez, M.; Rodríguez-Betancourtt, V.M.; Guillen-Bonilla, A.; Reyes-Gómez, J.; Gildo-Ortiz, L.; Olvera-Amador, M.D.L.L.; Santoyo-Salazar, J. A Novel Gas Sensor Based on MgSb2O6 Nanorods to Indicate Variations in Carbon Monoxide and Propane Concentrations. Sensors 2016, 16, 177. [Google Scholar] [CrossRef] [PubMed]
- Guillen-Bonilla, H.; Rodríguez-Betancourtt, V.M.; Guillén-Bonilla, J.T.; Reyes-Gómez, J.; Gildo-Ortiz, L.; Flores-Martínez, M.; Olvera-Amador, M.D.L.L.; Santoyo-Salazar, J. CO and C3H8 Sensitivity Behavior of Zinc Antimonate Prepared by a Microwave-Assisted Solution Method. J. Nanomater. 2015, 2015, 979543. [Google Scholar] [CrossRef]
- Guillen-Bonilla, A.; Blanco-Alonso, O.; Guillen-Bonilla, J.T.; Olvera-Amador, M.D.L.L.; Rodríguez-Betancourtt, V.M.; Sánchez-Martínez, A.; Moran-Lázaro, J.P.; Martínez-García, M.; Guillen-Bonilla, H. Synthesis and characterization of cobalt antimonate nanostructures and their study as potential CO and CO2 sensor at low temperatures. J. Mater. Sci. Mater. Electron. 2018, 29, 15632–15642. [Google Scholar] [CrossRef]
- Montero, M.; Molina, T.; Szafran, M.; Moreno, R.; Nieto, M.I. Alumina porous nanomaterials obtained by colloidal processing using D-fructose as dispersant and porosity promoter. Ceram. Int. 2012, 38, 2779–2784. [Google Scholar] [CrossRef]
- Lee, S.J.; Kriven, W.M. Crystallization and Densification of Nano-Size Amorphous Cordierite Powder Prepared by a PVA Solution-Polymerization Route. J. Am. Ceram. Soc. 1998, 81, 2605–2612. [Google Scholar] [CrossRef]
- Seung-Man, Y.; Shin-Hyun, K.; Jong-Min, L.; Gi-Ra, Y. Synthesis and assembly of structured colloidal particles. J. Mater. Chem. 2008, 18, 2177–2190. [Google Scholar]
- Rodríguez Betancourtt, V.M.; Guillen Bonilla, H.; Flores Martínez, M.; Guillen Bonilla, A.; Moran Lazaro, J.P.; Guillen Bonilla, J.T.; González, M.A.; Olvera Amador, M.D.L.L. Gas Sensing Properties of NiSb2O6 Micro-and Nanoparticles in Propane and Carbon Monoxide Atmospheres. Hindawi J. Nanomater. 2017, 2017, 8792567. [Google Scholar] [CrossRef]
- Guillen Bonilla, H.; Olvera Amador, M.D.L.L.; Casallas Moreno, Y.L.; Guillen Bonilla, J.T.; Guillen Bonilla, A.; Gildo Ortiz, L.; Morán Lázaro, J.P.; Santoyo Salazar, J.; Rodríguez Betancourtt, V.M. Synthesis and characterization of nickel antimonate nanoparticles: Sensing properties in propane and carbon monoxide. J. Mater. Sci. Mater. Electron. 2019, 30, 6166–6177. [Google Scholar] [CrossRef]
- Gildo-Ortiz, L.; Guillén-Bonilla, H.; Santoyo-Salazar, J.; Olvera-Amador, M.L.; Karthik, T.V.K.; Campos-González, E.; Reyes-Gómez, J. Low-temperature synthesis and gas sensitivity of perovskite-type LaCoO3 nanoparticles. J. Nanomater. 2014, 2014, 164380. [Google Scholar] [CrossRef]
- Ehrenberg, H.; Wltschek, G.; Rodriguez-Carvajal, J.; Vogt, T. Magnetic structures of the tri-rutiles NiTa2O6 and NiSb2O6. J. Magn. Magn. Mater. 1998, 184, 111–115. [Google Scholar] [CrossRef]
- Deng, Z.X.; Wang, C.; Sun, X.M.; Li, Y.D. Structure-directing coordination template effect of ethylenediamine in formations of ZnS and ZnSe nanocrystallites via solvothermal route. Inorg. Chem. 2002, 41, 869–873. [Google Scholar] [CrossRef] [PubMed]
- Wang, X.; Li, Y. Solution-based synthetic strategies for 1-D nanostructures. Inorg. Chem. 2006, 45, 7522–7534. [Google Scholar] [CrossRef] [PubMed]
- Han, J.; Xu, M.; Jia, M.; Liu, T. Evaluation of reduced grapheme oxide-supported NiSb2O6 nanocomposites for reversible lithium storage. Ceram. Int. 2016, 42, 14782–14787. [Google Scholar] [CrossRef]
- Lamer, V.K.; Dinegar, R.H. Theory, production and mechanism of formation of monodispersed hydrosols. J. Am. Chem. Soc. 1950, 72, 4847–4854. [Google Scholar] [CrossRef]
- Shih-Chia, C. Oxygen chemisorption on tin oxide: Correlation between electrical conductivity and EPR measurements. J. Vac. Sci. Technol. 1979, 17, 366–369. [Google Scholar]
- Kita, J.; Engelbrecht, A.; Schubert, F.; Gro, A.; Rettigand, F.; Moos, R. Some practical points to consider with respect to thermal conductivity and electrical resistivity of ceramic substrates for high-temperature gas sensors. Sens. Actuators B 2015, 213, 541–546. [Google Scholar] [CrossRef]
- McAleer, J.F.; Moseley, P.T.; Norris, J.O.W.; Williams, D.E. Tin dioxide gas sensors: Part 1.-Aspects of the surface chemistry revealed by electrical conductance variations. J. Chem. Soc. Faraday Trans. 1 1987, 183, 1323–1346. [Google Scholar] [CrossRef]
- Mirzaei, A.; Leonardi, S.G.; Neri, G. Detection of hazardous volatile organic compounds (VOCs) by metal oxide nanostructures-based gas sensors: A review. Ceram. Int. 2016, 42, 15119–15141. [Google Scholar] [CrossRef]
- Song, E.; Choi, J.W. Conducting polyaniline nanowire and its applications in chemiresistive sensing. Nanomaterials 2013, 3, 498–523. [Google Scholar] [CrossRef]
- Lin, T.; Xin, L.; Li, S.; Wang, Q. The Morphologies of the Semiconductor Oxides and Their Gas-Sensing Properties. Sensors 2017, 17, 2779. [Google Scholar] [CrossRef] [PubMed]
- Guillén-Bonilla, A.; Rodríguez-Betancourtt, V.M.; Guillén-Bonilla, H.; Gildo-Ortiz, L.; Blanco-Alonso, O.; Franco-Rodríguez, N.E.; Reyes-Gómez, J.; Casillas-Zamora, A.; Guillen-Bonilla, J.T. A new CO2 detection system based on the trirutile-type CoSb2O6 oxide. J. Mater. Sci. Mater. Electron. 2018, 29, 15741–15753. [Google Scholar] [CrossRef]


© 2019 by the authors. Licensee MDPI, Basel, Switzerland. This article is an open access article distributed under the terms and conditions of the Creative Commons Attribution (CC BY) license (http://creativecommons.org/licenses/by/4.0/).
Share and Cite
Guillen Bonilla, J.T.; Guillén Bonilla, H.; Rodríguez Betancourtt, V.M.; Casillas Zamora, A.; Ramírez Ortega, J.A.; Gildo Ortiz, L.; Sánchez Morales, M.E.; Blanco Alonso, O.; Guillén Bonilla, A. Carbone Monoxide (CO) Detection Device Based on the Nickel Antimonate Oxide and a DC Electronic Circuit. Appl. Sci. 2019, 9, 3799. https://doi.org/10.3390/app9183799
Guillen Bonilla JT, Guillén Bonilla H, Rodríguez Betancourtt VM, Casillas Zamora A, Ramírez Ortega JA, Gildo Ortiz L, Sánchez Morales ME, Blanco Alonso O, Guillén Bonilla A. Carbone Monoxide (CO) Detection Device Based on the Nickel Antimonate Oxide and a DC Electronic Circuit. Applied Sciences. 2019; 9(18):3799. https://doi.org/10.3390/app9183799
Chicago/Turabian StyleGuillen Bonilla, José Trinidad, Héctor Guillén Bonilla, Verónica María Rodríguez Betancourtt, Antonio Casillas Zamora, Jorge Alberto Ramírez Ortega, Lorenzo Gildo Ortiz, María Eugenia Sánchez Morales, Oscar Blanco Alonso, and Alex Guillén Bonilla. 2019. "Carbone Monoxide (CO) Detection Device Based on the Nickel Antimonate Oxide and a DC Electronic Circuit" Applied Sciences 9, no. 18: 3799. https://doi.org/10.3390/app9183799
APA StyleGuillen Bonilla, J. T., Guillén Bonilla, H., Rodríguez Betancourtt, V. M., Casillas Zamora, A., Ramírez Ortega, J. A., Gildo Ortiz, L., Sánchez Morales, M. E., Blanco Alonso, O., & Guillén Bonilla, A. (2019). Carbone Monoxide (CO) Detection Device Based on the Nickel Antimonate Oxide and a DC Electronic Circuit. Applied Sciences, 9(18), 3799. https://doi.org/10.3390/app9183799