Article

All-in-Focused Image Combination in the Frequency Domain Using Light Field Images

School of Electrical Engineering and Computer Science, Gwangju Institute of Science and Technology, Gwangju 61005, Korea
*
Author to whom correspondence should be addressed.
Appl. Sci. 2019, 9(18), 3752; https://doi.org/10.3390/app9183752
Submission received: 26 June 2019 / Revised: 1 September 2019 / Accepted: 5 September 2019 / Published: 8 September 2019

Abstract

:
All-in-focused image combination is a fusion technique used to acquire related data from a set of focused images at different depth levels, which suggests that one can determine objects in the foreground and background regions. When attempting to reconstruct an all-in-focused image, we need to identify in-focused regions from multiple input images captured with different focal lengths. This paper presents a new method to find and fuse the in-focused regions of the different focal stack images. After we apply the two-dimensional discrete cosine transform (DCT) to transform the focal stack images into the frequency domain, we utilize the sum of the updated modified Laplacian (SUML), enhancement of the SUML, and harmonic mean (HM) for calculating in-focused regions of the stack images. After fusing all the in-focused information, we transform the result back by using the inverse DCT. Hence, the out-focused parts are removed. Finally, we combine all the in-focused image regions and reconstruct the all-in-focused image.

1. Introduction

Light field cameras, also called plenoptic cameras, have been popularly used in digital refocusing and three-dimensional reconstruction. They are fabricated with internal micro-lens arrays to capture light field information in such a way that one can refocus the image after acquisition. This is the very unique capability of the light field camera [1]. Due to the finite depth of field (DOF) in normal digital cameras, an image of all of the relevant objects displays sharpness information inside the DOF; however, the objects show blurred information outside the DOF. Since the light field image generates a set of images focused at different depth levels after being captured, it is suggested that one can determine objects in the foreground and background regions. Moreover, it can generate a set of multi-view images without the need for calibration images.
All-in-focused image combination is a method for merging in-focused information of the stack images that are captured at different focal planes from the same position. This algorithm addresses a method to fuse image sequences for reconstructing the all-in-focused image so that all relevant object regions appear sharp in the final image reconstruction. For detecting in-focused regions of the images and combining them for the all-in-focused image, various methods have been studied for focus measurement using the whole images. Up to now, various focus measurement and image combination methods have been proposed for different applications. Aydin and Akgul have proposed a focus measure operator that applies flexibly shaped and weighted support windows [2]. The algorithm can retrieve the depth discontinuities. The all-focused image is used to determine the support window. Zhang et al. have presented a focus detection method that portions source images into edges, textures, and smooth regions [3]. Focused regions are measured by morphological components. The final fused images are combined with the fusion map. Haghighat et al. have suggested a multi-focus image fusion method for visual sensor networks in the discrete cosine transform (DCT) domain [4]. This method utilizes variance values to measure and fuse multi-focus images using DCT-based algorithms. Lee and Zhou have introduced the DOF extension using a fusion of two images [5]. Their algorithm applies the DCT-STD and the DWT-STD for focus detection. Besides that, Chen et al. have demonstrated a multi-spectral imaging method that can also show the color image reproduction [6,7,8].
While most previous methods for image combination employed a few inputs of different focal images, we attempt a new method for image composition using many input images. In this paper, we describe a new all-in-focused image combination method that integrates the sum of updated modified Laplacian (SUML) and the harmonic mean (HM) in the discrete cosine transform (DCT) domain.
The sum of modified Laplacian (SML) performs better than other focus criteria [9] and HM is more robust than the arithmetic mean because they both support small pieces of information and increase their influences on the overall estimation operation. Moreover, the proposed method takes advantages of image representation in the frequency domain. Since it is difficult to classify in-focused and out-focused regions in the spatial domain when edges of the out-focused parts are sharp, we transform images into the frequency domain to analyze the image information. The main contributions of this paper are: (1) The method for extending the DOF in the imaging system that creates an image from a set of different focal images at one shot capture, and (2) the effective method for all-in-focused image combination that is performed in the frequency domain to avoid the artifacts reduction process in the spatial domain that requires a complexity execution.

2. All-in-Focused Image Combination

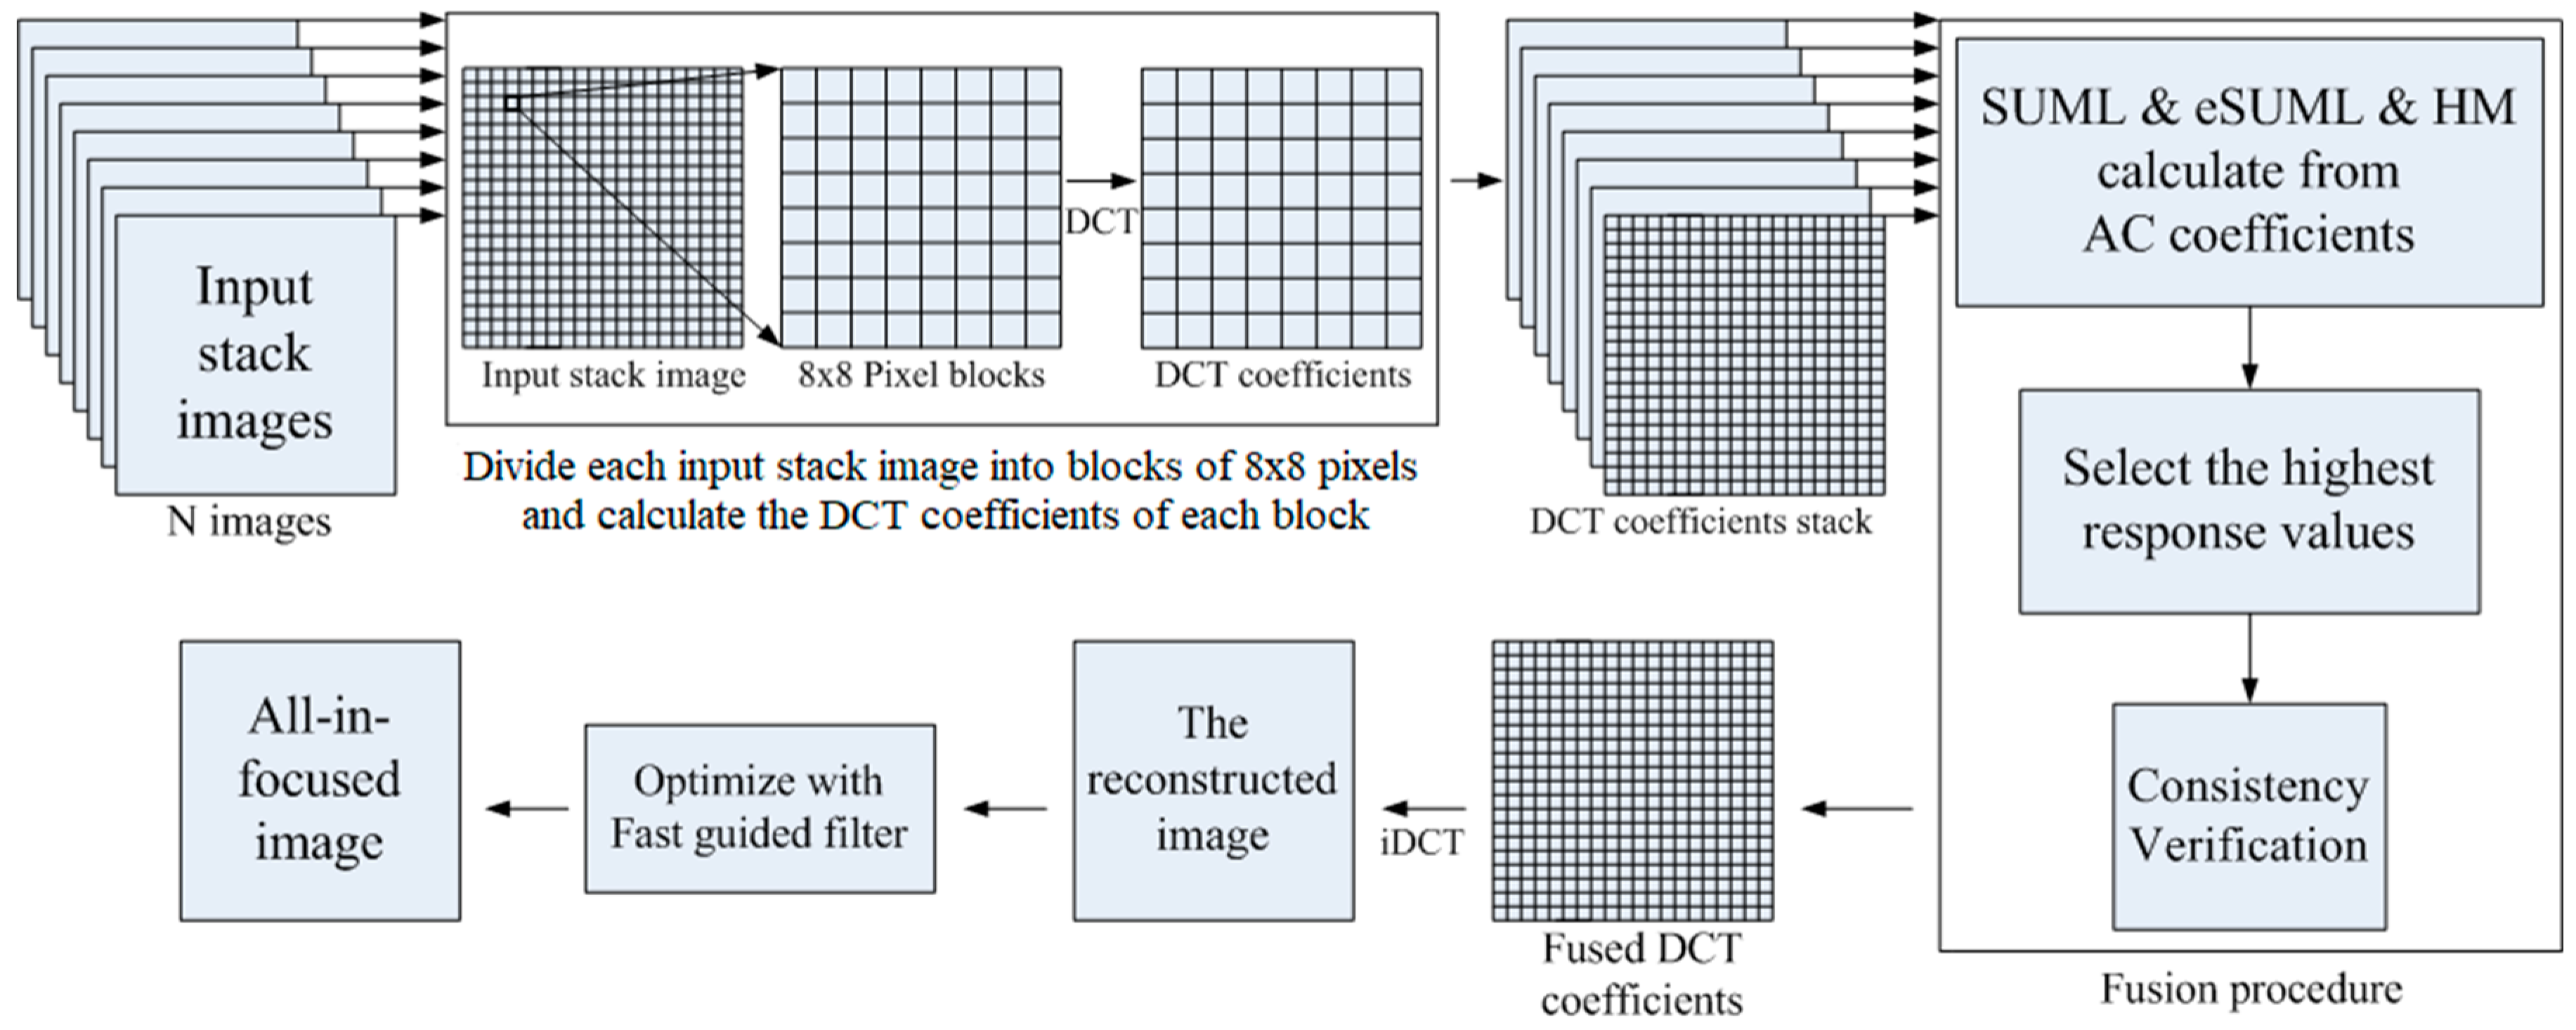
In this paper, we propose an image combination method that detects in-focused regions in the light field images and merges them into the all-in-focused image. Figure 1 represents the procedure of our proposed method. After dividing the input stack images into blocks of 8 × 8 pixels and calculating the DCT coefficients of each block, we calculate SUML and HM as the in-focus measures and perform the image combination procedure. Based on the final in-focused maps, we reconstruct the all-in-focused image by applying the inverse DCT and mitigating blocking artifacts.

2.1. Light Field Image Splitter

In this paper, we utilize a Lytro camera [10] to acquire light field images. In general, each light field image is decomposed into different focus-level images using the light field image splitter [11]. The splitter provides a set of different focal images that display the same position, as shown in Figure 2. We denote {It, t = 1, …, N} for the focal stack of input images.

2.2. Discrete Cosine Transform (DCT)

Each stack image (It) is transformed into the frequency domain by DCT. The source image is partitioned into blocks of 8 × 8 pixels and DCT coefficients of each block are computed by
D ( u , v )   =   x = 0 n 1 y = 0 n 1 cos ( π u 2 n ( 2 x + 1 ) ) cos ( π v 2 n ( 2 y + 1 ) ) I ( x , y )
where D(u, v) represents the DCT coefficient at the position (u, v) in the DCT domain. The DCT coefficients consist of the DC coefficient D(0,0) and AC coefficients. The AC coefficients are used for focus value calculation.

2.3. Sum of Updated Modified Laplacian (SUML)

In the proposed method, we improve the original SML and use it as a part of the focus measurement since the SML gives better efficiency than other focus measurement criteria [9]. When we consider the DCT coefficients, the higher energy property of the AC coefficients implies meaningful information in the in-focused region. Because the AC coefficients D(4,5), D(5,4), and D(4,4) are more important than other coefficients [12], we choose the AC coefficient D(4,4) for focus value calculation. The original modified Laplacian (ML) only considers variations in the x and y directions [13]. Thus, we modify the original ML and utilizes D(4,4). This value is small for both in-focused and out-focused parts in the homogeneous region. Thus, we propose the updated modified Laplacian (UML) for the block B(x,y) to include the diagonal directions and combine all the information of its neighborhood including sharp in-focused parts around the block. UML is defined by
U M L 2 B ( x , y ) = | 2 D ( 4 , 4 ) D ( 4 s t e p , 4 ) D ( 4 + s t e p , 4 ) |   + | 2 D ( 4 ,   4 ) D ( 4 ,   4 s t e p ) D ( 4 ,   4 + s t e p ) |   + | 2 D ( 4 ,   4 ) D ( 4 s t e p , 4 + s t e p ) D ( 4 + s t e p , 4 s t e p ) |   + | 2 D ( 4 ,   4 ) D ( 4 s t e p , 4 s t e p ) D ( 4 + s t e p , 4 + s t e p ) |
where (x,y) represents the block position, D(u,v) is the AC coefficient at the position (u,v) of the block B(x,y). In (2), ‘step’ is a fixed value, set as 1 in this paper. The focus measure at block B(x,y) is computed as the SUML value in the window around B(x,y). SUML is expressed by
S U M L ( x , y )   =   i = x N i = x + N j = y N j = y + N δ ( i , j )     where             δ ( i , j )     =     { U M L 2 B ( x , y ) ,   U M L 2 B ( x , y ) T S U M L 0 ,   otherwise ,
where δ(i, j) represents the UML value that follows the threshold TSUML condition. The window size around B(x,y) is N × N.

2.4. Enhanced SUML (eSUML)

In a homogeneous region, the focus measure can be affected by pixel noise [14]. In order to decrease this effect, the SUML values at block B(x,y) are computed as the eSUML value in the window around SUML(x,y). eSUML is calculated by
e S U M L ( x , y ) =   i = x N i = x + N j = y N j = y + N S U M L ( i , j )
where N × N determines the size of the window.
The effectiveness of eSUML in the focus measure informs us that the focus measure values, as well as the focus border, are more distinct for eSUML compared to SUML.

2.5. Harmonic Mean (HM)

HM measures the information of the eSUML results and is used for confirming the reliable focus measure. The HM value at block B(x,y) is calculated based on the eSUML values in the window around B(x,y), which is N × N. HM is defined by
H ( x , y )   =   [ 1 M m = 1 M 1 μ m ( x , y ) ] 1
where M determines the size of the window, (x,y) represents the block position, and µm is the average value of the eSUML results at block B(x,y). High values of HM will be deemed as in-focused regions and the out-focused regions will have low HM values.
HM has two advantages. First, arithmetic mean estimate can be distorted significantly by the large variances of the out-focused regions, while the harmonic mean is robust. Second, the harmonic mean considers reciprocals, hence it assists the small variances and increases their influence in the overall estimation. Although most variances of the out-focused regions may have small values, one large variance value can make the arithmetic mean value in those regions larger than the value in the in-focused regions. It causes the out-focused regions to be falsely considered as in-focused regions.

2.6. Image Combination

The all-in-focused image combination is fused by selecting the DCT coefficients that grant the highest HM value for each block B(x,y). The focal stack of input images {It, t = 1, …, N} that is divided into blocks in position (x,y), the DCT coefficients {DCT(x,y)t, t = 1,…, N}, and the HM values {H(x,y)t, t = 1, …, N} are the input data for the combination process. The block map of the fused image {MAP(x,y)} and the DCT coefficients of the fused image {FDCT(x,y)} are selected by
F D C T ( x , y )   =   D C T ( x , y ) f ,   M A P ( x , y )   =   f where   f   =   argmax t { H ( x , y ) t } ,   t = 1 ,   2 ,   , N
where f represents the index of the stack images that have the highest HM value. The image combination process is demonstrated as shown in Figure 3 and Figure 4.

2.7. Consistency Verification (CV)

In order to improve the combination effect, we employ a CV process [4] to the block map of the fused image MAP(x,y). We improve the MAP(x,y) accuracy by utilizing a majority filter in the window around MAP(x,y) as shown in Figure 5. Therefore, the CV is applied as post-processing, after the image combination process, to improve the quality of the output image and reduce the error due to unsuitable block selection. This process succeeds in both quality and complexity. Then, the DCT coefficients of the fused image FDCT(x,y) will be updated by following the improved MAP(x,y) values, as shown in Figure 6.
Finally, the all-in-focused image is reconstructed by applying the inverse DCT to the updated FDCT(x, y). The inverse DCT coefficients of each block are computed by
I ( x , y )   =   u = 0 n 1 v = 0 n 1 D ( u , v ) cos ( π u 2 n ( 2 x + 1 ) ) cos ( π v 2 n ( 2 y + 1 ) ) .

2.8. Blocking Artifacts Reduction

We apply edge-preserving smoothing, such as the fast guided filter [15], to the reconstructed image. This smoothing method also has the ability to sharpen blurred edges and ensures the efficiency of the reconstruction process.

3. Experimental Results

Experiments are conducted on five image sets: ‘Bag’, ‘Cup’, ‘Bike’, ‘Mouse’, and ‘Flower’ that are captured by a Lytro camera [10]. The experimental results are evaluated in terms of the focus measurement and the fused process for the all-in-focused image. We conduct the experiments on 360 × 360 pixel test images. The experimental parameters are assigned as a DCT window size of 8, a SUML window size of 3, a HM window size of 3, a CV window size of 3, and TSUML of 10.

3.1. Focus Measurement

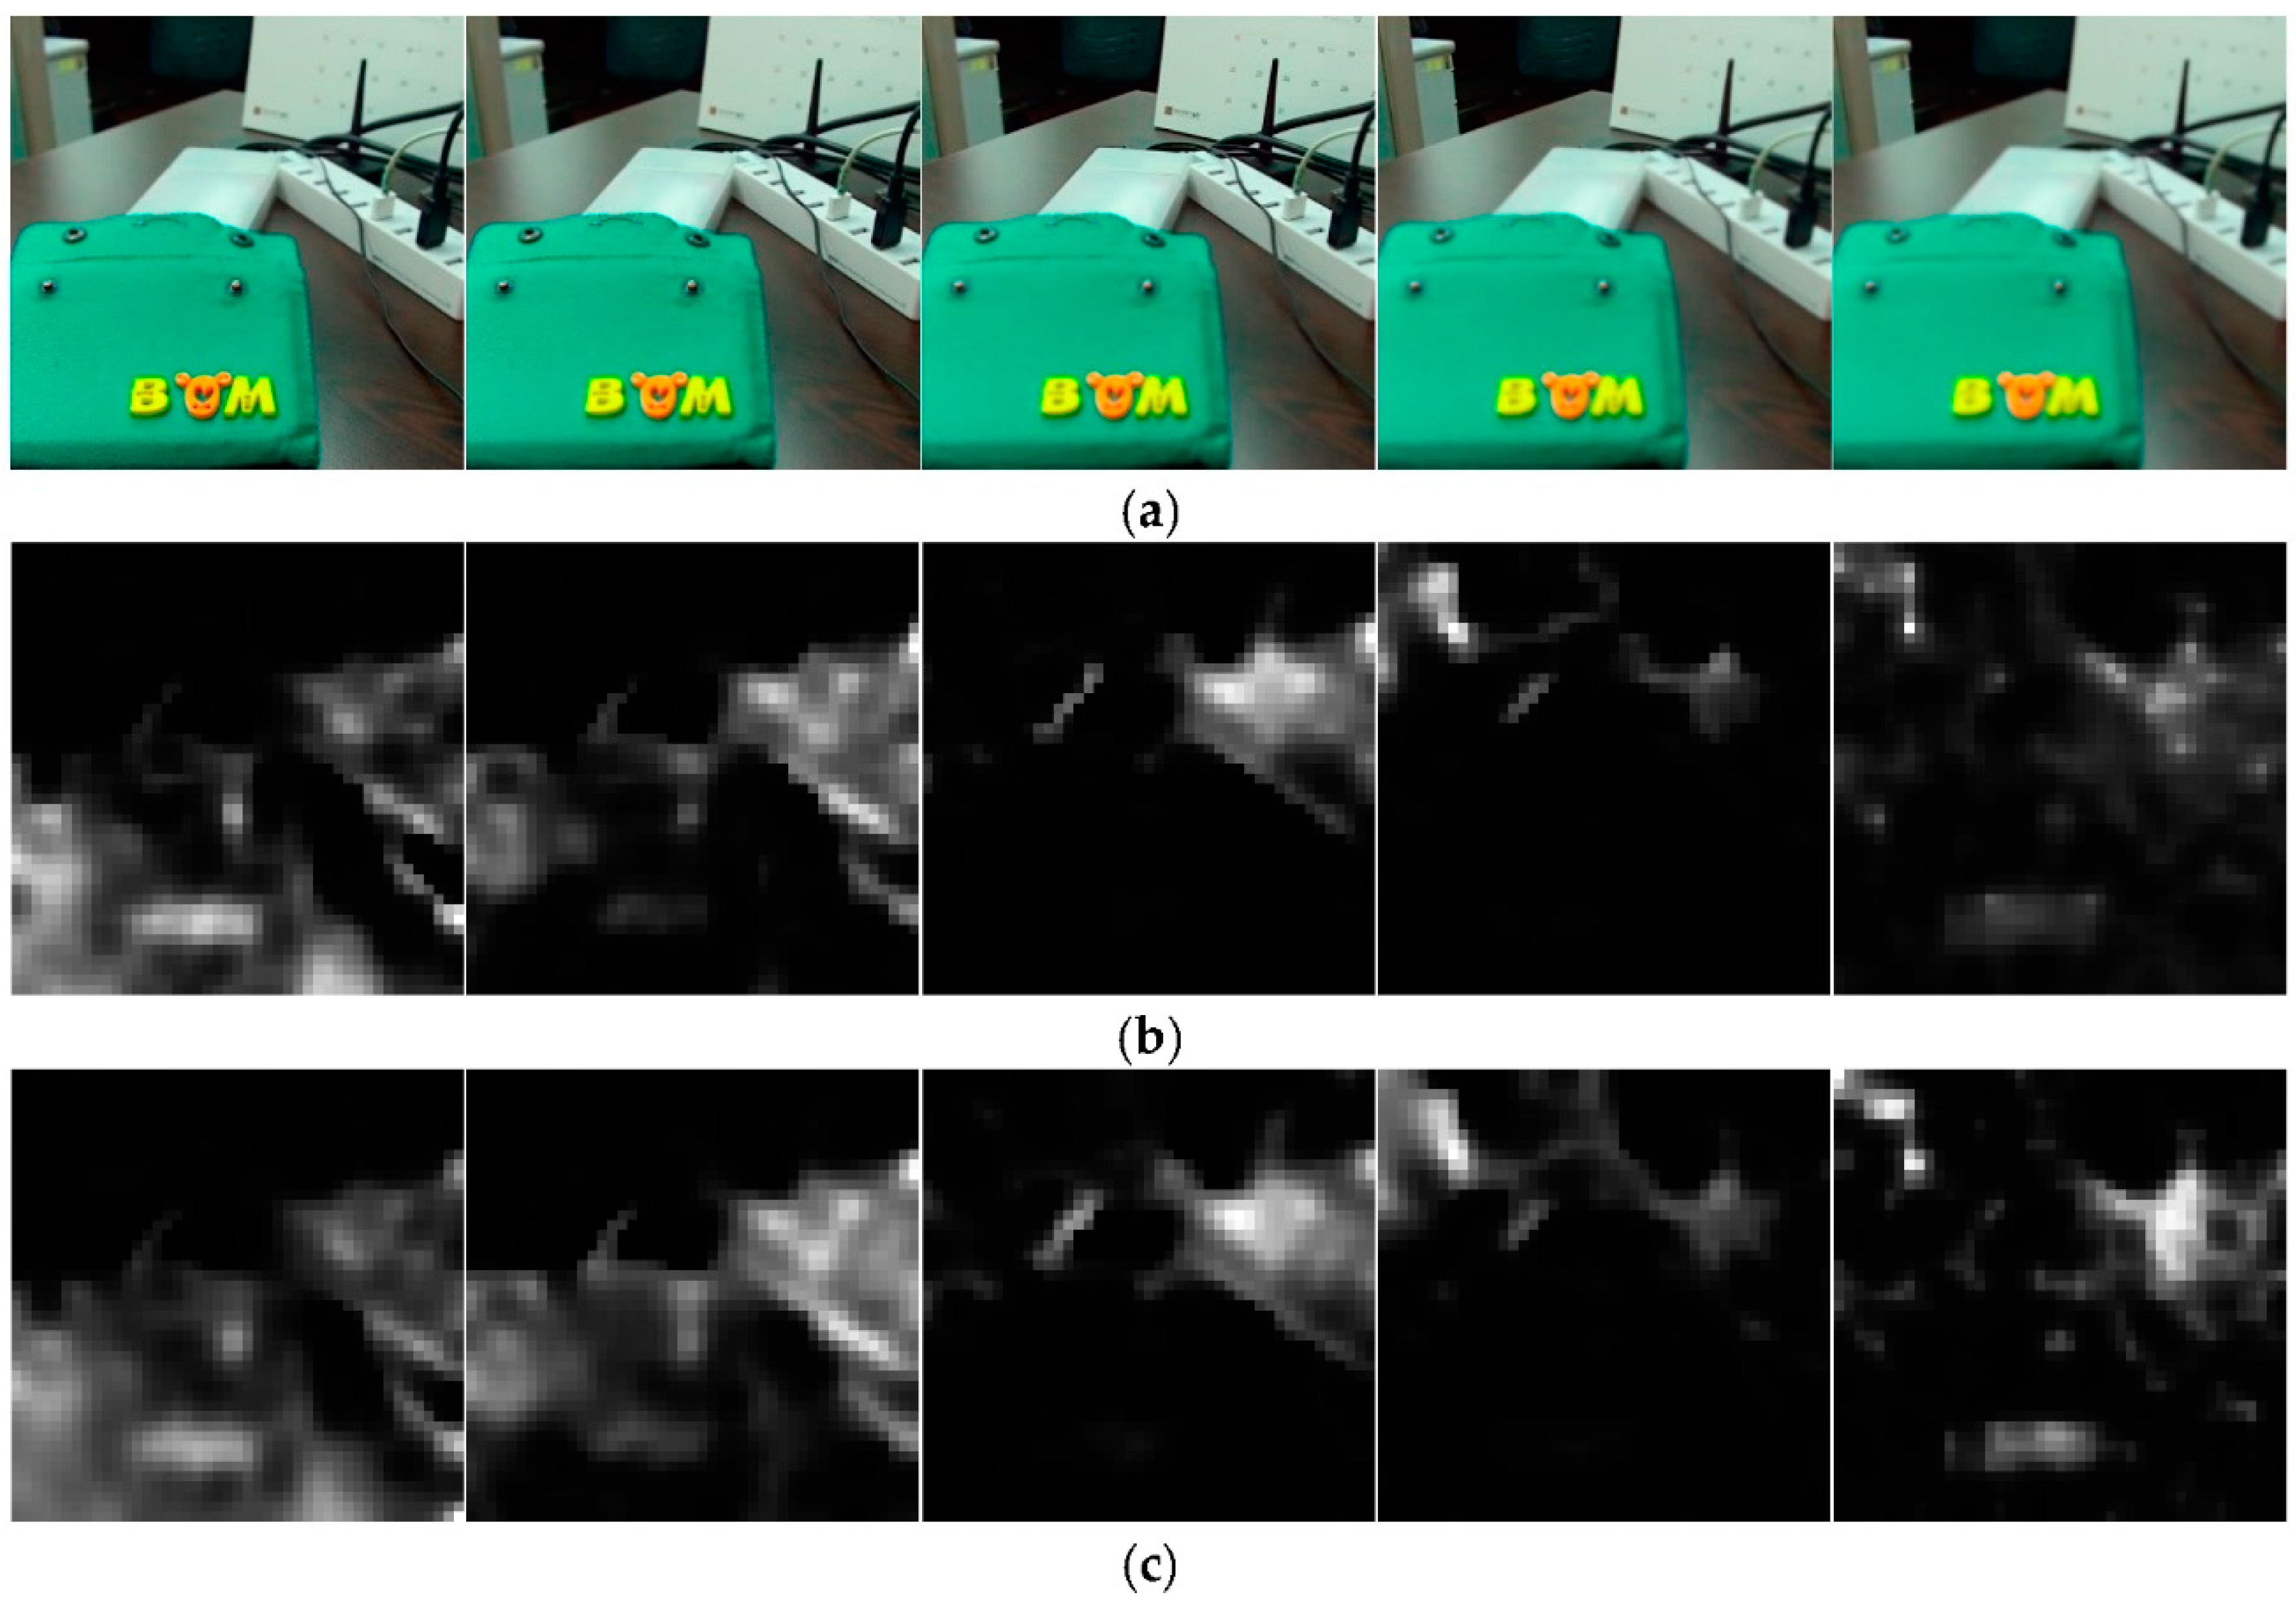
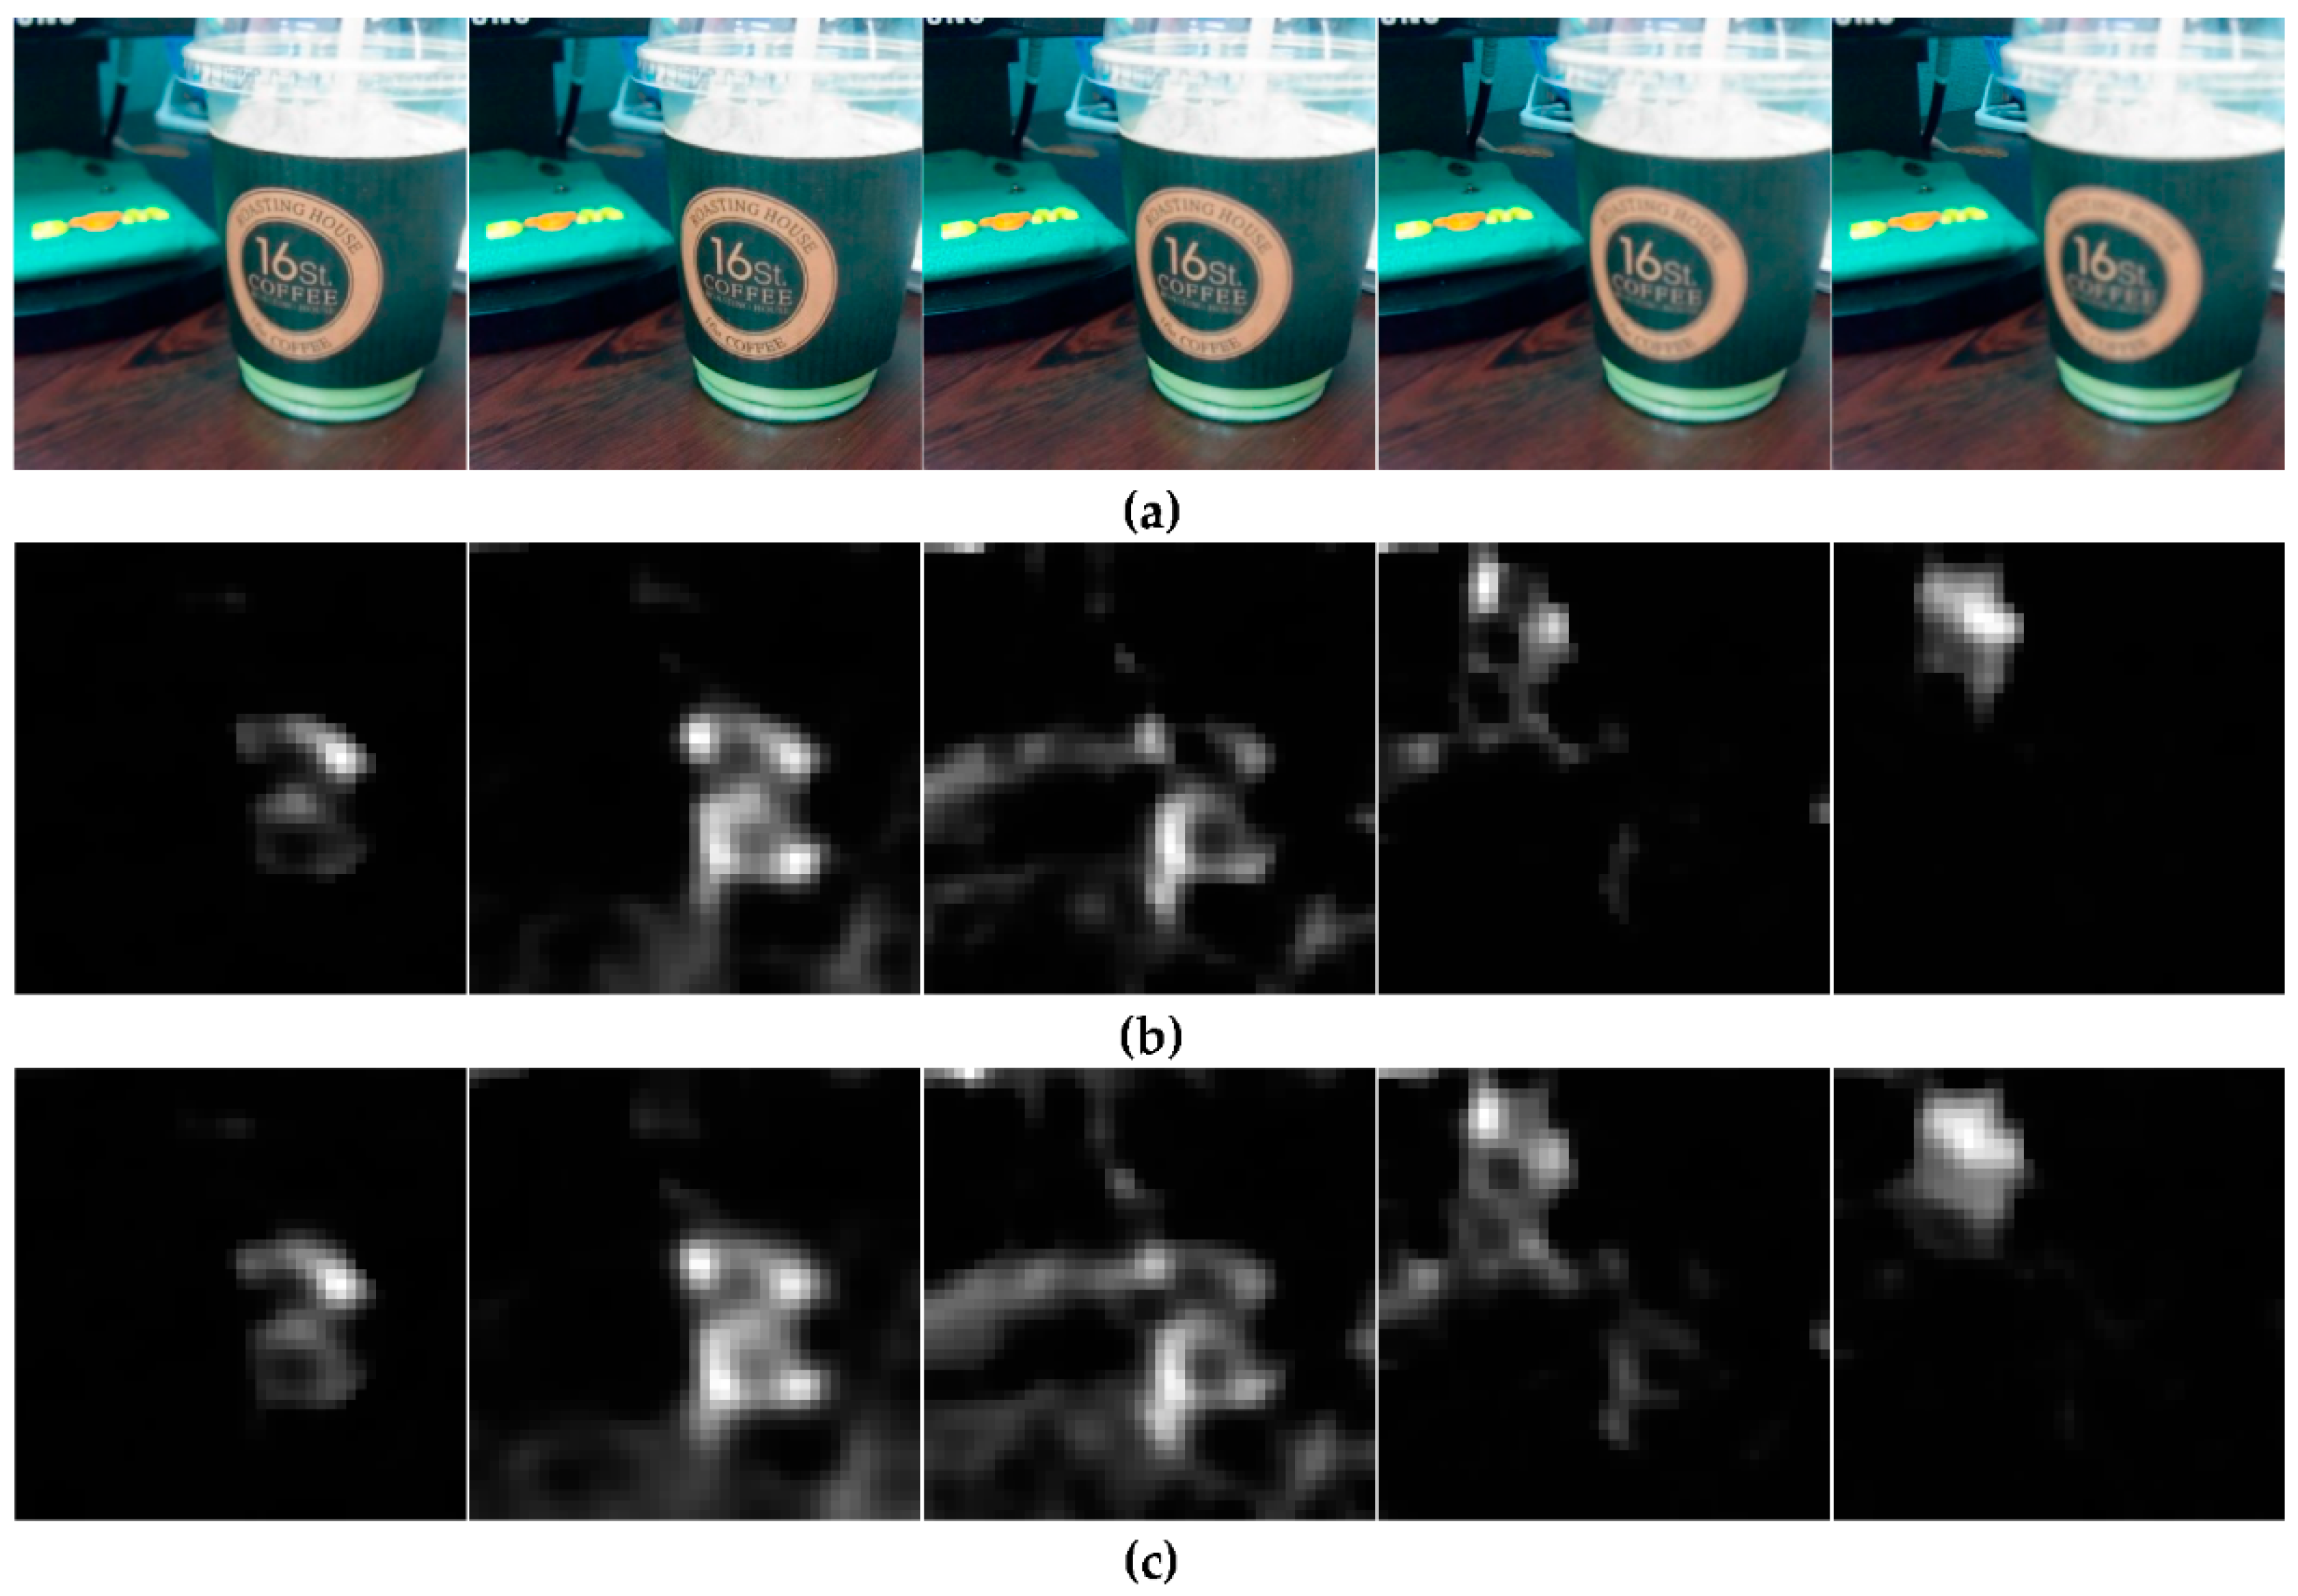
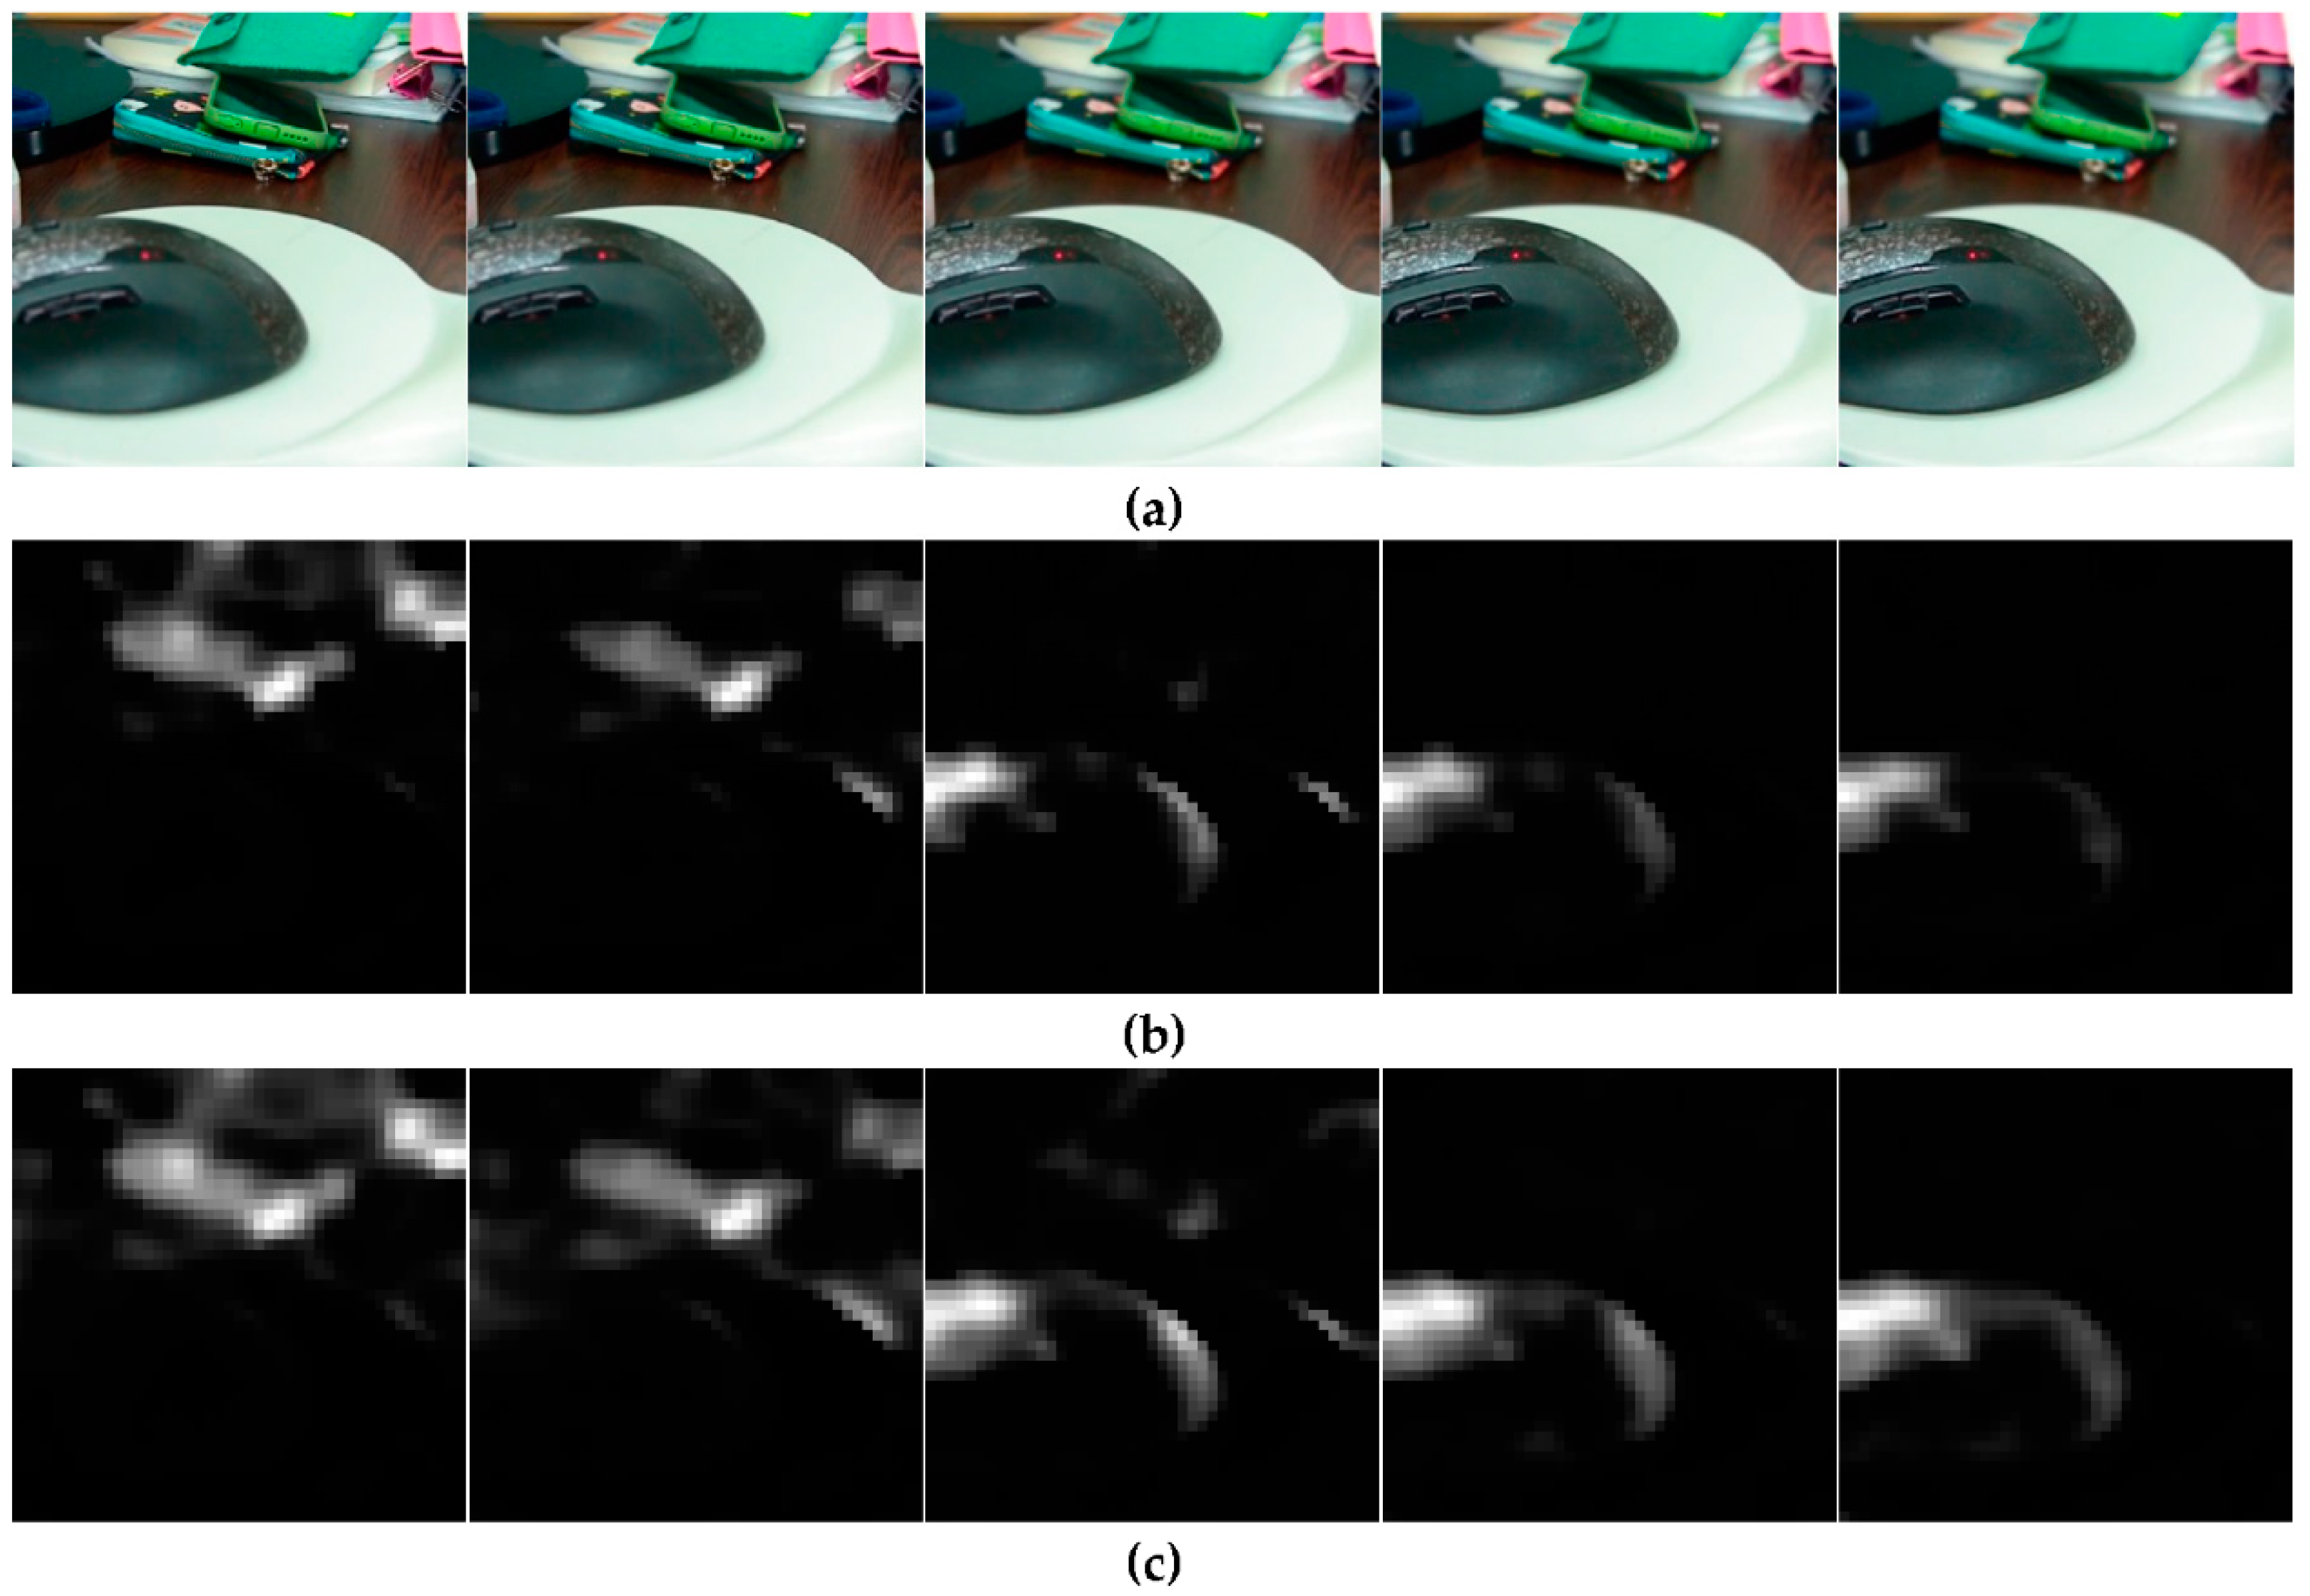
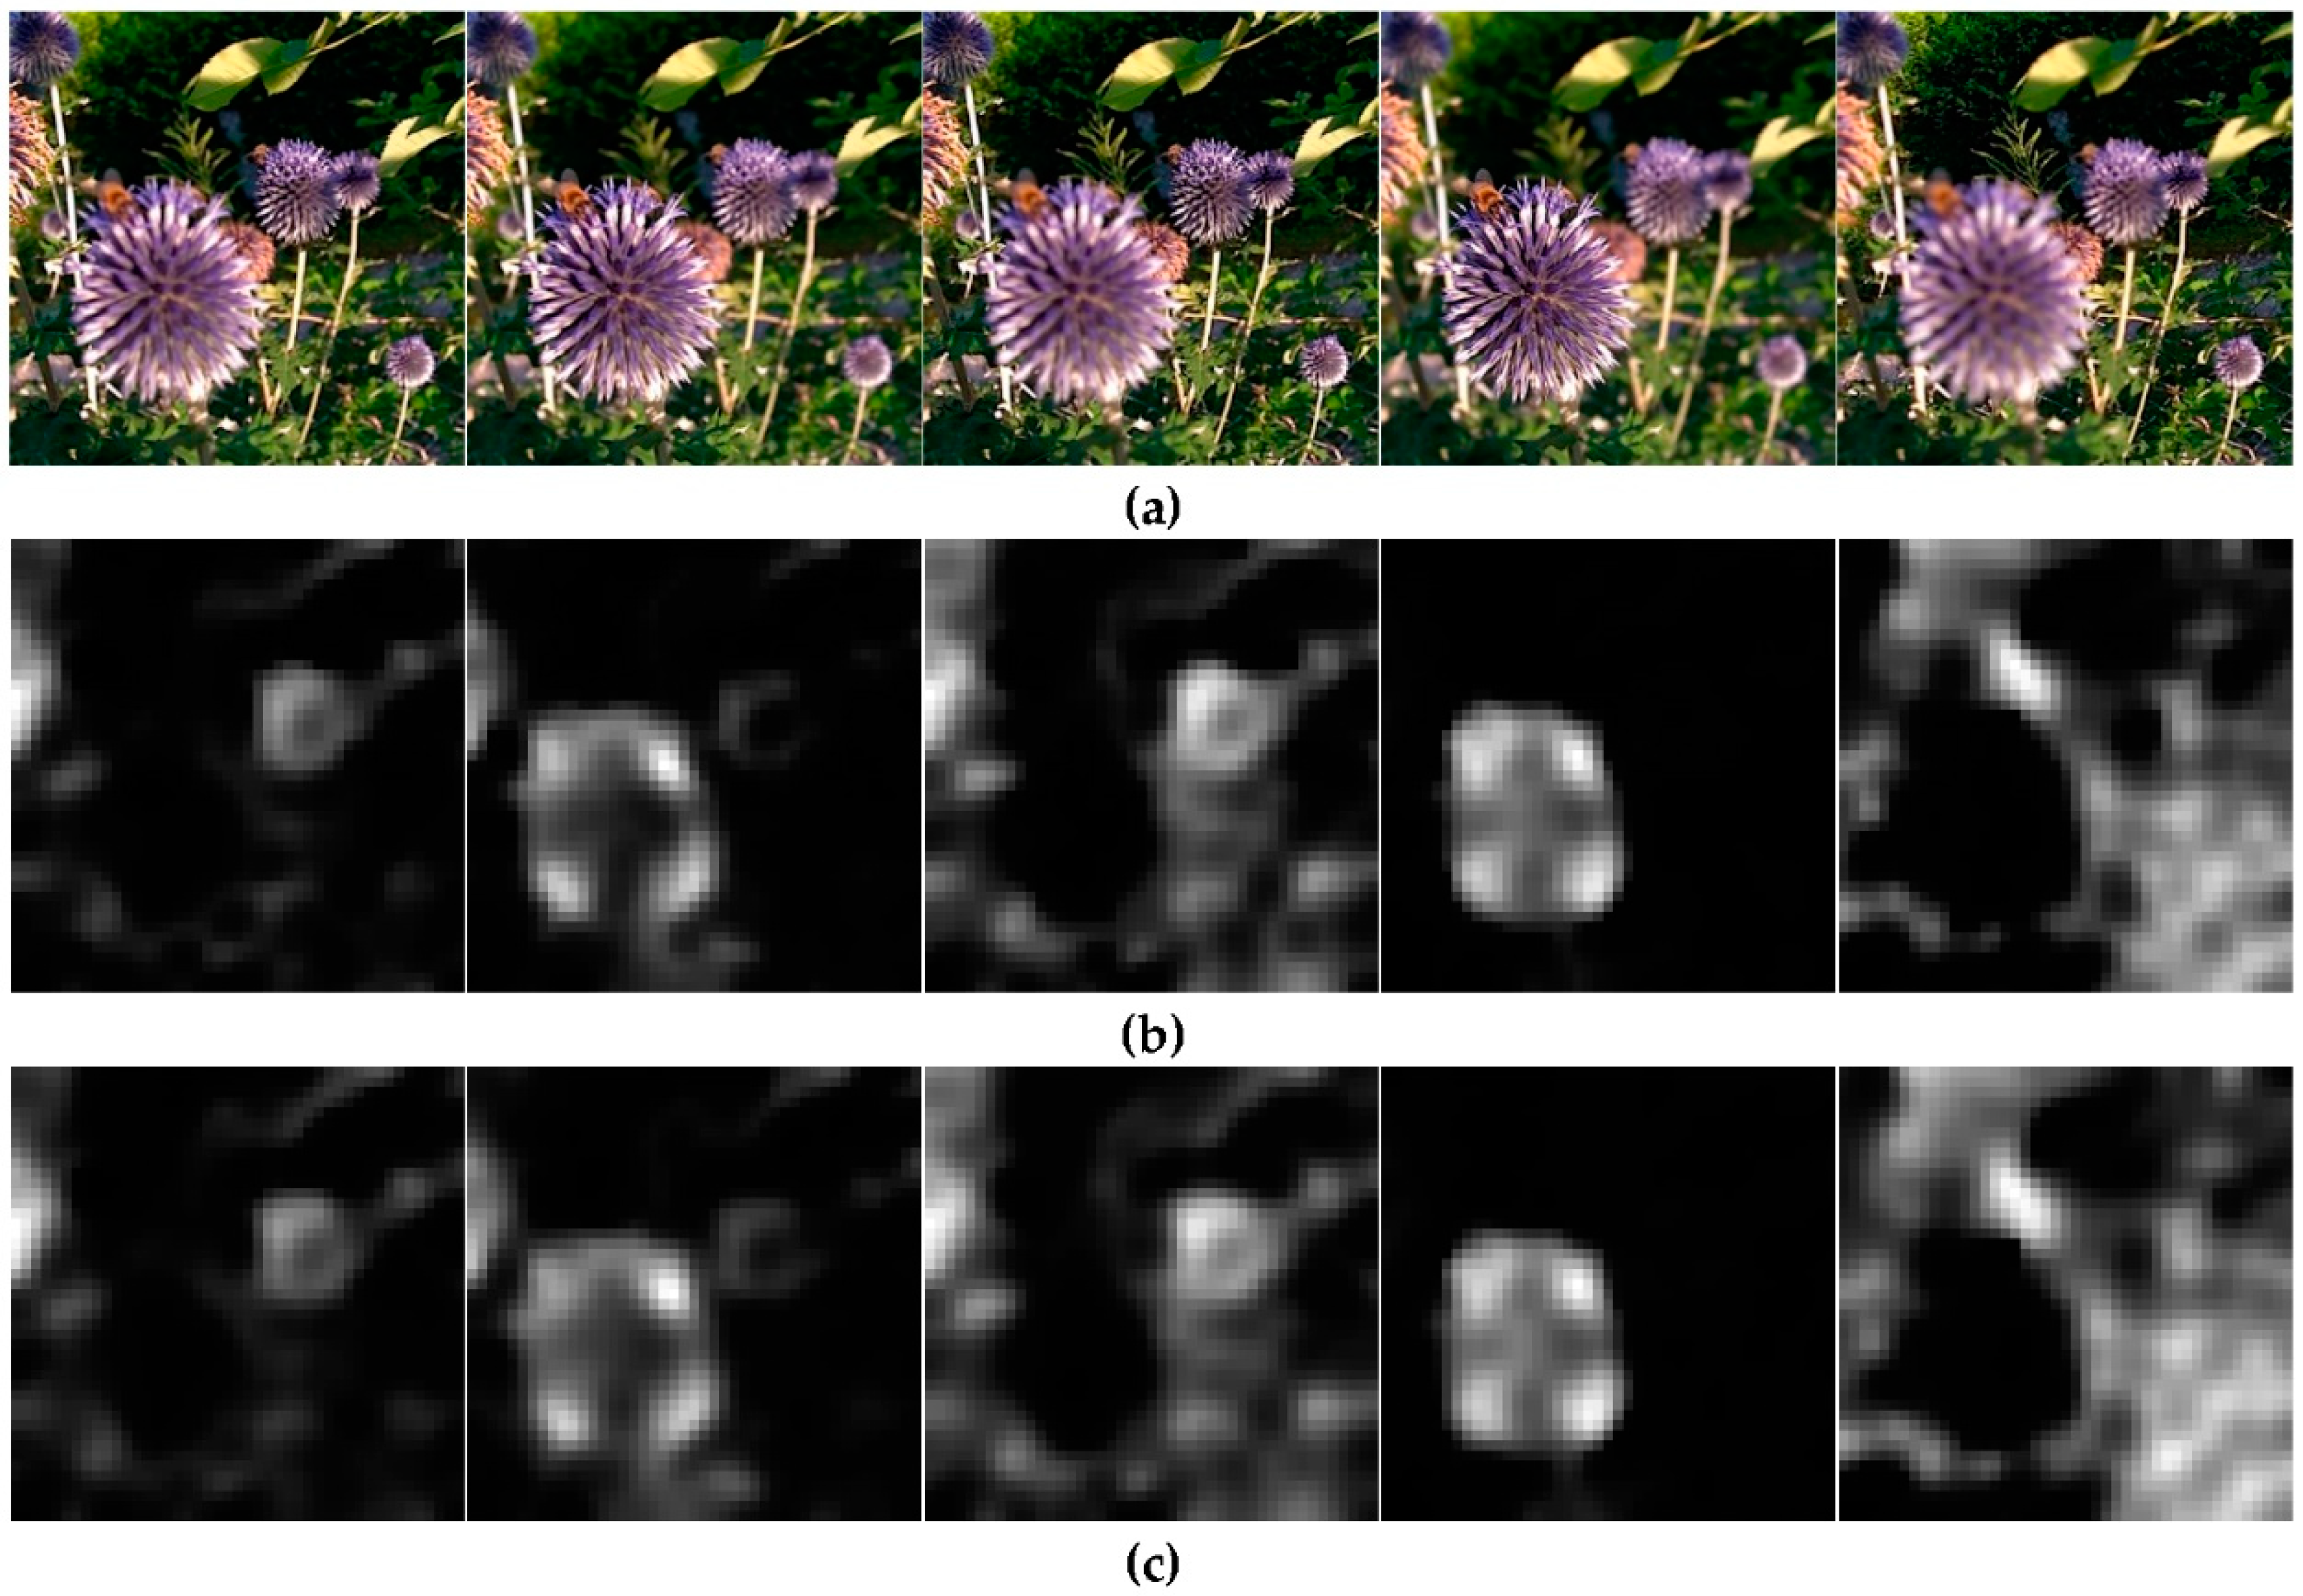
Figure 7, Figure 8, Figure 9, Figure 10 and Figure 11 show the focus measurement in the in-focused regions of focal stack images. The results display only sharply focused parts that have a high value of focus information.

3.1.1. On the Images of the ‘Bag’ Dataset

The effectiveness of the SUML focus measurement is evaluated using the SML on the images of the ‘Bag’ dataset. It is illustrated in Figure 7. It can be observed that the focus measurement is more distinct for the SUML in Figure 7c compared with the SML in Figure 7b.

3.1.2. On the Images of the ‘Cup’ Dataset

The effectiveness of the SUML focus measurement is evaluated using SML on the images of the ‘Cup’ dataset. It is illustrated in Figure 8. It can be observed that the focus measurement is more distinct for the SUML in Figure 8c compared with the SML in Figure 8b.

3.1.3. On the Images of the ‘Bike’ Dataset

The effectiveness of the SUML focus measurement is evaluated using SML on the images of the ‘Bike’ dataset. It is illustrated in Figure 9. It can be observed that the focus measurement is more distinct for the SUML in Figure 9c compared with the SML in Figure 9b.

3.1.4. On the Images of the ‘Mouse’ Dataset

The effectiveness of the SUML focus measurement is evaluated using SML on the images of the ‘Mouse’ dataset. It is illustrated in Figure 10. It can be observed that the focus measurement is more distinct for the SUML in Figure 10c compared with the SML in Figure 10b.

3.1.5. On the Images of the ‘Flower’ Dataset

The effectiveness of the SUML focus measurement is evaluated using SML on the images of the ‘Flower’ dataset. It is illustrated in Figure 11. It can be observed that the focus measurement is more distinct for the SUML in Figure 11c compared with the SML in Figure 11b.

3.2. All-in-Focused Image Combination

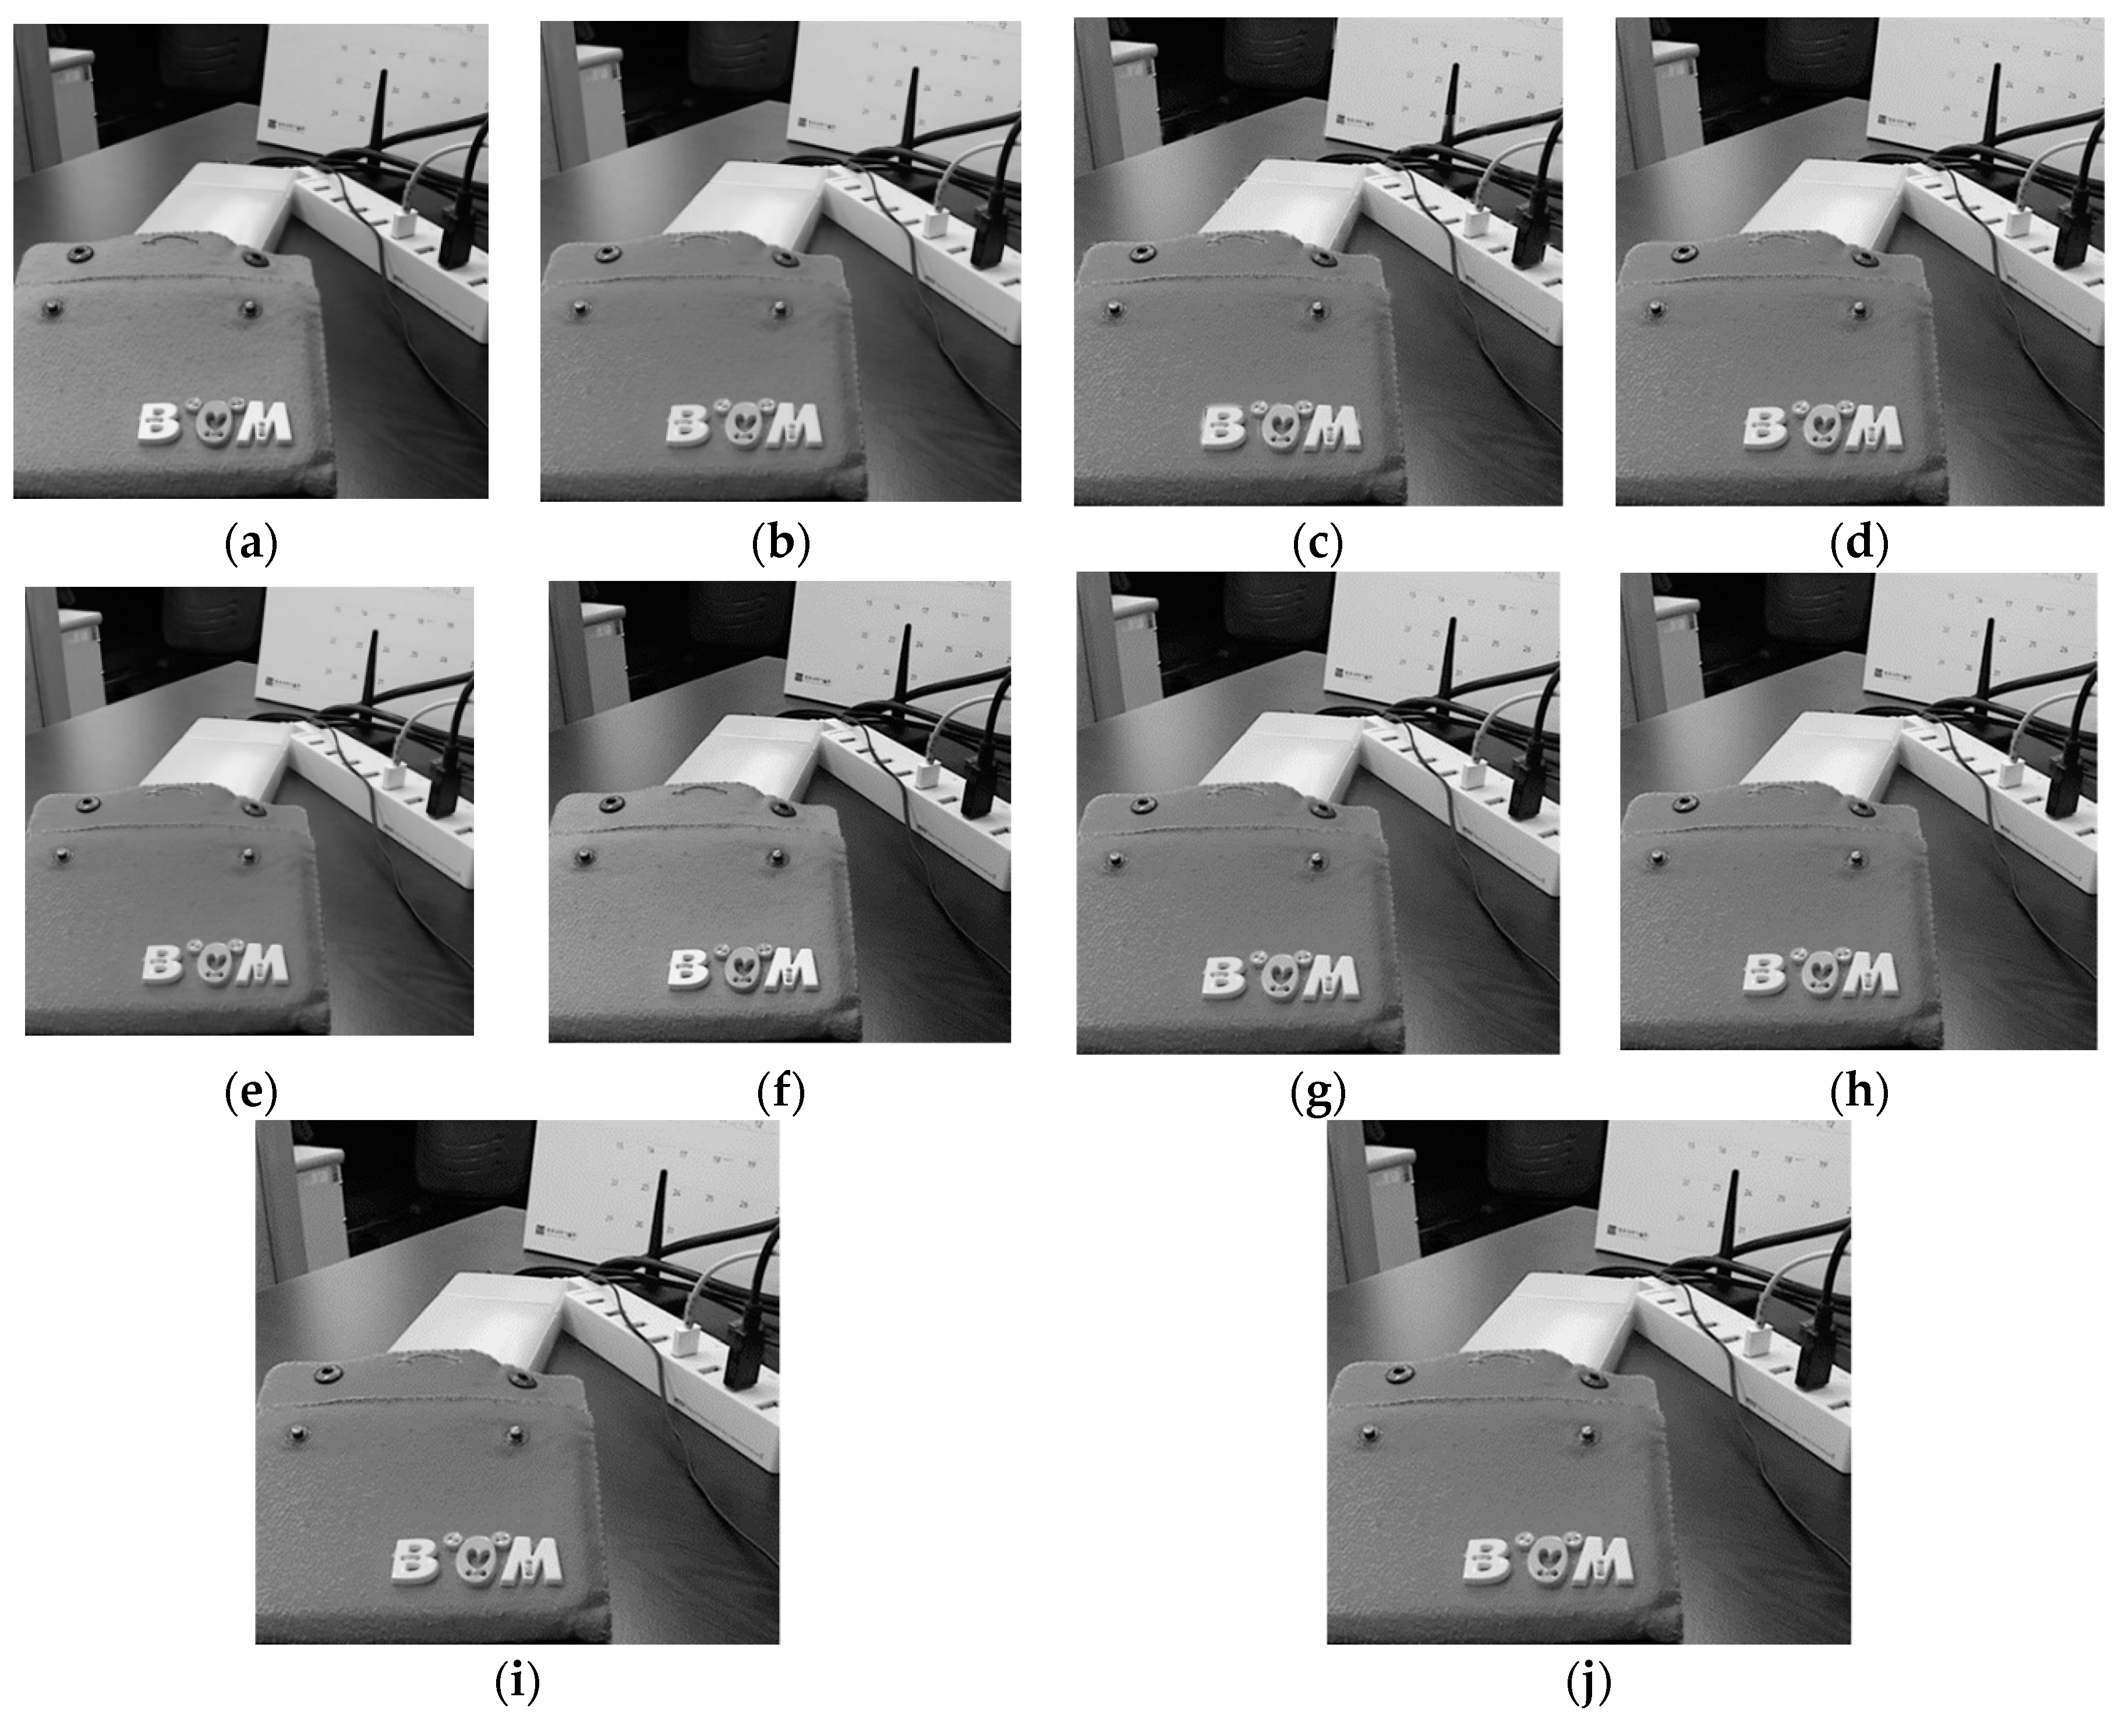
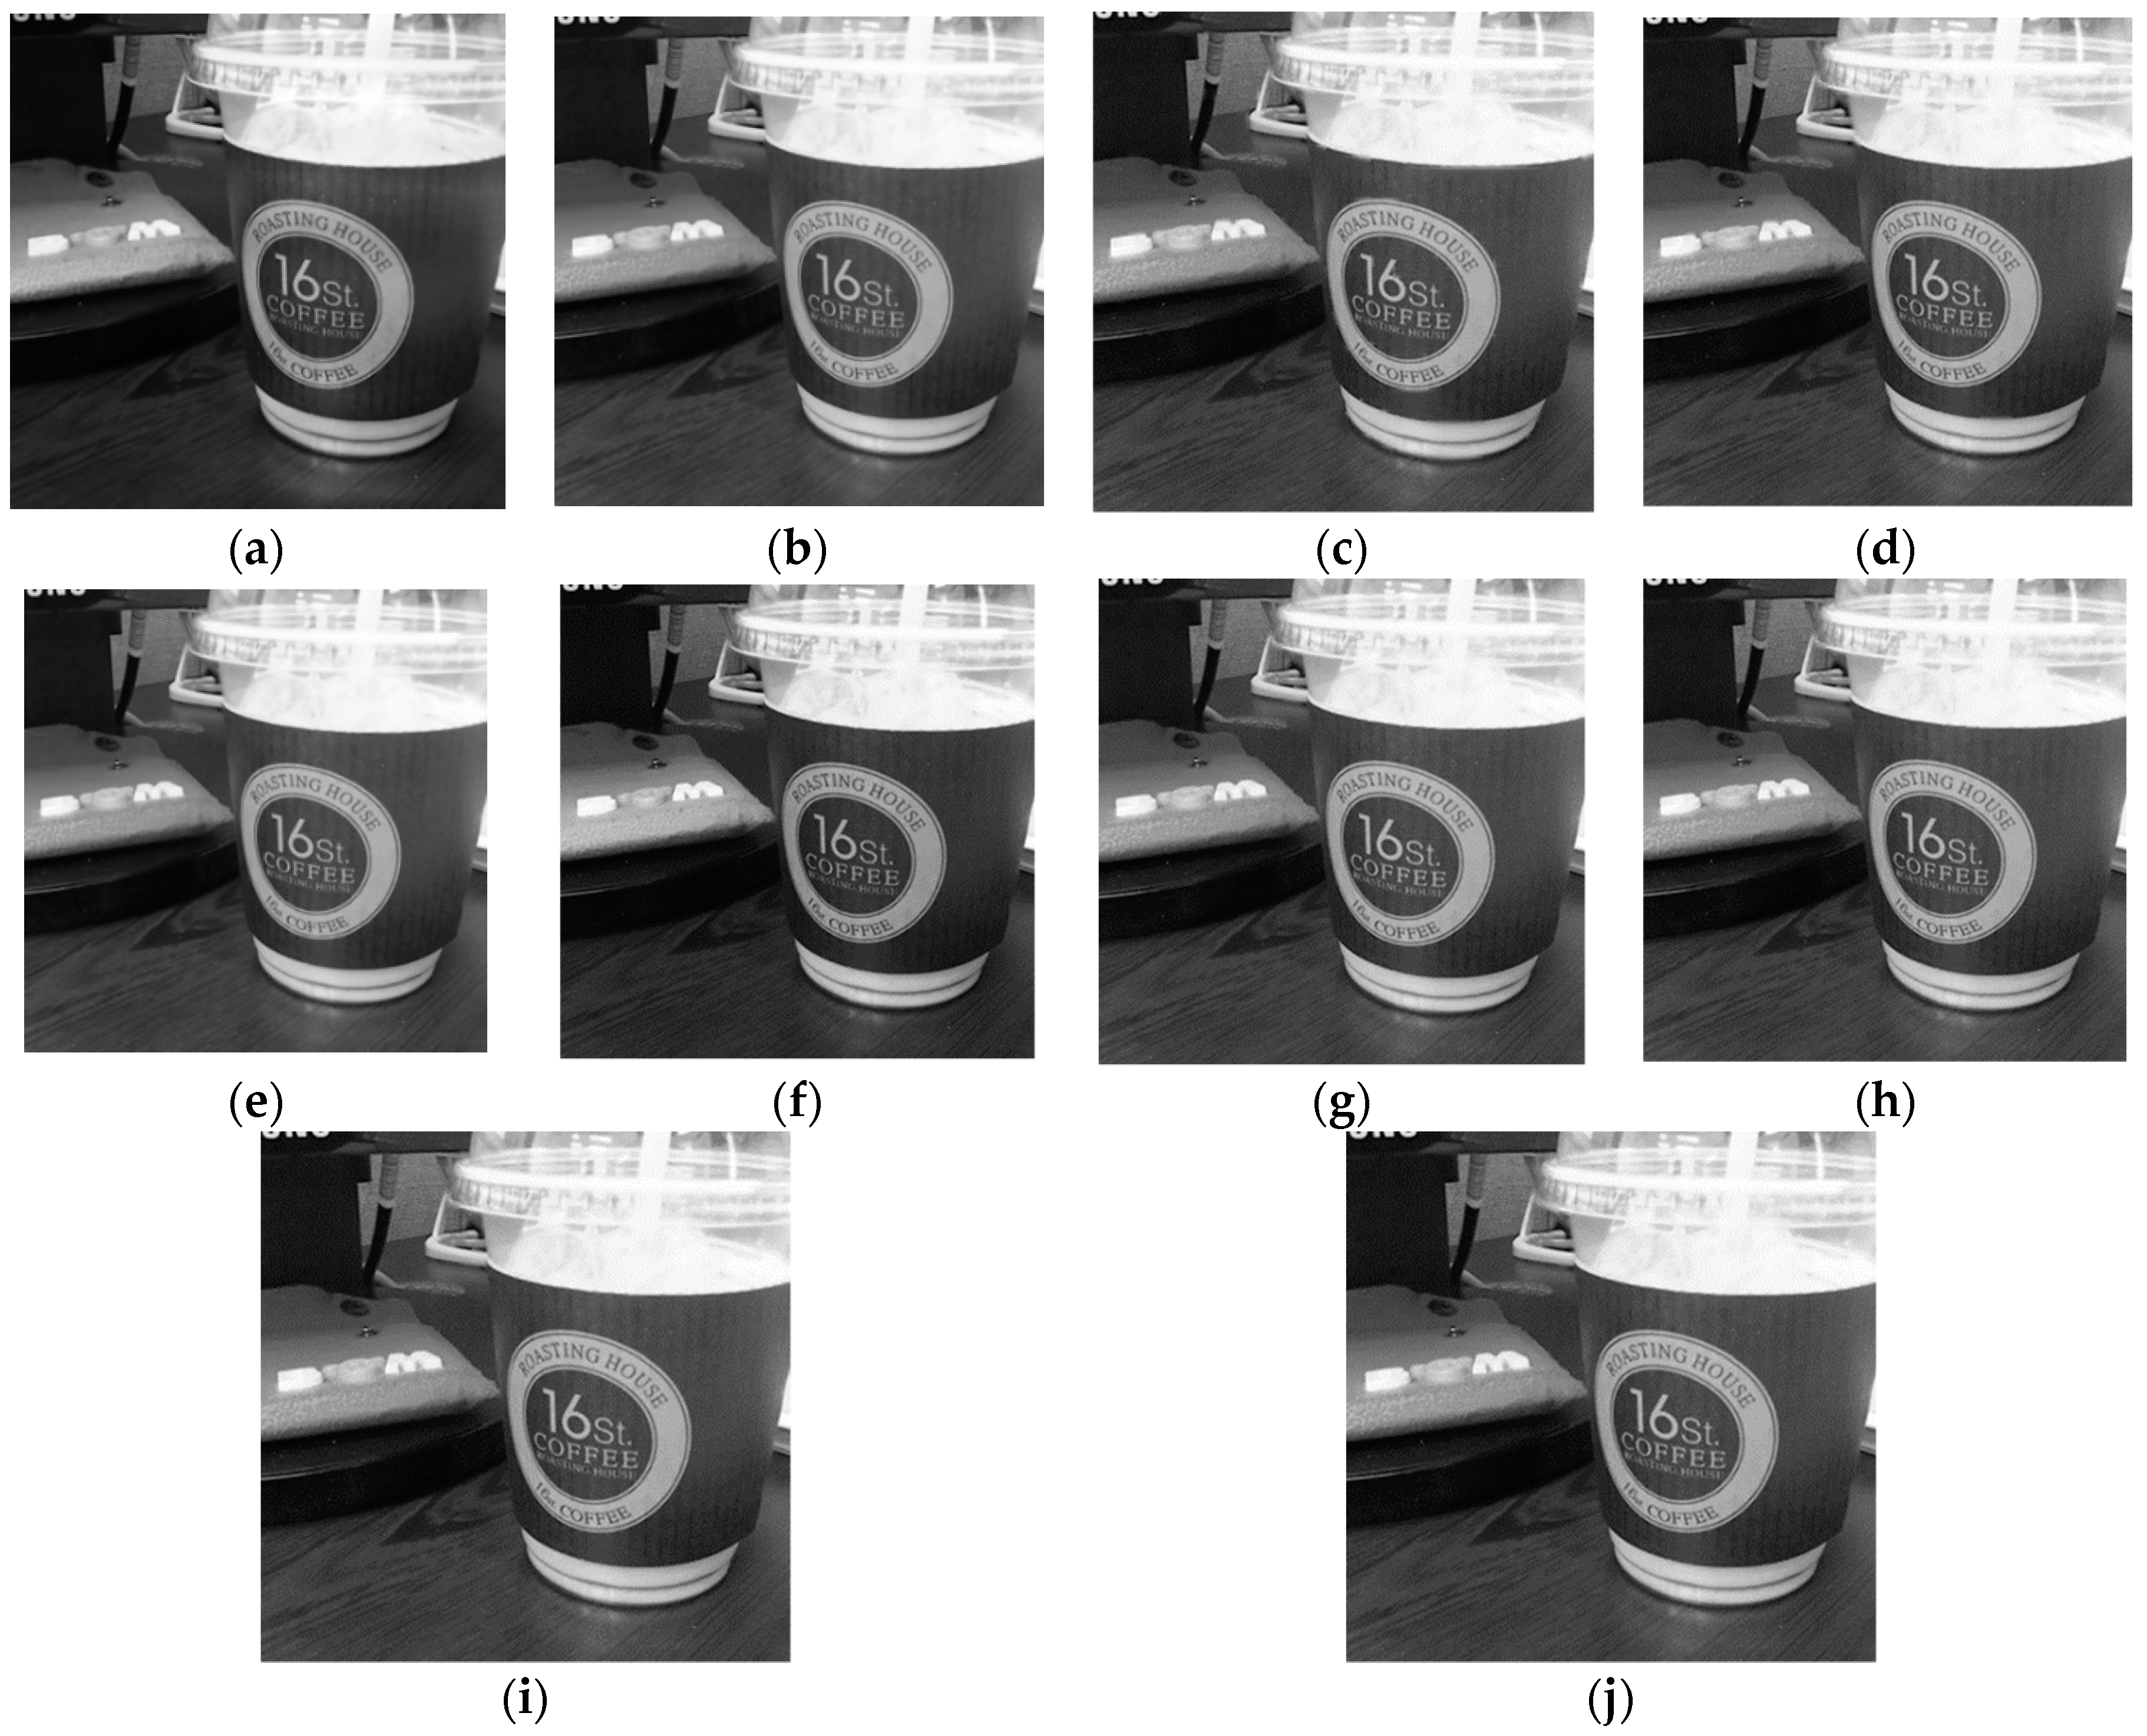
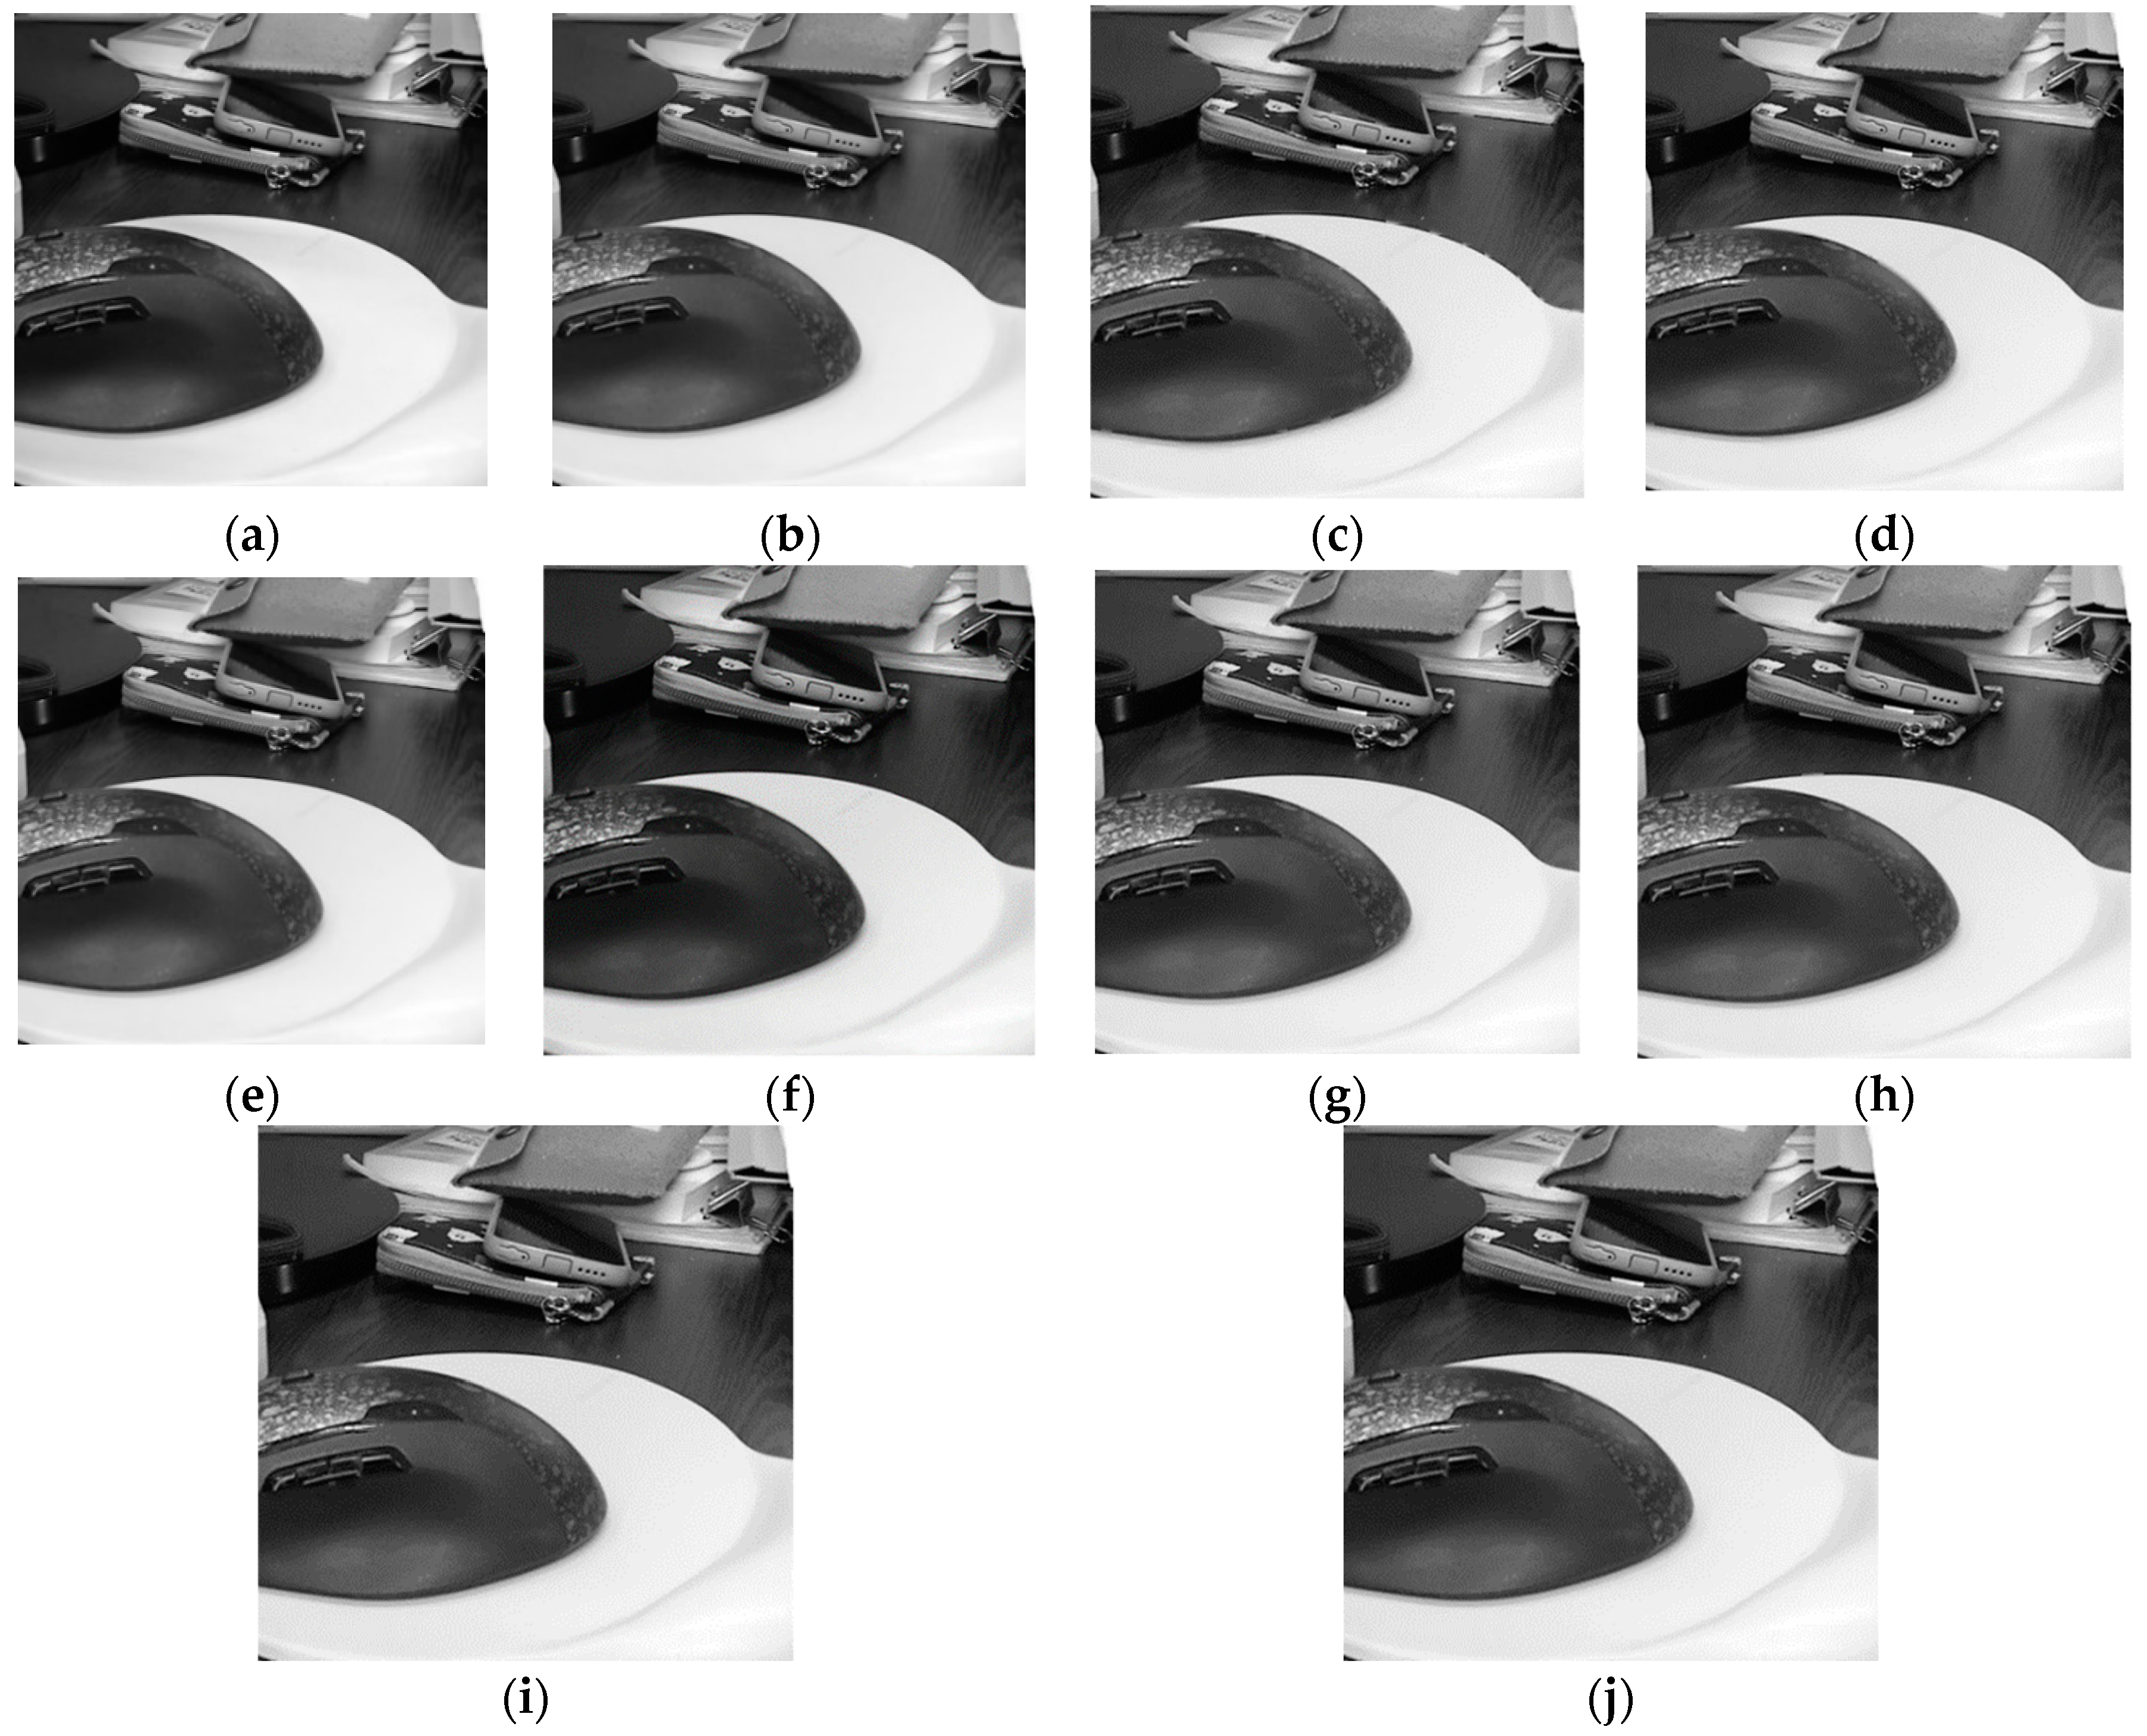
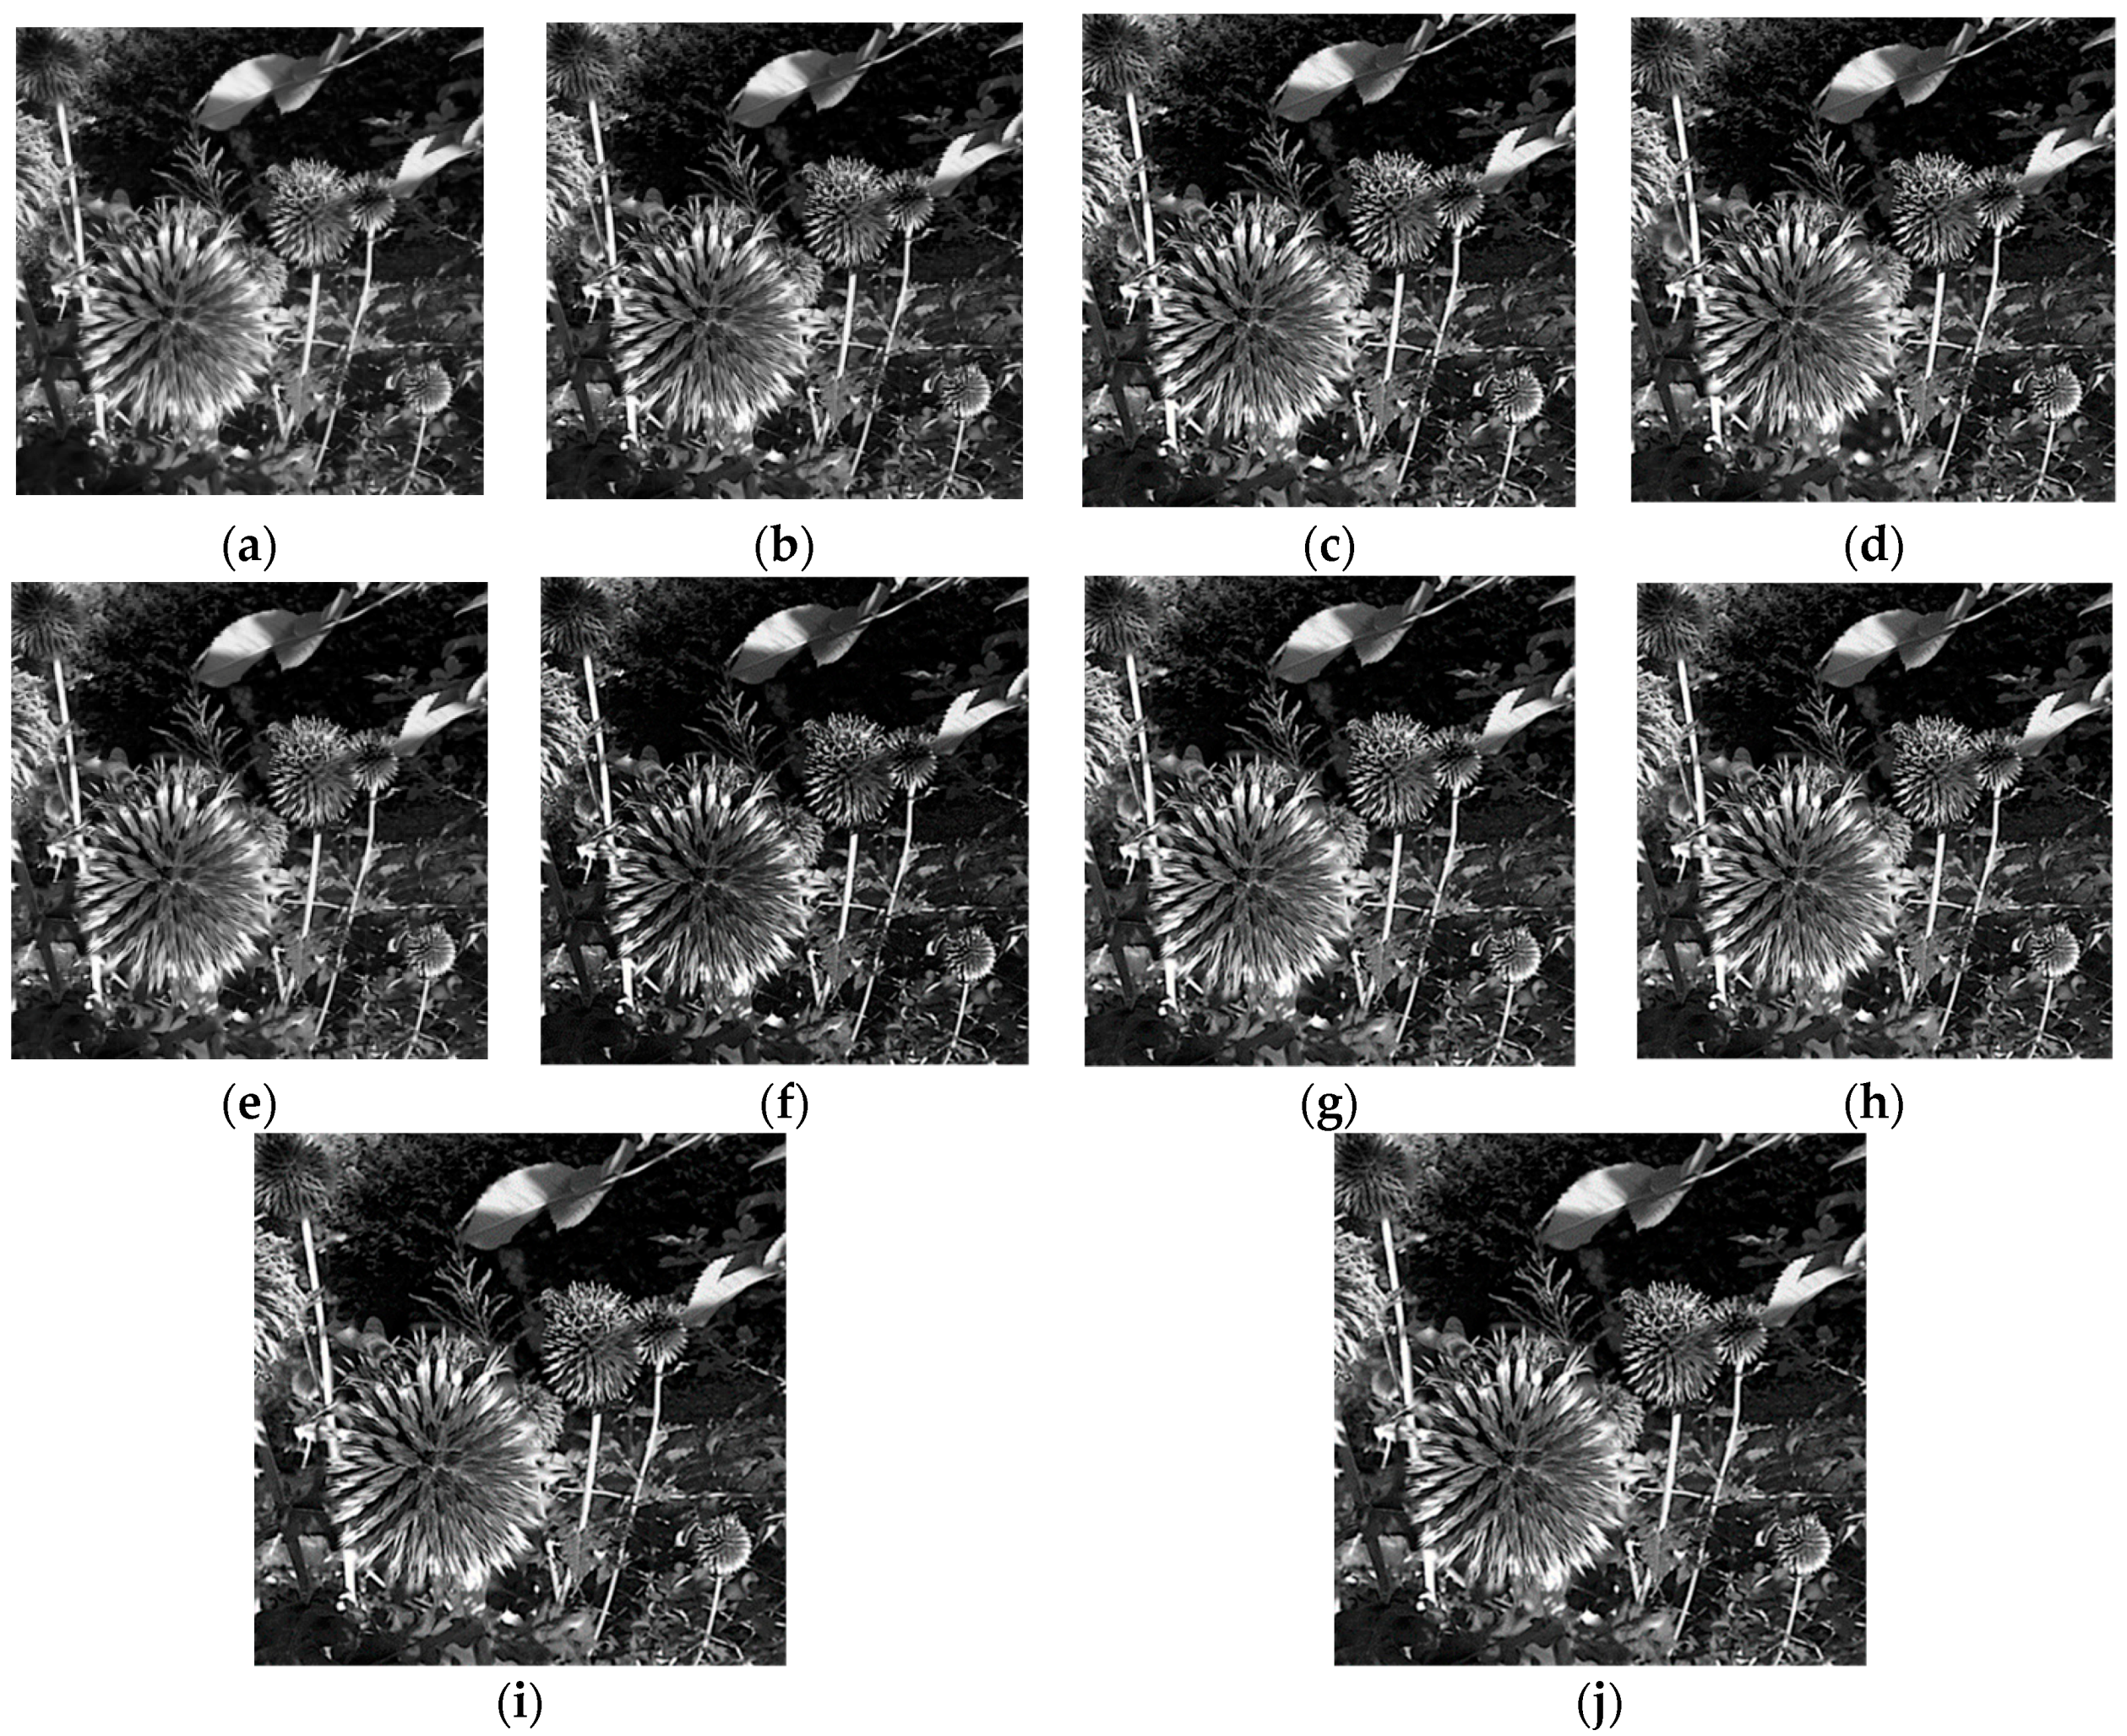
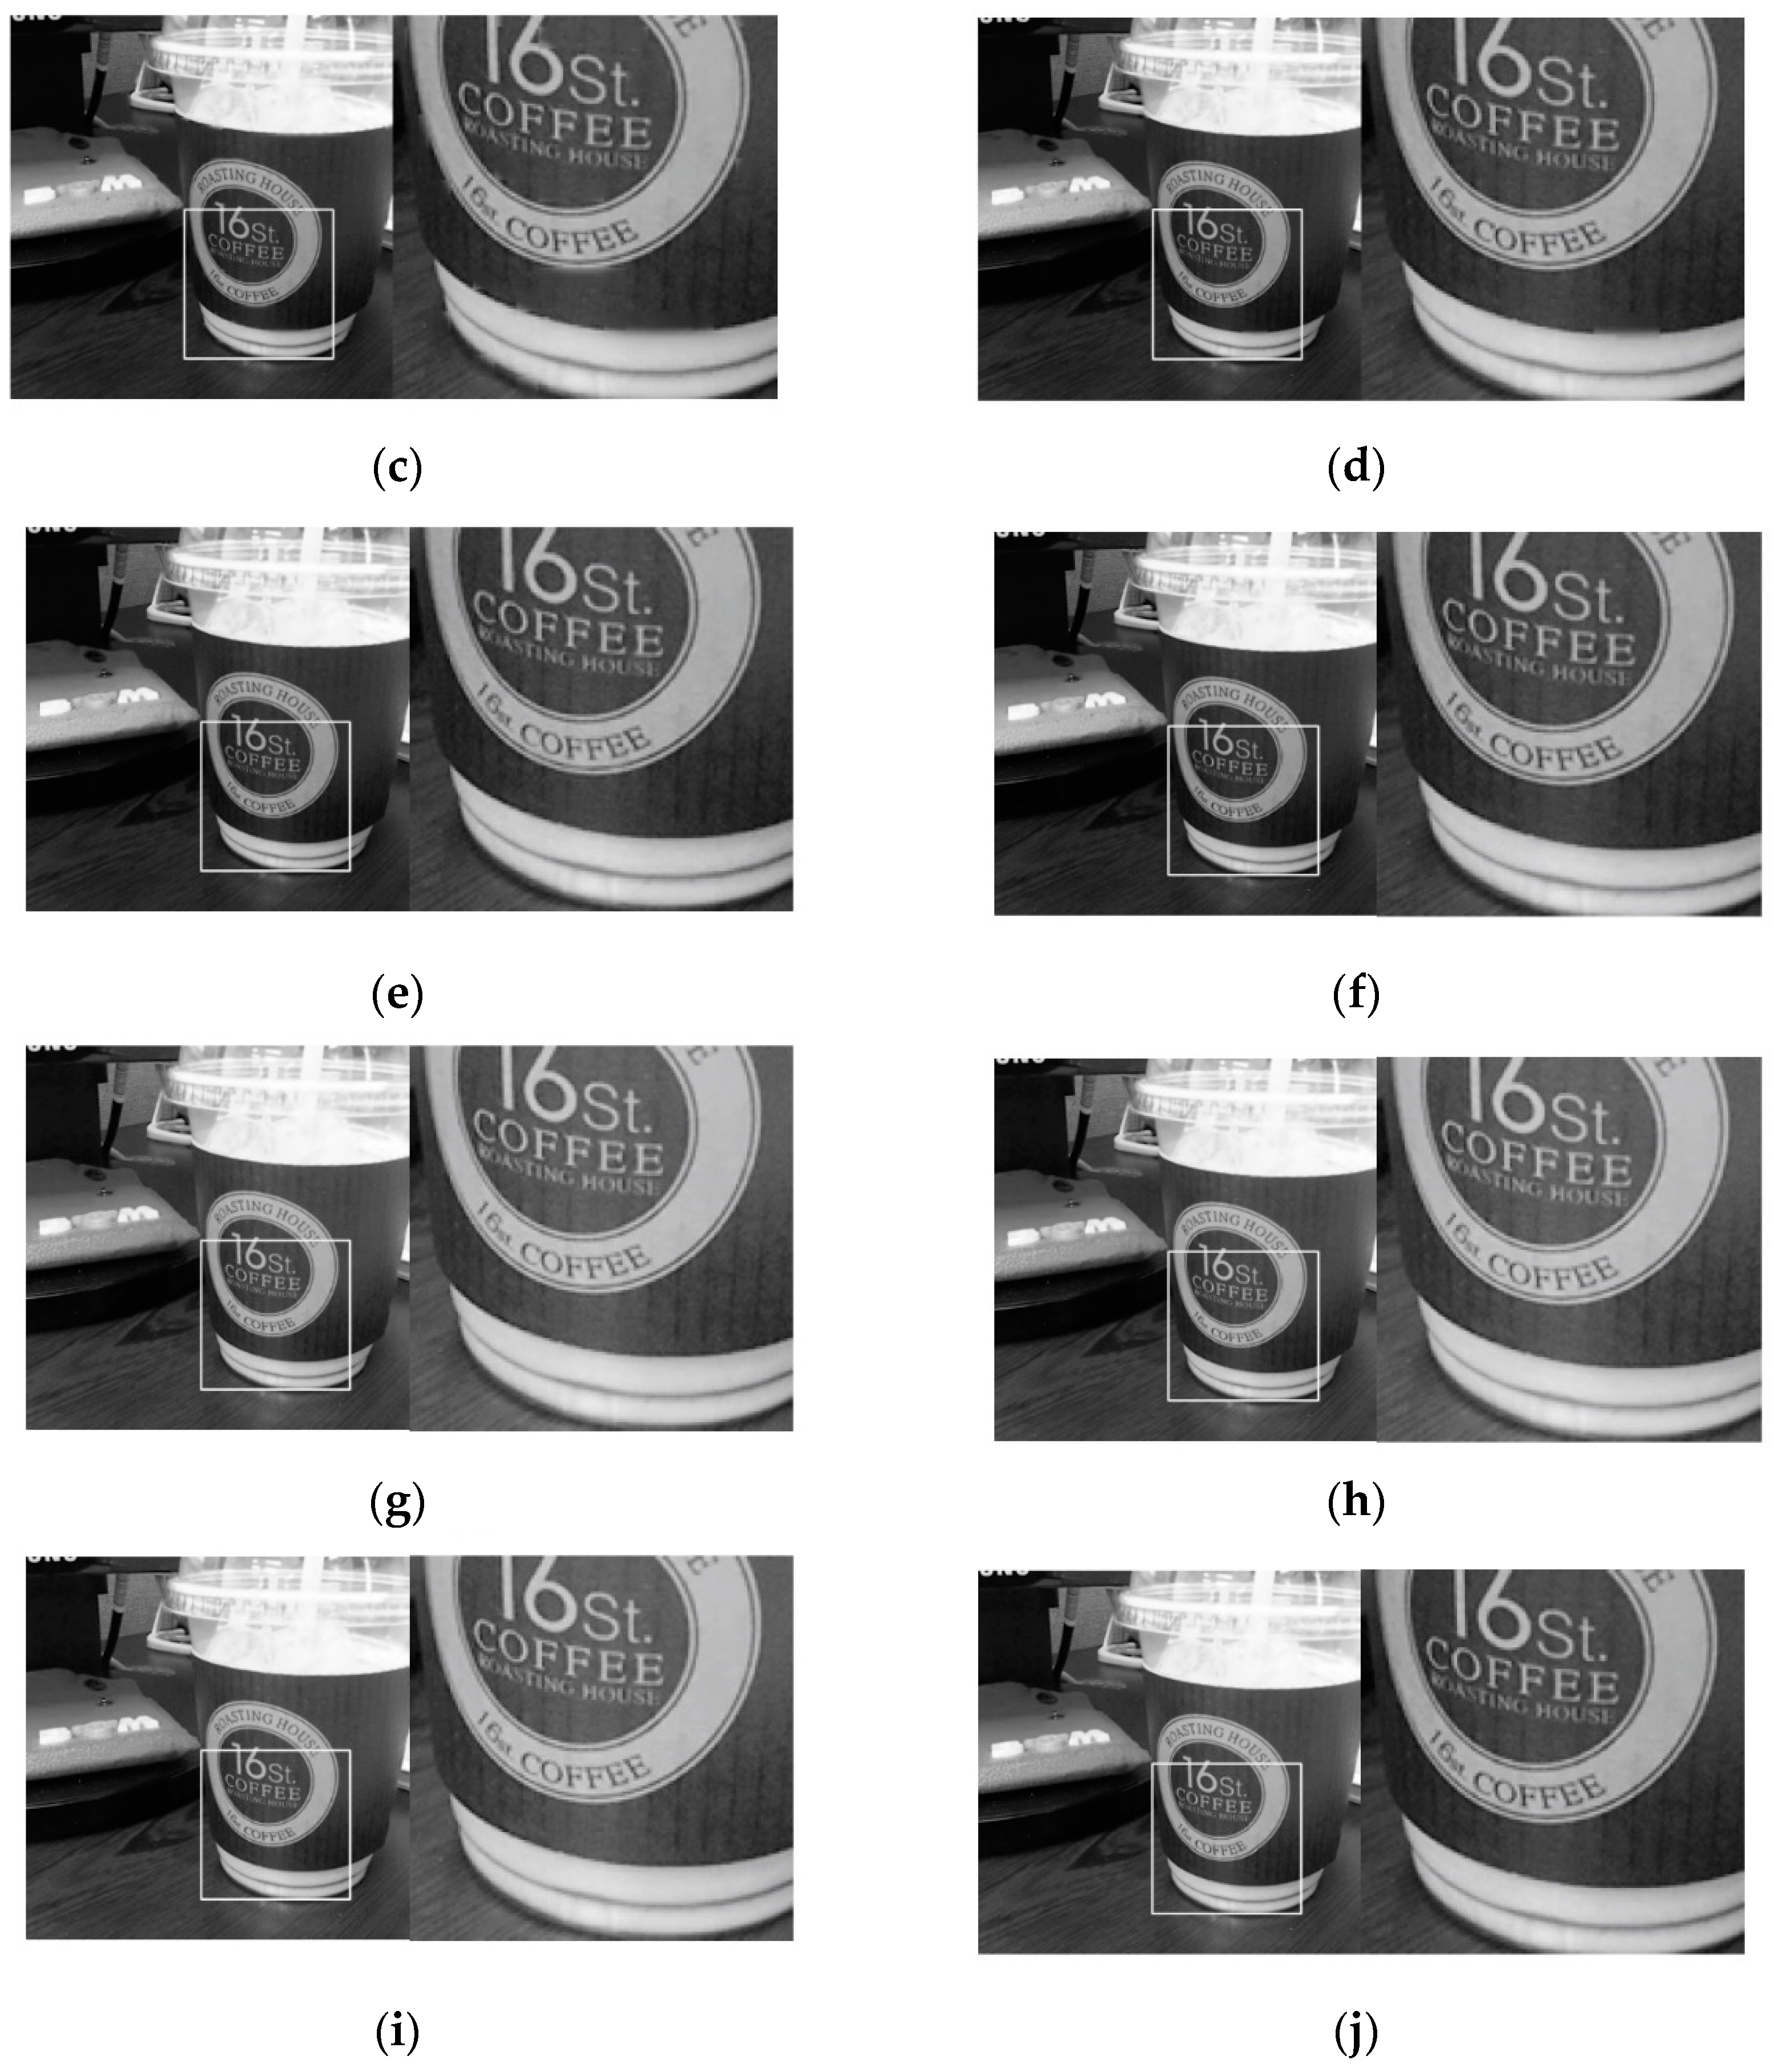
In this section, the experimental results of the all-in-focused images are presented and evaluated by comparing them with other prominent techniques such as light field software [10], SML [9], DCT-STD [5], DCT-VAR-CV [4], SML-WHV [16], Agarwala’s method [17], DCT-Sharp-CV [18], DCT-CORR-CV [19], and DCT-SVD-CV [20]. The all-in-focused images of different algorithms are shown in Figure 12, Figure 13, Figure 14, Figure 15 and Figure 16. From the expanded images in Figure 17, we can easily observe that the results of the light field software, the DCT-STD method, and the DCT-VAR-CV method have lower contrast than those of the SML method, Agarwala’s method, the DCT-Sharp-CV method, the DCT-CORR-CV method, the DCT-SVD-CV method, and the proposed method. However, it is hard to show the differences from the results of the SML method, Agarwala’s method, the DCT-Sharp-CV method, the DCT-CORR-CV method, the DCT-SVD-CV method, and the proposed method by subjective evaluation. It seems that there are little differences among the fused images, but the objective performance evaluation can capture their differences precisely. Hence, this paper applies some non-reference fusion metrics, such as the feature mutual information (FMI) metric [21] and Petrovic’s metric (QAB/F) [22]. These metrics are calculated without respect to the reference images. The FMI metric measures the amount of information that the fused image contains from the source images, while QAB/F measures the relative amount of edge information that is transferred from the source into the fused image. If FMI or QAB/F indicate a higher value, the fused image performance provides a better result. The comparison results are summarized in Table 1, Table 2, Table 3, Table 4 and Table 5. The proposed method provides outstanding results when we compare it with other comparative methods.

3.2.1. On the Images of the ‘Bag’ Dataset

3.2.2. On the Images of the ‘Cup’ Dataset

3.2.3. On the Images of the ‘Bike’ Dataset

3.2.4. On the Images of the ‘Mouse’ Dataset

3.2.5. On the Images of the ‘Flower’ Dataset

3.2.6. On the Expanded Images of the ‘Cup’ Dataset

The performance summary of the different methods on the five image datasets using QAB/F and FMI are listed in Table 6 and Table 7, in which the top values are shown in bold. According to fusion metrics, QAB/F and FMI, the performance of the proposed method was better than the other nine compared methods.

4. Conclusions

In this paper, we proposed an all-in-focused image combination method by integrating the SUML, eSUML, and HM in the DCT domain. The main contributions of this work are that we can perform the robust all-in-focused image combination that is processed in the frequency domain, and extend the depth of field in an imaging system. The performance of the proposed method was evaluated in terms of both subjective and objective evaluation from five image datasets. For the subjective tests, a visual perception experiment was performed. For the objective tests, the QAB/F and FMI were measured. The experimental results show that the proposed method obtains an all-in-focused image of higher quality, presenting the focus measurement and all-in-focused image combination. Consequently, it was shown from the objective evaluation that the proposed method presented the top values of the QAB/F and FMI criteria, compared with the conventional methods.

Author Contributions

All authors discussed the contents of the manuscript. W.C. contributed to the research idea and the framework of this study. He performed the experimental work and wrote the manuscript. M.G.J. provided suggestions on the algorithm and revised the entire manuscript.

Acknowledgments

This work was partially supported by Institute of Information & communications Technology Planning & Evaluation (IITP) grant funded by the Korea government (MSIT) (No. 1158-411, AI National Strategy Project) and by Ministry of Culture, Sport and Tourism (MCST) and Korea Creative Content Agency (KOCCA) in the Culture Technology (CT) Research & Development Program 2019 through the Korea Culture Technology Institute (KCTI), Gwangju Institute of Science and Technology (GIST).

Conflicts of Interest

The authors declare no conflict of interest.

References

  1. Ng, R.; Levoy, M.; Bredif, M.; Duval, G.; Horowitz, M.; Hanrahan, P. Light Field Photography with a Hand-Held Plenoptic Camera; Stanford Technical Report CSTR 2005-02; Stanford University: Stanford, CA, USA, April 2005. [Google Scholar]
  2. Aydin, T.; Akgul, Y.S. A New Adaptive Focus Measure for Shape from Focus. In Proceedings of the British Machine Vision Conference, Leeds, UK, 1–4 September 2008; pp. 8.1–8.10. [Google Scholar]
  3. Zhang, X.; Li, X.; Liu, Z.; Feng, Y. Multi-focus image fusion using image-partition-based focus detection. Signal Process. 2014, 102, 64–76. [Google Scholar] [CrossRef]
  4. Haghighat, H.B.A.; Aghagolzadeh, A.; Seyedarabi, H. Multi-focus image fusion for visual sensor networks in DCT domain. Comp. Elec. Eng. 2011, 37, 789–797. [Google Scholar] [CrossRef]
  5. Lee, C.H.; Zhou, Z.W. Comparison of Image Fusion Based on DCT-STD and DWT-STD. In Proceedings of the International Multi-Conference of Engineers and Computer Scientists, Kowloon, Hong Kong, 14–16 March 2012; pp. 720–725. [Google Scholar]
  6. Wang, H.C.; Chen, Y.T. Optimal lighting of RGB LEDs for oral cavity detection. Opt. Express 2012, 20, 10186–10199. [Google Scholar] [CrossRef] [PubMed]
  7. Huang, Y.S.; Luo, W.C.; Wang, H.C.; Feng, S.W.; Kuo, C.T.; Lu, C.M. How smart LEDs lighting benefit color temperature and luminosity transformation. Energies 2017, 10, 518. [Google Scholar] [CrossRef]
  8. Wang, H.C.; Tsai, M.T.; Chiang, C.P. Visual perception enhancement for detection of cancerous oral tissue by multi-spectral imaging. J. Opt. 2013, 15, 055301. [Google Scholar] [CrossRef]
  9. Huang, W.; Jing, Z. Evaluation of focus measure in multi-focus image fusion. Pattern Recognit. Lett. 2007, 28, 493–500. [Google Scholar] [CrossRef]
  10. Lytro Camera. Available online: https://en.wikipedia.org/wiki/Lytro (accessed on 17 January 2019).
  11. Tools for Working with Lytro Files. Available online: http://github.com/nrpatel/lfptools (accessed on 17 January 2019).
  12. Lee, S.Y.; Park, S.S.; Kim, C.S.; Kumar, Y.; Kim, S.W. Low-Power Auto Focus Algorithm Using Modified DCT for the Mobile Phones. In Proceedings of the International Conference on Consumer Electronics, Las Vegas, NV, USA, 7–11 January 2006; pp. 67–68. [Google Scholar]
  13. Nayar, S.K.; Nakagawa, Y. Shape from focus. IEEE Trans. Pattern Anal. Mach. Intell. 1994, 16, 824–831. [Google Scholar] [CrossRef]
  14. Bai, X.; Zhang, Y.; Zhou, F.; Xue, B. Quadtree-based multi-focus image fusion using a weight focus-measure. Inf. Fusion 2015, 22, 105–108. [Google Scholar] [CrossRef]
  15. He, K.; Sun, J. Fast Guided Filter. arXiv 2015, arXiv:abs/1505.00996. [Google Scholar]
  16. Chantara, W.; Ho, Y.S. Focus Measure of Light Field Image Using Modified Laplacian and Weighted Harmonic Variance. In Proceedings of the International Workshop on Advanced Image Technology, Busan, Korea, 6–8 January 2016; p. 1316. [Google Scholar]
  17. Agrwala, A.; Dontcheva, M.; Agrawala, M.; Drucker, S.; Colburn, A.; Curless, B.; Salesin, D.; Cohen, M. Interactive digital photomontage. ACM Trans. Graph. 2004, 23, 294–302. [Google Scholar] [CrossRef] [Green Version]
  18. Naji, M.A.; Aghagolzadeh, A. A New Multi-Focus Image FUSION technique Based on Variance in DCT Domain. In Proceedings of the 2nd International Conference on Knowledge-Based Engineering and Innovation, Tehran, Iran, 5–6 November 2015; pp. 478–484. [Google Scholar]
  19. Naji, M.A.; Aghagolzadeh, A. Multi-Focus Image Fusion in DCT Domain Based on Correlation Coefficient. In Proceedings of the 2nd International Conference on Knowledge-Based Engineering and Innovation, Tehran, Iran, 5–6 November 2015; pp. 632–639. [Google Scholar]
  20. Amin-Naji, M.; Ranjbar-Noiey, P.; Aghagolzadeh, A. Multi-Focus Image Fusion Using Singular Value Decomposition in DCT Domain. In Proceedings of the 10th Iranian Conference on Machine Vision and Image Processing, Isfahan, Iran, 22–23 November 2017; pp. 45–51. [Google Scholar]
  21. Haghighat, M.; Razian, M.A. Fast-FMI: Non-Reference Image Fusion Metric. In Proceedings of the IEEE 8th International Conference on Application of Information and Communication Technologies, Astana, Kazakhstan, 15–17 October 2017; pp. 1–3. [Google Scholar]
  22. Xydeas, C.S.; Petrovic, V. Objective image fusion performance measure. Electron. Lett. 2000, 36, 308–309. [Google Scholar] [CrossRef] [Green Version]
Figure 1. The procedure of the proposed method.
Applsci 09 03752 g001
Figure 2. Input images: (ah) of different focal lengths.
Applsci 09 03752 g002
Figure 3. The initial MAP(x, y) process.
Applsci 09 03752 g003
Figure 4. The initial FDCT(x, y) process.
Applsci 09 03752 g004
Figure 5. Majority filter in consistency verification to improve MAP(x, y).
Applsci 09 03752 g005
Figure 6. The improved FDCT(x, y).
Applsci 09 03752 g006
Figure 7. In-focused regions of the different focal stack images using sum of modified Laplacian (SML) and SUML: ‘Bag’ dataset; (a) The input images of different focal lengths; (b) SML of stack images; and (c) SUML of stack images.
Applsci 09 03752 g007
Figure 8. In-focused regions of the different focal stack images using SML and SUML: ‘Cup’ dataset; (a) The input images of different focal lengths; (b) SML of stack images; and (c) SUML of stack images.
Applsci 09 03752 g008
Figure 9. In-focused regions of the different focal stack images using SML and SUML: ‘Bike’ dataset; (a) The input images of different focal lengths; (b) SML of stack images; and (c) SUML of stack images.
Applsci 09 03752 g009
Figure 10. In-focused regions of the different focal stack images using SML and SUML: ‘Mouse’ dataset; (a) The different focal stack images of ‘Mouse’ dataset; (b) SML of stack images; and (c) SUML of stack images.
Applsci 09 03752 g010
Figure 11. In-focused regions of the different focal stack images using SML and SUML—‘Flower’ dataset: (a) The input images of different focal lengths; (b) SML of stack images; and (c) SUML of stack images.
Applsci 09 03752 g011
Figure 12. Comparison of ‘Bag’ image results: (a) Light Field Software, (b) SML, (c) DCT-STD, (d) DCT-VAR-CV, (e) SML-WHV, (f) Agarwala’s method, (g) DCT-Sharp-CV, (h) DCT-CORR-CV, (i) DCT-SVD-CV, (j) The Proposed Method.
Applsci 09 03752 g012
Figure 13. Comparison of ‘Cup’ image results: (a) Light Field Software, (b) SML, (c) DCT-STD, (d) DCT-VAR-CV, (e) SML-WHV, (f) Agarwala’s method, (g) DCT-Sharp-CV, (h) DCT-CORR-CV, (i) DCT-SVD-CV, (j) The Proposed Method.
Applsci 09 03752 g013
Figure 14. Comparison of ‘Bike’ image results: (a) Light Field Software, (b) SML, (c) DCT-STD, (d) DCT-VAR-CV, (e) SML-WHV, (f) Agarwala’s method, (g) DCT-Sharp-CV, (h) DCT-CORR-CV, (i) DCT-SVD-CV, (j) The Proposed Method.
Applsci 09 03752 g014
Figure 15. Comparison of ‘Mouse’ image results: (a) Light Field Software, (b) SML, (c) DCT-STD, (d) DCT-VAR-CV, (e) SML-WHV, (f) Agarwala’s method, (g) DCT-Sharp-CV, (h) DCT-CORR-CV, (i) DCT-SVD-CV, (j) The Proposed Method.
Applsci 09 03752 g015
Figure 16. Comparison of ‘Flower’ image results: (a) Light Field Software, (b) SML, (c) DCT-STD, (d) DCT-VAR-CV, (e) SML-WHV, (f) Agarwala’s method, (g) DCT-Sharp-CV, (h) DCT-CORR-CV, (i) DCT-SVD-CV, (j) The Proposed Method.
Applsci 09 03752 g016
Figure 17. The expanded image ‘Cup’ image results: (a) Light Field Software, (b) SML, (c) DCT-STD, (d) DCT-VAR-CV, (e) SML-WHV, (f) Agarwala’s method, (g) DCT-Sharp-CV, (h) DCT-CORR-CV, (i) DCT-SVD-CV, (j) The Proposed Method.
Applsci 09 03752 g017aApplsci 09 03752 g017b
Table 1. Objective evaluation of the image results (non-reference fusion metrics) for ‘Bag’ image.
MethodsCriteria
FMIQAB/F
Light Field Software0.96120.7965
SML0.96660.8015
DCT-STD0.96190.8171
DCT-VAR-CV0.96730.8498
SML-WHV0.96500.7994
Agarwala’s Method0.96790.8542
DCT-Sharp-CV0.96870.8626
DCT-CORR-CV0.96840.8637
DCT-SVD-CV0.96870.8635
The Proposed Method0.97850.8729
Table 2. Objective evaluation of the image results (non-reference fusion metrics) for ‘Cup’ image.
MethodsCriteria
FMIQAB/F
Light Field Software0.92860.7413
SML0.94850.8088
DCT-STD0.94190.8252
DCT-VAR-CV0.95020.8535
SML-WHV0.94840.8176
Agarwala’s Method0.95040.8570
DCT-Sharp-CV0.95320.8706
DCT-CORR-CV0.95320.8709
DCT-SVD-CV0.95330.8708
The Proposed Method0.96270.8788
Table 3. Objective evaluation of the image results (non-reference fusion metrics) for ‘Bike’ image.
MethodsCriteria
FMIQAB/F
Light Field Software0.93840.7394
SML0.95180.7799
DCT-STD0.94760.7897
DCT-VAR-CV0.95380.8230
SML-WHV0.94930.7734
Agarwala’s Method0.95470.8373
DCT-Sharp-CV0.95800.8443
DCT-CORR-CV0.95800.8512
DCT-SVD-CV0.95820.8505
The Proposed Method0.96720.8574
Table 4. Objective evaluation of the image results (non-reference fusion metrics) for ‘Mouse’ image.
MethodsCriteria
FMIQAB/F
Light Field Software0.91530.6917
SML0.92930.7451
DCT-STD0.92180.7626
DCT-VAR-CV0.92940.7819
SML-WHV0.92990.7548
Agarwala’s Method0.93100.7863
DCT-Sharp-CV0.93370.7917
DCT-CORR-CV0.93400.7964
DCT-SVD-CV0.93410.7971
The Proposed Method0.94390.8077
Table 5. Objective evaluation of the image results (non-reference fusion metrics) for ‘Flower’ image.
MethodsCriteria
FMIQAB/F
Light Field Software0.82790.5945
SML0.92550.8706
DCT-STD0.92370.8655
DCT-VAR-CV0.92680.8684
SML-WHV0.92230.8577
Agarwala’s Method0.92730.8756
DCT-Sharp-CV0.94240.9097
DCT-CORR-CV0.94270.9096
DCT-SVD-CV0.94290.9098
The Proposed Method0.95180.9143
Table 6. The performance summary of different methods on the five image datasets, using QAB/F.
ImageMethods
[6][9][5][4][16][17][18][19][20]Proposed
Bag0.79650.80150.81710.84980.79940.85420.86260.86370.86350.8729
Cup0.74130.80880.82520.85350.81760.85700.87060.87090.87080.8788
Bike0.73940.77990.78970.82300.77340.83730.84430.85120.85050.8574
Mouse0.69170.74510.76260.78190.75480.78630.79170.79640.79710.8077
Flower0.59450.87060.86550.86840.85770.87560.90970.90960.90980.9143
Average0.71270.80120.81200.83530.80060.84210.85580.85840.85830.8662
Table 7. The performance summary of different methods on the five image datasets, using FMI.
ImageMethods
[6][9][5][4][16][17][18][19][20]Proposed
Bag0.96120.96660.96190.96730.96500.96790.96870.96840.96870.9785
Cup0.92860.94850.94190.95020.94840.95040.95320.95320.95330.9627
Bike0.93840.95180.94760.95380.94930.95470.95800.95800.95820.9672
Mouse0.91530.92930.92180.92940.92990.93100.93370.93400.93410.9439
Flower0.82790.92550.92370.92680.92230.92730.94240.94270.94290.9518
Average0.91430.94430.93940.94550.94300.94630.95120.95130.95140.9608