1. Introduction
Bone tissue is mainly composed of hydroxyapatite and collagen. The structure of cortical bone contains multi-scale microcanals or micropores that are filled with tissue fluid. When a cortical bone is subjected to stresses, the resulting strains acting as a driving force that can cause flows of the tissue fluid through the microcanals, during which streaming potentials arise simultaneously [
1]. Moreover, the resultant strain can induce polarized electric charges or potential in the bone due to the piezoelectric effect of bone collagens [
2]. The two types of stress generated potentials (SGPs) may be related to the growth of bone cells, which stimulates the interest to study the electromechanical properties of bone [
3,
4,
5].
The bone growth and absorption process is known as remodeling. Ozcivici et al. concluded that bone remodeling is sensitive to changes in the magnitudes of mechanical strain, the number of mechanical loading cycles, the distribution of loading, the rate of strain and the rate of fluid stress [
6]. To explore the role of SGPs, attempts have been made to apply the SGPs to orthopedics for enhancing bone growth. Wang and Qin [
7] studied the healing process of bone fractures using a pulsed electromagnetic field device. Literature [
8,
9,
10,
11] showed that piezoelectric potentials can enhance bone regeneration and remodeling. For example, Fonseca et al. demonstrated that an external microcurrent (10 μA) can modulate the homeostasis of bone remodeling [
12]. Thus, studying the electromechanical properties of bone not only help us understand the nature of bone materials, but also have clinical significance.
When a bone is subjected to deformation caused by stresses, the deformation can lead to bone fluid flows in the microcanals, and then streaming potentials are induced in the microcanals. Owing to the fact that the structure of the microcanals in bone are very complicated, with diameters ranging from tens of nanometers to tens of micrometers, the characteristics of the fluid flowing and the corresponding streaming potentials are still not fully understood [
13,
14], though the streaming potentials may play a role in influencing the remodeling of bone cells [
15]. Hong [
16] obtained the streaming potentials in the intraosseous of a cortical bone experimentally and the results indicated that streaming potentials are induced by fluid pressure gradient.
The classical theory of streaming potential is available if and only if the fluid flows in a straight capillary with equal diameter [
1,
17]. Based on this understanding, a classical formula of the streaming potential is given by
where
ε,
μ and
represent the electric permittivity, dynamic viscosity and bulk conductivity of the fluid respectively. The symbol
P is externally applied pressure and
, known as Zeta potential, is the potential at the slipping plane, which refers to the plane where the fluid velocity decreases to zero. The
represents the electric charges density on the capillary’s inner surface in a certain extent.
Equation (1) indicates that streaming potential is independent of canal’s length [
18,
19] and can be affected by the physical characteristics of electric permittivity, dynamic viscosity and bulk conductivity of the fluid. Many factors can, indeed, affect the streaming potentials in bone, because of the hierarchical and interconnected structure of the microcanals [
20]. For example, a simulation demonstrates that the key loading factor governing streaming potential is the strain rate ranging from 10
−4 to 10
−3 s
−1 [
18], and an experimental result shows that streaming potential decreases with increasing pressure-gradient rate [
21]. The presence of interconnected pores in the bulk of hydroxyapatite specimens result in additional variations of the internal zeta potentials and the pore conductivities [
22].
Although the intraosseous Haversian canal and the Volkmann’s canal are approximately straight, most canaliculi and lacunas in bone are tortuous which may lead to the characteristic of streaming potential being not fully understood in the bone micropores.
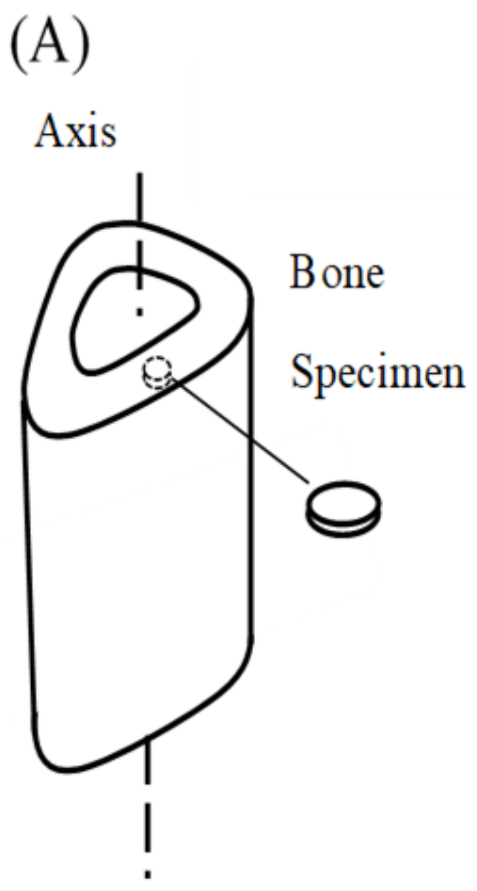
This paper studies the streaming potentials’ behaviors when the fluid flows through the micropores in bone. An experimental setup was developed for measuring the streaming potentials between two surfaces of a bone plate specimen. It was found that the streaming potentials measured increase almost linearly under a constant fluid pressure, which does not agree with the classical theory of the streaming potentials.
3. Results
The pressure waveforms’ output by the air pressure controller were approximately square with the rising and falling time not exceeding 1 s. Considering the limitation of the data acquisition time, the selected duration of the pressure was about 65 s and three amplitudes of 100 kPa, 150 kPa and 200 kPa were selected in the test. Four specimens were measured in the test, each specimen is repetitively measured five times under each of the three pressures.
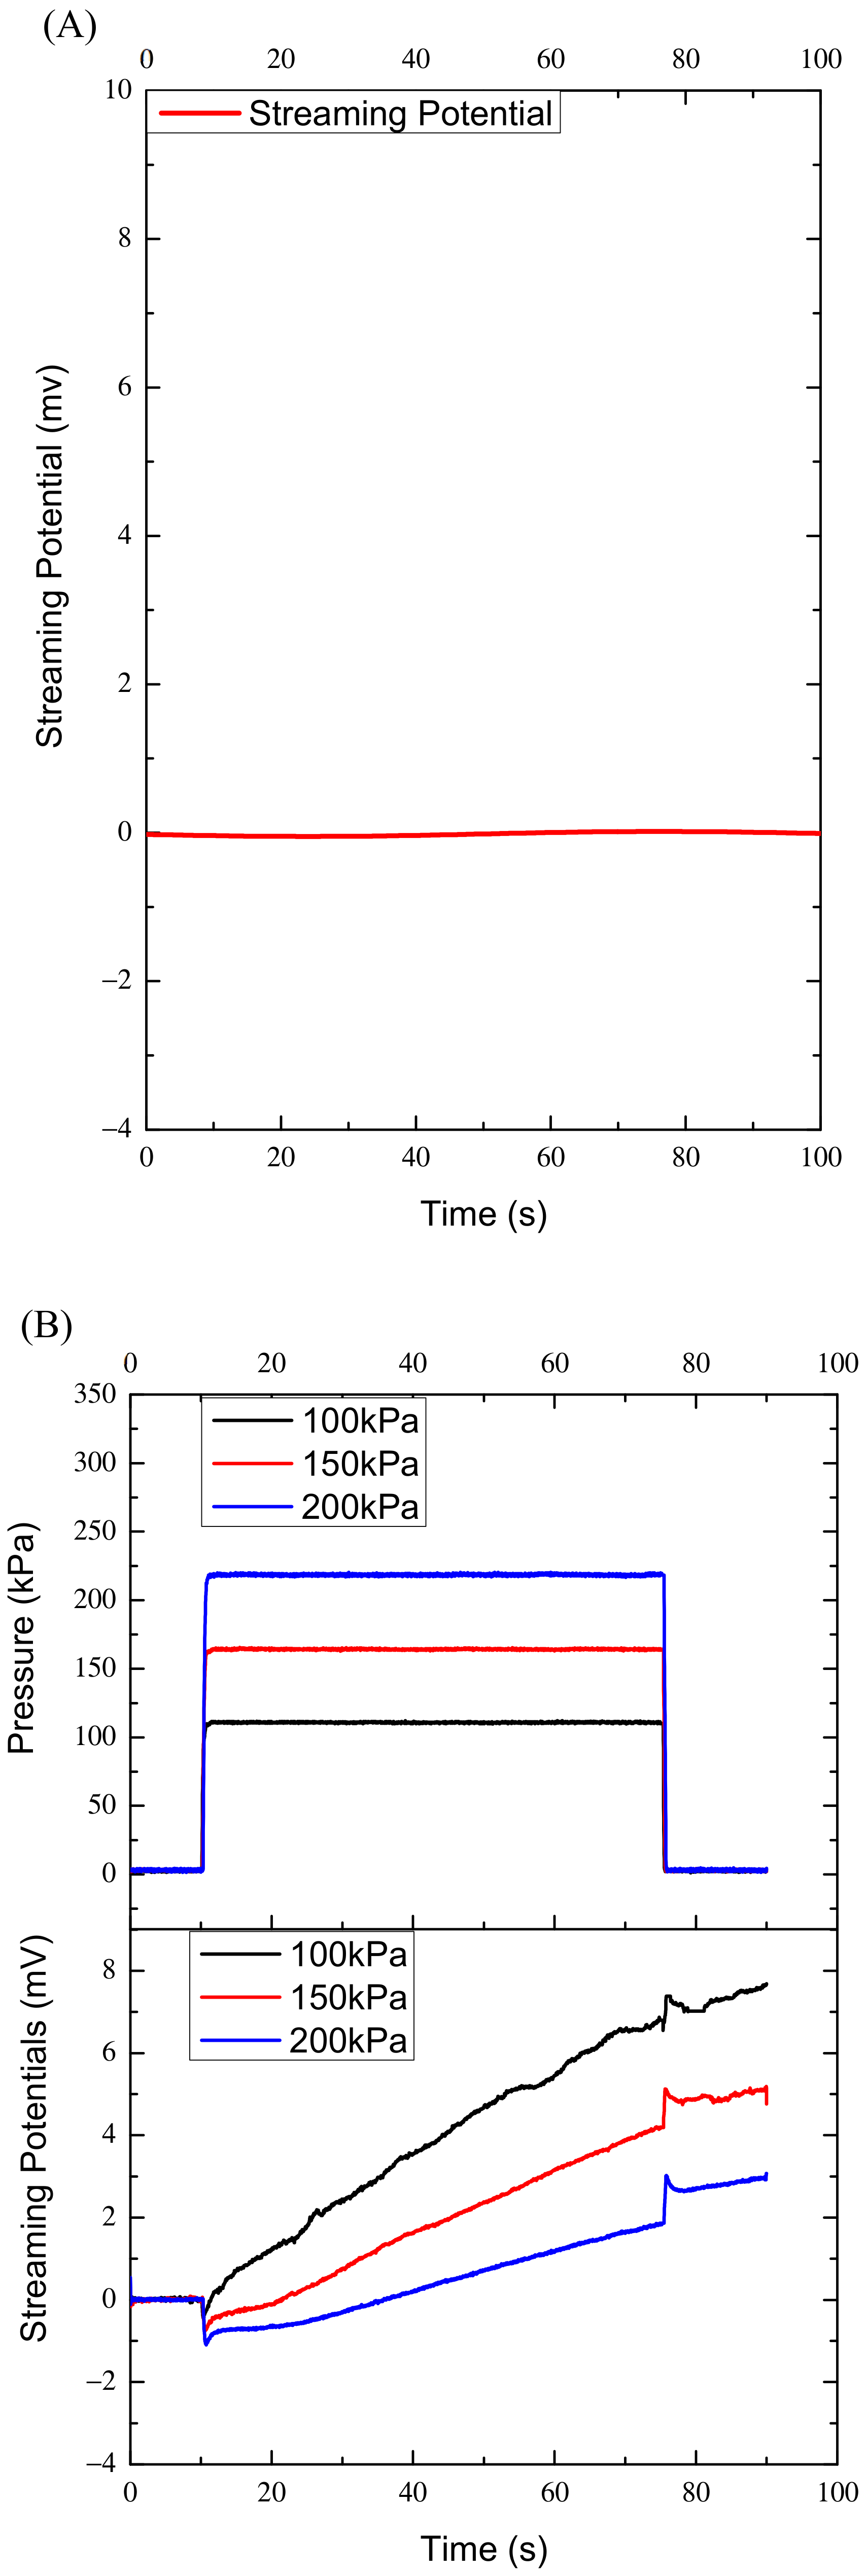
To examine whether the ambient electromagnetic field disturbs the measured data, we first measured the streaming potentials within 100 s when there was no pressure. The measured data were almost zero and the curve was nearly horizontal, as shown in
Figure 2A, which was taken as the reference point of the measurement system.
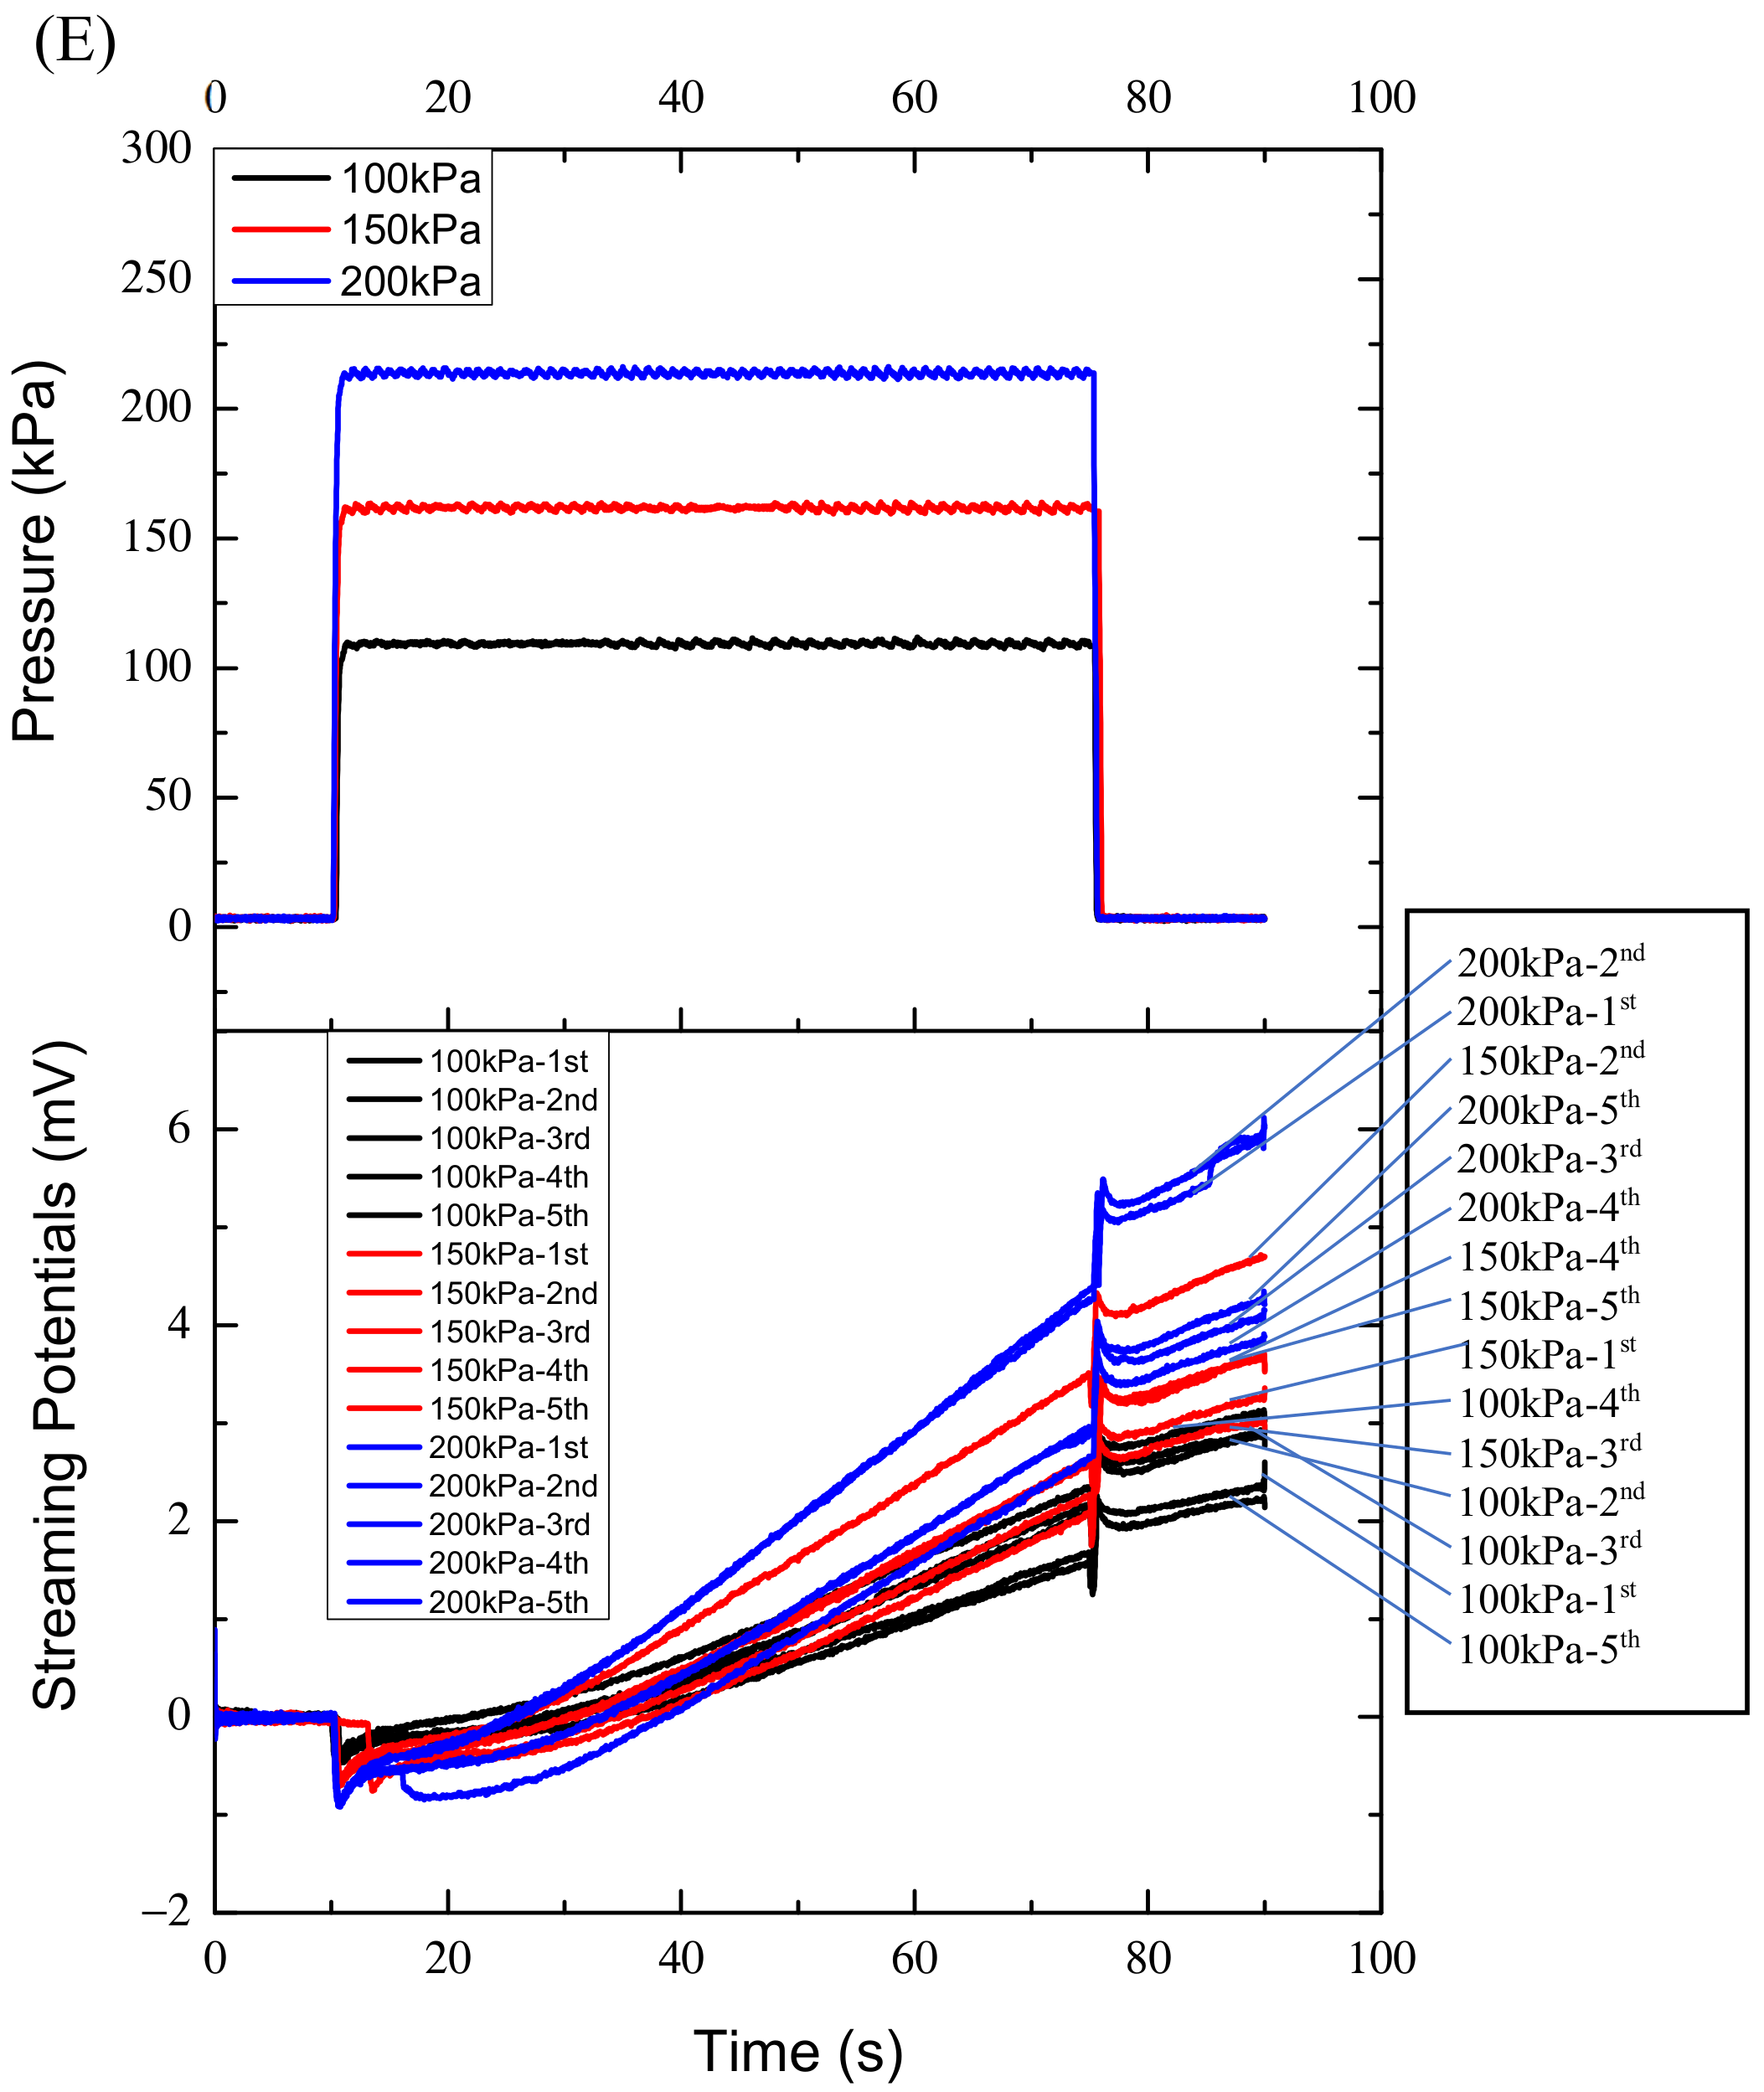
The variations of streaming potential with time were obtained under the three pressures. The curves of the streaming potential versus time of the four specimens are similar in shape. Each specimen corresponds to 15 curves. Trying to plot the fifteen curves in one figure, is rather complicated. To make the figures clear, also to provide relatively detailed results, differently numbered of curves are displayed in each figure. In
Figure 2B, the three curves of streaming potentials are the results of specimen one under the three pressers respectively, and any two curves with the same color are corresponding to each other. Each of the five curves in
Figure 2C,D are the results of specimen two and 3 under the 100 kPa and 150 kPa, respectively. In
Figure 2E the fifteen curves are the results of specimen four under the 100 kPa, 150 kPa and 200 kPa respectively. The five black curves represent the streaming potentials under the 100 kPa; the five red curves correspond to the 150 kPa and the five blue curves to the 200 kPaThe characteristics of the streaming potentials measured are that any curve of streaming potential has a negative and positive pulse corresponding to the rising and falling edges of the pressure profile respectively, and the amplitudes of the negative and positive pulse are approximately equal and proportional to the pressures applied, as shown in
Figure 3A–C. Taking specimen one as an example, in
Figure 3A, the three amplitudes of the measured streaming potential pulses are −0.472 mV, −0.806 mV and −1.118 mV corresponding to the three rising edges of pressures of 100 kPa, 150 kPa and 200 kPa respectively, and those corresponding to the three falling edges are 0.555 mV, 0.941 mV and 1.156 mV respectively (
Figure 3B).
According to Equation (1), the streaming potential is proportional to the pressure increment applied to the capillary or thin tube. However, as shown in
Figure 2, during the pressure holding period (65 s), the streaming potentials measured increased continuously instead of being constant, and the maximally increased amplitude can reach 8 mV, far greater than the maximum pulse amplitude of 1.8 mV. The variations of the potentials with time during the pressure holding process are fitted linearly. However, in the first ten seconds the curves or potentials do not increase monotonically with time, they may or may not increase or even decrease as shown in
Figure 2B–E. After that the curves increase approximately linearly. The approximate linear increases may reflect bone’s characteristics and the nonlinear variations in the first ten seconds may reflect other properties of bone, which will be discussed later. Accordingly, the data in the first ten seconds were not used for fitting.
The fitted slopes of the curves of the four specimens are plotted in
Figure 3C and the fitting correlation coefficients R
2 range from 0.98 to 0.99.
Figure 2 also shows that the potential slopes increase with the increase of the pressure applied for specimens two, three and four, while they increase with the decrease of the pressure applied for specimen one.
Previous works (such as [
13,
16,
21]) did not mention this phenomenon, because the pressure loadings they employed are either alternative or the duration of loadings being relatively short, say between 5 to 10 s.
These results seem to be interesting and may associate with the properties of bone, which should be analyzed further
4. Analysis
The change of amplitudes of the streaming potential pulse is consistent with that from other studies. Our finding is that, during the period of constant pressure, the measured streaming potential increases approximately linearly with time instead of remaining constant, as defined in Equation (1). The slopes of the streaming potential versus time of the four specimens ranged from 0.040 mV/s to 0.111 mV/s. The minimum and maximum increments of the streaming potentials measured during the 65 s were 2.6 and 7.22 respectively, which were even higher than the amplitudes of the pulses.
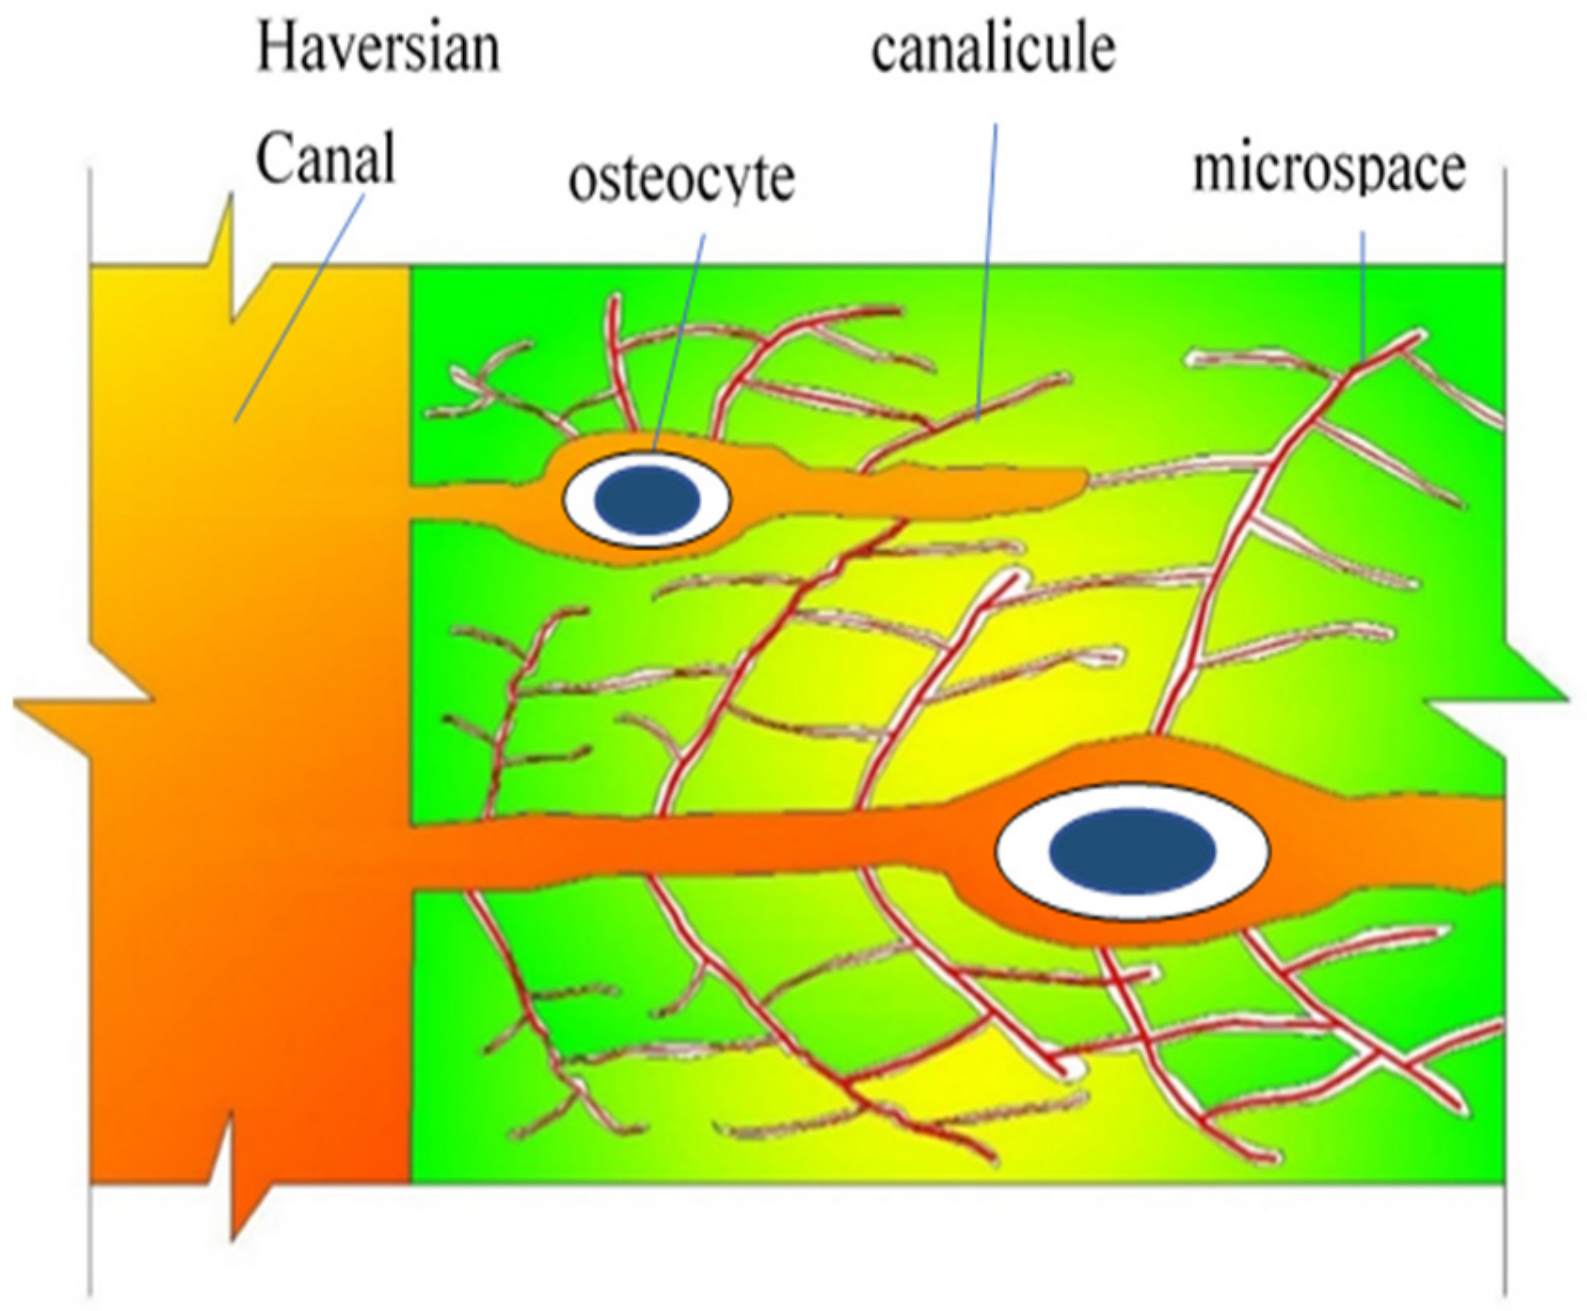
This phenomenon may be due to the special structure of cortical bone. Bone is a hierarchically structured composite of hydroxyapatite (HA) mineral reinforced by the collagen fibrils.
Figure 4 is a schematic diagram showing the microstructure of cortical bone. There are three typical porous hierarchical levels in the cortical bone [
27]. They are the collagen-HA crystal composite with micropores between the crystallites about 10 nm in order of magnitude; the layered lamellae with lacunae-canaliculi pores (with a typical diameter of 0.1 μm and length about 50 μm); and the arrangement of lamellae into cylindrical structures (osteons) with Volkmann’s canals and Haversian canals (with a typical diameter of 20–50 μm and length of 2.5–4 mm) [
28,
29]. All the microcanals and micropores are filled with bone fluid. Bone cells or osteocytes locate in lacunas.
When the fluid flows through the microcanals in bone, the streaming potentials are induced. Because a passage through which the fluid flows may consist of tortuous microcanals, even those with different diameters, the irregular configuration can lead to nonuniform distribution of the electric charges on the inner surfaces of the microcanals, which may affect the streaming potentials in bone. To explore the mechanisms for the specific characteristic observed, it is necessary to analyze streaming potentials theoretically or numerically in bone microcanals.
The classical streaming potential Formula (1) is based on a straight capillary with electric charge density on its inner surface being uniform [
16,
21,
30]. Çetin et al. [
31] obtained a solution of streaming potentials in a microcanal composed of two sections with different electric charge densities on the inner surfaces. The solution strategy they employed is to solve the two sections separately with each section corresponding to a different electric charge density.
It is noted that a model of a microcanal with a continuous distribution of electric charge density is relatively closer to the actual situation in bone. For ease of analysis and without loss of generality, the model selected is a round microcanal with equal diameter (
Figure 5). The charge densities on the inner surface of the middle section and the two side sections are
and
(
), respectively. The condition of the electric charge distribution on the inner surface of the microcanal is also expressed on bone solid. At the junction interface of any two sections, there is a sudden change in charge density, as shown in
Figure 5 (black line). In reality, the sudden changes cannot happen, because the bone matrix or solid has electric conductivity which leads the charges to shift to eliminate the sudden change on the two sides of the junction interface. That is, the charge density around the interface must change smoothly and continuously from
to
. Thus, the distribution of the charge density should be described in terms of a function of
x. A simulation function
was constructed as
where,
A,
B and
C are undetermined parameters.
The distribution curve of
(red line) is shown in
Figure 5.
is symmetrical with respect to the central section (point
) of the capillary and has three extreme points,
,
and
(
Figure 5). Let
,
and
be the coordinates of the three extreme points, respectively. If relatively small differences are selected
−
or
−
) and
−
and a relatively larger distance (
) exist between the two maximums, the
can provide a good approximation of
. Once the three differences are selected, three equations are obtained and the three parameters of
A,
B and
C can be found.
If the
−
),
−
) and
are assigned values of 0.05
, 0.025
and 0.7
l1, and when
, the
A,
B and
C are obtained as 8.0, 0.7 and 0.72 respectively. Then the specific distribution curve of the charge density in
Figure 5 has been determined.
In the classical analysis of streaming potentials in a round capillary, the potentials in the electric double layer
and the net charge density in the fluid
are the functions of radius
r of the capillary only. In the current conditions, the
and
are also functions of
x, owing to the function
. That is,
and
. Take the classical analysis approach for the streaming potentials in a round capillary [
32,
33]: The electrical potential
and the net charge density
in bone fluid are described by the Poisson–Boltzmann equation
where
no, z and
e are the ionic concentrations in the bulk bone fluid, the valence of ions and the elementary charge respectively;
ε denotes the dielectric constant of the fluid,
kB the Boltzmann constant and
T the absolute temperature.
The boundary conditions are
where
is called Zeta potential, being the value of
at the slipping plane, which refers to the plane where the fluid velocity decreases to zero.
Because the diameters of the microcanals in bone are very small relative to their lengths, it can be considered that the charge density on the solid only affects the and in fluid at the cross section with the same x-coordinate. Accordingly, x can be regard as a parameter instead of a variable, and then and become unary functions and .
Because of the electrostatic attraction of the charges on the solid surface, charges with different signs in the fluid are absorbed to the surface and form an immobile layer called the compact layer. The charges on the solid and the unlike charges in the compact layer are similar to a capacitor. One electrode is the solid surface with charge density
and the compact layer is approximately equal to the other electrode. Therefore, it can be speculated the charge density on the compact layer is proportional to
. Since the slipping plane is very close to the compact layer, we can further deduce that the zeta
is also proportional to
; that is,
, and
D is a proportional factor. Thus,
where
, corresponding to
, is a constant.
The Equations (3) and (4) with the boundary conditions (5) and (6) can be solved using the similar approach as described by Gong [
32].
The fluid flow at stead state is governed by the Navier–Stokes equation
where
is the fluid velocity along the canal axis in direction
x,
μ is the dynamic viscosity of the fluid,
Ex is the flow induced electric field along the canal, and
Ex ρe represents the flow induced electro-viscous resistance.
The boundary conditions of Equation (7) are
If the
is less than several millivolts, that is
the
. In fact, the measured data in
Figure 2 show that
is in the order of millivolts (streaming potential is the difference of
between two points along the canal). Thus, the Poisson–Boltzmann equation can be linearized as:
where
is the Debye length in the double layer [
34].
Equation (9) is a zero order Bessel equation, and with the boundary conditions (5) its solution is given by
where
I0 is the modified zero order of Bessel function. Substituting the solution (10) into Equation (4) yields
Substituting
into Equation (7), fluid velocity can be obtained by integrating Equation (7) with the boundary conditions (8)
The flowing fluid in a microcanal carries electric charges along the flowing direction, which forms the streaming current
Is as
Substituting Equation (11) into Equation (13) and integrating it yields
In addition, the electric field
produces a conduction current
Ic to the opposite direction of the streaming current, and
where
λb and
λs denote the conductivity of the bulk fluid and the solid bone respectively. At steady state, the total current
. Generally, the conductivity of fluid is far greater than that of solid bone
, and combining Equations (14) and (15) yields
The streaming potential between the two ends of the capillary is
Substituting
with Equation (6) into Equation (17), it results in
If the
, which means that
then the second term becomes zero. And in this case, according to Equation (6),
becomes
along
L or
. Thus,
which is a typical formula of streaming potential [
32] by considering the action of the electro-viscous resistance. When the radius R is large enough
approaching one, the Equation (19) leads to
the classical formula of streaming potential.
The curve in
Figure 6A shows the influence of charge density
on the streaming potentials. The horizontal coordinate represents the relative length
l1/
L and the vertical coordinate is the streaming potential. The curve illustrates that the streaming potential is approximately proportional to the length of the high charge density zone.
The characteristic of MWp is that the electric charges induced by an electric field accumulate gradually on the inner pore surfaces and the interfaces between the different constituents, such as collagens and hydroxyapatite in bone. The multicomponent materials and hierarchical microporous structure of bone may lead to the rate of MWp being much less than those of the general ionic displacement and dipole orientation polarizations. The polarization time of MWp ranges from 10
−1 s to several hours [
36,
37], while ionic displacement and dipole orientation polarizations last less than milliseconds [
38]. The electrical conductivities of bone collagens and hydroxyapatite crystals are in different orders of magnitude [
39] and the hierarchical structure of bone are the conditions of MWp [
36,
37]. On the one hand, the electric charges on the bone solid cause electric double layers in bone microcanals; on the other hand, the charges form nonuniform electric fields inside bone. When bone fluid flows through the microcanals, the electric charges carried by the fluid can accumulate at the canal’s turns, branches and sharp tapers where the electric field densities are relatively strong and the accumulations occur gradually like the MWp in bone.
From the above analysis, a conclusion can be reached that the linear variations of the measured streaming potentials under constant fluid pressure are caused by the local accumulation of electric charges carried by the fluid, and Equation (18) can describe the action of the charges. The streaming potential pulse amplitudes plotted in
Figure 3 represent the typical streaming potential features in bone, and they are consistent with those in literature [
16,
21,
28].
Of course, the electric charges’ accumulation and distribution are complex, for positive and negative charges can accumulate at different locations in bone. The accumulations depend on the bone’s microstructure, components and electric charge distributions in bone, which may possibly include the piezoelectric charges induced by the stresses in bone. Further, the fluid flow states in the microcanals are also a significant factor to affect the charge accumulation.
Another property of bone may also be related to the streaming potentials. That is the spontaneous polarization of bone [
40,
41], which explains that bone can be polarized without any external action. The spontaneous polarization causes a nonuniform distribution of electric charge in bone.
In the micropore’s inner surfaces contacting the fluid, some areas have positive electric charge density and others have negative charge density, and the two types of areas are not necessarily equal to each other. The difference of the two densities may be associated with the slopes of streaming potentials. If the positive density can increase the slopes, the negative density can decrease the slopes, and can even change the direction of the slopes. This may explain the negative slopes of specimen one and specimen four, for which the pressure dependences of the slopes are uncertain.
Figure 2E shows intuitively that the slopes of some curves (red) corresponding to 150 kPa are even less than those (black) corresponding to 100 kPa, though the slopes may increase with the increase of the pressures statistically.
The charge accumulation may also affect the streaming potential during the first ten seconds of the pressure holding period. Before the pressure is applied, the electric charge accumulation is in equilibrium. When the pressure is applied, the charges in fluid begin to move and can balance the unlike charges on the surfaces of bone. This process is equivalent to decreasing the charge densities on the surfaces and also reduces the increase of the streaming potentials for which the leading potential curves become flat.
After a moment (such as ten seconds), more and more unlike charges are induced from the bone bulk by the moving charges, which is equivalent to charge accumulation. Then the slopes become increased, as shown in
Figure 2.
Based on the above analysis, we can see that, even the steady fluid flow in bone, it can induce non-steady streaming potentials and the potentials may increase with time in some locations. In other words, the steady fluid flow in bone can cause the streaming potentials to change with time and the amplitude changes with time may be greater than the classical values calculated by Equation (1) or (19).
From Equation (1) and taking the parameter values used in the experiment shown in
Table 1, the streaming potential
is found to be 2.3 mV, a value of the same order of magnitude as presented in
Figure 2. Equation (19) describes the relationship of streaming potentials and the microcanal radius. A plot of normalized streaming potentials versus radius is illustrated in
Figure 6B.
The curve in
Figure 6B shows that when the radius R of the microcanal is beyond 20 nm, the streaming potential approaches
calculated from Equation (1). In fact when R = 20 nm, the ratio of the two Bessel functions
I2(
kR)/
I0(
kR) = 0.922, which means that the electro-viscous resistances described by the Bessel functions in Equation (19) can only play minor roles. Thus, the streaming potentials in the canaliculi, lacunas, Haversian and Volkmann’s canals are usually not affected by the electro-viscous resistance in the fluid.


