Article

A Reversed-Phase HPLC Method for Determination of Osteopontin in Infant Formula

Department of Chemical and Materials Engineering, University of Auckland, Private Bag 92019, Auckland 1142, New Zealand
*
Author to whom correspondence should be addressed.
Appl. Sci. 2019, 9(18), 3711; https://doi.org/10.3390/app9183711
Submission received: 9 August 2019 / Revised: 29 August 2019 / Accepted: 2 September 2019 / Published: 6 September 2019
(This article belongs to the Section Chemical and Molecular Sciences)

Abstract

:

Feature Application

The reversed-phase high-performance liquid chromatography (RP-HPLC) method developed in this study has potential applications in the food and dairy industry for routine analysis of osteopontin (OPN).

Abstract

Osteopontin (OPN) is a multifunctional whey protein which has recently received much attention for possibly applications in fortifying infant milk formula (IMF) with its bioactivity. However, to date, there is no established high-performance liquid chromatography (HPLC) method to quantify this protein in milk or IMF. In this study, a rapid, simple, isocratic and reliable reversed-phase HPLC method was developed and validated to quantify the OPN in IMF. A C18 column (4.6 × 150 mm × 5 micron) was employed with 20% of 0.1% trifluoroacetic acid (TFA) and 80% of 60% acetonitrile in 0.1% TFA for 10 min detected at 214 nm. The flow rate was 0.3 mL/min with an injection volume of 10 µL. The column temperature was 40 °C, and the peak appeared after 4 min. The validation was based on the system suitability, linearity (r2 = 0.999), limit of detection (LOD) (0.14 mg/L), limit of quantitation (LOQ) (0.41 mg/L), precision (% relative standard deviation (RSD) < 0.2), recovery (% RSD < 3) and robustness. The results confirm that the method developed is suitable for OPN determination in IMF.

1. Introduction

Osteopontin (OPN) is a highly phosphorylated acidic glycoprotein and composed of ~300 amino acid residues [1]. Schack et al. [2] reported that it is present in human milk (138 mg/L) at levels much higher than in both infant formula (~9 mg/L) and bovine milk (~18 mg/L). It is a multifunctional whey protein with various biological, physiological and pathophysiological activities [3,4]. OPN also facilitates functions of lactoferrin, another bioactive protein [5]. Therefore, recently, OPN is being considered as a potential candidate protein to fortify infant milk formula (IMF), having proven benefits after clinical trials [3]. OPN is extracted commercially from bovine milk using ion-exchange chromatography with quality sufficient to add into food products [6].
OPN can be measured by enzyme-linked immunosorbent assay (ELISA); however, the method is very sensitive, time-consuming and costly. Although ELISA is a well-established method; in industrial contexts, continually improved high-performance liquid chromatography (HPLC) is preferred and adopted due to its better specificity, range of analytes, speed, throughput and multiplexing capacities resulting in reduced sample size and low cost per test [7,8]. Moreover, HPLC instruments are commonly available in any testing facility. Therefore, an easy and cost-effective method is required to determine OPN content for routine use in food and dairy industry. In particular, reversed-phase high-performance liquid chromatography (RP-HPLC) is a common analytical method that has been widely used. Previously, liquid chromatography and mass spectrometry were applied to measure human OPN only as a biomarker [9], for identification and characterization of bovine OPN fragments [10,11] and to separate N- and C-terminal in investigating the binding of human OPN to integrin [12,13] as summarized in Table 1 (Section 3.1). However, there is no RP-HPLC method available in the literature to measure bovine OPN quantitatively, which has led us to perform this investigation.
The aim of this work was to develop and validate a liquid chromatographic method to determine OPN content in IMF.

2. Materials and Methods

2.1. Preparation of OPN Standard

Bovine OPN standard was purchased from Sigma-Aldrich (Saint Louis, MO, USA) to prepare a standard stock solution of 5 mg/L in 40% acetonitrile (ACN) in 0.1% trifluoroacetic acid (TFA) to confirm the miscibility of the standard. Further, a serial dilution was followed to prepare 0.6125, 1.25, 2.5 and 5 mg/L OPN solution. Moreover, an OPN solution of 1 mg/mL was also prepared to study the precision, accuracy and robustness of the method. HPLC-grade ACN (≥99.9%), purchased from Sigma-Aldrich (CAS 75-05-8, Castle Hill, Australia), and Milli-Q water were used to prepare the solutions.

2.2. Preparation of IMF and IMF Spiked with OPN

Powdered IMF (stage 1 with 1.4 g protein/100 mL) was reconstituted into cooled-boiled milli-Q water as per the instructions of the manufacturer. Defatted IMF was obtained after centrifugation (9000 g at 4 °C for 15 min) followed by acidification (pH 4.6) using 8 M acetic acid. The samples were centrifuged again (under the same conditions) to collect the whey portion as supernatant. The pH of the supernatant was then readjusted to 6.8 using 3 M NaOH. This IMF supernatant (1 mL) was further spiked with 1 mL of OPN standards (1.25, 2.5 and 5 mg/L) to study the accuracy of the RP-HPLC method (Section 2.4.5).

2.3. Instrumental and Chromatographic Conditions

The chromatographic analysis was performed using a Shimadzu HPLC system (Kyoto, Japan). The system consisted of an in-line vacuum degasser DGU-20A5, quaternary delivery pump LC-20AT, an ultraviolet detector SPD-20A, an autosampler SIL-20A and a column oven CTO-20AC. The software (LabSolutions) associated with the system was used for data collection. In this work, 0.1% TFA was used as a mobile phase A, while a number of options were considered for the selection of the mobile phase B (hydrophobic stationary phase). For instance, different concentrations (40–90%) of ACN in 0.1% (v/v) TFA and 75% (v/v) 2-propanol in 0.1% (v/v) TFA were investigated to select a suitable mobile phase B. The HPLC system was operated isocratically, with a flow rate of 0.3 mL/min and the column temperature at 40 °C. The injection volume was 10 µL and a ZORBAX Eclipse C18 column (Agilent, Santa Clara, CA, USA; 4.6 × 100 mm × 5 micron) was used. The absorbance was read at 214 nm.

2.4. Method Validation

The validation of the method was performed as guided by the International Council for Harmonisation of Technical Requirements for Pharmaceuticals for Human Use [14], Association of Official Analytical Chemists (AOAC) International, USA [15] and Food and Drug Administration, USA [16].

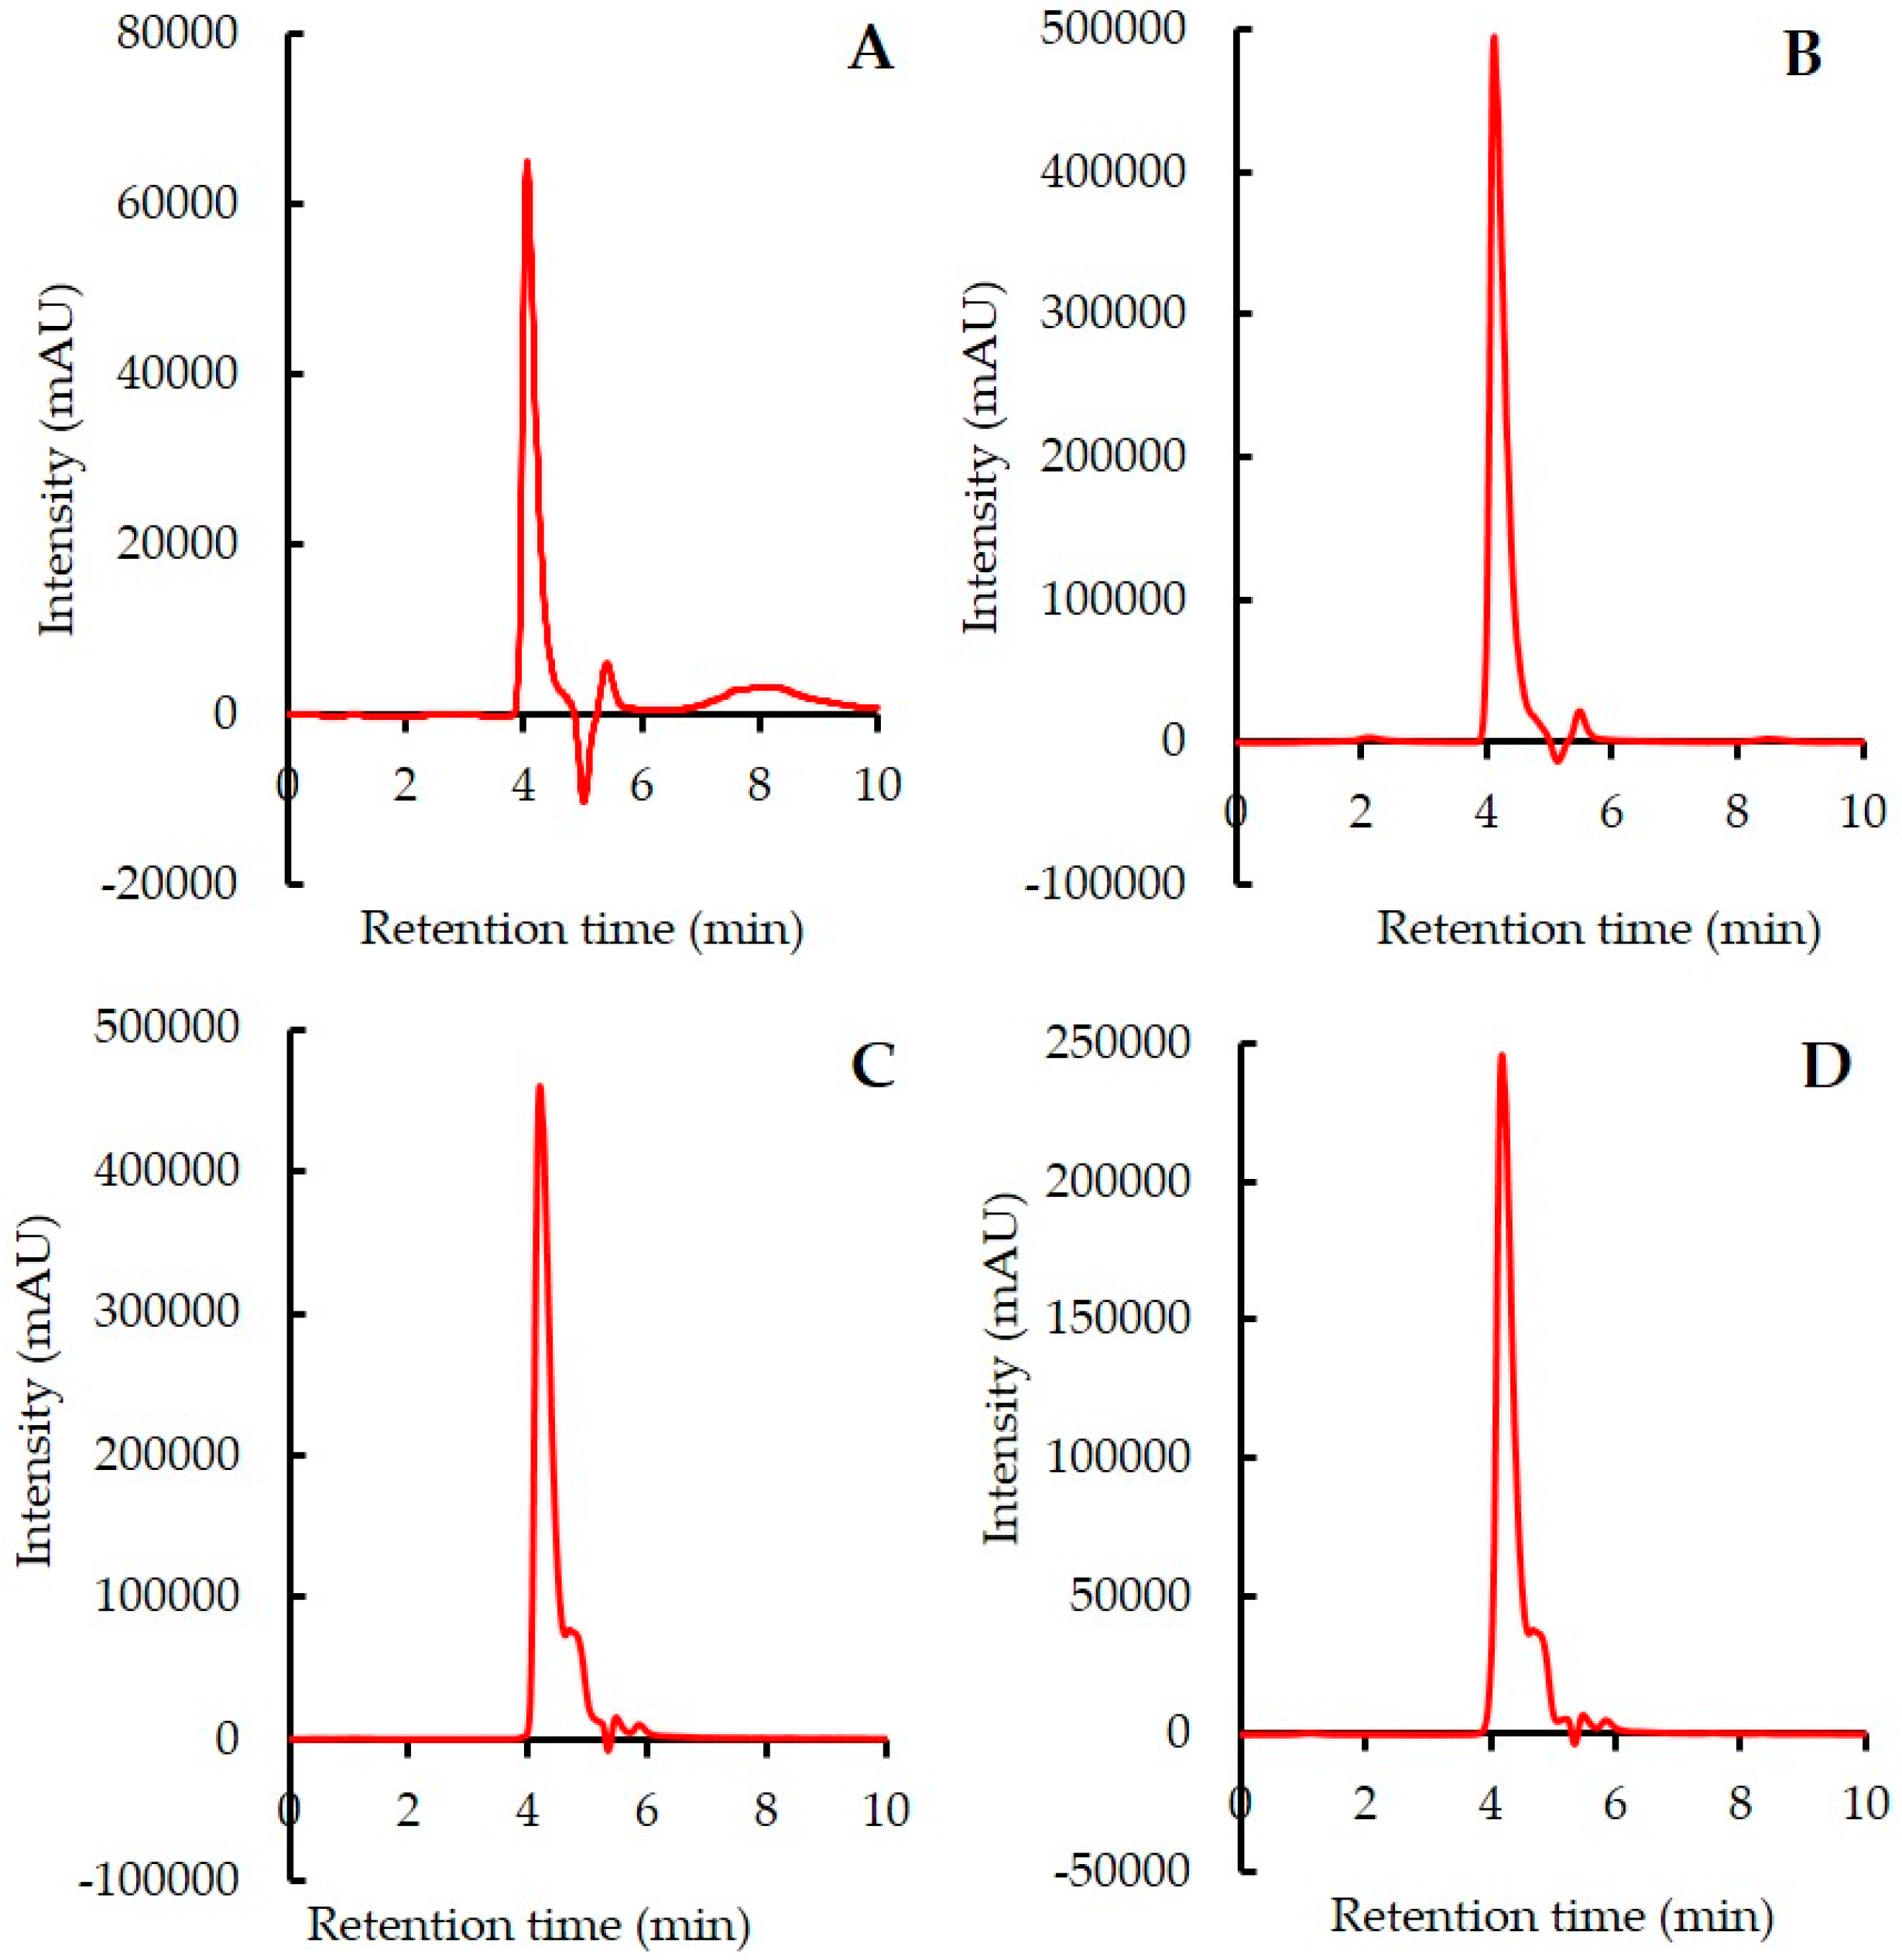
2.4.1. System Suitability (Specificity)
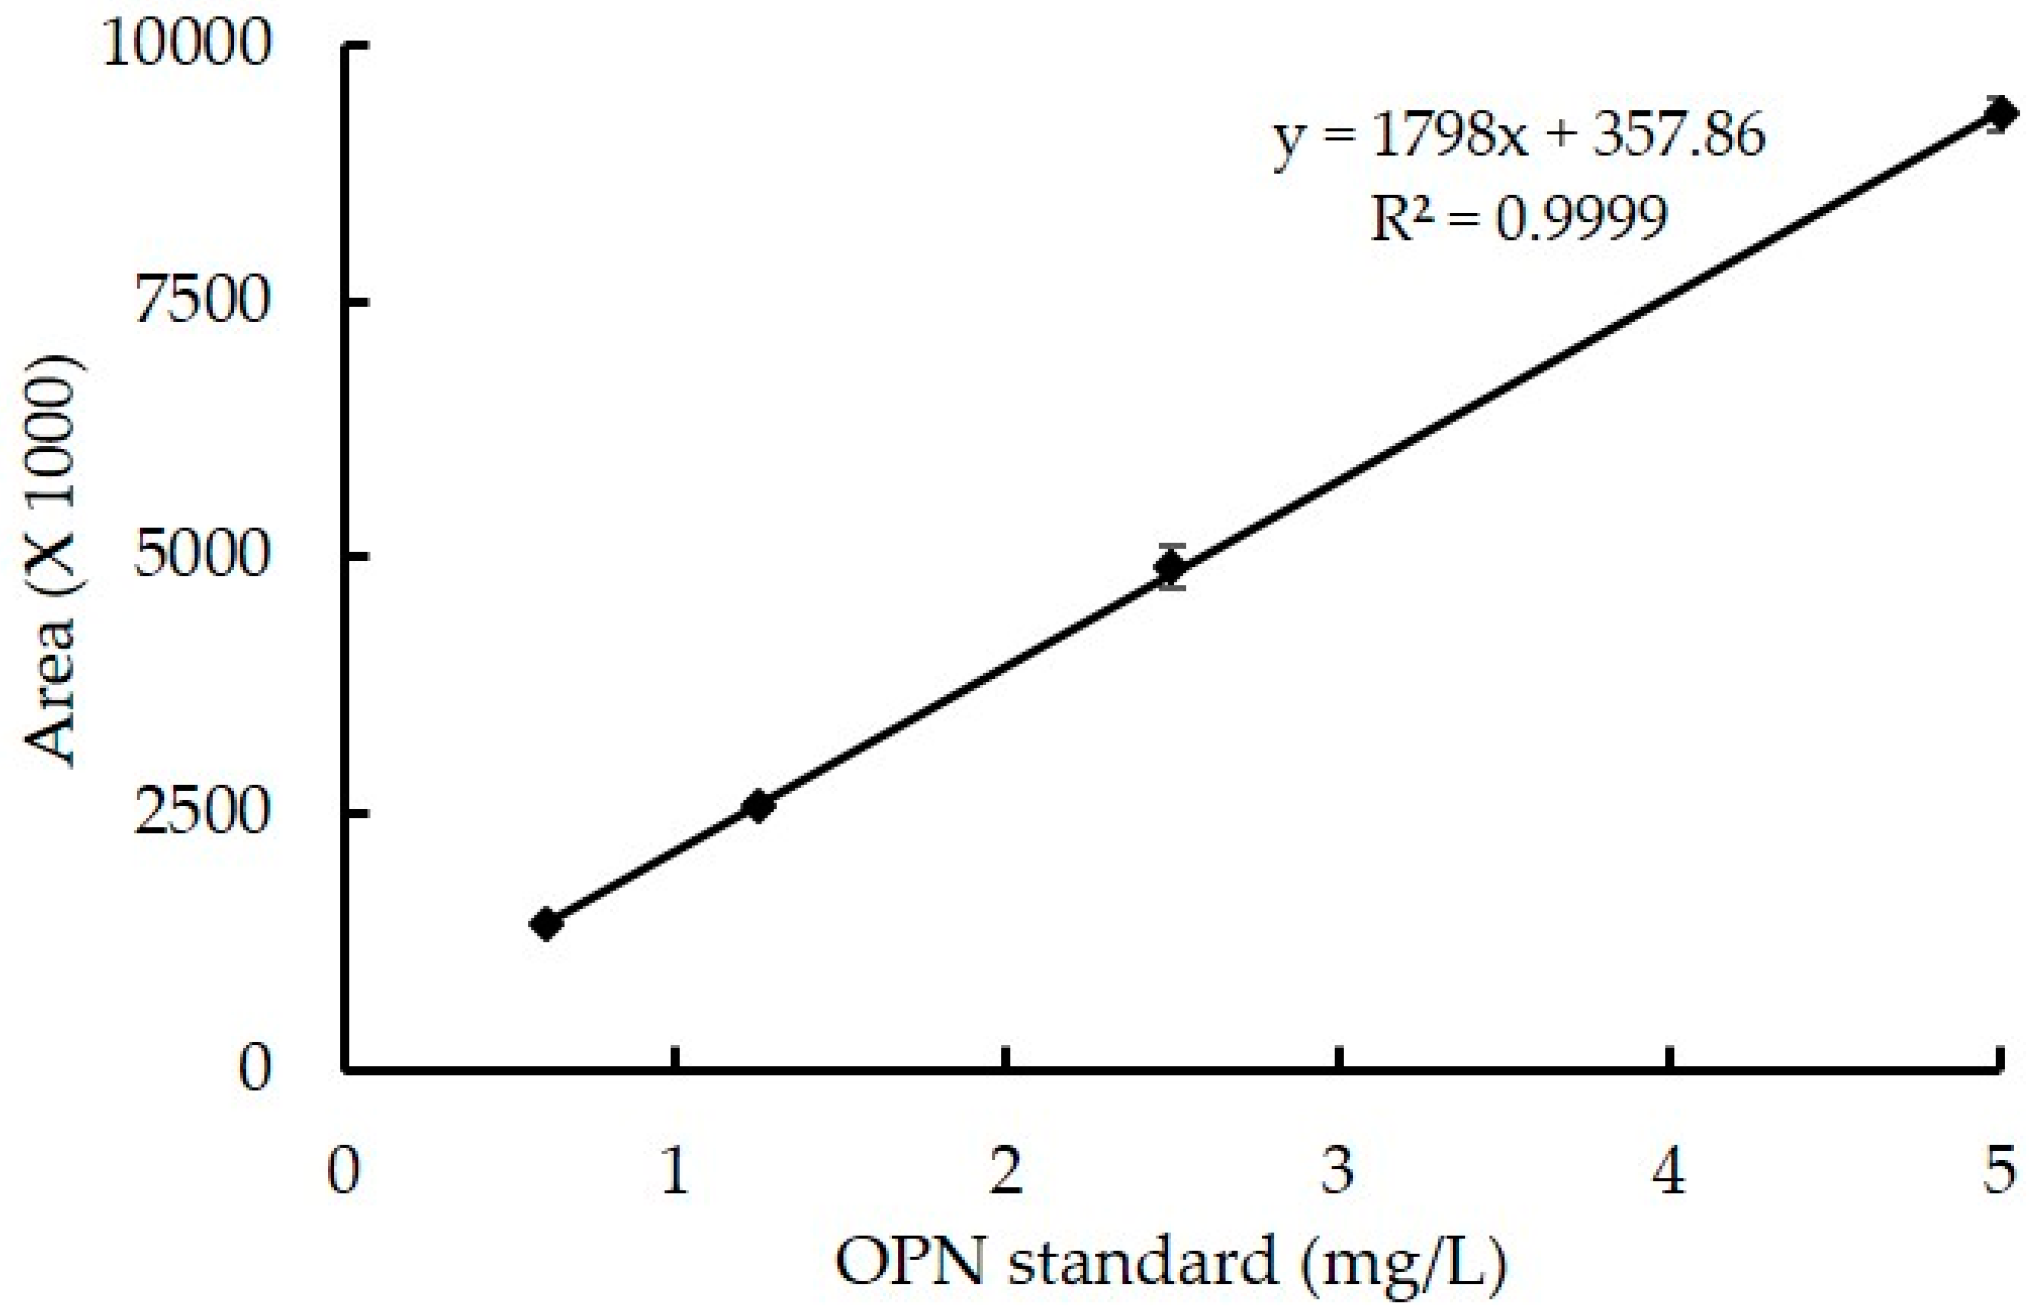
System suitability is an integral part of an analytical procedure which specifies the optimum operation of the system. It was assessed by comparing the retention times obtained from 10 replicates of 1 mg/L OPN standard.

2.4.2. Linearity

A calibration curve was constructed as concentration vs. peak area obtained from OPN standards (Section 2.1). The linearity was determined by linear regression analysis.

2.4.3. Detection of Limit (Sensitivity)

Limit of detection (LOD) and limit of quantitation (LOQ) were measured based on the signal-to-noise ratio using the following Equations
L O D = 3.3 × σ / S
L O Q = 10 × σ / S
where σ is the standard deviation (SD) of the intercept and S is the slope of the calibration curve.

2.4.4. Precision (Repeatability)

The intra-day precision (repeatability) was studied on 10 injections of an OPN sample (1 mg/L) on the same day and expressed as % relative standard deviation (RSD) of retention time. Similarly, the inter-day precision was also measured in two different days (intermediate precision). However, the inter-laboratory precision was beyond the scope of this work.

2.4.5. Accuracy (Recovery)

Accuracy (recovery) was measured as the percentage of OPN recovered after spiking IMF with known concentration of OPN standards (1.25, 2.5 and 5 mg/L) using Equation (3) as suggested by Chen et al. [17]. The analysis was performed in duplicate.
Recovery   ( % ) = Calculated   concentration Theoriticial   concnetration × 100

2.4.6. Method Robustness

OPN solution of 1 mg/mL was analysed 10 times under the established conditions with deliberate variations in column temperature and flow rate, one at a time. The retention time due to those variations were subjected to ANOVA to measure the robustness of the method.

3. Results and Discussion

3.1. Development of RP-HPLC Method

To develop the RP-HPLC method, previous studies on the determination of OPN using HPLC were compared and summarized in Table 1, along with the parameters followed in this study. A proper wavelength was selected and followed (214 nm), where OPN showed the maximum absorbance. The contributing effect of solvent was also checked on the absorbance maxima of OPN. The mobile phase conditions were optimized to achieve the best and quickest separation. In this work, 0.1% TFA was used as mobile phase A and several phase systems were tried for mobile phase B (Section 2.3). We found that 60% ACN in 0.1% TFA performed better than others and the peaks appeared immediately after 4 min in a total of 10 min, which is faster than previous studies reported in the literature (Figure 1). The higher polarity index of ACN (5.8) compared to 2-propanol (4.0) might be the reason of the better performance of ACN [18]. Moreover, the isocratic operation of HPLC was performed using 20% of mobile phase A and 80% of mobile phase B, together with other parameters provided in Table 1 (column 6).

3.2. Method Validation

3.2.1. System Suitability

The system suitability was investigated by comparing the retention times after injecting 1 mg/L OPN for 10 times (Table 2). The low value of % RSD (<1) indicates the suitability of this method.

3.2.2. Linearity, LOD and LOQ

A linear correlation was observed between the concentration of OPN standards and their peak areas obtained following this method. The calibration curve (Figure 2) suggests high level of correlation coefficient ( r 2 = 0.9999 ) in a range of 0.625 to 5 mg/L OPN attesting the linearity of the method. Moreover, as a constitutive element of HPLC method validation, the LOD and LOQ were calculated following Section 2.4.3 and found as 0.14 and 0.41 mg/L respectively, indicating high sensitivity of this method.

3.2.3. Precision and Accuracy

The precision was evaluated from the retention times after injecting a homogenous sample (1 mg/L) for 10 times [16]. The precision under repeated conditions on the same day (intra-day; repeatability) and on a different day (inter-day; intermediate precision) was measured and reported in Table 2. The precision RSD for both intra-day (0.161%) and inter-day (0.148%) variations were <1% which further assures the validity of this method [19,20].
The accuracy refers to the closeness of the measured value to the actual value for the sample. In this work, accuracy was evaluated on the basis of percentage recovery of OPN after spiking IMF with low, medium and high levels of OPN, and the results are summarized in Table 3. The results show the accuracy of the method within the recovery range of 99–102% (with RSDs less than 3%), which fits within the generally accepted range of 95–105% and therefore could be considered as high level of accuracy [16,17,19,20]. However, there is no distinct and official benchmark for percentage recovery to be achieved in a quantitative analysis. The AOAC guidelines suggest that the lower the concentration of analyte in the sample, the bigger the tolerance [13]. The guidelines further indicate the recovery rate as 92–105%, 90–108% and 85–110% for analyte at concentrations of 1, 0.1 and 0.01%, respectively. The recovery rate (99–102%) obtained in this study (Table 3) therefore was in agreement with the AOAC guidelines.

3.2.4. Robustness

The robustness of an analytical method indicates the ability to produce unbiased results, that is, remain unaffected due to small and deliberate but univariate changes in operating parameters. Accordingly, in this newly developed method the robustness was measured as described in Section 2.4.6. It was observed that a slight change in column temperature did not affect the chromatograph performance significantly ( p > 0.05 ), whereas a reduced flow rate led to a significant variation ( p < 0.05 ) in retention time (Table S1; supplementary material). This observation suggests that the flow rate is crucial and needs to be maintained at 0.3 mL/min to achieve consistent and reliable results following this method. Moreover, the developed method was also performed at room temperature (20 °C) where we observed poor elution, resulting in unreliable chromatograms (Figure S2; supplementary material). This further indicates that operating the developed method at 40 °C is a requirement which needs to be followed, since high temperature decreases the viscosity of the mobile phase and increases the diffusivity of analytes, contributing to an increased mass transfer which provides enhanced column efficiency [21].

3.2.5. Future Recommendation

Although employed in this study, further research is needed to replace the toxic ACN with green solvents as a mobile phase in HPLC. The green analysis is gathering interest in different fields, including dairy production. Nevertheless, still, most HPLC analyses use flammable, volatile, toxic and non-degradable solvents, like ACN. The inherent toxicity of ACN and its waste disposal issue raised a big concern, and therefore the analytical community has recommended exploring alternatives to replace polluting solvents with cleaner ones [22,23]. In this regard, some researchers suggested using commonly accepted green solvents in RP-HPLC, which include acetone, ethanol, isopropanol, and ethyl acetate, along with other various aqueous mobile phases [22,24,25,26].

4. Conclusions

The method developed in this work is a simple, isocratic, rapid, accurate, linear and robust way to quantify OPN in IMF. This is the first RP-HPLC method developed and validated to measure OPN, and has great potential to be applied in the food and dairy industries for routine analysis. Furthermore, the findings in this work will help to further understanding of the denaturation kinetics of OPN.

Supplementary Materials

The following are available online at https://www.mdpi.com/2076-3417/9/18/3711/s1, Figure S1: Chromatogram of OPN from RP-HPLC analysis: 1) OPN standard 0.625 mg/L, 2) OPN standard 1.25 mg/L, 3) OPN standard 2.5 mg/L, 4) OPN standard 5 mg/L, 5) IMF only and 6) IMF spiked with 5 mg/L OPN standard, Figure S2: Chromatogram of OPN (5 mg/L) in triplicate obtained from RP-HPLC analysis maintaining column temperature at 20 °C, Table S1: Robustness of RP-HPLC method after changing column temperature and flow rate, one at a time.

Author Contributions

M.A.W. conceived, developed and validated the experiments and drafted the manuscript. M.F. reviewed, edited and supervised the overall study.

Funding

This work was supported by Food and Health Programme, University of Auckland, New Zealand (project no. 3718098).

Acknowledgments

Preliminary works of this study were performed by Joyce Wang. The assistance of Matthew Sidford and Peter Martin with HPLC operation is gratefully appreciated.

Conflicts of Interest

The authors declare no conflicts of interest.

References

  1. Sodek, J.; Ganss, B.; McKee, M.D. Osteopontin. Crit. Rev. Oral Biol. Med. 2000, 11, 279–303. [Google Scholar] [CrossRef] [PubMed]
  2. Schack, L.; Lange, A.; Kelsen, J.; Agnholt, J.; Christensen, B.; Petersen, T.; Sørensen, E. Considerable variation in the concentration of osteopontin in human milk, bovine milk, and infant formulas. J. Dairy Sci. 2009, 92, 5378–5385. [Google Scholar] [CrossRef] [PubMed]
  3. Demmelmair, H.; Prell, C.; Timby, N.; Lönnerdal, B. Benefits of Lactoferrin, Osteopontin and Milk Fat Globule Membranes for Infants. Nutrients 2017, 9, 817. [Google Scholar] [CrossRef] [PubMed]
  4. Lönnerdal, B. Bioactive Proteins in Human Milk: Health, Nutrition, and Implications for Infant Formulas. J. Pediatr. 2016, 173, S4–S9. [Google Scholar] [CrossRef] [PubMed] [Green Version]
  5. Azuma, N.; Maeta, A.; Fukuchi, K.; Kanno, C. A rapid method for purifying osteopontin from bovine milk and interaction between osteopontin and other milk proteins. Int. Dairy J. 2006, 16, 370–378. [Google Scholar] [CrossRef]
  6. Christensen, B.; Sørensen, E.S. Structure, function and nutritional potential of milk osteopontin. Int. Dairy J. 2016, 57, 1–6. [Google Scholar] [CrossRef] [Green Version]
  7. Cross, T.G.; Hornshaw, M.P. Can LC and LC-MS ever replace immunoassays? J. Appl. Bioanal. 2016, 2, 108–116. [Google Scholar] [CrossRef]
  8. Laskowska, E.; Kuczyńska-Wiśnik, D.; Lipińska, B. Proteomic analysis of protein homeostasis and aggregation. J. Proteom. 2019, 198, 98–112. [Google Scholar] [CrossRef]
  9. Faria, M. Quantitative Mass Spectrometric Investigations of Protein Biomarkers: Serum Thymidine Kinase 1 and Human Osteopontin. 2014. Available online: https://scholarscompass.vcu.edu/cgi/viewcontent.cgi?referer=https://scholar.google.co.nz/&httpsredir=1&article=4602&context=etd (accessed on 1 August 2019).
  10. Bordin, G.; Raposo, F.C.; De La Calle, B.; Rodriguez, A. Identification and quantification of major bovine milk proteins by liquid chromatography. J. Chromatogr. A 2001, 928, 63–76. [Google Scholar] [CrossRef]
  11. Tacoma, R.; Fields, J.; Ebenstein, D.B.; Lam, Y.-W.; Greenwood, S.L. Characterization of the bovine milk proteome in early-lactation Holstein and Jersey breeds of dairy cows. J. Proteom. 2016, 130, 200–210. [Google Scholar] [CrossRef]
  12. Christensen, B.; Sørensen, E. Osteopontin is highly susceptible to cleavage in bovine milk and the proteolytic fragments bind the αVβ3-integrin receptor. J. Dairy Sci. 2014, 97, 136–146. [Google Scholar] [CrossRef] [PubMed]
  13. Kläning, E.; Christensen, B.; Bajic, G.; Hoffmann, S.V.; Jones, N.C.; Callesen, M.M.; Andersen, G.R.; Sørensen, E.S.; Vorup-Jensen, T. Multiple low-affinity interactions support binding of human osteopontin to integrin αXβ2. Biochim. Biophys. Acta Proteins Proteom. 2015, 1854, 930–938. [Google Scholar] [CrossRef] [PubMed]
  14. International Council for Harmonisation of Technical Requirements for Pharmaceuticals for Human Use (ICH). Validation of Analytical Procedures: Text and Methodology Q2(R1). In Proceedings of the International Conference on Harmonization, Geneva, Switzerland, 24–28 Octobers 2005; pp. 11–12. Available online: https://www.ich.org/fileadmin/Public_Web_Site/ICH_Products/Guidelines/Quality/Q2_R1/Step4/Q2_R1__Guideline.pdf (accessed on 1 August 2019).
  15. Association of Analytical Communities (AOAC International). Guidelines for Single Laboratory Validation of Chemical Methods for Dietary Supplements and Botanicals. 2002. Available online: https://www.aoac.org/aoac_prod_imis/AOAC_Docs/StandardsDevelopment/SLV_Guidelines_Dietary_Supplements.pdf (accessed on 1 August 2019).
  16. Food and Drug Administration, US. (FDA). Guidance for Industry: Analytical Procedures and Methods Validation for Drugs and Biologics. 2015. Available online: https://www.fda.gov/media/87801/download (accessed on 1 August 2019).
  17. Chen, Z.G.; Buchanan, P.; Quek, S.Y. Development and validation of an HPLC-DAD-MS method for determination of four nucleoside compounds in the New Zealand native mushroom Hericium sp. Food Chem. 2019, 278, 729–737. [Google Scholar] [CrossRef] [PubMed]
  18. Taylor, K.D.A.; Ozogul, F.; Quantick, P.C.; Ozogul, Y. A rapid HPLC-determination of ATP-related compounds and its application to herring stored under modified atmosphere. Int. J. Food Sci. Technol. 2000, 35, 549–554. [Google Scholar]
  19. Green, J.M. Peer Reviewed: A Practical Guide to Analytical Method Validation. Anal. Chem. 1996, 68, 305A–309A. [Google Scholar] [CrossRef]
  20. Thompson, M.; Wood, R. Harmonized guidelines for internal quality control in analytical chemistry laboratories (Technical Report). Pure Appl. Chem. 1995, 67, 649–666. [Google Scholar] [CrossRef]
  21. Greibrokk, T.; Andersen, T. High-temperature liquid chromatography. J. Chromatogr. A 2003, 1000, 743–755. [Google Scholar] [CrossRef]
  22. Ibrahim, F.A.; Elmansi, H.; Fathy, M.E. Green RP-HPLC method for simultaneous determination of moxifloxacin combinations: Investigation of the greenness for the proposed method. Microchem. J. 2019, 148, 151–161. [Google Scholar] [CrossRef]
  23. Yabré, M.; Ferey, L.; Somé, I.T.; Gaudin, K. Greening Reversed-Phase Liquid Chromatography Methods Using Alternative Solvents for Pharmaceutical Analysis. Molecules 2018, 23, 1065. [Google Scholar] [CrossRef]
  24. Micăle, F.; Albu, F.; Iorgulescu, E.-E.; Medvedovici, A.; Tache, F. Ethyl Lactate as a Greener Alternative to Acetonitrile in RPLC: A Realistic Appraisal. J. Chromatogr. Sci. 2015, 53, 1701–1707. [Google Scholar] [CrossRef]
  25. Van Beek, T.A.; Shen, Y.; Chen, B. Alternative solvents can make preparative liquid chromatography greener. Green Chem. 2015, 17, 4073–4081. [Google Scholar]
  26. Tobiszewski, M.; Namieśnik, J. Greener organic solvents in analytical chemistry. Curr. Opin. Green Sustain. Chem. 2017, 5, 1–4. [Google Scholar] [CrossRef]
Figure 1. Chromatogram of osteopontin (OPN): (A) 0.625 mg/L, (B) 5 mg/L, (C) infant milk formula (IMF) and (D) IMF spiked with 5mg/L OPN. Chromatographic conditions: C18 column (4.6 × 100 mm × 5 micron), injection volume 10 µL, flow rate 0.3 mL/min, column temperature 40 °C and detection at 214 nm. Chromatograms from high-performance liquid chromatography (HPLC) are provided in supplementary material (Figure S1).
Applsci 09 03711 g001
Figure 2. Calibration curve obtained from OPN standards following the method developed in this study. Error bars represent the standard deviation of duplicates.
Applsci 09 03711 g002
Table 1. Comparison of high-performance liquid chromatography (HPLC) parameters with previous studies. TFA, trifluoroacetic acid; ACN, acetonitrile.
RP-HPLC Conditions[9][12][13][10,11]This Study
PurposeHuman OPN only as a biomarkerDetermination of C-terminal of bovine OPN to investigate its susceptibility to proteolytic cleavageSeparation of N- and C-terminal of to evaluate binding of human OPN to integrinIdentification and characterization of bovine OPN fragmentsQuantitative measurement of bovine OPN in infant formula
ColumnC18C2/C18C18C4C18
Mobile phase-A0.1% formic acid0.1% TFA0.1% TFA10% ACN in 0.1% TFA0.1% TFA
Mobile phase-B0.1% formic acid in ACN60% ACN in 0.1% TFA75% of 2-propanol in 0.1% TFA90% ACN in 0.1% TFA60% ACN in 0.1% TFA
ElutionGradient, 7 minGradient, 54 minGradient, time NR *Gradient (28 min) followed by isocratic (28 min); total 56 minIsocratic, 10 min; 20% of mobile phase A and 80% of mobile phase B
Temperature40 °CNRNR40 °C40 °C
AbsorbanceNR214 nmNR214 nm214 nm
Sample injection25 µLNRNR4 µL10 µL
Flow rate (ml/min)0.30.15NRNR0.3
* NR - Not reported.
Table 2. Intra-day and inter-day precision in retention time using 1 mg/L OPN injected for 10 times.
Injection of OPN
(1 mg/L)
Intra-DayInter-Day
Retention Time (min)RSD (%)Retention Time (min)RSD (%)
14.0590.1614.0510.148
24.0604.055
34.0564.048
44.0504.061
54.0714.055
64.0524.059
74.0494.049
84.0584.060
94.0634.054
104.0574.042
Mean4.058 ± 0.0074.053 ± 0.006
Table 3. Accuracy (recovery) of OPN from IMF spiked with three concentration levels of OPN.
Spiked Amount (mg/L)Recovery (%)RSD (%)
1.25100.48 ± 1.621.62
2.599.63 ± 2.732.74
5102.39 ± 2.172.12

