Article

Parameter Optimization of Geogrid-Reinforced Foundations Based on Model Experiments and Numerical Simulations

School of Engineering and Technology, China University of Geosciences, Beijing 100083, China
*
Author to whom correspondence should be addressed.
Appl. Sci. 2019, 9(17), 3592; https://doi.org/10.3390/app9173592
Submission received: 28 June 2019 / Revised: 15 August 2019 / Accepted: 17 August 2019 / Published: 2 September 2019

Abstract

:
Dynamic compaction and geogrid reinforcement are two of the well-known methods used in improving the mechanical properties of fill foundations. In order to investigate their mutual restriction when used simultaneously and optimize the design parameters, model experiments and numerical simulations were conducted. First, three factors (embedded ratio of reinforced geogrid, number of reinforced layers and interval of reinforced layers) that are related to performance of reinforced geogrid were analyzed by model experiments with dynamic compaction. Then, orthogonal analysis was performed by numerical simulation (dynamic analysis in FLAC3D) to take into account five different elastic moduli and internal angle of friction along with the aforementioned three factors. Last, range analysis and variance analysis were performed on the orthogonal results to optimize the five factors by the calculated indicators. Additionally, linear regression analysis reflecting the relationships between five factors and four indicators was presented. The displacement field, compaction effect, earth pressure, and geogrid deformation of the reinforced soil under different combinations of the five factors were explored. Experiment and simulation results provide practical guides to the design of reinforced methods and a reference for the stability and deformation of other earth reinforcement projects under dynamic loads.

1. Introduction

With the rapid development of infrastructure in recent years, a considerable number of large fill projects have been initiated in China, many of which involve foundation construction in the southwestern regions, where coarse-grained soil is dominant. Due to large filling volume and large postconstruction settlement, an appropriate treatment should be performed. At present, the most popular approaches for treating fill foundation include dynamic compaction and geogrid reinforcement.
Dynamic compaction (DC) has many advantageous characteristics such as simple equipment, convenient construction, faster construction work efficiency, and guarantee of quality. Some scholars have discussed the theory of DC (Mayne et al., 1984; Lukas, 1992; Menard, 1975) [1,2,3]. Many researchers have investigated the densification effects of DC on sandy soils (Feng et al., 2013; Michalowski et al., 2012), deposits (Lukas, 1980; Feng et al., 2011), collapsible soils (Rollins et al., 2010), red clay soil (Liu et al., 2008), and solid waste (Zekkos et al., 2013) [4,5,6,7,8,9,10]. Based on a great deal of information from compaction tests on dry sand materials, researchers analyzed the relationship between the compacting energy and the compacting effect and indicated that the influence of the construction process is determined by the choice of equipment and relevant factors, including tamper weight, shape, dropping height, and interval between tamping point (Poran and Rodriguez, 1992) [11]. Many tests also indicated that there are many laws affecting soil reconsolidation and deformation, such as impact energy, peripheral pressure, soil properties, and so on (Bai B, 2003) [12]. An improved but essentially empirical approach for selecting the operational parameters for DC has been suggested (Lo et al., 1990) [13]. Some researchers also proposed a simplified model based on a one-dimensional wave equation to predict the crater depth associated with the dropped weight and to determine the depth and level of the improved soil beneath the impact zone (Chow et al.,1992a, 1992b) [14,15]. Additionally, characteristic design curves to select the optimum grid space in DC projects were also presented (Chow et al., 1994) [16]. However, the design and application of DC are still empirical in practice, which relies heavily on the designer’s experience and judgement (Zou et al., 2005; Feng et al., 2010) [17,18].
The geogrid reinforcement method, which is an effective ground reinforcement method, reduces the lateral displacement, improves the deformation characteristics, and enhances the strength of the soil mass. Lots of model experiments showed that geogrid reinforcement does reduce the settlement of the foundation and the settlement reduction factor is a function of the depth of reinforcement (Das B.M. et al., 1998) [19]. A series of triaxial compression tests and cyclic triaxial tests were conducted on unreinforced and geogrid-reinforced crushed limestone samples to study the effects of geogrid type (Nazzal et al., 2007) [20]. The effect of geogrid on controlling the stability and settlement of high railway embankments was also investigated using laboratory tests and finite element modeling (Esmaeili et al., 2018) [21]. Geogrid reinforcement reduces the lateral strains with the base and subgrade layers, reduces the vertical strains on top of subgrade layer, and hence significantly reduces the surface permanent deformation of pavement (Gu, 2011) [22]. Based on the computational results, the optimization design (geogrid modulus, reinforced layers, and reinforcement length) technology of geogrid-reinforced subgrade widening for highways is presented (Shen et al., 2013) [23]. By choosing five main influential factors (such as tensile strength and geogrid modulus), the analysis on the sensitivity of geogrid reinforcement factors in mine-tailing slopes was conducted (Lei et al., 2016) [24]. In addition, within a range of geogrid elastic modulus, both lateral displacement and vertical settlement of railway ballast decrease with the increase of geogrid elastic modulus (Xia et al., 2016) [25].
As mentioned above, backfilled foundation can be compacted by dynamic compaction and its lateral deformation can be limited effectively by geogrid reinforcement. Both methods can strengthen the stability of backfilled foundation, but they may restrict each other when the two methods are used at the same time. The reinforced soil can limit the function of dynamic compaction. Meanwhile, broad dynamic compaction energy can easily lead to fracture failure of reinforced plastic materials. In order to solve the problem on how to balance and optimize the design of dynamic compaction and reinforced geogrid, model experiments and numerical simulation (dynamic analysis of FLAC3D) were adopted in this paper. First, three factors (embedded ratio of reinforced geogrid, number of reinforced layers, and interval of reinforced layers) affecting the reinforced effect of fill foundation were analyzed by model experiments. The deformation characteristics of the reinforced soil and the stress state of the geogrid under dynamic compaction were also discussed. Then, in order to investigate the influence of reinforced geogrid properties on experimental results, its elastic modulus and internal angle of friction are taken as influential factors. The orthogonal experiment was performed on the five factors using numerical simulation. Last, the optimal design (a combination of the five factors) was suggested by the calculated indicators via range analysis and variance analysis. Additionally, linear regression analysis reflecting the relationship between the five factors and four indicators was presented.

2. Model Experiments

2.1. Design of Experiment Parameters

Based on the law of similitude, this paper establishes the similitude relation between indoor model experiments and the field prototype test. A total of 15 physical quantities were considered in this experiment, which are: tamping energy (E), mass of tamper (W), tamper’s bottom area ( A ), drop height ( H ), compactness ( K ), embedded depth of reinforced geogrid ( S r f ), interval of reinforced layers ( S c ), number of reinforced layers ( N c ), deflection of first reinforced layer ( S g ), elastic modulus of reinforced geogrid ( E g ), number of tamper passes ( N h ), crater depth on unreinforced condition ( H u f ), crater depth on reinforced condition ( H r f ), effective reinforced depth ( D e ), and earth pressure ( P ). The physical equation is shown as follows.
f ( E , W , K , N c , N h , E g , P , H , H u f , H r f , S r f , S c , S g , D e , A ) = 0 ,
By selecting W and H as the basic quantities, the other 13 quantities can be expressed as dimensionless variables π i = ( i = 1 , 2 , , 13 ) , the physical equation is f ( π 1 , π 2 , π 3 , , π 13 ) = 0 . The physical equation can be further expressed as follows.
f ( E W H , K , N c , N h , E g H 2 W , P H 2 W , H u f H , H r f H , S r f H , S c H , S g H , D e H , A H 2 ) = 0 ,
If the similarity constant of the tamper weight and the drop height is determined, the similarity constant of other related physical quantities can be calculated. In field engineering, tamper weight is 200 kN, drop height is 10 m, and tamping energy is 20,000 kN∙m. In a model experiment, tamper weight is 25 N, drop height is 1.0 m, and tamping energy is 25 N∙m. The ratio of earth pressure and displacement between the model and prototype is 1:80 and 1:10, respectively. In this paper, each layer was initially filled to a thickness of 10 cm and then hammered down to a thickness of 5 cm. After testing, the dry density of the soil sample is 1.63 and the experiment is executed under strict control of an initial compactness of 0.93.

2.2. Soil Samples

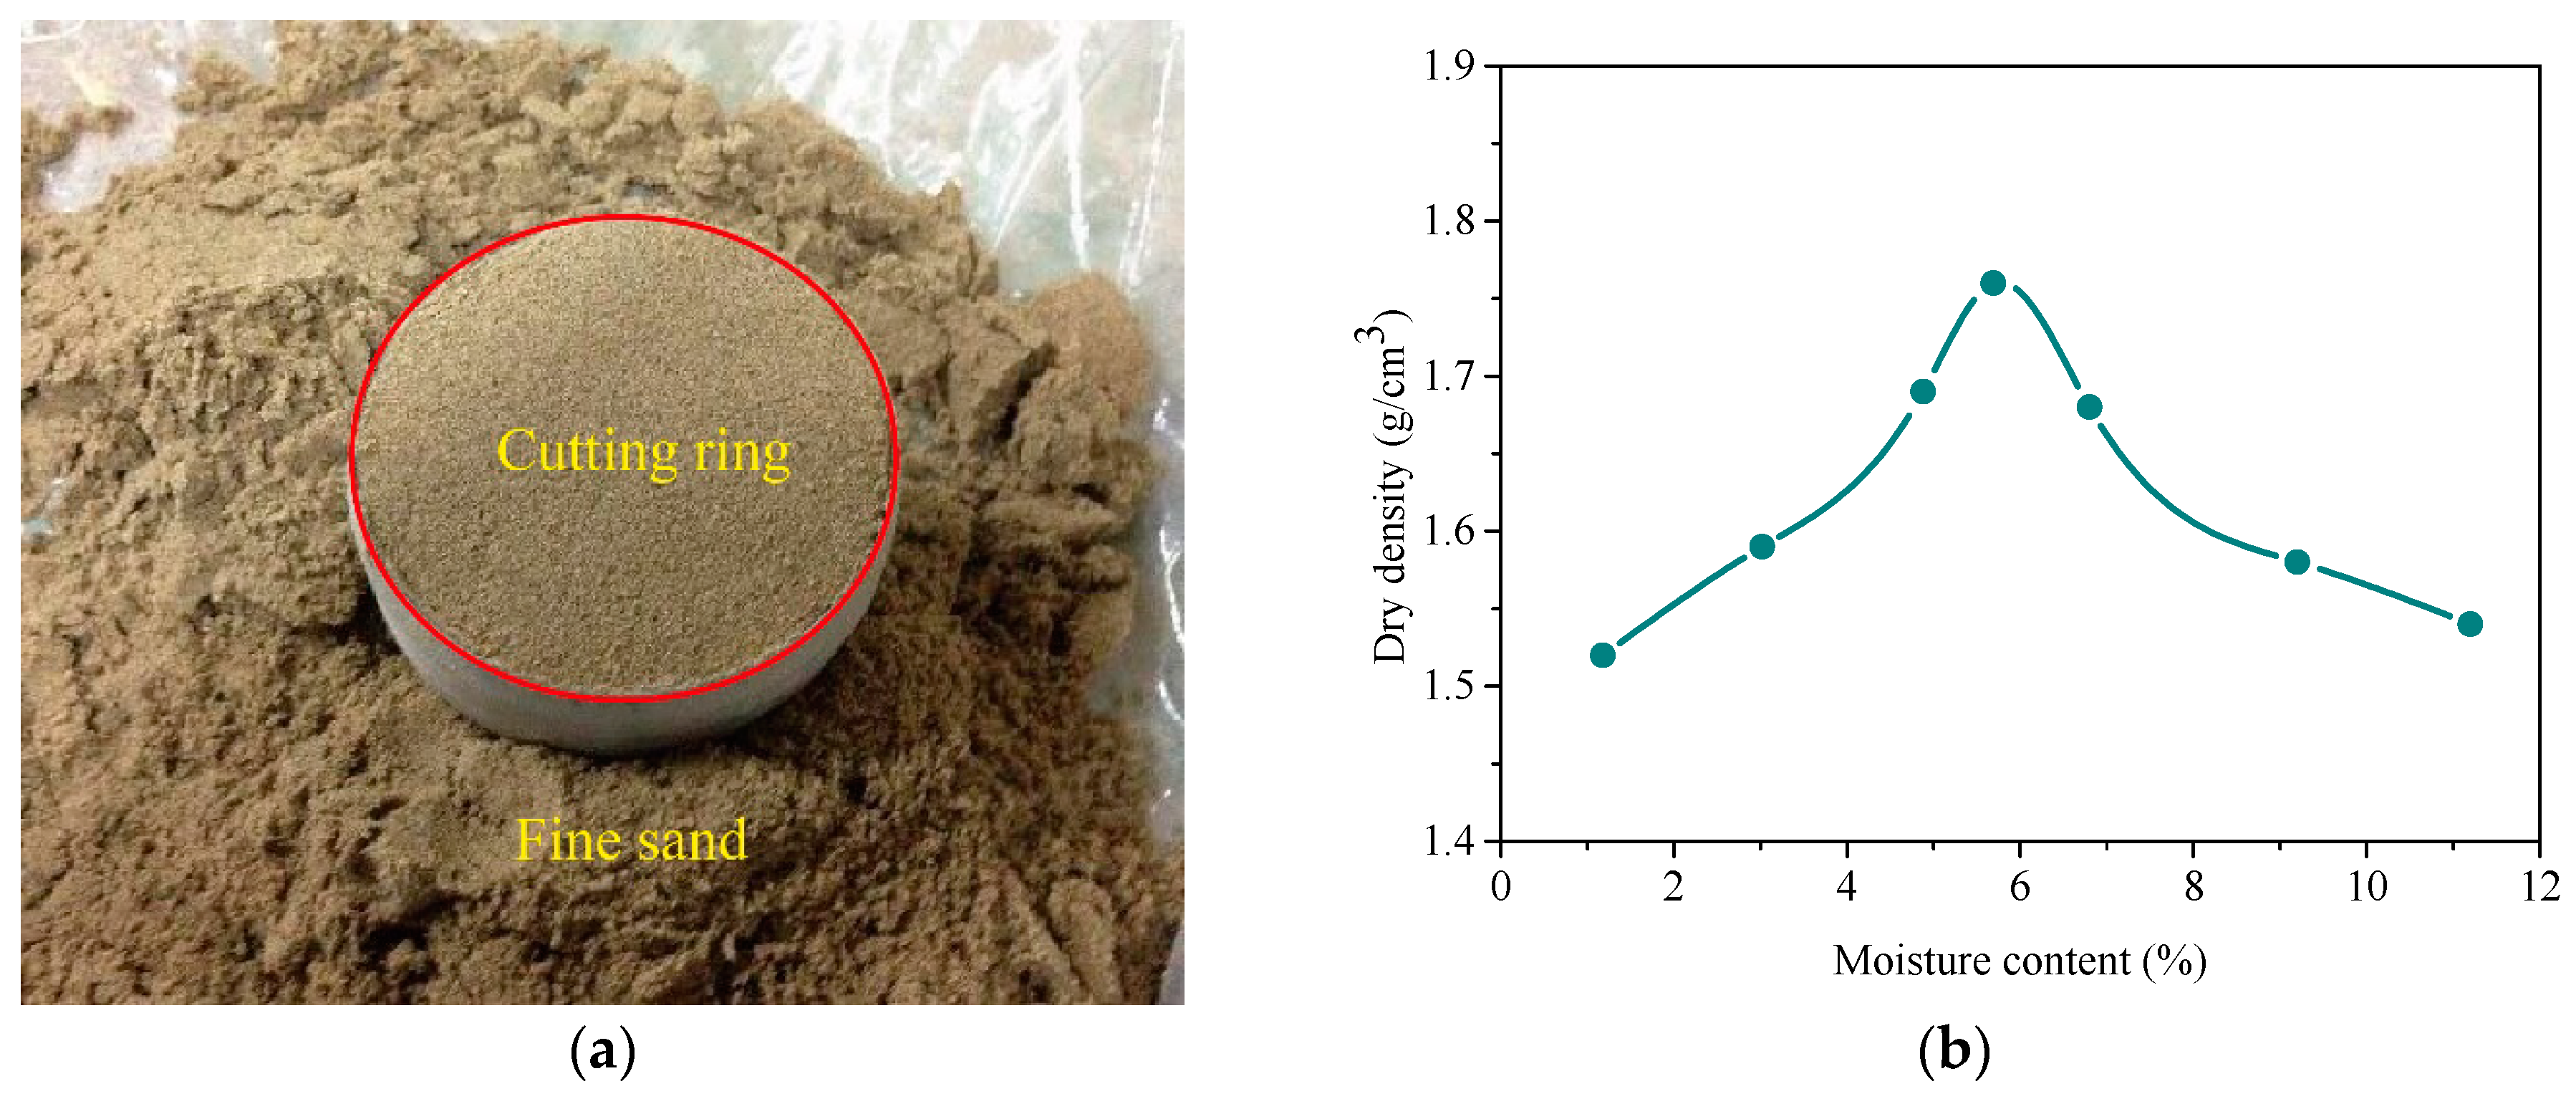
The soil sample is composed of fine sand that passes through a 2 mm sieve (Figure 1a). Standard compaction tests were performed on the soil to determine the maximum dry density and optimum moisture content, which are equivalent to 1.76 g/cm3 and 5.69%, respectively (Figure 1b). Consolidated undrained triaxial tests were performed on compacted soil at optimum moisture content to obtain total and effective shear strength parameters. Drained cohesive and peak angle of internal friction values were obtained as null and 35°, respectively. Table 1 summarizes the soil properties used in the present study.

2.3. Instruments and Equipments

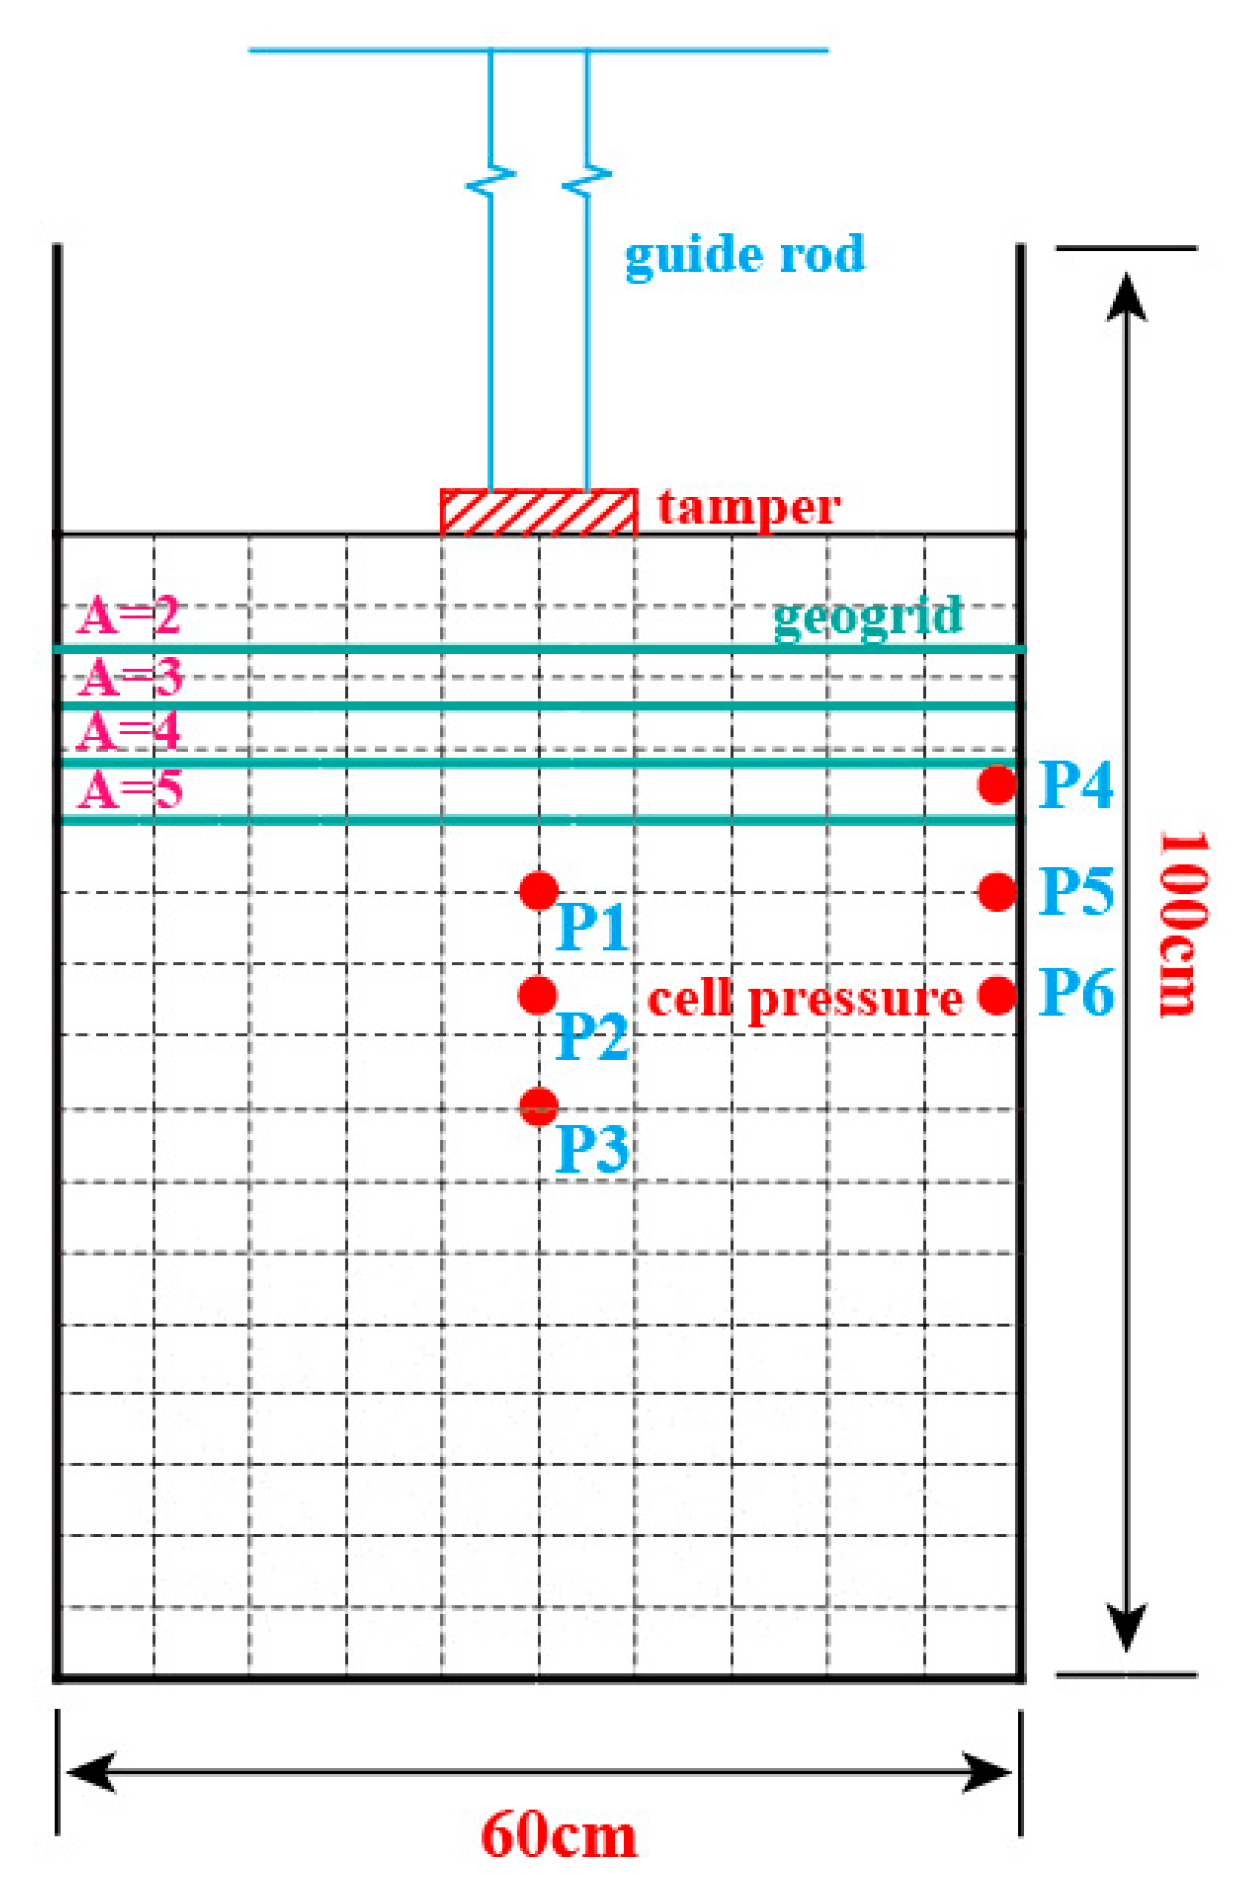
The experiment equipment consists of four parts: dynamic compaction device, model box, sensor and data acquisition system. Among them, the front surface of the model box was divided into small grids with dimensions of 6 cm × 5 cm using markers to be able to monitor the soil deformation (Figure 2). To monitor the horizontal displacement, additional marks are added at 1, 2, 3, and 4 times the rammer radius. The dynamic compaction device played the most important role in the model experiment. In order to simulate the dynamic response of the fill foundation, a semicircular steel hammer with a diameter of 120 mm, a mass of 2.5 kg freely falls from a certain altitude and applies dynamic load to the foundation. Meanwhile, to prevent hammering from rotation and subsidence, two through-holes with a diameter of 10 mm are set, which can freely fall from the guide rod.
The analyzed data in this paper include soil deformations, earth pressure, crater depth and reinforced depth, deflection, and strain distribution of first reinforced layer. Earth pressure cells were used to study the transfer characteristics of tamping energy and its specifications are shown in Table 2. Three earth pressure cells (P1, P2, and P3) were installed in the soil beneath the tamping central point at an interval of 75 cm, and three earth pressure cells (P4, P5, and P6) were embedded in the lateral part of the model box at an interval of 75 cm (Figure 2). Strain gauges with resistance value of 120 ± 0.2 Ω and sensitivity ratio of 2.11 ± 1% were bonded to longitudinal bars of reinforced geogrid and were installed along the tensile direction at an interval of 3 cm. The specifications of the strain gauges are shown in Table 3. Data were collected and maintained by dynamic strain indicator.

2.4. Experimental Procedures

The control variable method was adopted to study the influence of reinforced geogrid on soil (foundation) under dynamic compaction. According to the application experience, the preliminary range of values of the embedded ratios of the reinforced geogrid, number of reinforced layers, and interval of reinforced layers, are 2–5, 2–5, and 2–8 cm, respectively.
Among them, the embedded ratio is the ratio of reinforced depth to unreinforced depth under single tamping. The code is shown in Table 4 and the plan of experiment design is shown in Table 5, in which the three factors A, B, and C, are embedded ratio of reinforced geogrid, number of reinforced layers, and interval of reinforced layers. The four values of A are 2, 3, 4, and 5, four values of B are 2, 3, 4, and 5, and four values of C are 2 cm, 4 cm, 6 cm, and 8 cm, respectively. There are 12 conditions corresponding to 12 model experiments, in which 1, 5, and 9 are in the same condition. Furthermore, the experiment on the unreinforced condition was conducted as the control experiment. Thus, 11 groups of model experiment were performed in this paper.

2.5. Results and Discussion

Based on the principle of similitude ratio, the test data are converted into prototype data so that it can better correspond with the field conditions. The similitude ratio of earth pressure and displacement between the model and prototype is 1:80 and 1:10, respectively.

2.5.1. Soil Deformations
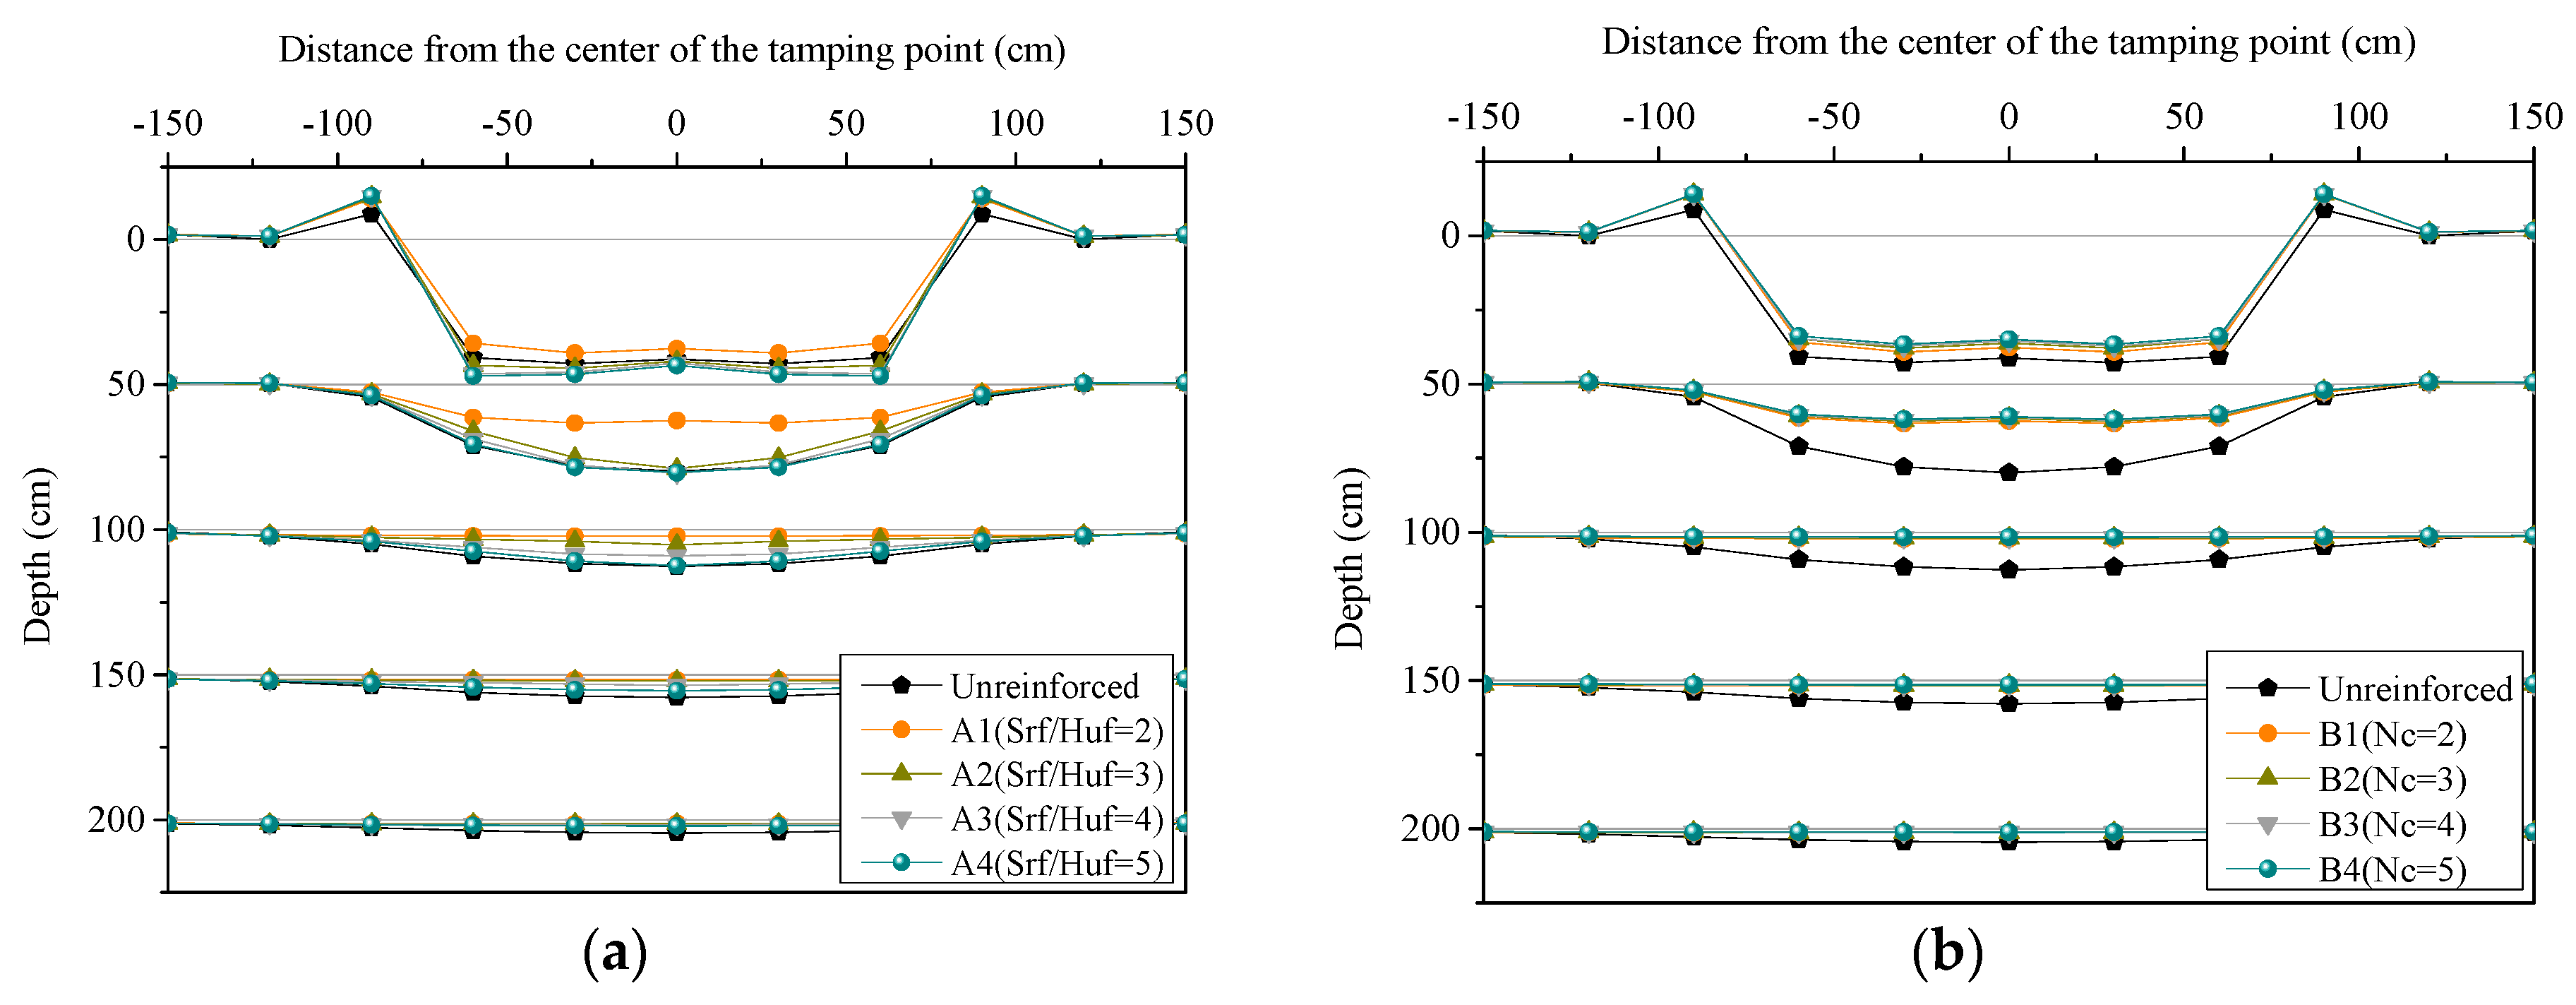
As shown in Figure 3a, there is no significant difference in surface settlement under all conditions, but deep settlement shows obvious differences. Large constrained displacement (definition: vertical displacement under unreinforced condition subtract vertical displacement under reinforced condition) is disadvantageous to compaction. For example, the constrained displacement at a depth of 150 cm is 6.07 cm, while it is 3.64 cm at ground surface. The maximum constrained displacement on conditions of A1, A2, A3, and A4 is 17.49 cm, 7.48 cm, 4.14 cm, and 2.42 cm, respectively. The constraining effect on settlement decreases gradually with the increase of embedding depth. Figure 3b shows the vertical displacement will be substantially reduced after reinforcement. The maximum constrained displacement at depths of 0 cm, 50 cm, 100 cm, and 150 cm is 6.32 cm, 18.99 cm, 11.06 cm, and 6.42 cm, respectively. B has a significant constraining effect on vertical displacement. For instance, compared with vertical displacement in unreinforced conditions, the surface constrained displacement below tamping point is 3.64 cm, 5 cm, 5.74 cm, and 6.32 cm in the conditions of B1, B2, B3, and B4, respectively. 
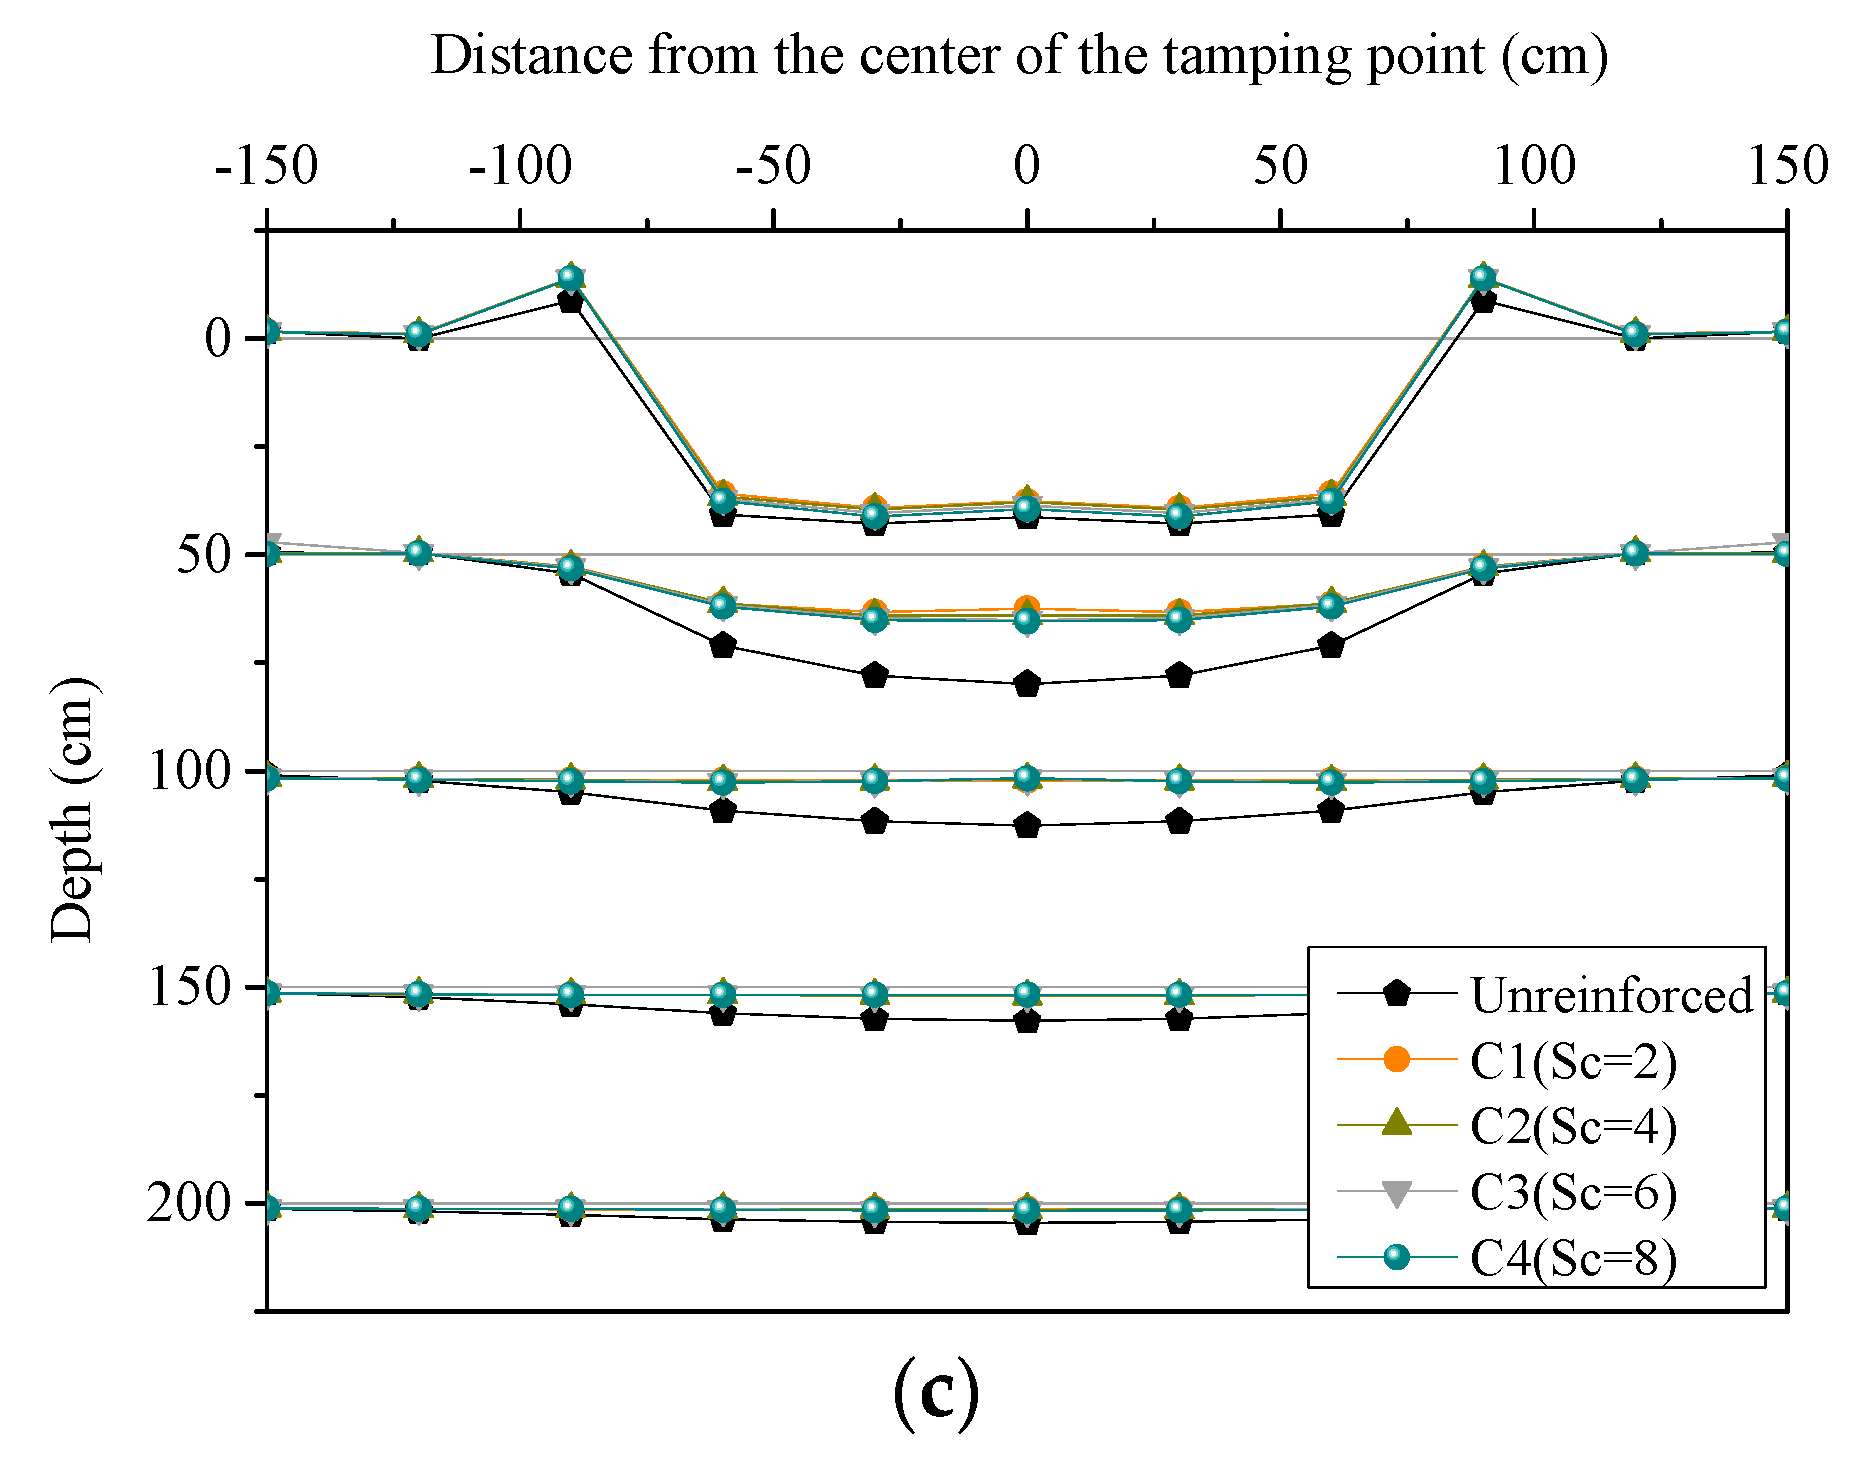
Figure 3c shows the increasing C has a negative effect on the constraining effect. Take the vertical settlement under the tamping central point as an example: in the conditions of C1, C2, C3, and C4, the constrained displacement of the surface is 3.64 cm, 3.48 cm, 2.65 cm, and 1.83 cm, respectively. However, the vertical displacement under the dynamic compaction is reduced significantly by geogrid reinforcement. The maximum constrained displacement provided by reinforced geogrid at depth of 0 cm, 50 cm, 100 cm, and 150 cm is 3.64 cm, 17.49 cm, 10.98 cm, and 6.08 cm, respectively.
Overall, the reason for small surface constrained displacement is that the reinforced geogrid is relatively shallow and the surface vertical displacement is constrained by the first reinforced layer.
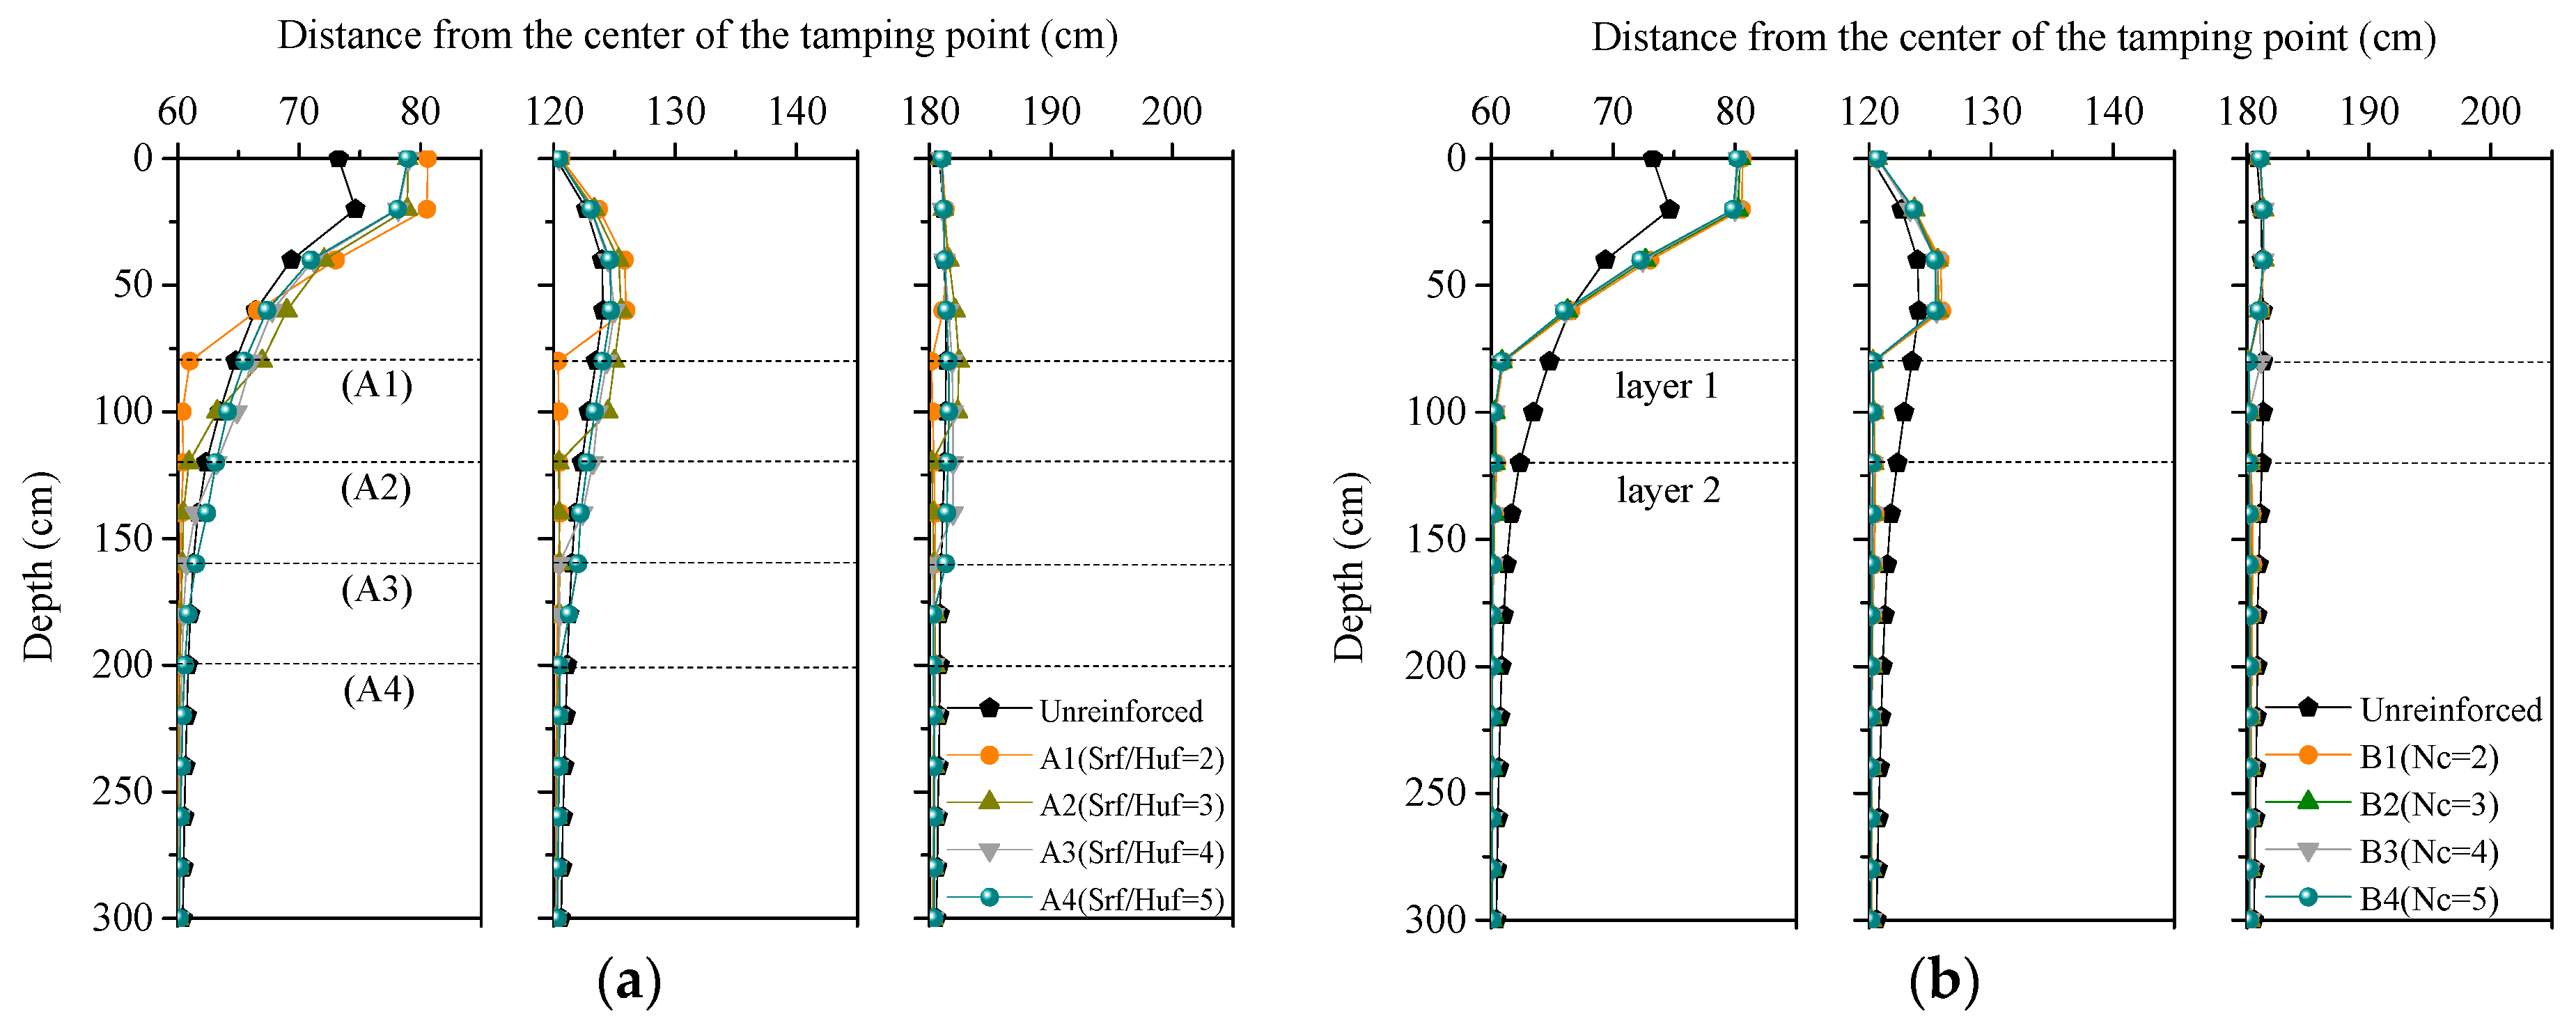
As shown in Figure 4a, in the A1 condition, the reinforced geogrid is located at a depth of 80 cm and the lateral displacement below the geogrid is reduced substantially, the maximum displacement is close to the depth of 25 cm. In the A2 condition, the lateral displacement below the geogrid is reduced substantially and is smaller than in the A1 condition. With increased embedded depth, the reinforced geogrid has a small constraining effect on lateral displacement; thus, A3 and A4 show the same trend with that of unreinforced condition. As shown in 
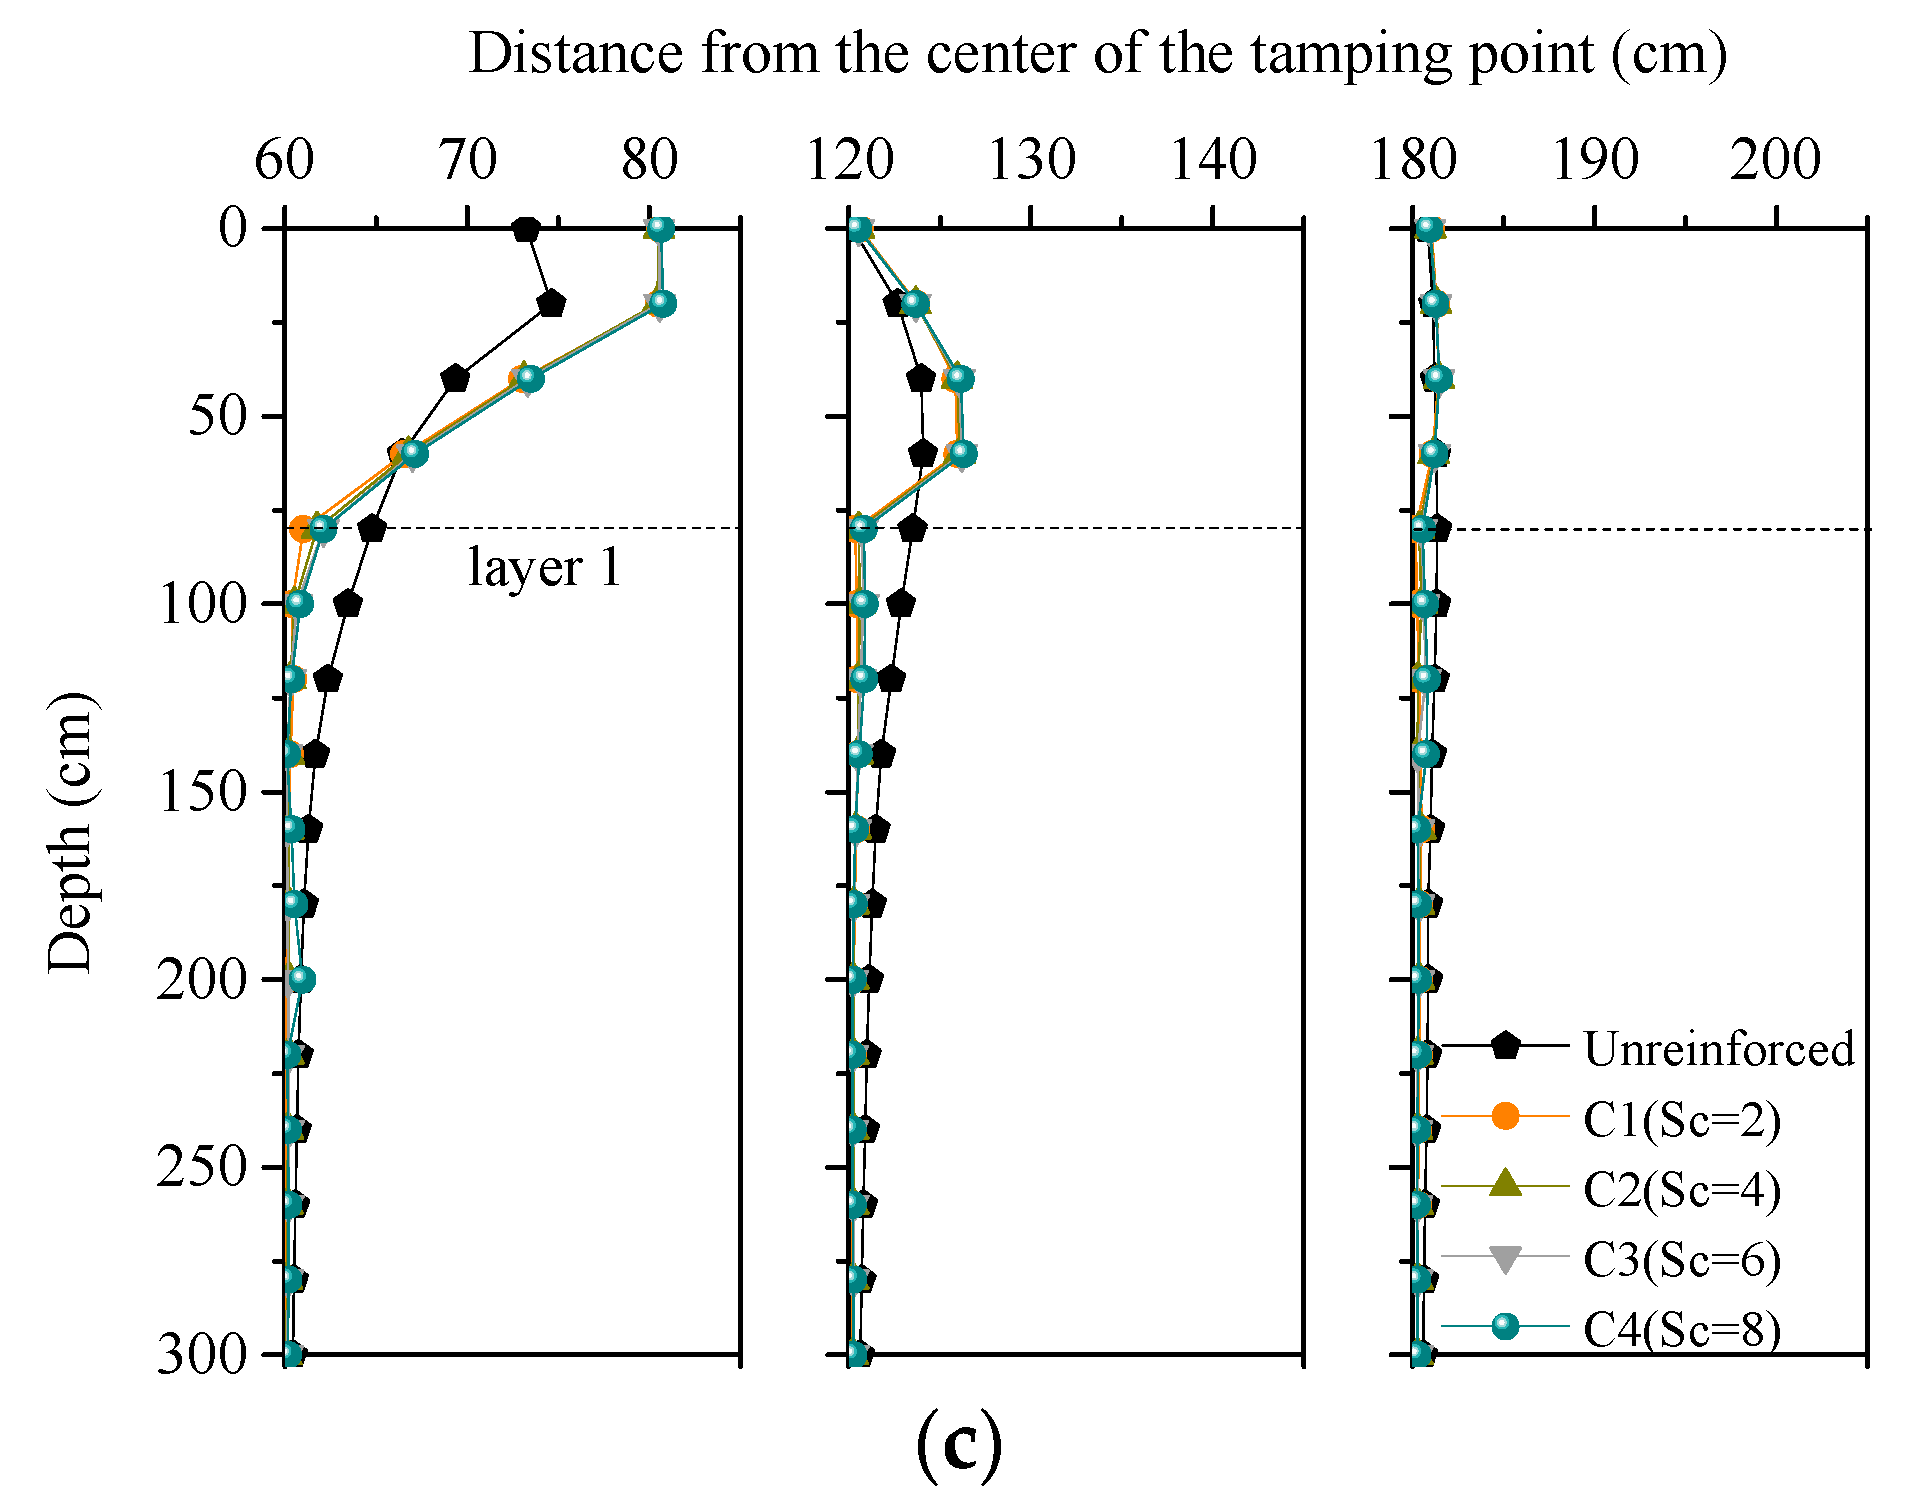
Figure 4b,c, B and C have constraining effects on the lateral displacement of soil. Between the surface ground and the depth of 60 cm (where constrained displacement reaches the minimum), the constrained displacement increased with depth of soil. The farther from the tamping point, the smaller the lateral displacement.
The lateral displacement of soil under the geogrid is larger than the unreinforced displacement. It decreases with the increase of reinforced depth. The reason is that in reinforced conditions, the settlement of the soil above the geogrid is restricted by the geogrid and expanded laterally under instantaneous vertical compaction. Therefore, lateral displacement of the counterpart on unreinforced condition is smaller. However, this kind of large-scale lateral expansion mostly occurs in soil within 120 cm from the tamping point. In the horizontal direction, 120 cm away from the tamping point, the maximum constrained lateral displacement is 7.34 cm and it decreases with the increase of horizontal distance.

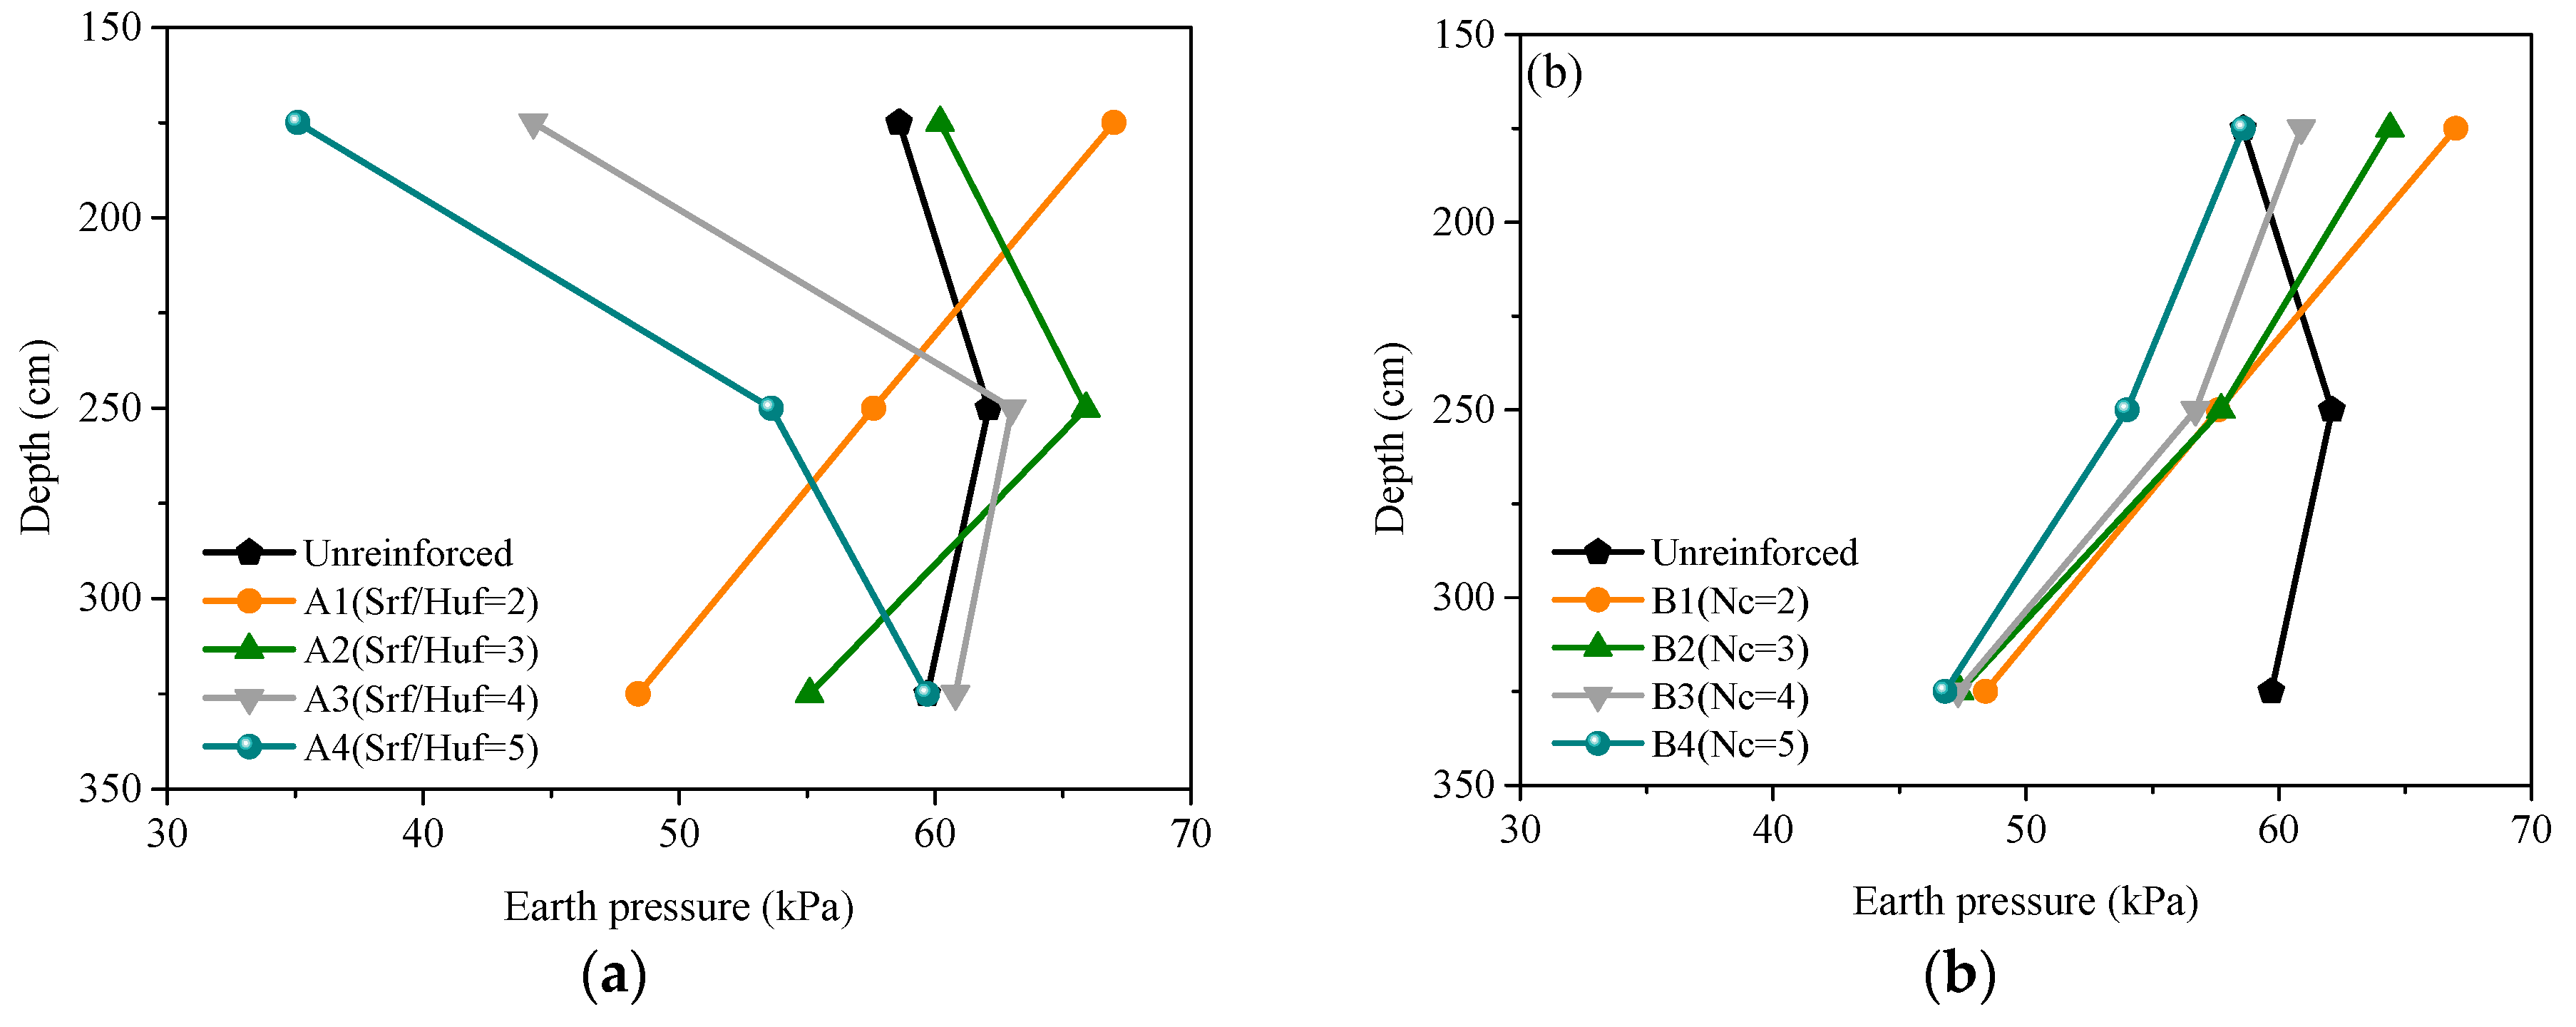
2.5.2. Maximum Dynamic Earth Pressure
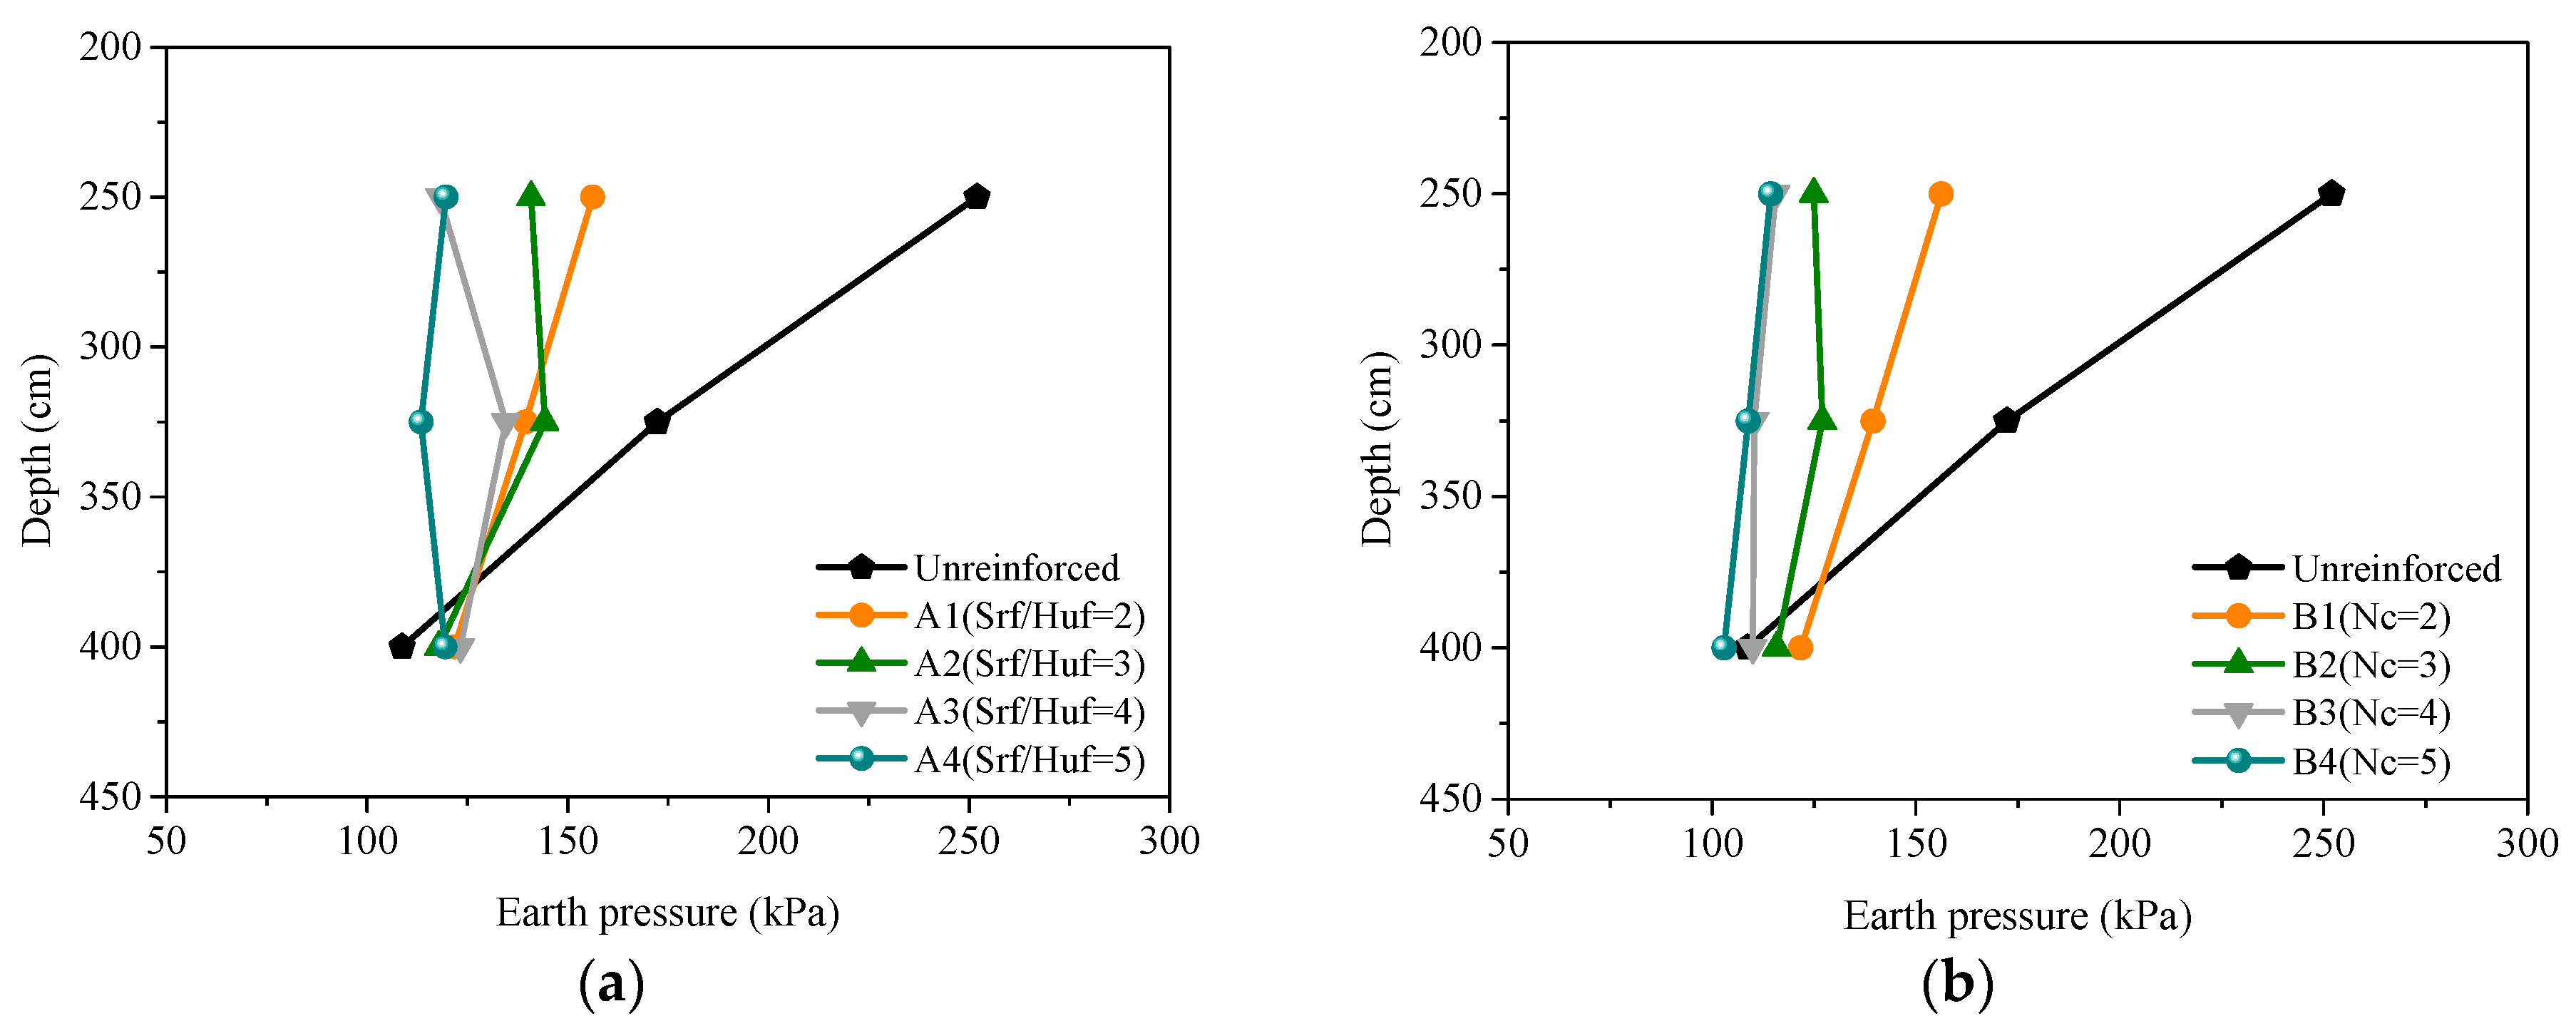
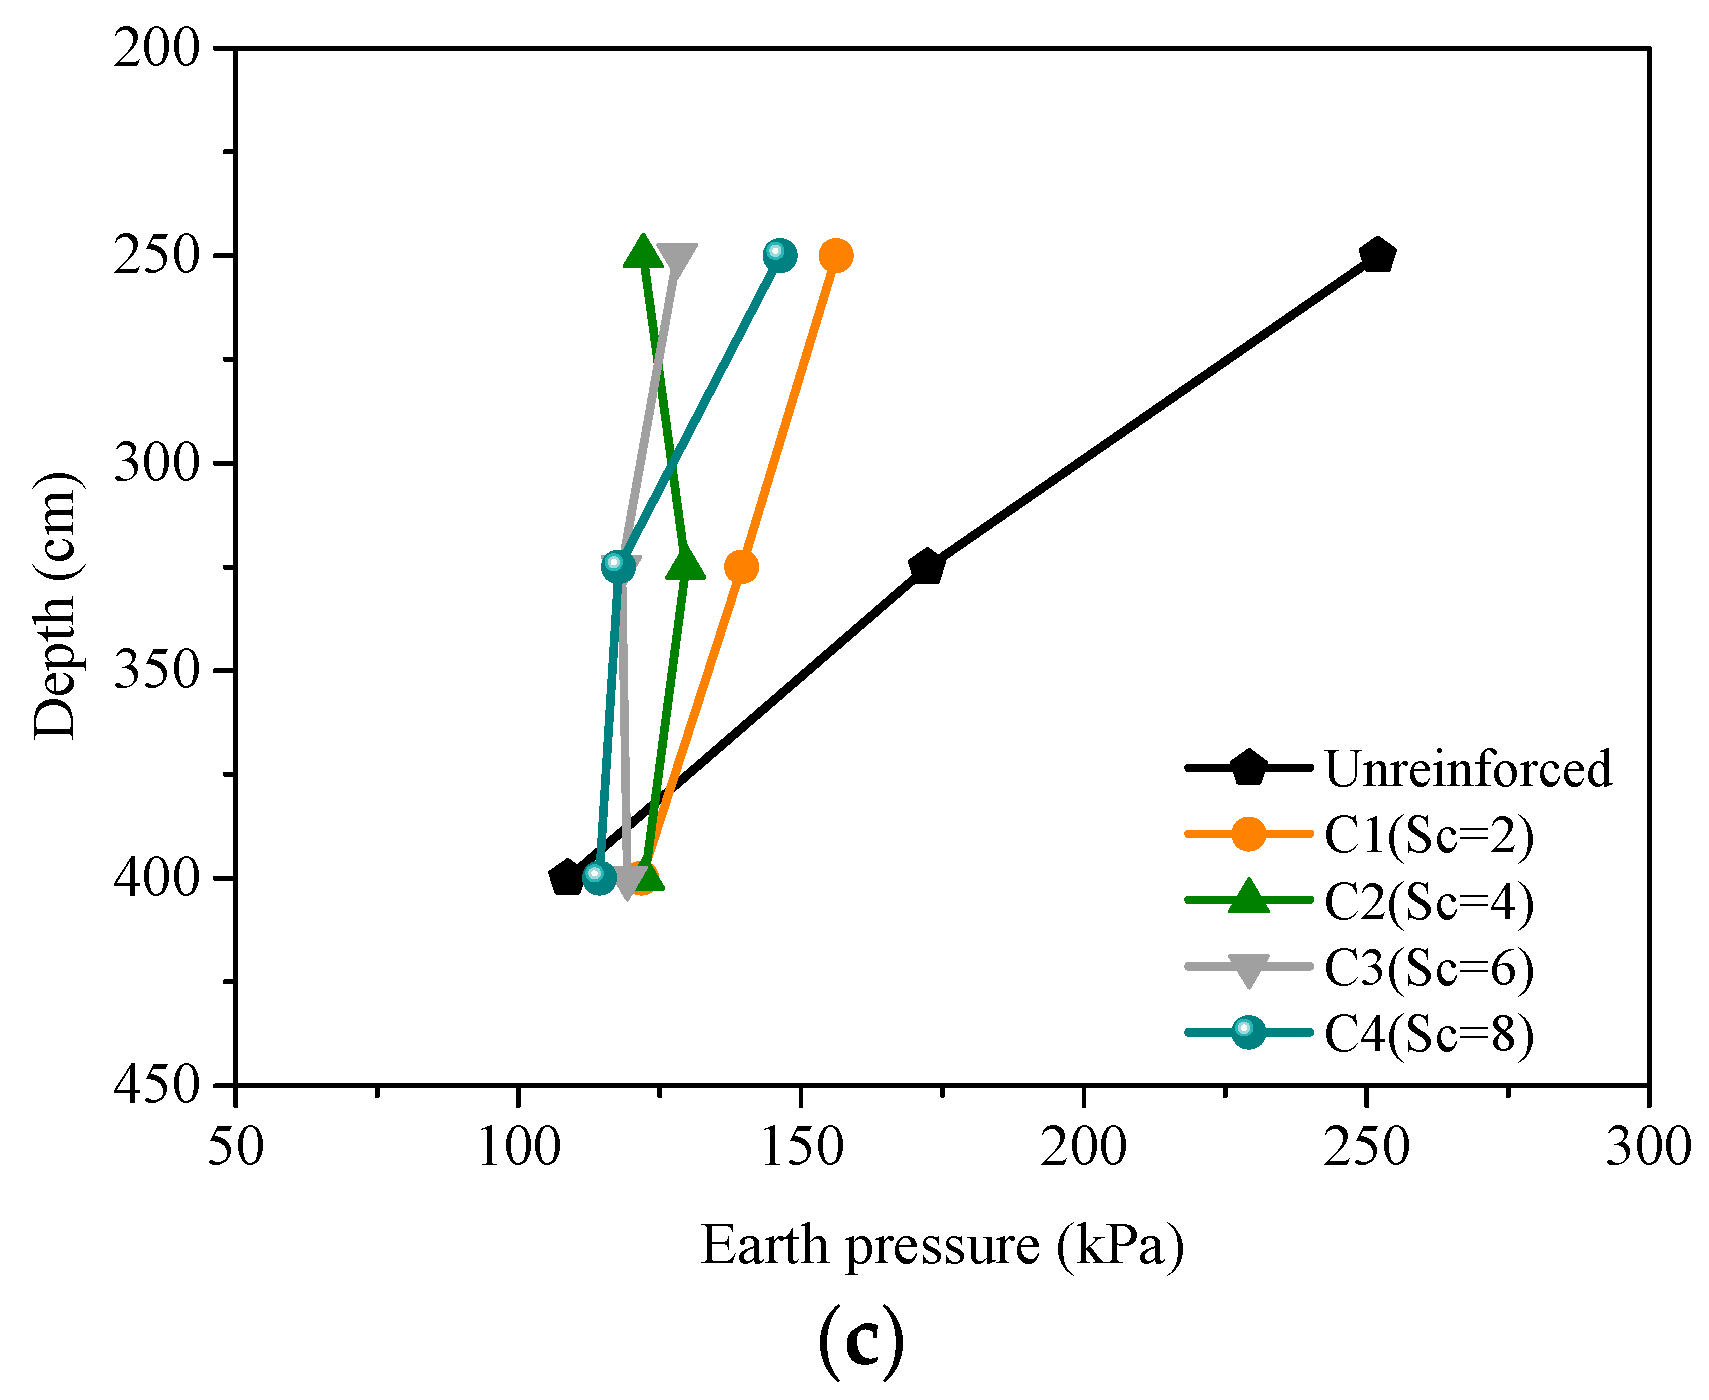
As shown in Figure 5a, the reinforced geogrid has a certain constraining effect on vertical earth pressure. For example, at a depth of 250 cm, the vertical earth pressure on unreinforced condition is 252 kPa, while the minimum vertical earth pressure on reinforced condition is only 118.2 kPa (A3). Figure 5b shows that vertical earth pressure (−250 cm) decreased by nearly 135 kPa in the reinforced condition. As the depth increases, the constraining effect weakens. Particularly, at depths below −3.25 m, the constraining effect decreases faster. Above the depth of 3.25 m, the vertical earth pressure decreases sharply (Figure 5c). Furthermore, with increasing C, vertical earth pressure gradually equals to the earth pressure of the unreinforced condition.
Below −3.25 m, the constraining effect is so weak that it is consistent with that of unreinforced condition (Figure 5a–c). The deep soil is difficult to compact due to the insufficient vertical earth pressure. The reason is that most of the tamping energy is borne by the reinforced geogrid and a small amount of the energy is transmitted to the deep soil. Note that deep soil compaction could be incomplete if the vertical earth pressure is too small, but the excessive vertical earth pressure could cause large deformation of the reinforced geogrid. In addition, a large upheaval induced by unloading rebound that occurs after construction is harmful to the long-term consolidation and stability of the foundation.
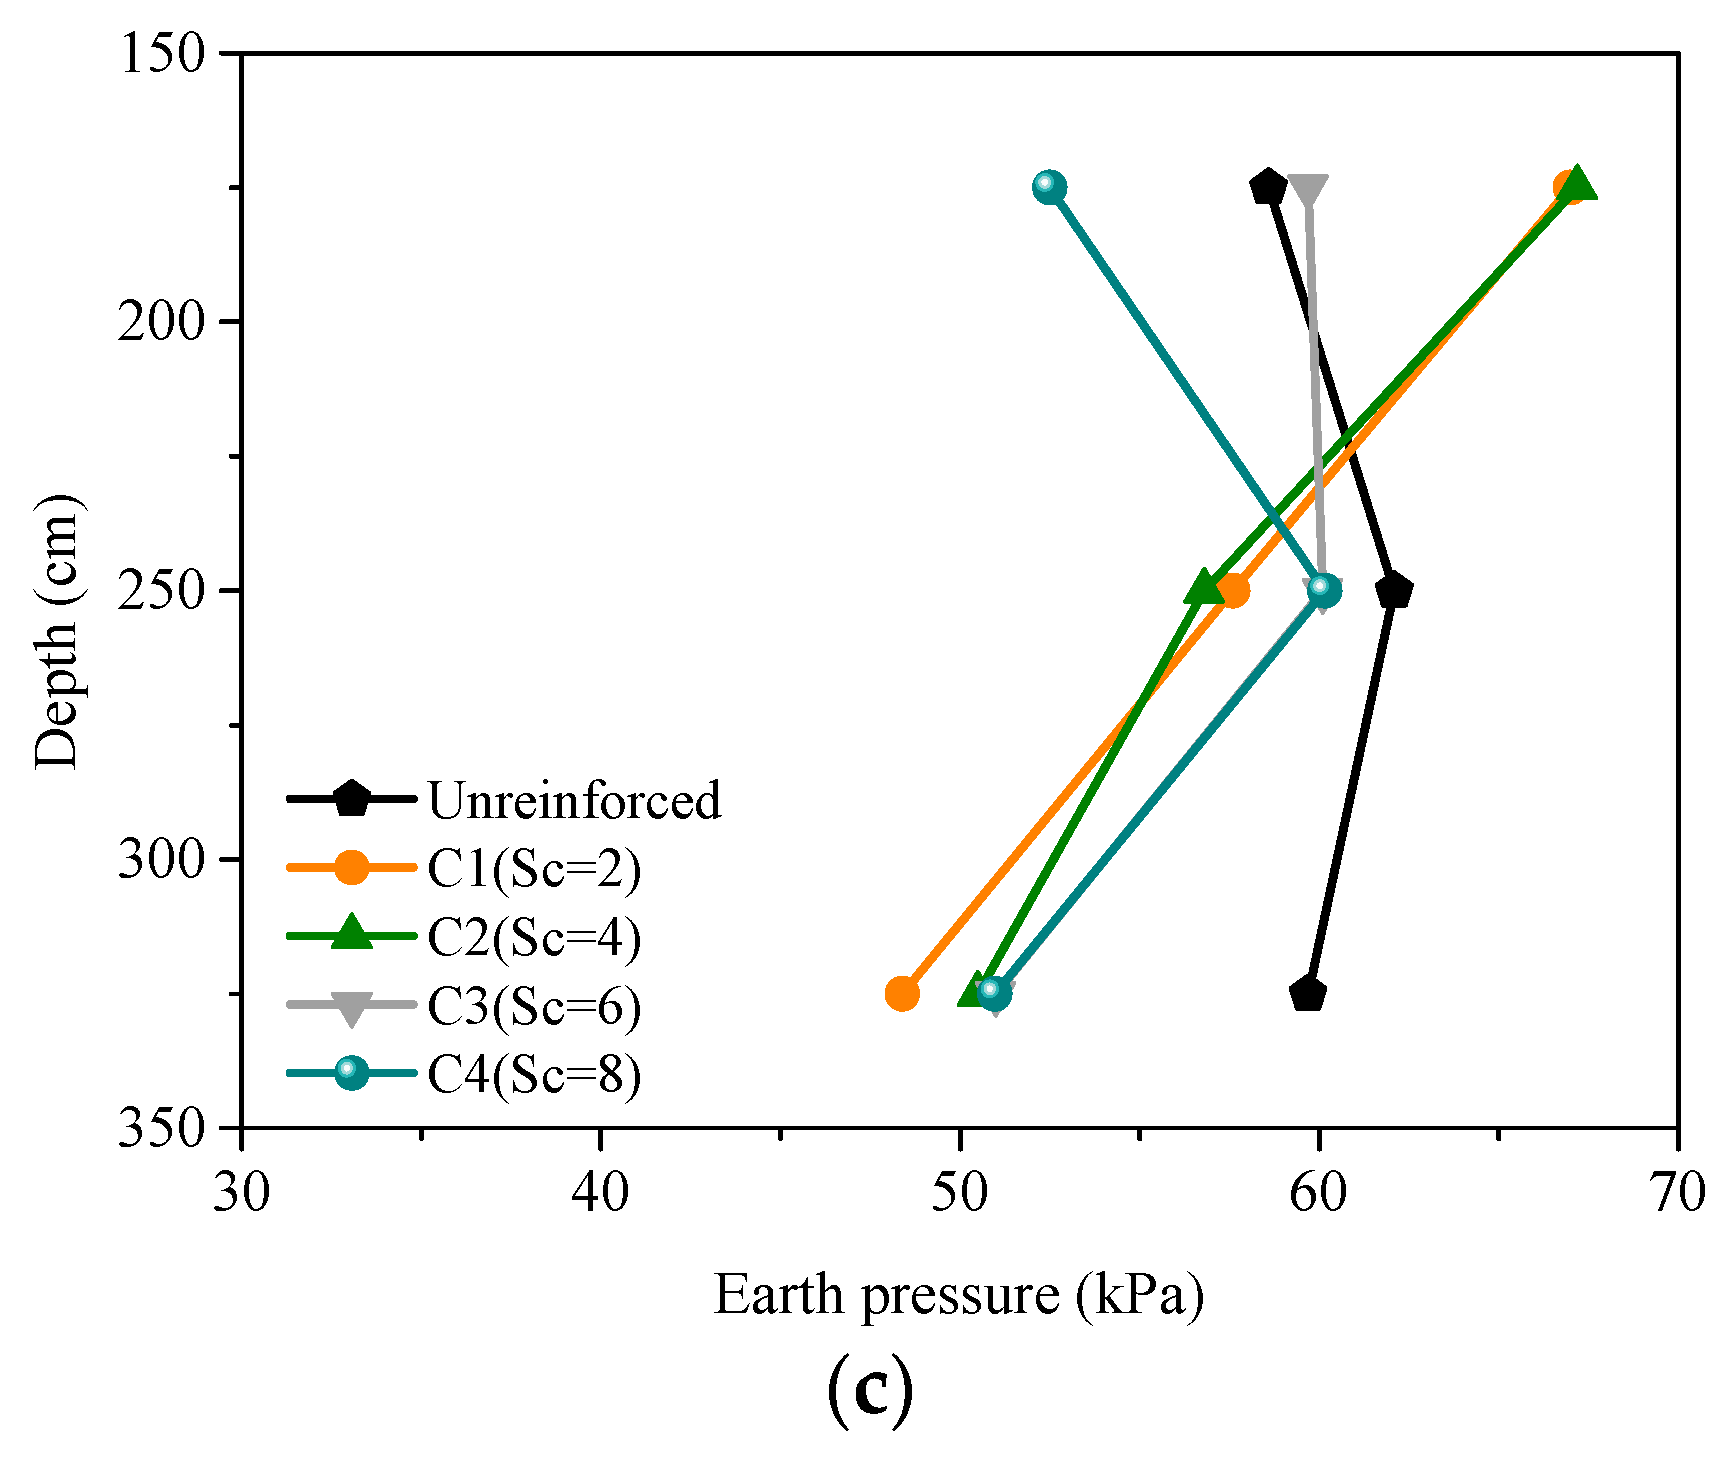
Figure 6a shows constraint on lateral earth pressure by reinforcement. When the reinforced geogrid was embedded at a deeper position (A3 = 12 cm), the lateral earth pressure decreased largely and was constrained by almost 24% compared with that of unreinforced condition. The degree of constraint gradually increases with the increase of A. The lateral earth pressure on the condition of A2 is consistent with that of unreinforced condition. Figure 6b shows the lateral earth pressure changes against the depth, which is similar to the change of vertical pressure. Constrained pressure at a depth of 3.25 m is large and reaches 12.9 kPa approximately under reinforcement. However, B has little effect on lateral earth pressure, since in the conditions of B1, B2, B3, and B4, the trend of lateral earth pressure is virtually the same. As shown in Figure 6c, C has a significant constraint on lateral earth pressure. When the interval is 8 cm, the constraining effect on the lateral earth pressure reaches its maximum. When the depth is greater than 2.5 m, under different intervals of the geogrid, the trend of lateral earth pressure is different to each other. In the conditions of all intervals (2 cm, 4 cm, 6 cm, and 8 cm) of reinforced layers, the lateral earth pressure at any depth is less than that of the unreinforced condition.
In conclusion, reinforcement has a significant constraining effect on lateral earth pressure.

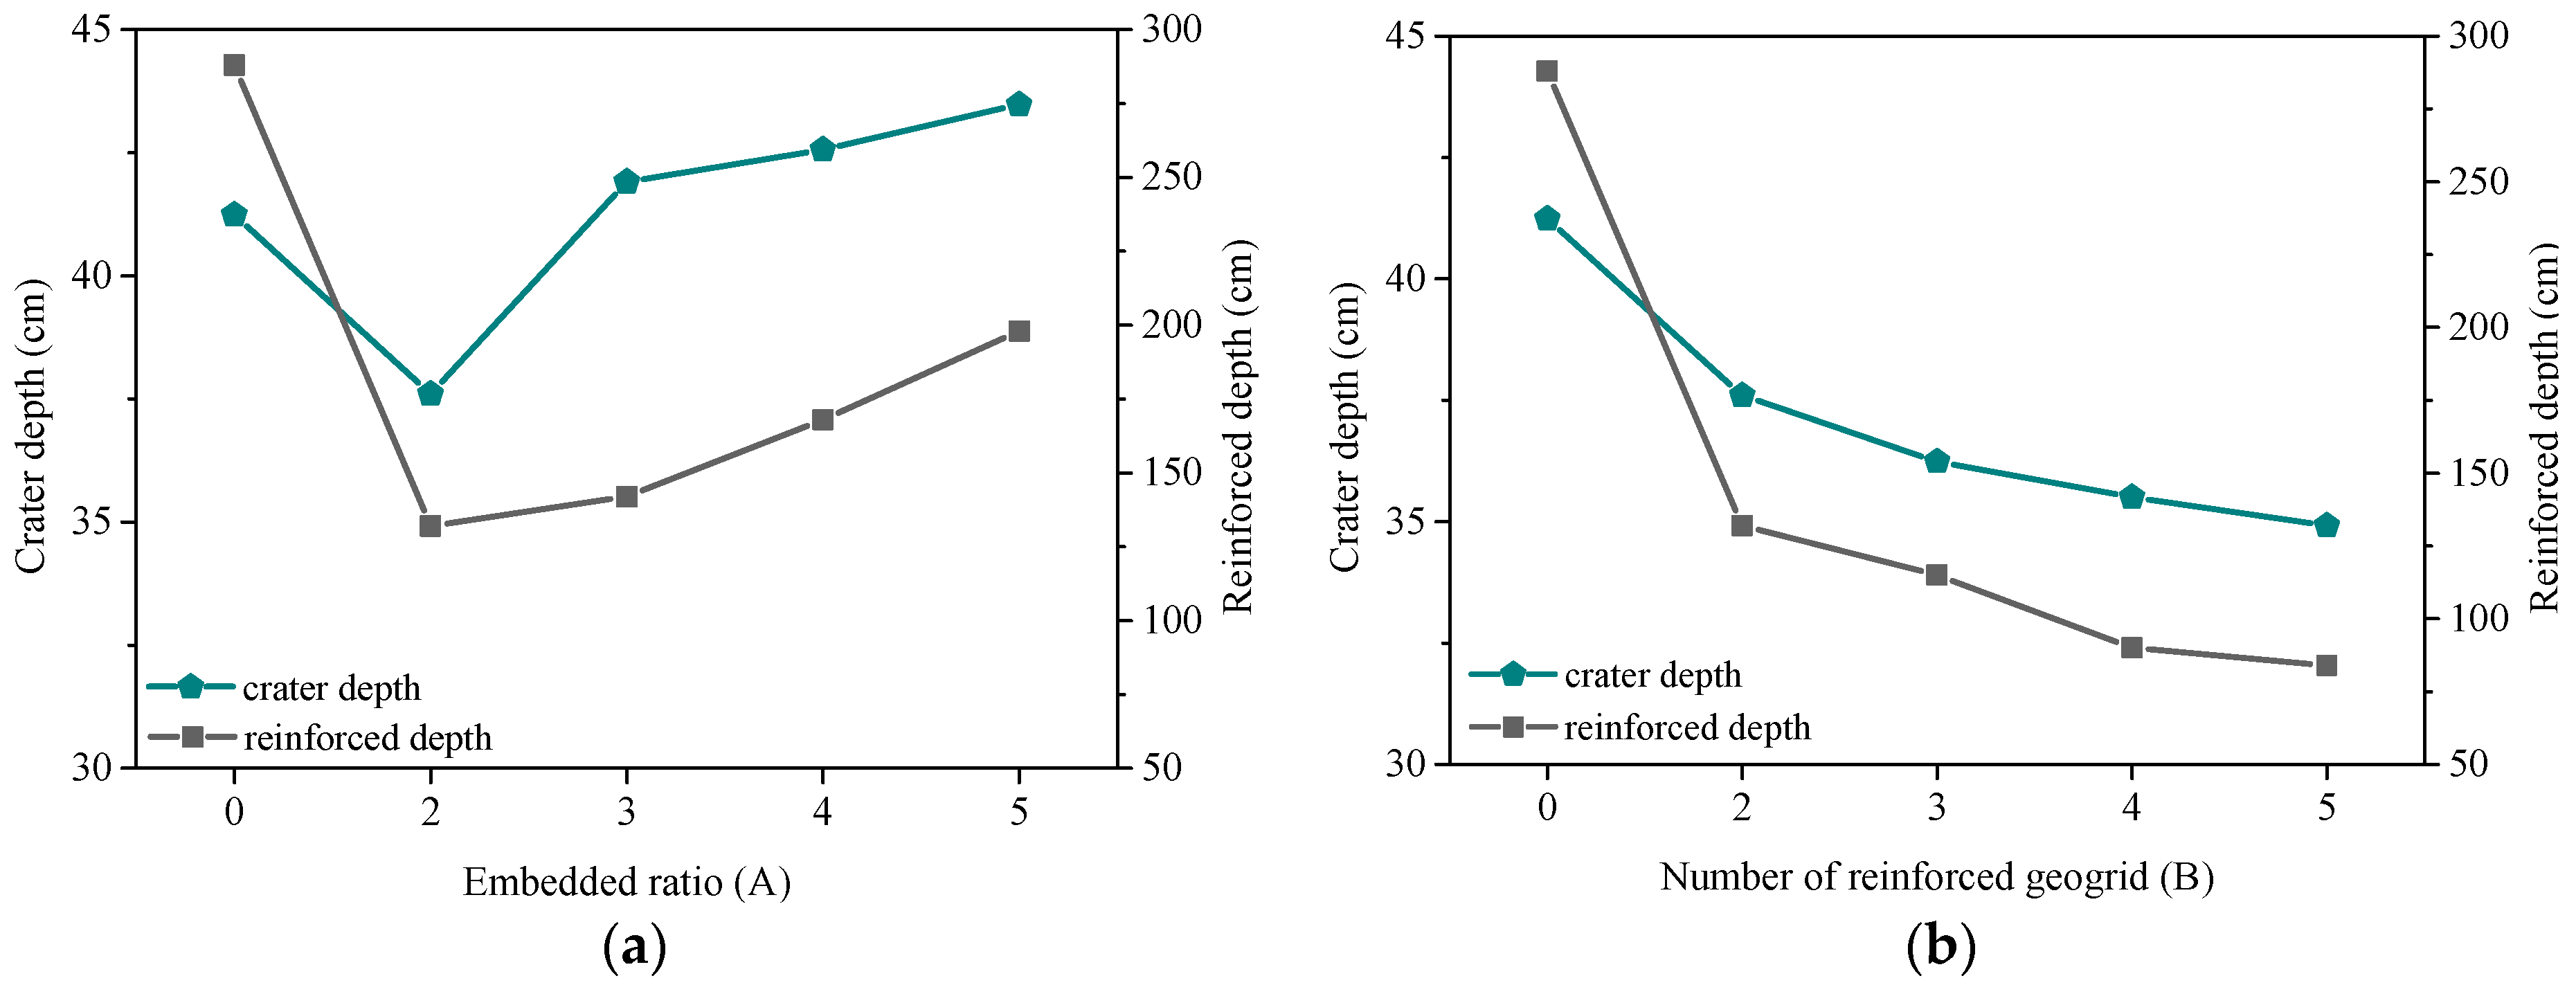
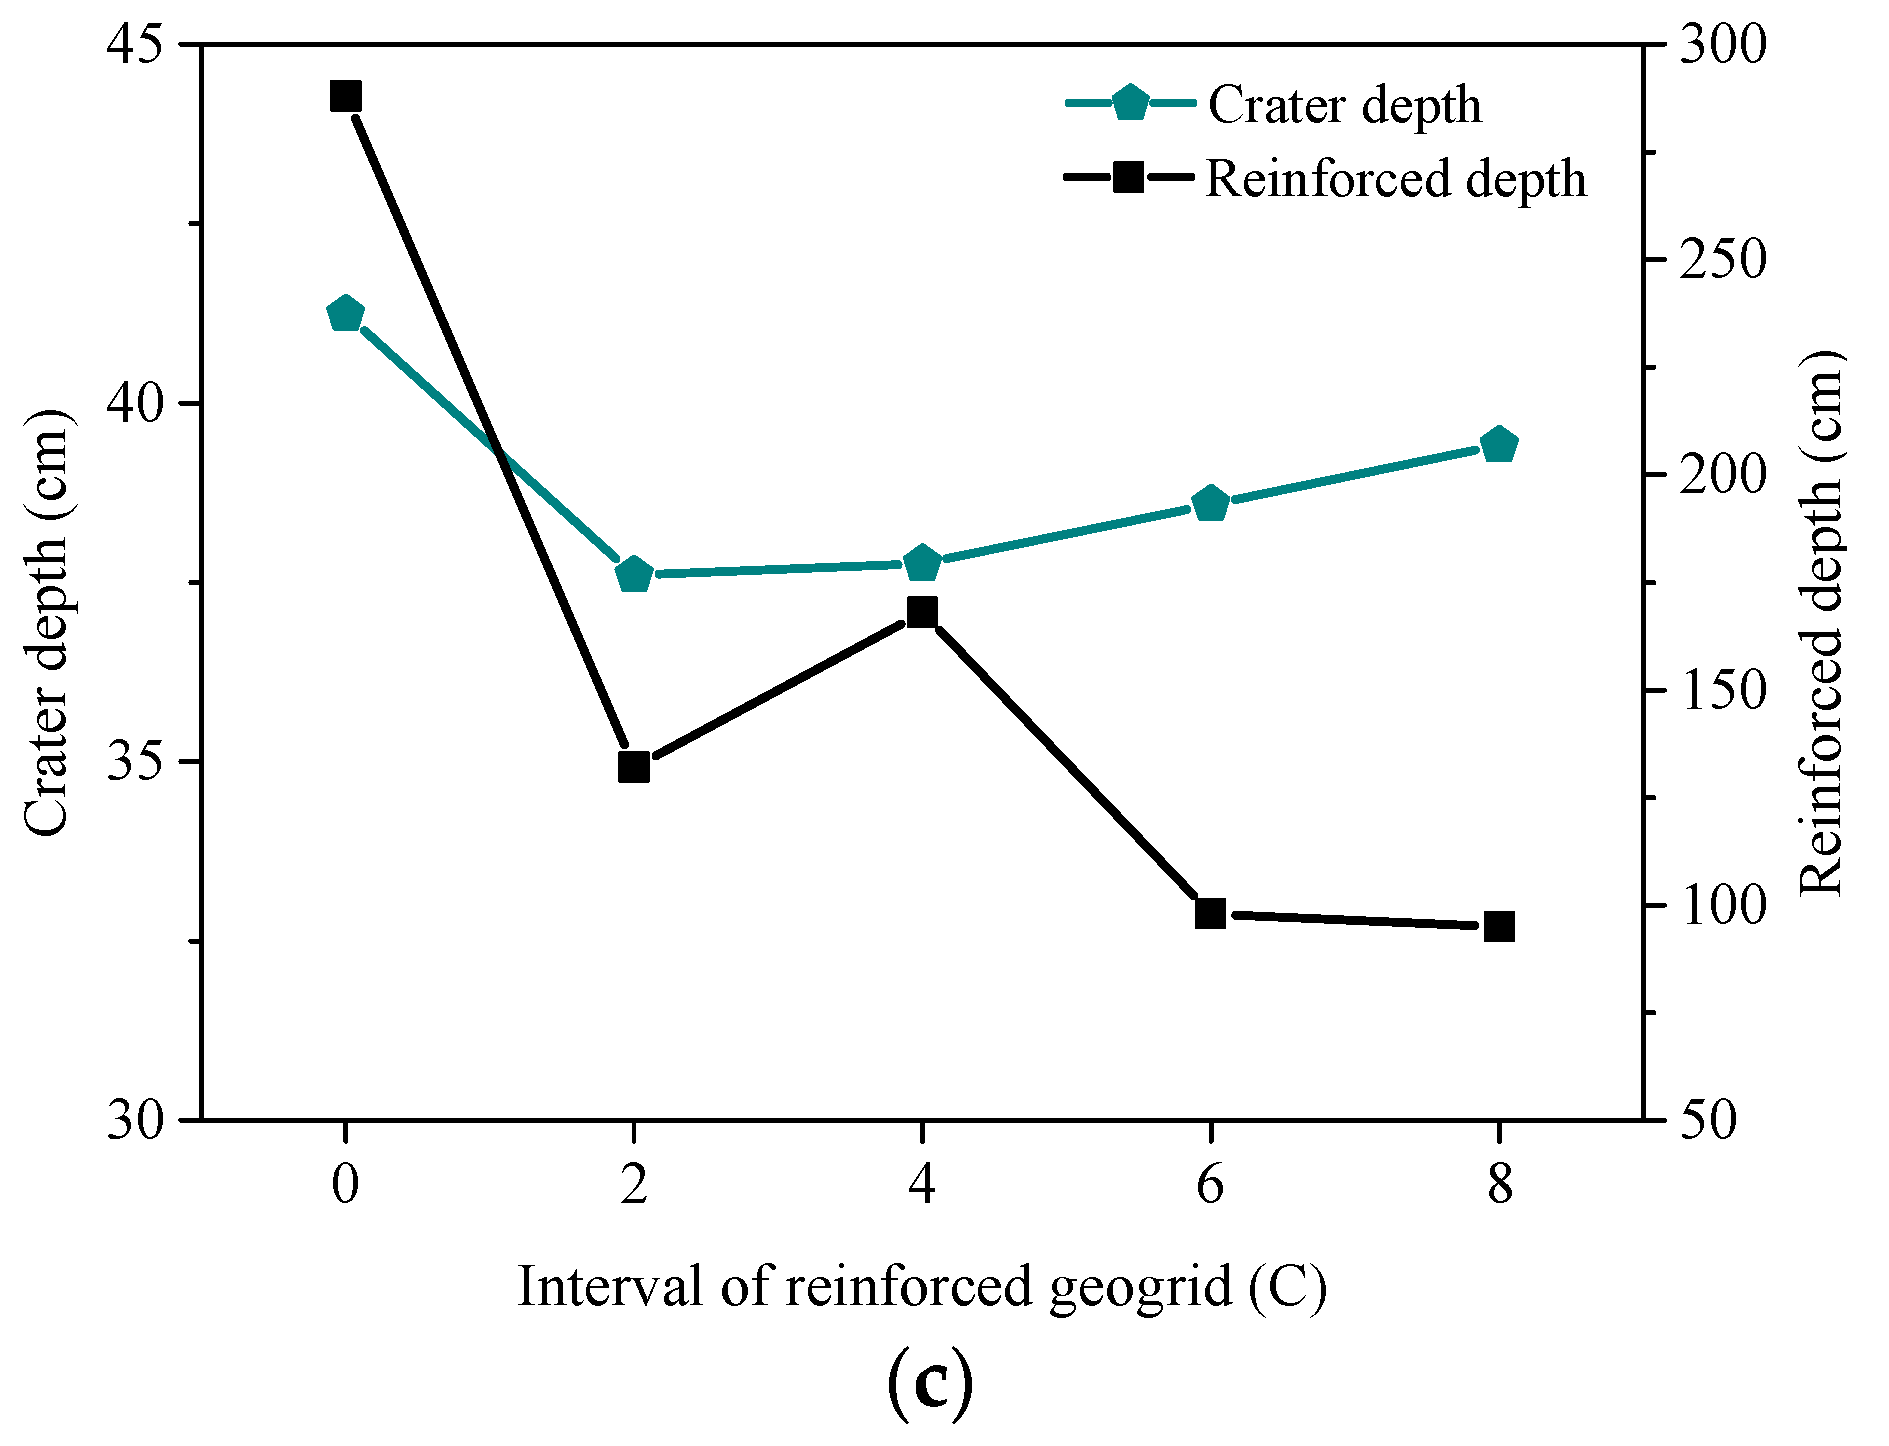
2.5.3. Crater Depth and Reinforced Depth

In this paper, when the vertical displacement of a certain depth accounted for 5% of surface subsidence, this depth is regarded as the lower limit of effective reinforced depth. Figure 7a shows the change rule of crater depth and effective reinforced depth against A. When the geogrid is buried shallowly (A1), the soil between the surface and the geogrid is subjected to vertical pressure under compaction, and the reinforcement acts as a barrier to deformation of the upper soil, resulting in shallower crater depth. With the increase of embedded ratio (A2), the crater depth is inclined to approach that of the unreinforced condition. As A continues to increase, the stress diffusion effect of the geogrid will decrease the scope of stress in the soil above the geogrid, resulting in greater settlement. Thus, the crater depth exceeds that of unreinforced condition. However, the crater depth will not increase indefinitely; it will be stable when A reaches a certain value. Additionally, the increase rate of effective reinforced depth decreases gradually with the increase of A and, finally, effective reinforced depth achieves stability, which is mainly related to the vertical constraint of geogrid. When A is 2, the crater depth and effective reinforced depth decreases linearly with the increase of B (Figure 7b). As shown in Figure 7c, C has a certain influence on the depth of crater depth and the effective reinforced depth. When the interval is 4 cm, the crater depth is approximately 37.76 cm and the effective reinforced depth is about 168 cm. However, if the interval exceeds 4 cm, crater depth increases with it until their values almost achieve that of the unreinforced condition (39.41 cm), but the effective reinforced depth decreases. Therefore, the best option of C should be 2 cm.

2.5.4. Deflection and Stress
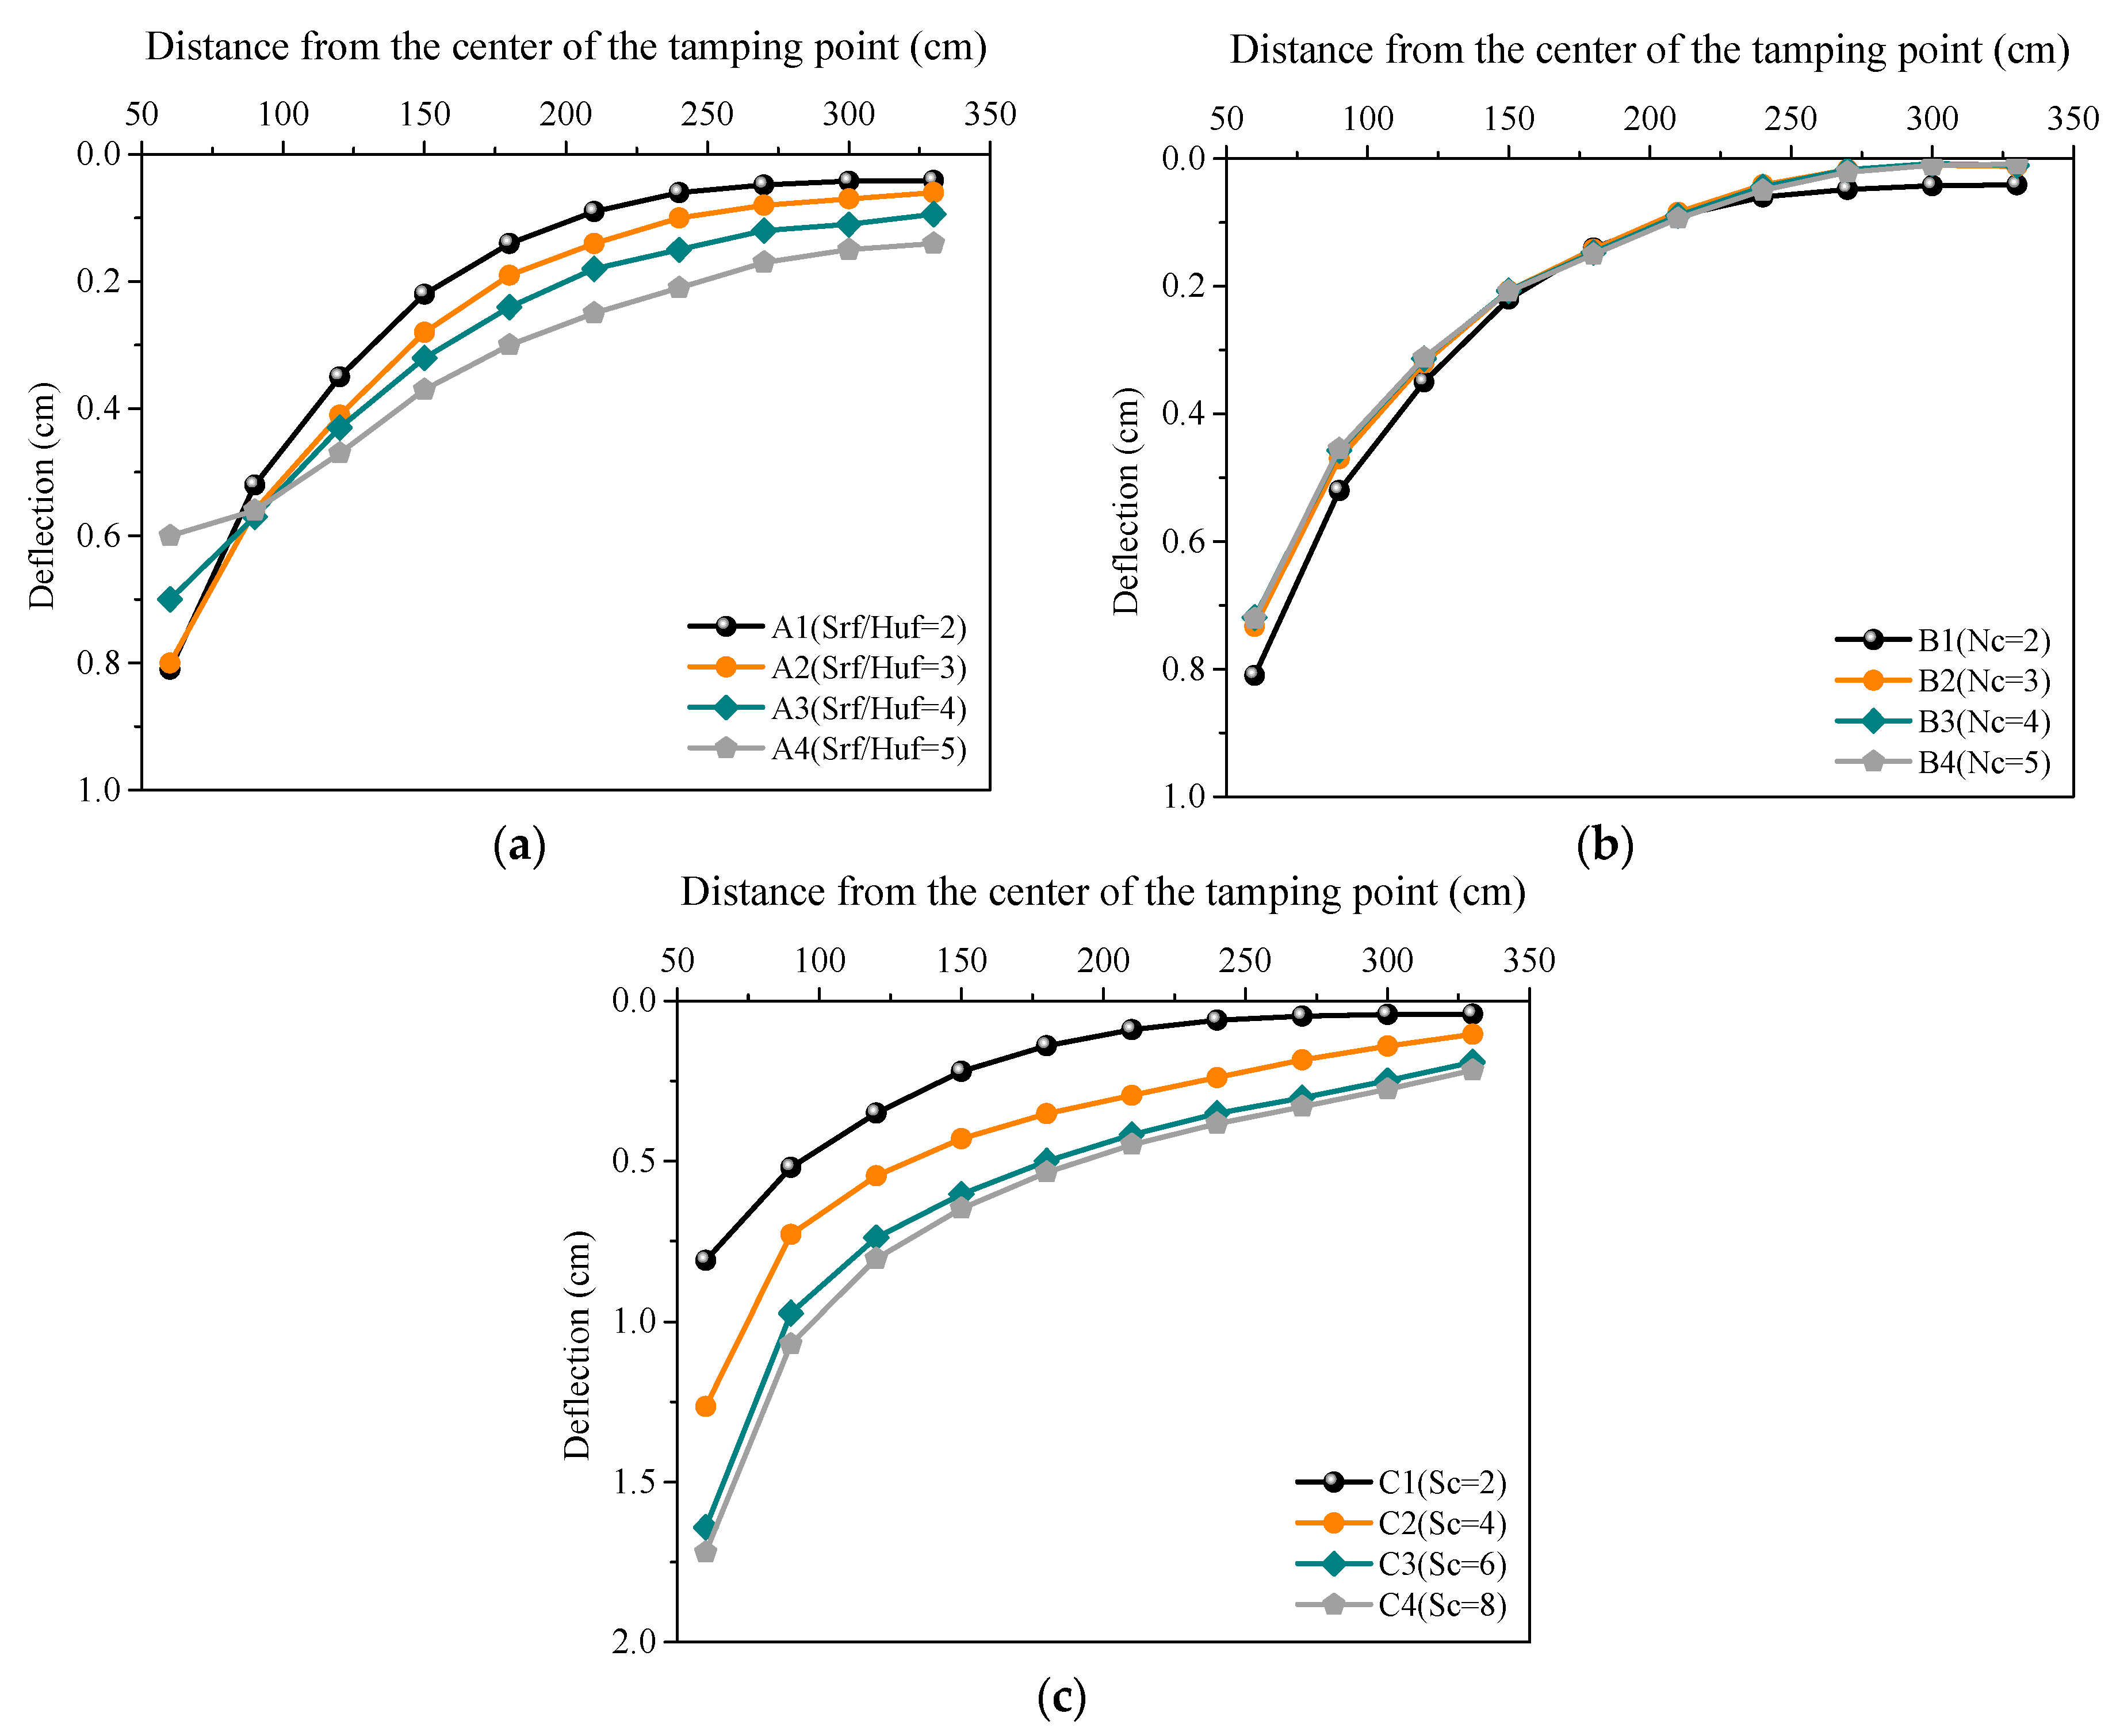
As shown in Figure 8, the deflection decreases exponentially with the increase of distance from the tamping point. Their relationship can be expressed as an exponential equation (Equation (3)). Among them, the deflection increases gradually with the increase of A (Figure 8a) or C (Figure 8c).
S g = a e b + c ,
where S g is the deflection of first reinforced geogrid, b is the distance from the tamping point, and a and c are empirical fit constant.
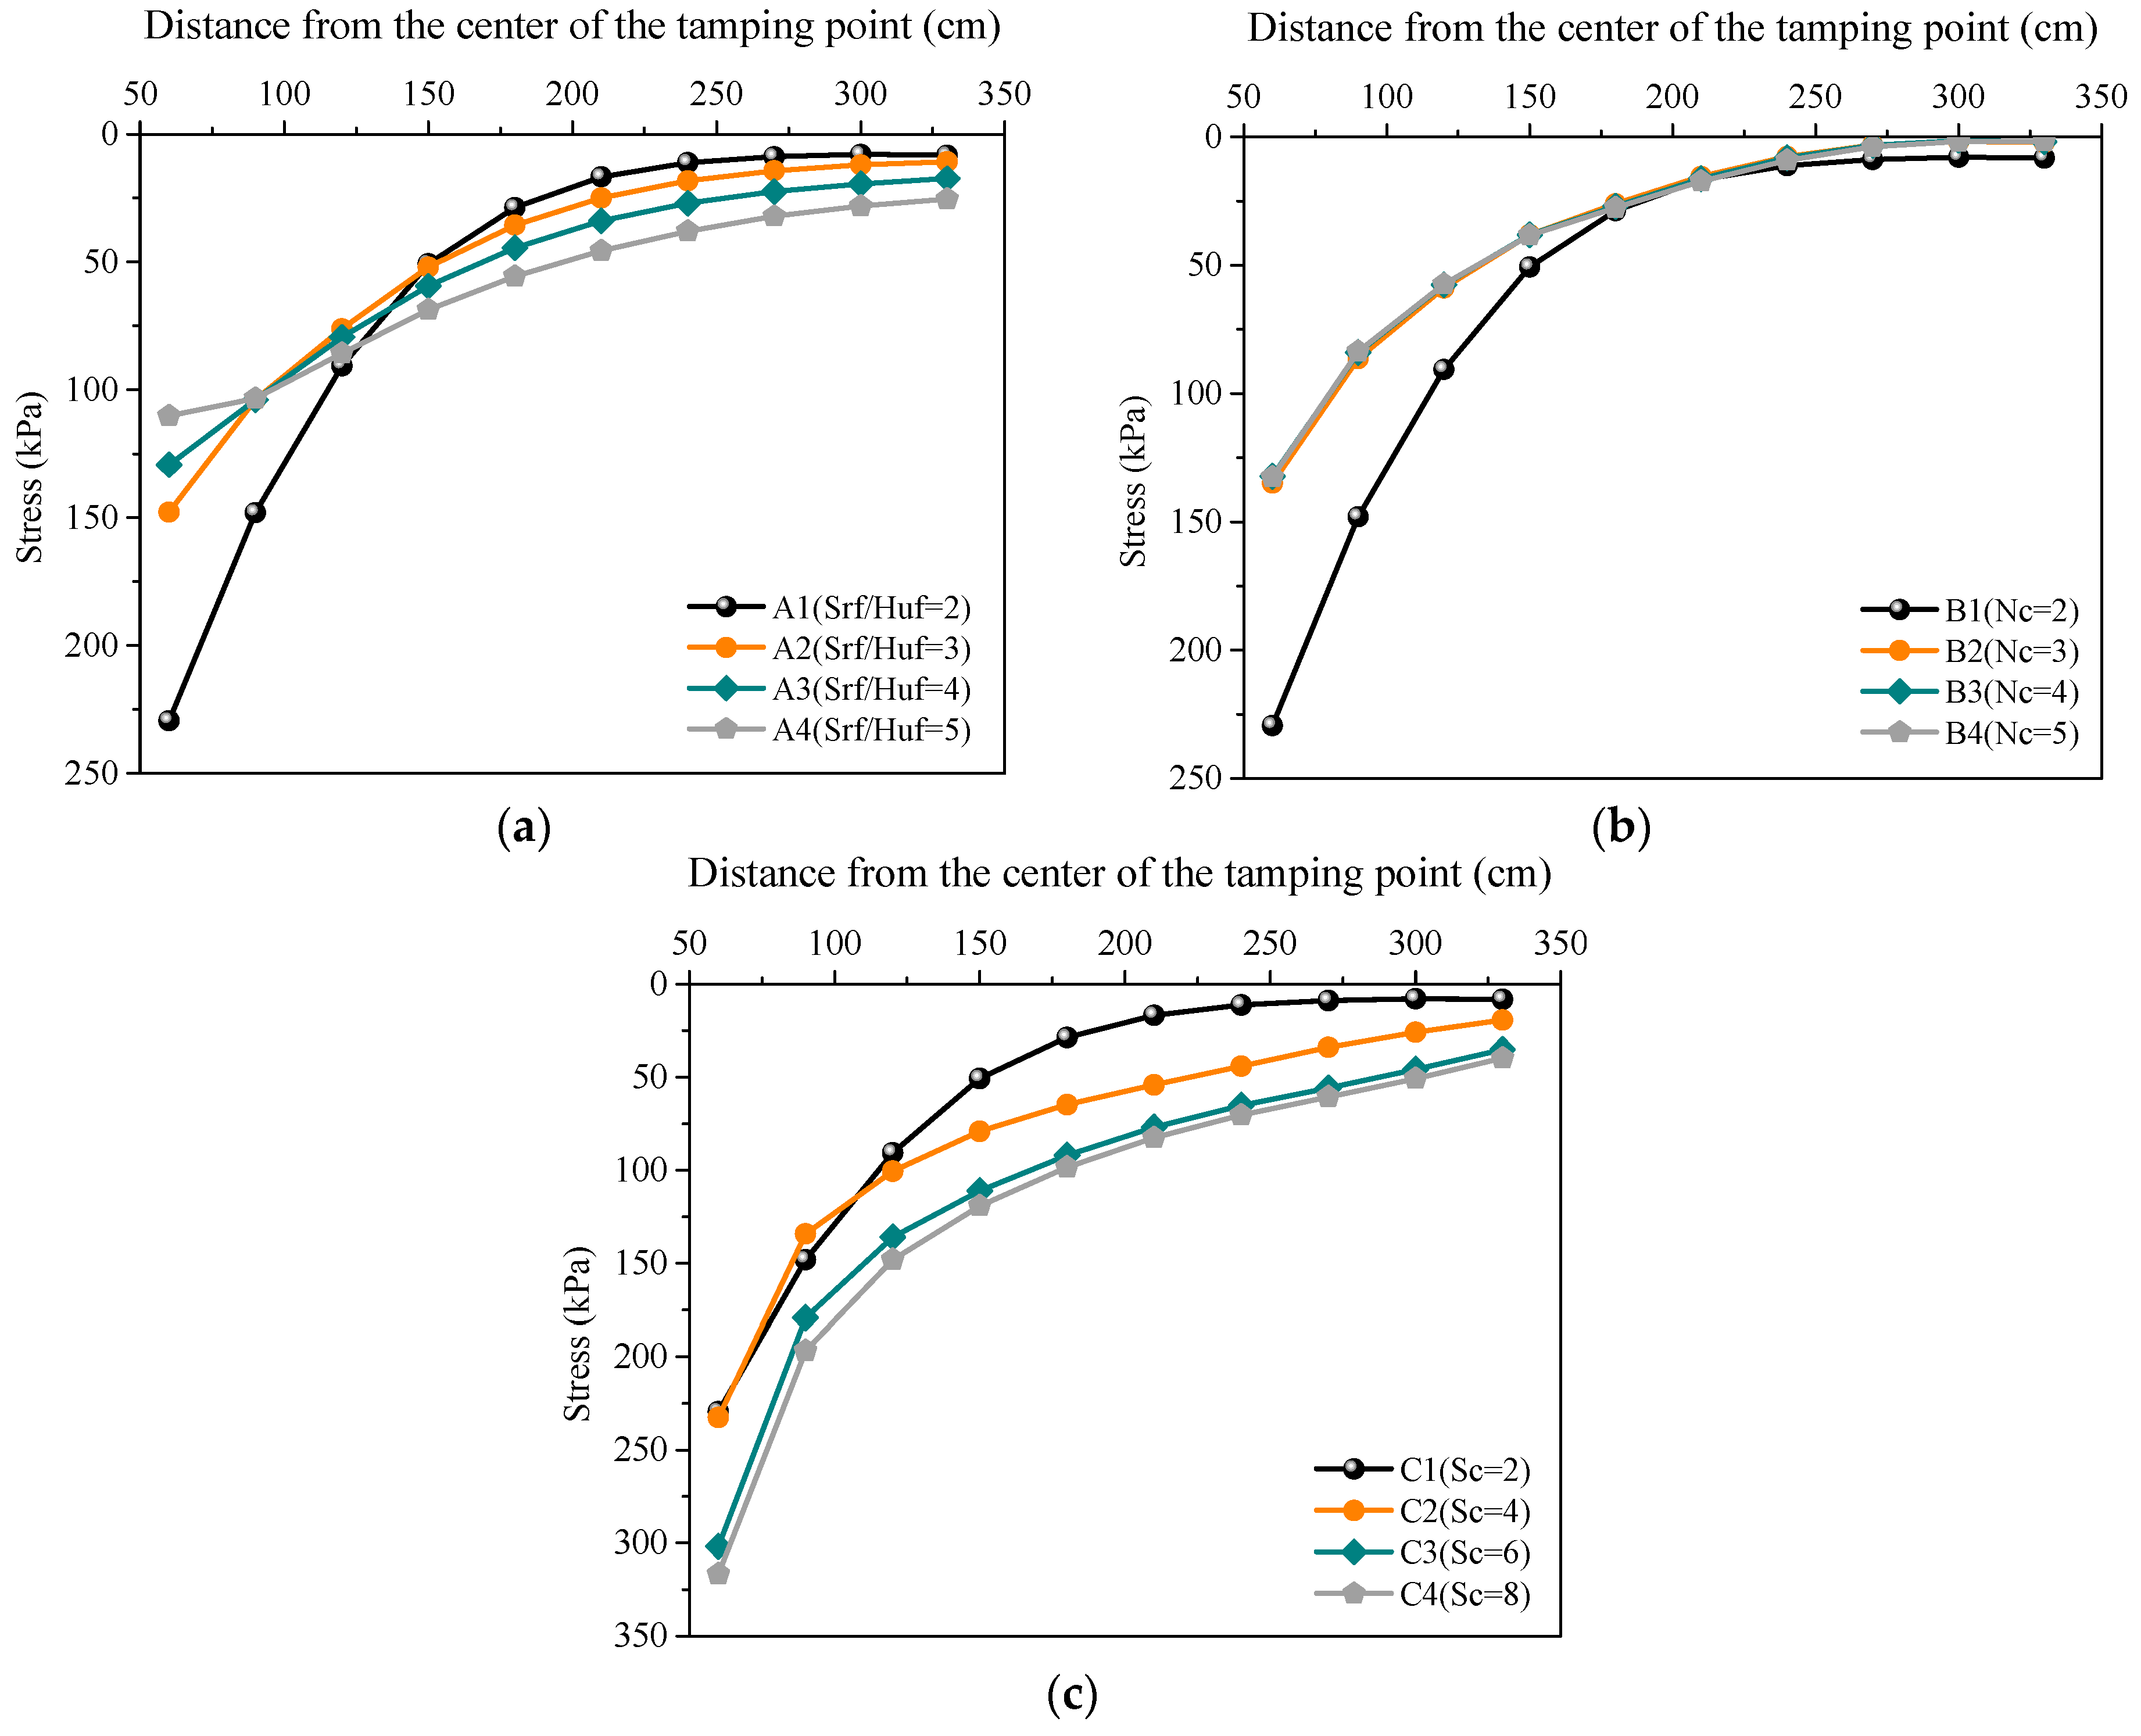
Figure 9a shows that the closer the geogrid is to the tamping point, the greater the strain. The stress increases gradually with the increase of A. The main reason is that the thicker the soil above the geogrid, the greater the impact energy, which leads to a large strain distribution as well as lateral deformation of geogrid. As shown in Figure 9b, B has little effect on the stress distribution of first reinforced layer, the variation trends of strain distribution are almost the same case with each other. On the horizontal direction, between 0 and 330 cm away from the tamping point, the stress is exponentially decreased. Figure 9c shows the strain increases with interval increasing and decrease greatly with increasing horizontal distance away from tamping point. Since it is harmful to have a bigger stress on the geogrid, a smaller interval should be selected to prevent the yield failure by excessive displacement of reinforced geogrid.
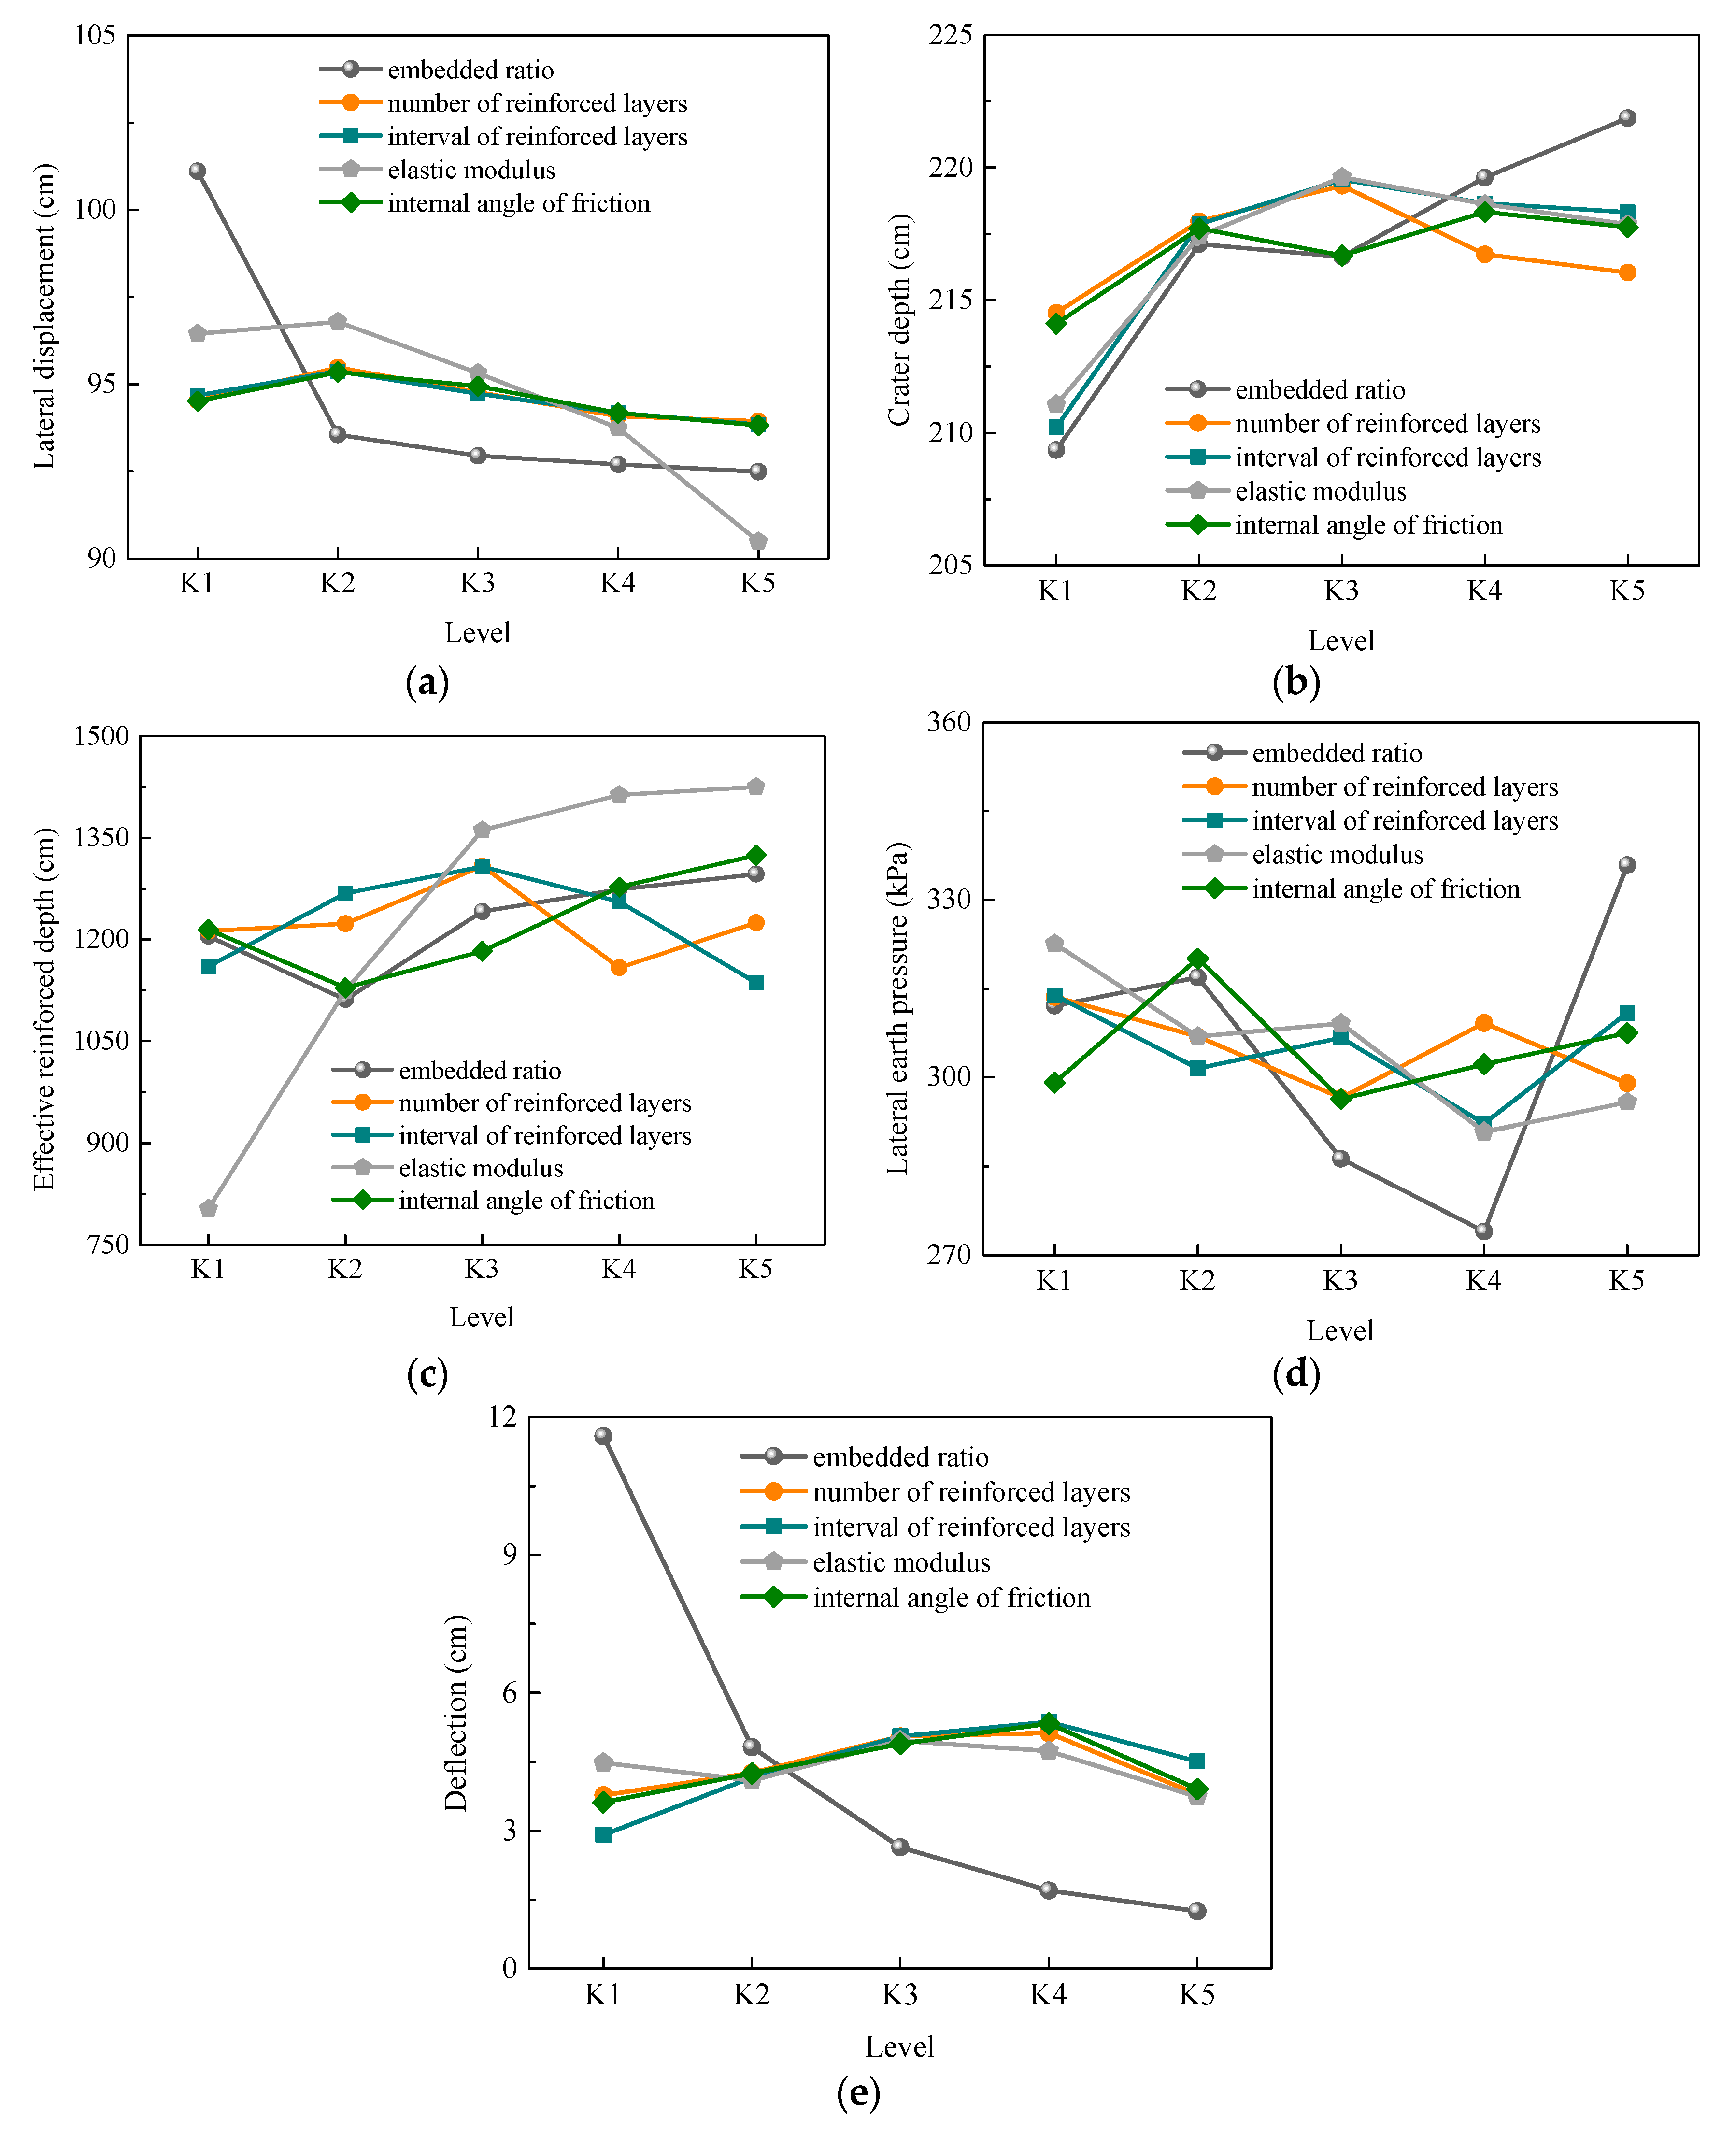
Through the control variable method, the variation on these evaluating indicators of reinforced soil under dynamic compaction are obtained. The deformation characteristics of the reinforced foundation and the stress state of the geogrid under dynamic compaction are analyzed and optimized by model experiment. Unfortunately, the model experiment results only reflect the influence of a single factor on the evaluating indicators. However, for a specific field project, there are many influencing factors for the evaluating indicators, and the degree of influence of each factor on the evaluating indicators is different. Therefore, how to unify the influence of these factors on evaluating indicators is a problem that needs to be paid more attention. Range analysis is a common method for test results calculated by the orthogonal experimental method, which can find out the key influencing factors and determine the optimal value of influencing factors. In this study, range analysis and variance analysis are employed to analyze the experimental results. The analyses’ results are discussed in the next chapter.

3. Parameter Optimization

3.1. Experimental Design and Results

Various factors potentially affect the influence of geogrid reinforcement such as effective reinforced depth, crater depth, lateral displacement, lateral earth pressure, and deflection of first reinforced geogrid. Hence, the optimization of the design parameters of the reinforced geogrid is a critical prospect in engineering practice. Since reinforced geogrid properties also have certain influence on model experiment results, the elastic modulus and internal angle of friction are also taken into account in this chapter. Thus, the effect of different embedded ratio of reinforced geogrid, number of reinforced layers, interval of reinforced layers, elastic modulus, and internal angle of friction were investigated by orthogonal analysis. The orthogonal experimental scheme was designed with five factors at five levels (Table 6). By adopting the L25(55) orthogonal table for 25-group scheme arrangement, the plan of orthogonal design is shown in Table 7, in which the factors A, B, C, D, and E are embedded ratio of reinforced geogrid, number of reinforced layers, interval of reinforced layers, elastic modulus of reinforced geogrid, and internal angle of friction, respectively. The five values of A are 2, 3, 4, 5, and 6, five values of B are 2, 3, 4, 5, and 6, five values of C are 2 cm, 4 cm, 6 cm, 8 cm, and 10 cm, five values of D are 25, 5, 1, 0.2, and 0.04, and five values of E are 10°, 20°, 30°, 40°, and 50°.
Furthermore, the values of the five aspects of each experiment selected by orthogonal experiment were defined as evaluating indicators and acquired by numerical simulation, which is effective reinforced depth, crater depth, lateral displacement, lateral earth pressure, and deflection of first reinforced geogrid. The results are presented in Table 7.

3.2. Numerical Method

The finite difference method (FLAC3D) is applied in simulating reinforced foundation on dynamic compaction. In this paper, the size of the model foundation is 1.5 m long, 1.5 m wide, and 1 m high. A circular load with a radius of 0.06 m was applied to the upper center of the model foundation. The mechanical parameters of the soil sample are shown in Table 8, the specifications of the geogrid are shown in Table 9, and the relationship between bulk modulus, shear modulus, and elastic modulus is calculated by the following equations (Equations (4) and (5)).
K = E 3 ( 1 2 ν ) ,
G = E 2 ( 1 + ν ) ,
where, E is elastic modulus. ν is Poisson ratio. K and G is bulk modulus and shear modulus.
Qian Jiahuan (1986) changed Scott’s formula and put forward the elastic model. Based on this elastic model, Liu Hanglong (2009) improved the form of impact load. Thus, the calculation methods of stress and loading duration are obtained (Equations (6) and (7)). In addition, the natural frequency of the model is obtained by calculation of undamped natural vibration. The parameter of dynamic analysis is shown in Table 10.
σ = ( 1 S S ) V S π r 2 ω sin ( ω t ) ,
T = 2 t 0 = π ω ,
where S and S are elastic constants under loading and unloading conditions, S = 2 r E 1 ν 2 , S = 2 r E s u l 1 ν 2 . E and E s u l are elastic modulus under loading and unloading conditions. V is initial velocity. ω is loading angular frequency, ω = S / M . M is tamper quality. T is action period.

3.3. Analysis

3.3.1. Analysis Method

R is the range value for the lateral displacement, crater depth, effective reinforced depth, lateral earth pressure, and deflection of the first reinforced layer. R represents the influence degree of the factors on the target parameters.
R = K i max K i min ,
where, K i is the average value of experimental value for each factor in the i-th value, i = 1,2,3,4.
K h is the sum of experimental value for each factor in the h-th level, h = 1,2,3,4. T is the sum of the experimental value for each experiment scheme. C is correction. S j is the square of deviance of each factor (j is A, B, C and D). S T is total square of deviance. S c is square of deviance of error.
C = T 2 / n ,
S j = ( K 1 2 + K 2 2 + K 3 2 + K 4 2 ) / 4 C ,
S T = k = 1 16 y k 2 C ,
S e = S T S A S B S C S D ,
The ratio of the square of deviance of each factor to the square of deviance of error is defined as F . F represents the influence degree of each factor on the target parameters.
F = S j / f j S e / f e
where S j and f j are the square of the deviance and degree of freedom of each factor. S e and f e is total square of deviance and degree of freedom of error.

3.3.2. Range Analysis and Variance Analysis

According to the experimental data in Table 9, the average value of lateral displacement, crater depth, effective reinforced depth, lateral earth pressure, and deflection of the first reinforced layer at different levels are shown in Figure 10. Then, the lateral displacement, crater depth, effective reinforced depth, lateral earth pressure, and deflection of the first reinforced layer are analyzed by range analysis and variance analysis. The range and variance (“F” range) of the lateral displacement, lateral earth pressure, deflection of first reinforced layer, crater depth, and effective reinforced depth are shown in Figure 11. Figure 11 shows that the influence law of each factor on the target parameters in range analysis is basically the same as that in variance analysis.
Figure 10 and Figure 11 show that:
In the range analysis and variance analysis of the lateral displacement, the influence degree of each factor on the lateral displacement is in the order: embedded ratios > elastic modulus > number of reinforced layers > internal angle of friction > interval of reinforced layer. Among them, the embedded ratio has the greatest influence on the lateral displacement. The influence degree of friction angle and interval of reinforced geogrids is relatively small. With the increase of embedded ratio, the lateral displacement decreases gradually. The reason is that the constraining effect on settlement decreases gradually with the increase of embedded depth. The optimal solution of the lateral displacement is AK1DK2BK2EK2CK2.
In the range analysis and variance analysis of the crater depth, the influence degree of each factor on the crater depth is in the order: embedded ratio > interval of reinforced layers > elastic modulus > number of reinforced layers > internal angle of friction. Among them, the embedded ratio has the greatest influence on the crater depth. The influence degree of the number of reinforced layers and friction angle is relatively small. With the increase of embedded ratio, the crater depth increases gradually. The reason is that the constraining effect on settlement decreases gradually with the increase of embedded depth. The optimal solution of the crater depth is AK5CK3DK3BK3EK4.
In the range analysis and variance analysis of the effective reinforced depth, the influence degree of each factor on the effective reinforced depth is in the order: elastic modulus > internal angle of friction > embedded ratio > interval of reinforced layers > number of reinforced layers. Among them, the elastic modulus has the greatest influence on the effective reinforced depth. The influence degree of number of reinforced layers is relatively small. With the increase of the number of reinforced layers, the effective reinforced depth increases first and then decreases. With the decrease of elastic modulus, the effective reinforced depth increases gradually. With the increase of interval, the lateral earth pressure increases first and then decreases. When the number of reinforced layers is four, the interval of reinforced layers is 4 cm, or the elastic modulus is 1 Gpa, the effective reinforced depth has the maximum value. The optimal solution of the effective reinforced depth is DK5EK5AK5CK3BK3.
In the range analysis and variance analysis of lateral earth pressure, the influence degree of each factor on the lateral earth pressure is in order: embedded ratio > elastic modulus > internal angle of friction > interval of reinforced layers > number of reinforced layers. Among them, the embedded ratio has the greatest influence on the lateral earth pressure. The influence degree of number and interval of reinforced layers is relatively small. When the number of reinforced geogrids is two, the interval of reinforced geogrids is 2 cm, the lateral earth pressure has the maximum value. The optimal solution of the lateral earth pressure is AK5DK1EK2CK1BK1.
In the range analysis and variance analysis of the deflection of the first reinforced layer, the influence degree of each factor on the deflection of the first reinforced layer is in the order: embedded ratio > interval of reinforced layers > internal angle of friction > number of reinforced layers > elastic modulus. Among them, the embedded ratio has the greatest influence on the deflection of the first reinforced layer. The influence degree of elastic modulus is relatively small. With the increase of embedded ratio, the deflection of the first reinforced layer decreases gradually. The reason is that the soil deformation at each depth gradually decreases with the increase of depth. With the increase of number of reinforced layers, interval of reinforced layers, and internal angle of friction, the deflection of the first reinforced layer is increases first and then decreases. The optimal solution of the deflection of first reinforced layer is AK1CK4EK4BK4DK3.

3.3.3. Comprehensive Analysis

The results of the orthogonal experiments show that the optimal solution of the lateral displacement, crater depth, effective reinforced depth, lateral earth pressure and deflection of the first reinforced layer is AK1DK2BK2EK2CK2, AK5CK3DK3BK3EK4, DK5EK5AK5CK3BK3, AK5DK1EK2CK1BK1, and AK1CK4EK4BK4DK3, respectively. According to the sequence of influence degree of each factor and best value combination, comprehensive balancing of the optimal solution in terms of the five characteristics of geogrids was carried out. Then, we selected the best value of the greatest influence factor on the target parameters as the best value of the factor. Finally, the optimal solution of the geogrid which is most favorable for the five characteristics is put forward. The analysis shows that the best values of factor A, factor B, factor C, factor D, and factor E are K5, K3, K3, K3, and K4, respectively. Based on above analysis, the comprehensive optimal combination is AK5BK3CK3DK3EK4.

3.3.4. Multiple Linear Regression

To provide predictive values of evaluating indicators after reinforcement design has been done, or suggestions of parameters of reinforcement when the specific evaluating indicators are required, linear regression between evaluating indicators and factors was performed using SPSS. The regression equations are presented in Table 11. Noted that the lateral earth pressure is not listed.
In Table 11, X 1 , X 3 , and X 4 stand for embedded ratio, interval of reinforced layers, and elastic modulus of reinforced geogrid, respectively.
To study the effect of dynamic compaction, a test area is provided for field engineering. The crater depth per drop during the trial tamping was monitored. The initial crater depth was basically distributed between 40 cm and 50 cm, which was close to the value predicted by the regression equation. Therefore, it can be concluded that the reinforcement parameters can be determined by regression equation for the two main indexes of crater depth and effective reinforced depth.

4. Conclusions

The following conclusions can be drawn from this paper:
(1)
Geogrid reinforcement has a significant constraining effect on soil, but the increasing interval or number of reinforced layers have little effect on the constraining effect. Within a certain range below the surface, the constrained displacement decreases gradually with the increase of depth.
(2)
Based on the experimental results, as the depth increases, the constraining effect of earth pressure weakens. Above the depth of 3.25 m, the vertical earth pressure decreases sharply. Below −3.25 m, the constraining effect is so weak that it is consistent with that of the unreinforced condition. In addition, geogrid reinforcement significantly constrains lateral earth pressure, but all numbers (2, 3, 4, and 5) and all intervals (2 cm, 4 cm, 6 cm, and 8 cm) of reinforced layers have little effect on lateral earth pressure.
(3)
The crater depth will also stabilize when the embedded ratio reaches a certain value. The crater depth and effective reinforced depth gradually increase with the increase of embedded ratio and interval of reinforced layers until the values are almost that of unreinforced condition (41.24 cm and 288 cm), and gradually decreases with the increase of number of reinforced layers. Therefore, the interval of reinforced layers should be greater than 2 cm.
(4)
The deflection and stress of first reinforced layer increases with the increase of embedded ratio, number of reinforced layers, and interval of reinforced layers. The number of reinforced layers has little effect on the deflection of the first reinforced layer, while it reduces the stress distribution. Thus, a smaller interval of reinforced layers should be selected to prevent yield failure by excessive deflection and stress of the reinforced layer.
(5)
Based on range analysis and variance analysis, the comprehensive optimal combination is AK5BK3CK3DK3EK4.
(6)
Multiple linear regression between the four evaluating indicators and five factors was performed. It provided a guiding basis for related foundation engineering, as well as a design method for geogrid reinforcement.

Author Contributions

G.Z. wrote and edited the manuscript. F.S. reviewed the manuscript. Y.Y. provided invaluable insights to the discussion. All authors have read and approved the final manuscript.

Funding

This research was funded by the National Key Research and Development Program of China, grant Nos.2017YFC0805008”, the National Nature Science Foundation of China (NSFC) (Grant Nos. 41472278).

Acknowledgments

The writers would like to thank Mingming Li for her instructive advice and useful suggestions on my thesis. I love you so much.

Conflicts of Interest

The authors declare no conflict of interest.

References

  1. Mayne, P.W.; Jones, J.S.; Dumas, J.C. Ground response to dynamic compaction. J. Geotech. Eng. 1984, 110, 757–774. [Google Scholar] [CrossRef]
  2. Lukas, R.G. Dynamic compaction engineering considerations. Grouting/soil improvement and geosynthetics. Geotech. Spec. Publ. 1992, 30, 940–953. [Google Scholar]
  3. Menard, L.; Broise, Y. Theoretical and practical aspect of dynamic consolidation. Geotechnique 1975, 25, 3–17. [Google Scholar] [CrossRef]
  4. Feng, S.J.; Tan, K.; Shui, W.H.; Zhang, Y. Densification of desert sands by high energy dynamic compaction. Eng. Geol. 2013, 157, 48–54. [Google Scholar] [CrossRef]
  5. Michalowski, R.L.; Nadukuru, S.S. Static fatigue, time effects, and delayed increase in penetration resistance after dynamic compaction of sands. J. Geotech. Geoenviron. Eng. 2012, 138, 564–574. [Google Scholar] [CrossRef]
  6. Lukas, R.G. Densification of loose deposits by pounding. J. Geotech. Eng. Div. 1980, 106, 435–446. [Google Scholar]
  7. Feng, S.J.; Shui, W.H.; Tan, K. Field evaluation of dynamic compaction on granular deposits. J. Perform. Constr. Facil. 2011, 25, 241–249. [Google Scholar] [CrossRef]
  8. Rollins, K.M.; Kim, J. Dynamic compaction of collapsible soils based on US case histories. J. Geotech. Geoenviron. Eng. 2010, 136, 1178–1186. [Google Scholar] [CrossRef]
  9. Liu, J.H.; Yuan, J.B.; Xiong, H.; Chen, W. Dynamic compaction treatment technology of red clay soil embankment in southern mountain. J. Cent. South Univ. Technol. 2008, 15, 50–57. [Google Scholar] [CrossRef]
  10. Zekkos, D.; Kabalan, M.; Flanagan, M. Lessons learned from case histories of dynamic compaction at municipal solid waste sites. J. Geotech. Geoenviron. Eng. 2013, 139, 738–751. [Google Scholar] [CrossRef]
  11. Poran, C.J.; Rodriguez, J.A. Design of dynamic compaction. Can. Geotech. J. 1992, 29, 796–802. [Google Scholar] [CrossRef]
  12. Bai, B. Study on reconsolidation characteristics of saturated soil. Rock Soil Mech. 2003, 24, 691–695. (In Chinese) [Google Scholar]
  13. Lo, K.W.; Ooi, P.L.; Lee, S.L. Unified approach to ground improvement by heavy tamping. J. Geotech. Eng. 1990, 116, 514–527. [Google Scholar] [CrossRef]
  14. Chow, Y.K.; Yong, D.M.; Yong, K.Y.; Lee, S.L. Dynamic compaction analysis. J. Geotech. Eng. 1992, 118, 1141–1157. [Google Scholar] [CrossRef]
  15. Chow, Y.K.; Yong, D.M.; Yong, K.Y.; Lee, S.L. Dynamic compaction of loose sand deposits. Soils Found. 1992, 32, 93–106. [Google Scholar] [CrossRef]
  16. Chow, Y.K.; Yong, D.M.; Yong, K.Y.; Lee, S.L. Dynamic compaction of loose granular soils: Effect of print interval. J. Geotech. Eng. 1994, 120, 1115–1133. [Google Scholar] [CrossRef]
  17. Zou, W.L.; Wang, Z.; Yao, Z.F. Effect of dynamic compaction on placement of high-road embankment. J. Perform. Constr. Facil. 2005, 19, 316–322. [Google Scholar] [CrossRef]
  18. Feng, S.J.; Shui, W.H.; Gao, L.Y.; He, L. Field studies of the effectiveness of dynamic compaction in coastal reclamation areas. Bull. Eng. Geol. Environ. 2010, 69, 129–136. [Google Scholar] [CrossRef]
  19. Das, B.M.; Maji, A.; Shin, E.C. Foundation on geogrid-reinforced sand effect of transient loading. Geotext. Geomembr. 1998, 16, 151–160. [Google Scholar] [CrossRef]
  20. Nazzal, M.; Abu-Farsakh, M.; Mohammad, L. Laboratory characterization of reinforced crushed limestone under monotonic and cyclic loading. J. Mater. Civ. Eng. 2007, 19, 772–783. [Google Scholar] [CrossRef]
  21. Esmaeili, M.; Naderi, B.; Neyestanaki, H.K.; Khodaverdian, A. Investigating the effect of geogrid on stabilization of high railway embankments. Soils Found. 2018, 58, 319–332. [Google Scholar] [CrossRef]
  22. Gu, J. Computational Modeling of Geogrid Reinforced Soil Foundation and Geogrid Reinforced Base in Flexible Pavement. Ph.D. Thesis, Louisiana State University, Baton Rouge, LA, USA, 2011. [Google Scholar]
  23. Shen, L.S.; Yang, G.Q.; Cheng, H.T.; Zheng, R.J.; Chen, J.C. Optimization technology for geogrid-reinforced subgrade widening projects of highways. Chin. J. Geotech. Eng. 2013, 34, 789–793. [Google Scholar]
  24. Lei, X.L.; Qi, C.M.; Nie, C.L.; Fan, Y. The analysis on the sensitivity of geogrid reinforcement factors in mine-tailing slope. J. Adv. Res. Comput. Sci. 2016, 58, 165–168. [Google Scholar]
  25. Xia, Q.; Wang, X.; Dou, S. Numerical analysis of deformation performance of geogrid-reinforced railway ballast under train load. J. Railw. Eng. Soc. 2016, 33, 24–28. [Google Scholar]
Figure 1. Soil sample: (a) fine sand; (b) result of heavy compaction test.
Applsci 09 03592 g001
Figure 2. Model box and installation of earth pressure cell.
Applsci 09 03592 g002
Figure 3. The vertical displacement under three factors: (a) embedded ratio; (b) number of reinforced layers; (c) interval of reinforced layers.
Applsci 09 03592 g003aApplsci 09 03592 g003b
Figure 4. The vertical displacement under three factors: (a) embedded ratio; (b) number of reinforced layers; (c) interval of reinforced layers.
Applsci 09 03592 g004aApplsci 09 03592 g004b
Figure 5. The vertical earth pressure under different reinforced factors: (a) embedded ratio; (b) number of reinforced layers; (c) interval of reinforced layers.
Applsci 09 03592 g005aApplsci 09 03592 g005b
Figure 6. Lateral earth pressure under different reinforced factors: (a) embedded ratio; (b) number of reinforced layers; (c) interval of reinforced layers.
Applsci 09 03592 g006aApplsci 09 03592 g006b
Figure 7. Crater depth and reinforced depth under different reinforced factors: (a) embedded ratio; (b) number of reinforced layers; (c) interval of reinforced layers.
Applsci 09 03592 g007aApplsci 09 03592 g007b
Figure 8. Deflection of reinforced geogrid under different reinforced factors: (a) embedded ratio; (b) number of reinforced layers; (c) interval of reinforced layers.
Applsci 09 03592 g008
Figure 9. Stress of reinforced geogrids under different reinforced factors: (a) embedded ratio; (b) number of reinforced layers; (c) interval of reinforced layers.
Applsci 09 03592 g009
Figure 10. Average value at different values of (a) lateral displacement; (b) crater depth; (c) effective reinforced depth; (d) lateral earth pressure; (e) deflection of the first reinforced layer.
Applsci 09 03592 g010
Figure 11. Range analysis and variance analysis of the lateral displacement, lateral earth pressure, deflection of the first reinforced layer, crater depth, and effective reinforced depth: (a) Range analysis; (b) “F” value of factors.
Applsci 09 03592 g011
Table 1. Mechanical properties of the soil sample.
Unit Weight (kN/m3)Specific GravityVoid RatioCohesion (kPa)Internal Friction Angle (°)Optimum Moisture Content (%)Maximum Dry Density (g/cm3)Poisson Ratio
18.02.640.530355.691.760.3
Table 2. Physical specifications of earth pressure cell.
Measuring Range (MPa)Resolution Ratio %F·SInsulation Resistance (MΩ)
0.1≤0.05≥200
Table 3. Physical specifications of strain gauge.
Sensitive Grid (mm)Base Size (mm)Applicable Temperature (°C)
2.8 × 2.06.4 × 3.5−30~+80
Table 4. Code for three factors at four values.
LevelEmbedded RatioNumber of Reinforced LayersInterval of Reinforced Layers (cm)
ValueCodeValueCodeValueCode
12A12B12C1
23A23B24C2
34A34B36C3
45A45B48C4
Table 5. The plan of experiment design.
GroupEmbedded RatioNumber of Reinforced LayersInterval of Reinforced Layers
1222
2322
3422
4522
5222
6232
7242
8252
9222
10224
11226
12228
Table 6. The factor and the factor level.
LevelFactors
Embedded RatioNumber of Reinforced LayersInterval of Reinforced Layers (cm)Elastic Modulus (GPa)Internal Angle of Friction (°)
12222510
2334520
3446130
45580.240
566100.0450
Table 7. The plan and results of orthogonal design.
GroupABCDELateral Displacement (cm)Crater Depth (cm)Effective Reinforced Depth (cm)Lateral Earth Pressure (kPa)Deflection of First Reinforced Geogrid (cm)
1222251020.6137.7413467.41.61
223452021.3542.67213.265.42.09
324613020.5643.6277.560.62.95
42580.24019.7242.84288.357.62.98
526100.045018.8742.5291.861.11.96
632414018.8244.1327564.71.06
73360.25018.6244.09290.760.90.89
83480.041018.0344.02286.4560.94
93510252019.0442.8872.372.41.28
1036253019.044218762.90.65
114260.042017.8743.76289.460.80.44
12438253019.0342.84170.156.90.78
13441054018.8643.89232.455.70.66
1445215018.742.8272.361.10.33
154640.21018.4943.35277.151.80.43
1652855018.7944.29242.955.30.41
17531011018.6344.44268.356.30.36
185420.22018.4843.73285.655.10.18
195540.043017.8743.64276.650.50.26
20566254018.9343.53200.656.80.49
2162100.23018.4444.61271.565.40.25
226320.044017.8543.94281.167.40.14
23644255018.8444.08226.569.10.32
2465651018.7544.57249.167.60.28
2566812018.6144.67268.266.40.26
Table 8. Mechanical parameters of the soil sample.
Unit Weight (kN/cm3)Bulk Modulus (MPa)Shear Modulus (MPa)Loading Modulus (MPa)Cohesion (kPa)Internal Friction Angle (°)Poisson Ratio
18.03.751.730.860350.3
Table 9. Mechanical parameters of the soil sample.
Elastic Modulus (GPa)Thick (m)Shear Stiffness (MPa)Cohesion (kPa)Poisson Ratio
250.0052.300.33
Table 10. Parameters of dynamic analysis.
Tamper Radius (m)Tamper Quality (kg)Maximum Impact Stress (MPa)Action Period (s)Minimum Critical Damping RatioMinimum Central Frequency (Hz)
0.0650.2360.0210.0524
Table 11. Multiple linear regression analysis of evaluated indicators.
Evaluating IndicatorsRegression Equation
Lateral displacement y = 20.359 0.362 X 1
Crater depth y = 40.546 + 0.551 X 1 + 0.170 X 3 0.062 X 4
Effective reinforced depth y = 274.927 4.772 X 4
Deflection of first reinforced layer y = 2.784 0.476 X 1

