Article

Graphene Nanoplatelets Impact on Concrete in Improving Freeze-Thaw Resistance

Department of Civil Engineering, Harbin Institute of Technology, Weihai 264209, China
*
Author to whom correspondence should be addressed.
Appl. Sci. 2019, 9(17), 3582; https://doi.org/10.3390/app9173582
Submission received: 19 July 2019 / Revised: 9 August 2019 / Accepted: 29 August 2019 / Published: 1 September 2019
(This article belongs to the Special Issue Graphene Nanoplatelets)

Abstract

:
Graphene nanoplatelets (GNP) is a newly nanomaterial with extraordinary properties. This paper investigated the effect of GNP on the addition on freeze–thaw (F–T) resistance of concrete. In this experimental study, water to cement ratio remained unchanged, a control mixture without GNP materials and the addition of GNP was ranging from 0.02% to 0.4% by weight of ordinary Portland cement was prepared. Specimens were carried out by the rapid freeze-thaw test, according to the current Chinese standard. The workability, compressive strength, visual deterioration and mass loss of concrete samples were evaluated. Scanning electron microscopy also applied in order to investigate the micromorphology inside of the concrete. The results showed that GNP concrete has a finer pore structure than ordinary concrete; moreover, the workability of GNP concrete reduced, and the compressive strength of specimens was enhanced within the appropriate range of GNP addition; in addition, GNP concrete performed better than the control concrete in the durability of concrete exposed to F-T actions. Specimens with 0.05% GNP exhibited the highest compressive property after 200 F–T cycles compared with other samples.

1. Introduction

Concrete is the most commonly and widely used civil engineering material in the world. However, we all know that concrete has poor features, such as a quasi-brittle nature, prone to crack formation and low tensile strength; these defects seriously reduce the mechanical property and durability of concrete structures. Numerous concrete structures are served in various environments, for example harsh low-temperature circumstance. Freeze–thaw durability of concrete materials is a key aspect affecting the durability and life span of concrete structures in cold areas. Concrete is an inherently defective material; its F–T performance relies predominantly upon the interior structure of the material, such as its porousness, crack, pores types and size, transportation, etc. Many researchers have paid attention to the usage of nanomaterials, for example, nano-kaolinite clay [1], nano-silica [2,3,4], nano-TiO2 [5], nanoalumina [6] and graphene nanomaterials [7,8,9,10,11,12,13,14,15,16,17,18,19,20], in the last decade. Studies have shown that the additive of these nanomaterials could improve the mechanical property and durability of cementitious materials. Graphene as an emerging Nano material can be added into cement paste to enhance construction sustainability due to their extraordinary performance. Some researchers reported that the reinforcing effects of graphene on cement composites could enhance the physical and mechanical properties of cementitious materials through tests. Pan et al. [10] showed that the compressive and flexural performance of cement paste increased by adding 0.05 wt% graphene oxide (GO), and observed that GO in cement matrix enhanced the surface area of the GO composite; they thought that GO was a potential entrant in cement-based materials. Some studies demonstrated that the addition of GO could promote hydration of cement, accelerate crystallite formation and increase the tightness of cement paste [11]. Du et al. [12] firstly investigated the durability of concrete containing low-cost two-dimensional (2D) Graphene Nanoplatelets (GNP), and evaluated the transport properties of concrete subjected to chloride and water environment, the results showed that GNP could enhance the resistance of concrete to chloride ion and water penetration. Mohammed et al. [15] found that GO addition could modify the microstructure and improve the compressive strength of cement matrix, and reported the GO could improve the freeze-thaw resistance of cement;however, they did not give the optimum dosage of GO. Experimental investigation showed that the addition of graphene oxide nanoplatelets (GOS) and GNP in mortar samples would increase the frost resistance of materials, and the discovered microstructure and modulus biography found that GNP and GOS could greatly refine the microstructure of mortar specimen [16]. Li et al. [17] firstly studied GO aggregates as particle size measurement and found that the aspect ratio of GO aggregates is much higher than that of the original GO nanosheets. Adding graphene and GO sheets to cement paste could improve the mechanical properties of the nanocomposite [20] but can reduce the workability of the nano cement materials [13]. Additionally, adding graphene nano-sheets (GNS) to cement paste could accelerate the hydration reaction and increase the quantity of hydration products, and could also improve chloride penetration resistance of cement paste [19]. Furthermore, adding GNP in cement would reduce the resistivity and make composites obvious pressure sensitivity [18]. Some recent research findings showed that graphene nano-sheets and their derivatives (GND) could modify cement-based materials [21]; we found that most recent attention focuses on the performance of graphene-based materials additions in cementitious materials, which can improve the better performance, such as compressive strength and flexural strength and elastic modulus of paste. Currently, little information is given to the properties of graphene modified concrete; unique experimental work has been done and demonstrated that GNP could improve transport resistance of concrete, but it reported that graphene has no influence on the compressive properties of concrete [12]. This is inconsistent with the effect of graphene on cement paste; therefore, much research about that graphene modified concrete and effects of graphene on durability of concrete should be done.
The objective of the paper is to research the effects of GNP addition on F-T resistance. Experiments were conducted on the durability of concrete including 0%, 0.02%, 0.05%, 0.1%, 0.2%, 0.3% and 0.4% GNP, using the rapid freeze–thaw method. Compressive strength and mass loss were carried out on specimens with and without GNP that were exposed to F–T actions. Moreover, the influence of GNP on the micro-structure of concrete using Scanning electron microscopy (SEM) was characterized.

2. Experimental Program

2.1. Material and Specimen Preparation

In order to prepare cement composites, Ordinary Portland Cement of grade 42.5 was purchased from Weihai Shanshui Cement Co., Ltd. (Weihai, China). Table 1 display the chemical composition of cement. The maximum size of natural sand and coarse aggregate are 5 mm and 20 mm, respectively, and the fineness modulus of sand is 2.7. GNP was supplied from Graphene Suspension (20 wt %), and it had been provided by Weihai hi-tech carbon materials Co., Ltd. in China. The Graphene Suspension can be stably dispersed in ethanol aqueous solution, which consists of graphene layers with thickness of 20 nm and diameter of 10 micrometers. The scanning electron microscope (SEM) images can be shown in Figure 1.
In this experiment, to observe the influences of GNP on durability-related behavior, at first, five groups of concrete samples were designed, we defined them as the first batch, which including a control mix and four groups of mixes with 0.1, 0.2, 0.3 and 0.4 wt% GNP, labeled as GC0, GC0.1, GC0.2, GC0.3, and GO0.4, respectively. According to the test results, a dosage of GNP between 0.01% and 0.1% could derive better performance; then, we added two group’s specimens and defined as the second batch, 0.02% and 0.05%wt GNP, labeled as GC0.02 and GC0.05. The mass percent of water to cement ratio was kept 0.6, a concrete mix of proportions, by weight of cement, sand and aggregate in this experiment’s compound is 1: 2.06: 3.36. Firstly, Graphene Suspension was dissolved in water and manually stirred 1 min; then, cement and graphene-water, which account for about 35% of cement weight, were added to the mixer to stir for 20 s. Afterwards all coarse aggregate are added to stir for 20 s, all sand is added to sir for 20 s, and finally, the remaining graphene-water mixture is added to stir for 30 s. After being blended, the concrete was casted into the cubic mold (100 mm × 100 mm × 100 mm) and then compacted on a vibration table. Each group contains three specimens. Finally, these samples were cured in the laboratory at a temperature 20 ± 1 °C; after 24 ± 2 hours, all samples were demoulded and cured in a concrete standard curing box at a temperature of 20 ± 1 °C and a relative humidity of 95± 1% for 28 days according to the Chinese standard GB/T 50081-2002 [22].

2.2. Methods

According to the Chinese standard GB/T 50082-2009 [23], specimens should be soaked at least 4 h in water before F-T test. After being submerged in the water for 12 h in this experiment, specimens were taken out for weighting and inspection then prepared for the F-T test. The Fully automatic freeze–thaw test box, which meets the procedure requirements of the Chinese standard [23], was used to produce F–T cycles in water. The F–T action consisted of alternatively falling the temperature of the samples from 5 °C to −17 °C and rising it from −17 °C to 5 °C in 4 h. At periodic intervals of different F-T actions (0, 10, 20, 30, 50, 100, 150, 200), the samples were removed from the Cabinet. It is noteworthy that according to the results of the first batch, the F-T cycles of the second batch of specimens are somewhat different from that of the first batch, with 0, 50, 100, 150, and 200 cycles. We took out the removed samples in the natural state of the laboratory for one day, and then performed physical, workability, mass, compressive strength, and scanning electron microscopy (SEM) experiments.

2.2.1. Scanning Electron Microscopy

In order to understand the impacts of GNP on the micro-property of the concrete specimens, a microstructural morphology was conducted on the control concrete and modified samples. A dimension of 4 mm × 4 mm × 4 mm of the specimen was extracted from the control concrete sample. In order to make the concrete conductive, we sprayed 10 nm gold on the surface of the samples before SEM test. Then, the prepared specimens were discovered using the Tescan Vega II SEMsystem. To compare the plain concrete to the GNP concrete, the same operation procedure was conducted on the GNP-modified concrete samples.

2.2.2. Workability

To study the influence of GNP addition on the workability of graphene concrete (GC) mixtures, the slump test conducted in this experiment was in accordance with the Chinese standard GB/T 50080-2016 [21].

2.2.3. Mass Loss

Before and after F-T cycles, we recorded the mass of each sample using an electronic scale with an accuracy of 0.1 g. Then, the mass loss ratio of each specimen Δmni, an accuracy of 0.01, was defined as follows:
Δ m n i = ( 1 m n i m 0 i ) × 100 %
where mni is the mass of the ith sample after nth cycles and m0i is the ith sample’ mass before cycles.
The average mass loss ratio of each group of specimens should be the arithmetic average value of the test results of the Δmni of three specimens as the measured value. When a negative value of a sample test result occurs, the zero should be taken; then, the mass is the arithmetic average value of three specimens. When the difference between the maximum value or minimum value and the median value is more than 1%, this value should be eliminated, and then the arithmetic average value of the remaining two values should be taken as the representative value; when the difference between the maximum value and the minimum value and the median value is all more than 1%, the median value should be taken as the representative value. Therefore, for each group the mass loss ratio Δmn was defined as follows:
Δ m n = i = 1 3 Δ m n 3 × 100 %

2.2.4. Compressive Strength

The compressive test was conducted on an electro-hydraulic servo compressive testing system with a capacity of 1000 kN. According to present the Chinese code [22] for mechanical properties on concrete, the loading rate was 0.5 MPa/s in this experiment. For each group of samples, three specimens were tested. According to the code, the representative strength was taken follow the three rules: (1) the average values of the three samples are taken as the compressive strength values of the each group of specimens; (2) if the difference between the maximum value or the minimum value exceeds 15% of the median value, the maximum value and the minimum value are discarded together, and the median value is taken as the compressive strength value of the group of specimens; (3) if the difference between the two values and the median value is more than 15% of the median value, the test results of this group of specimens are invalid.

3. Results and Discussion

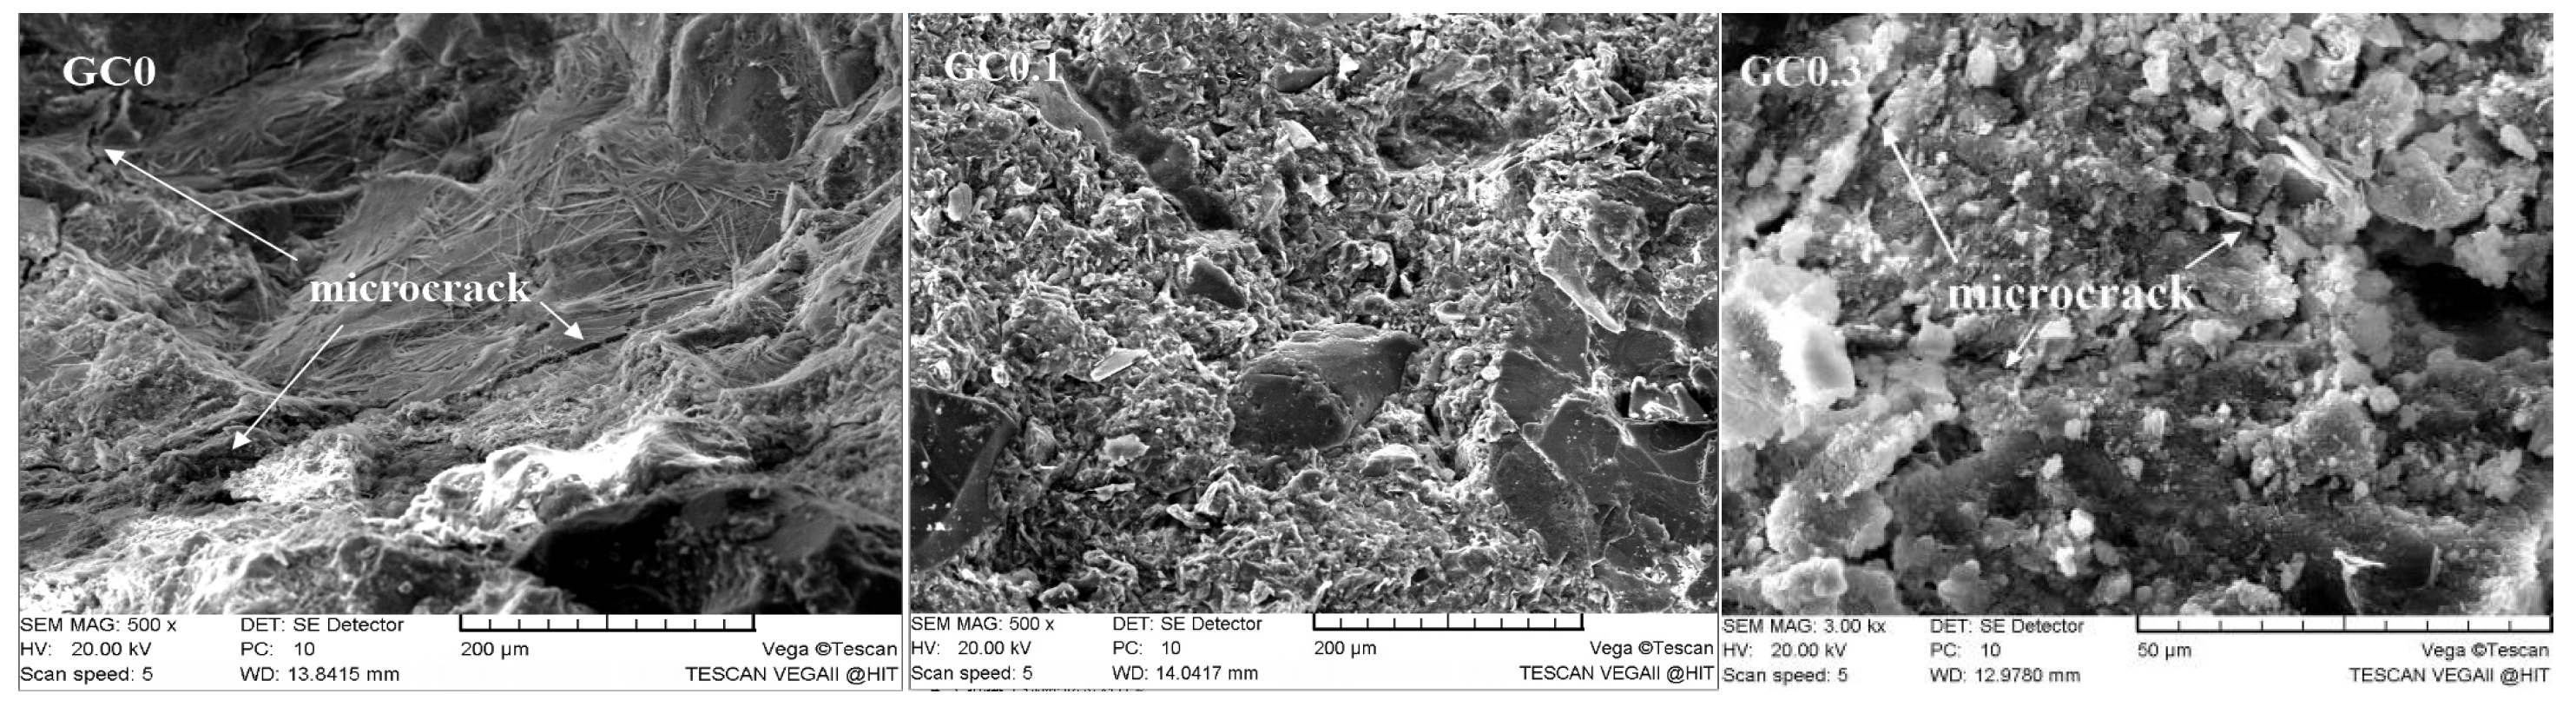
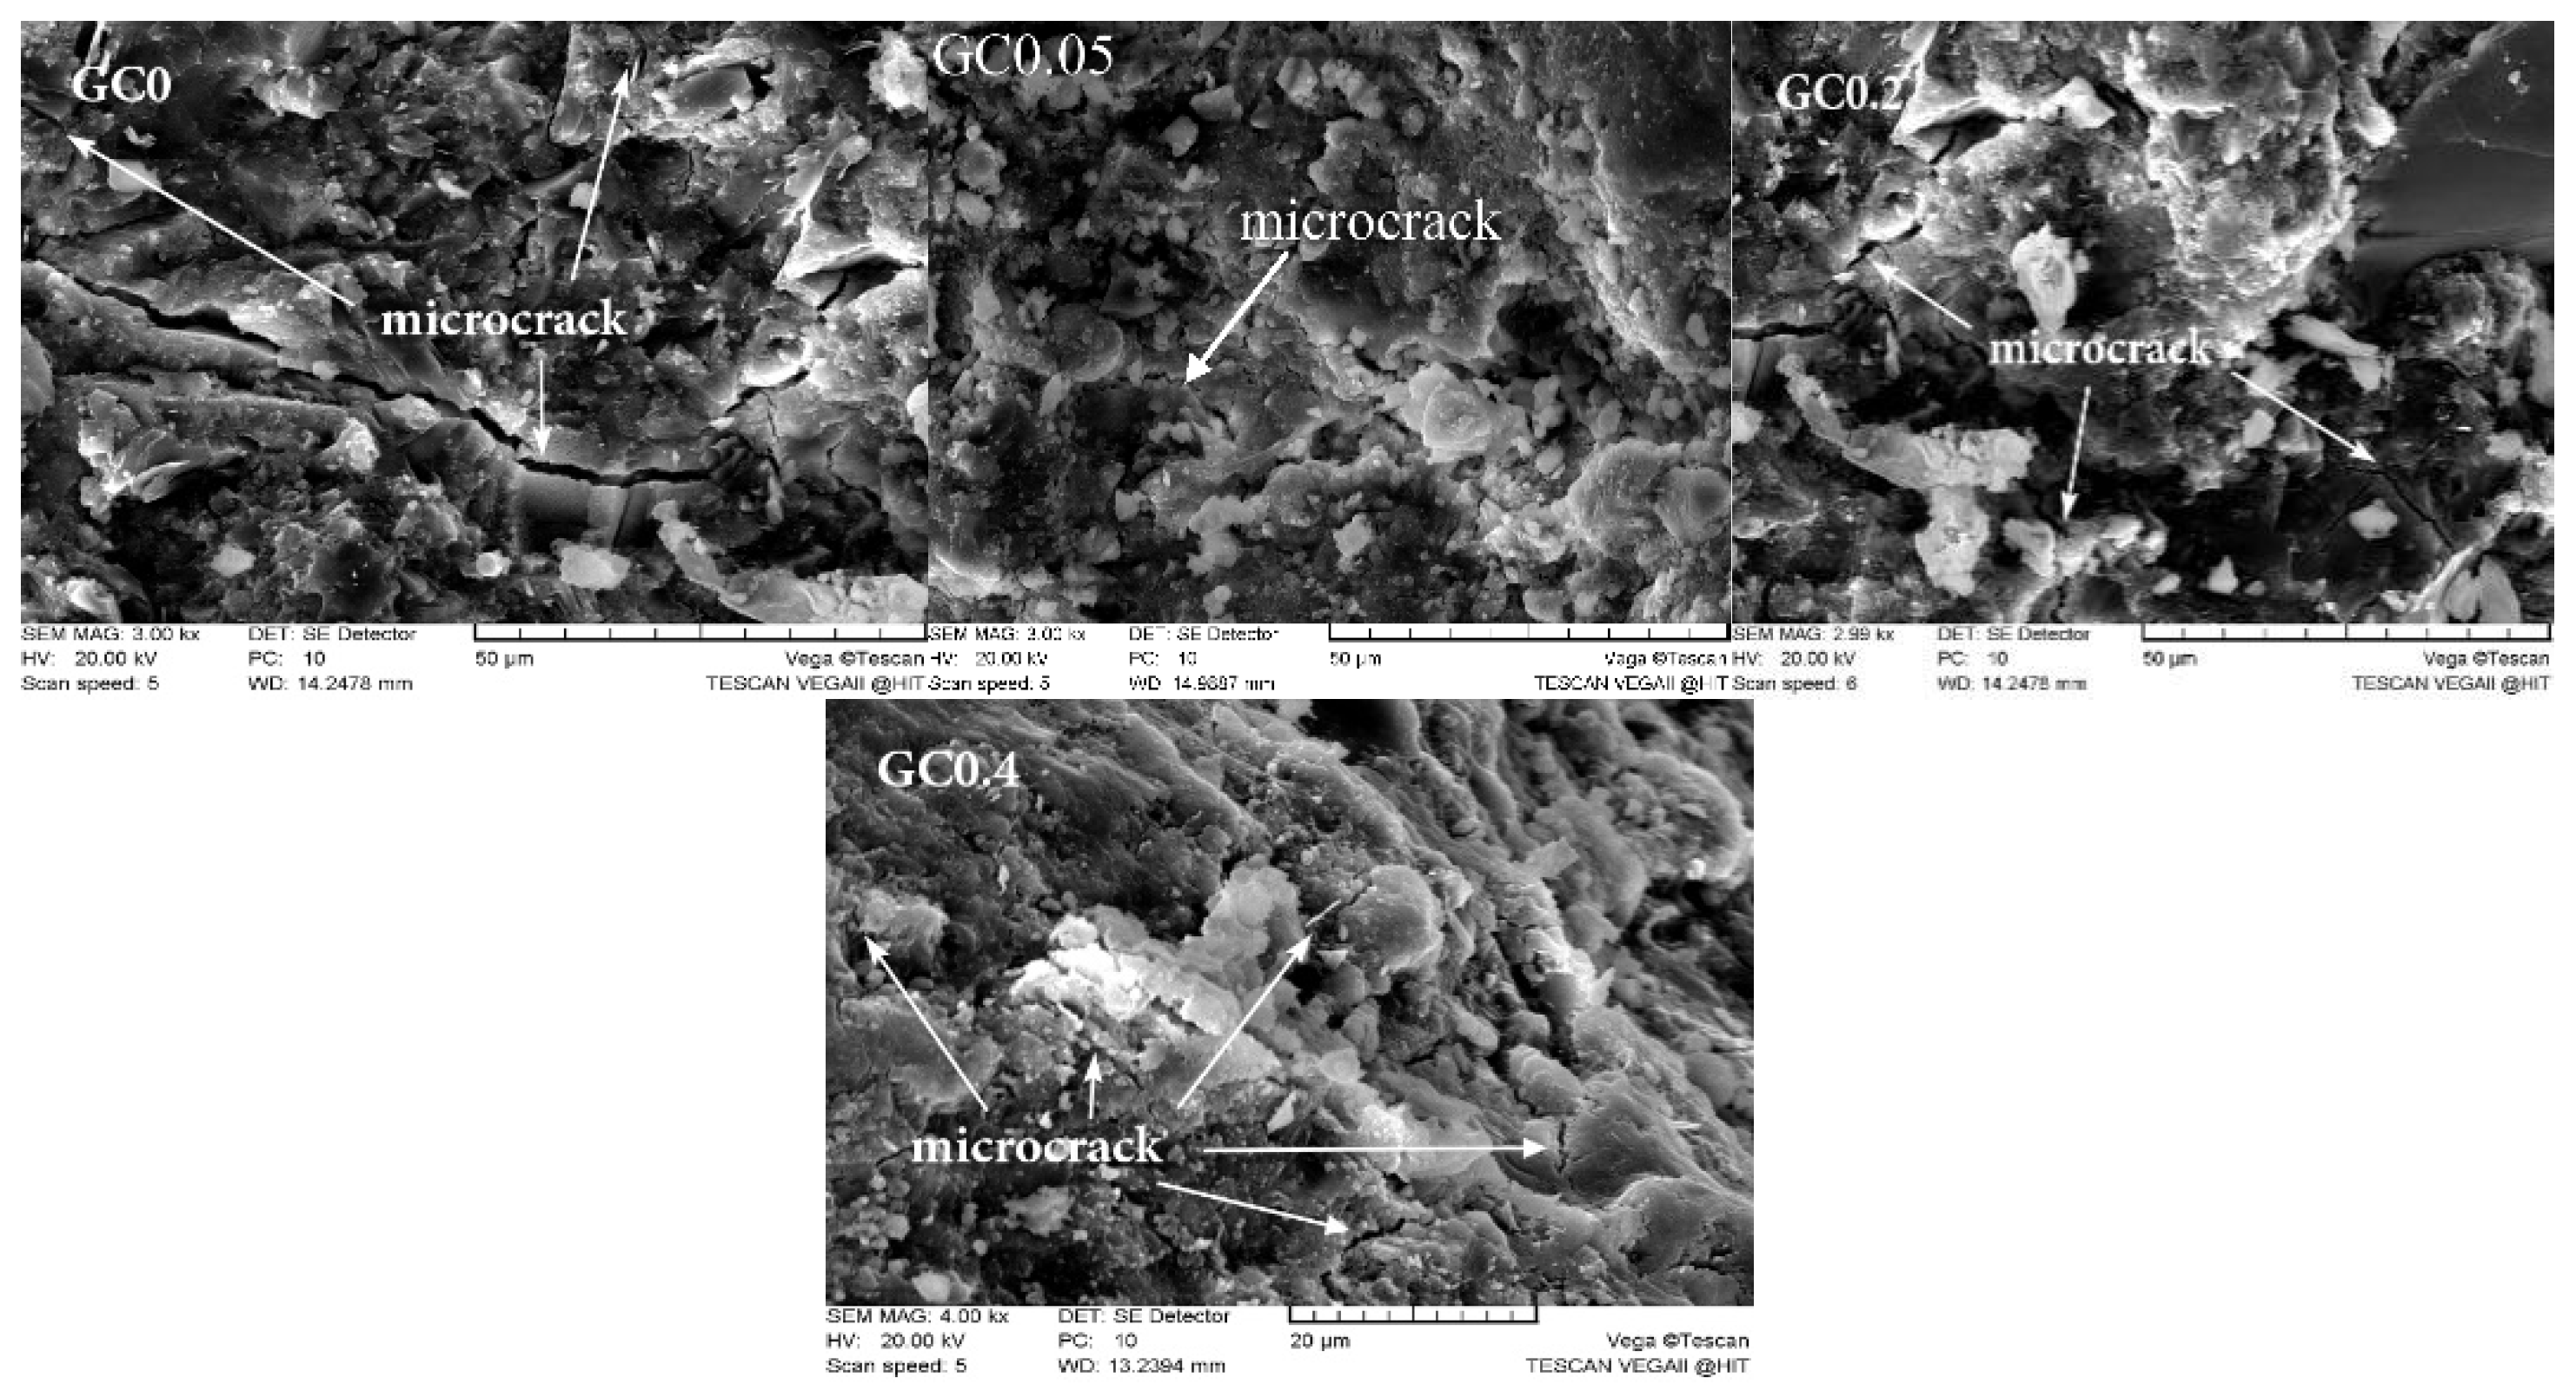
3.1. Scanning Electron Microscopy

A microstructural morphology on the control concrete and graphene concrete specimens was carried out using scanning electron microscopy. Figure 2 shows the SEM micrographs of the specimen before F-T tests. It can be observed that the sample GC0 has larger volume porosity and contains a lot of acicular and rod cement hydration products, such as AFt, AFm, Ca(OH)2, and C-S-H gel. The graphene nano-particles were reported that it could fill the voids and promote the growth of the hydration products, change the shape and size of hydration crystal, but did not change its type through reacting with cement and graphene [9]. As can be seen from Figure 2, compared with the ordinary concrete specimens, the hydration products of the specimens with GNP are more compact and the microstructure is more uniform, the intersecting microcrystals make the mechanical properties of concrete improved obviously, which would change the freeze-thaw resistance of concrete. However, it should be noted that when the content of GNP exceeds 0.3%wt, GNP and other materials of concrete cannot be well mixed, their distribution cannot be uniform, and GNP could be aggregated, which was also found in the process of mixing materials, forming weak areas in the concrete, leading to stress concentration [8]. Therefore, the continuous increase of GNP mass fraction cannot further improve the mechanical strength and F-T resistance of concrete, such as GC0.4. Nevertheless, when the mass fraction of GNP is less, graphene nanoplatelets exist in isolated or small collective forms, with larger particle spacing and less lap joints, which have little effect on the mechanical properties of the concrete. It can be inferred that when the mass fraction of GNP is within a certain range, graphene would plays a role in strengthening and toughening of concrete.
The SEM images of the specimens after 30 F-T actions are shown in Figure 3. Extensive cracking, 0.6–4.7 μm, can be found in the control sample. The GC0.3 and GC0.4 concrete sample exhibited more cracks than the GC0.2 sample, GC0.3 concrete contained 0.4–3.5 μm cracks, but from Table 2 macro-crack cannot be found on these samples surface. Meanwhile, no micro-crack was observed in the GC0.1 concrete sample, this means that the mass fraction of GNP might have a certain range which graphene will play a role in strengthening microstructure of concrete.
After 200 F-T cycles, from the Figure 4 we can observe that the micro-cracks became wide and long (8.6–24.7 μm) in the GC0 samples, tiny micro-cracks began to appear in the GC0.05 (1.3–7.8 μm) and GC0.1 (0.8–9.2 μm) concrete sample. And in the GC0.2, GC0.3 and GC0.4 concrete samples we found that the micro-cracks became wide and more, the crack lengths are 3.4–16.9 μm, 2.7–17.3 μm and 3.3–23.1 μm, respectively, and the internal structure became poriferous, which lessened the durability and mechanical performance of the concrete. This indicates that the perennial F-T cycles could change the microstructure of the concrete and lead to a more porous. The SEM micrographs gives an illustration for that the compressive strength of the GC0.05 sample is maximum in all specimens during the F-T actions.

3.2. Workability

The slump results are shown in Figure 5. It can be found that the slump of concrete almost linear reduced with the increase of GNP content. At 0.4 wt % GNP, the mixing process of the cement slurry, stone, and graphene-water mixture became difficult, and the slump was only 57 mm. It is universally acknowledged that GNP has larger surface-to-volume ratio and can absorb more water on its surface; nevertheless, the amount of water added to the fresh slurry remains unchanged during the forming process, and therefore, this could reduce its workability. Meanwhile, with the increase of graphene addition, contact degree magnified between graphene particles; some graphene particles are not uniformly dispersed in cement matrix. This phenomenon can be found in subsequent SEM experiments. Consequently, these would have reduced the concrete workability.

3.3. Visual Assessment
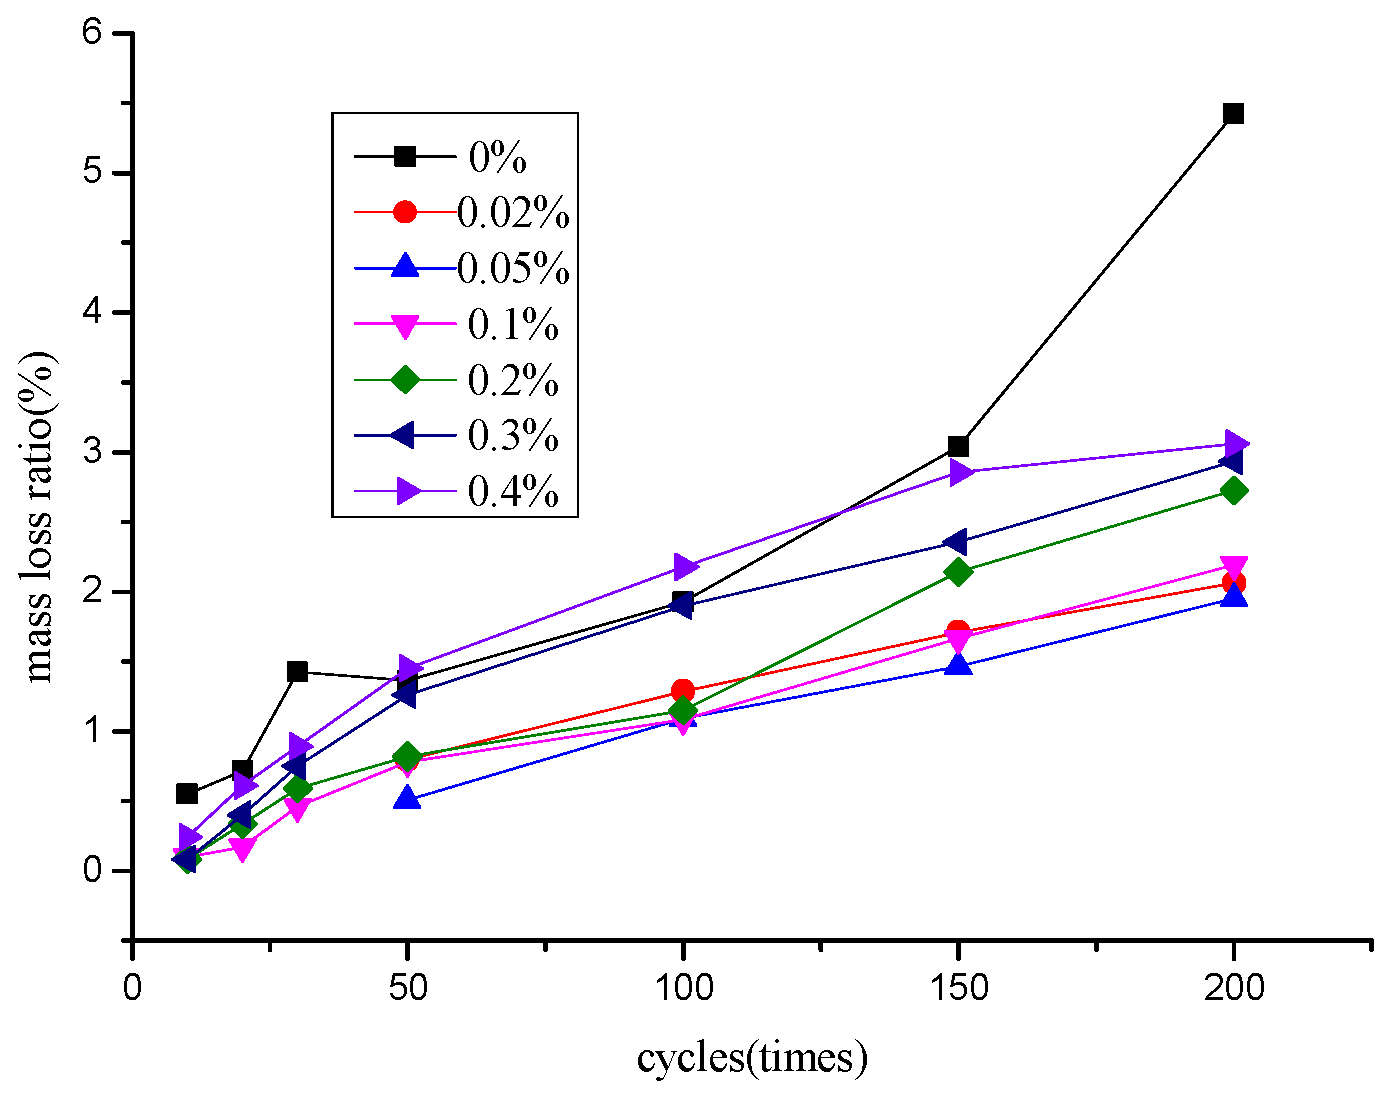
In this experiment, samples were periodically picked out from the device for visual assessment; detailed observations are given in Table 2. With the increase of graphene content, the color of the specimens turns black gradually. It can be noticed that before 20 F-T actions, all specimens with no change in surface. With the increase of freeze-thaw actions, the surface of concrete samples gradually changes. After 30 F-T cycles, tiny cracks and some porous were observed on the surface of control samples, and it was found that the edges of the control specimens began to loosen. However, no obvious change was observed on other GC samples. After 150 F-T cycles, control samples displayed cracking, no damage was observed on GC0.05, GC0.1, and GC0.2 samples, while some porous was found on GC0.02, GC0.3, and GC0.4 samples. After 200 F-T cycles, control samples showed severe cracking and sponge-like surfaces, and GC0.4 became more porous, showing small visible cracking; however, GC0.05, GC0.1, and GC0.2 still have no obvious damage. From the surface appearance of the sample noticed in the experiment, we can obtain the damage progression. During repeated F-T tests, the water penetrates into the pores of concrete, and when the temperature is lower than a certain value, water will freeze, resulting in expansion stress, resulting in micro-cracks and macro-cracks; therefore, we could observe damages including pores, spalling, and cracks. The addition of GNP causes lower porosity [12] and forms a compact microstructure, as a result of the specimens with GNP might have less water absorption than control specimens, and showed less surface damage compared with the ordinary concrete samples through all the F-T actions.

3.4. Mass Change

Concrete mass could be reduced due to subject to F-T actions. The main reason of mass reduction was involved in the concrete corners due to damage caused by freeze-thaw cycles. Figure 6 shows the mass loss ratio Δmn after different cycles.
Although in some F-T cycles (before 50 cycles), the value of the mass loss reduction was small, this phenomenon could be explained as the higher durability of the specimen (such as GC0.05 and GC0.1) against F-T cycles. In freeze-thaw cycle test, mass loss can be used as an index to measure material damage. According to the Chinese standard GB/T 50082-2009 [23], the mass loss of concrete more than 5% means that the material has been destroyed by rapid F-T, and the test can be stopped. From Figure 6, we can see that Δmn rise gradually for all samples with the cycles continue. After 200 cycles, the maximum value of Δmn is 5.42% for GC0, followed by 2.06%, 1.96%, 2.19%, 2.72%, 2.92%, and 3.06% for GC0.02, GC0.05, GC0.1, GC0.2, GC0.3, and GC0.4, respectively. This implies that GC0 has been destroyed; therefore, the maximum number of experimental cycles we designed was 200. Moreover, the maximum value of Δmn of modified concrete implied that GNP has a noticeable ability to keep matrices together; this may be attributed to the smaller size of GNP which could refine the internal pore structure of concrete [12]. It is noteworthy that the mass loss ratio of the concrete samples containing 0.05% GNP is the smallest during the F-T cycles.

3.5. Compressive Strength Evolution

To study the effect of GNP on the compressive strength evolution of the concrete, the compressive strength of the samples of 28day and different F-T cycles was measured. Figure 7a illustrates 28day compressive strength with different GNP additives concrete; it can be found that the concrete compressive strength can be improved by adding GNP up to 0.3%, the enhancement of compressive strength in GC0.02, GC0.05, GC0.1, GC0.2, and GC0.3 relative to that of GC0 was 18.61%, 22.40%, 19.78%, 8.84%, and 1.42%, respectively. When the water cement ratio and coarse aggregate of concrete are the same, the porosity of concrete will greatly affect the compressive strength of samples. There may be two reasons for the increase of strength of the graphene concrete: One is that GNP can accelerate the hydration process of cement [14], which leads to the refinement of pore structure; the other is that graphene nanoplatelets fill the holes in concrete, as evidenced by the SEM results. However, adding 0.4% of GNP had an adverse impact on enhancing the compressive strength of the specimen. The reason for the reduction of 28 days compressive strength in the concrete containing 0.1–0.4% GNP, in comparison with the samples containing 0.05% and 0.02% GNP could be the lack of uniform distribution and nanoplatelets agglomeration and the formation of weak regions in the concrete. The micro structural morphology corroborates the evolution of the strength. However, Du et al. [12] added the GNP in to the concrete, and the GNP content from 0.5% up to 2.5% at 0.5% increment, they reported that GNP has no beneficial or adverse impact on the compressive strength of the concrete, we inferred that they come to this conclusion is that they took a larger increment of graphene content and did not find the appropriate dosage.
To research the changing trend of compressive strength of the sample in tests, compressive strength loss ratio Df was defined as follows:
D f = ( 1 f n f 0 ) × 100 %
where fn is the compressive strength of the sample after exposure to the nth cycles, f0 is the compressive strength of the sample before the experiment. Figure 7b shows the compressive strength loss ratio after F-T actions. The results show that GNP has a remarkable impact on the compressive strength of specimens during the whole test, the compressive strength loss ratio Df of graphene concrete samples are lower than that of control concrete. After 200 cycles, Df was 75.39% in the control sample; this means it destroyed according to the China national standard [23], while Df was 22.60%, 19.59%, 24.85%, 27.25%, 30.02%, and 39.02% in the samples containing 0.02%, 0.05%, 0.1%, 0.2%, 0.3%, and 0.4% GNP. After 200 F-T cycles, the compressive strength of GC0.02 and GC0.05 were 29.1 MPa and 31.2 MPa, respectively. Therefore, adding GNP can significantly improve the durability of concrete under F-T cycles, a probable reason is that there were few or no cracks or fine holes between the crystals in graphene concrete, which greatly reduced the water penetration into the concrete, thus reducing the frozen-heave force; hence, the freeze-thaw resistance of the material was improved. In addition, adding more than 0.05% GNP in this test presented a decreasing trend in improving the compressive strength of graphene specimen in F-T cycles. This means that the mass fraction of GNP is 0.05%wt of the cement; the effect is best in this experiment.

3.6. Elastic Modulus Evolution

The elastic modulus of concrete is usually defined as either a secant or a chord modulus. A secant modulus of concrete is calculated from the starting point to a specified point on the stress–strain curve. The specified point often is selected between 30% and 60% of the specimen’s ultimate strength. We take 30% of the ultimate strength of the specimen as the defined point. Table 3 summarizes the elastic modulus of concrete samples. We found that GC0.05 has the strongest ability to resist elastic deformation, and the elastic modulus of GC0.05 is close to that of C60. The dates implied that GNP addition increases modulus of the concrete. It may have contributed to the high stiffness of graphene and the increasing compressive strength. We also found that for all samples, the modulus was obviously changed after 200 cycles. The elastic modulus of graphene concrete showed a lower decrease during the whole test. Comparing with the control sample before F-T actions, the ordinary cement concrete showed a drop up to 25.4% in the elastic modulus at 200 cycles. Nevertheless, the sample with the additives of 0.05%, 0.2%, and 0.3% GNP showed 17.57%, 19.7%, and 16.4% decrease in elastic modulus, respectively. After 200 F-T cycles, the elastic modulus of GC0.05 is still close to 30.0GPa. This indicated that the addition of GNP can enhance the elastic deformation resistance of concrete in F-T actions.

3.7. Peak Strain Change

In this study, we defined peak strain as the strain when the compressive stress reaches the maximum value in the experiment. Table 4 summarizes the peak strain of concrete samples after different F-T actions. Before cycles the peak strain of GC0 is about 0.00188, and the peak strain of graphene concrete is slightly larger than that of the control concrete, this means that when the specimen is destroyed the graphene concrete has large deformation than the ordinary concrete; a probable reason is that GNP improves the deformability of concrete. From Table 4, we can observe that the peak strain decrease with cycle times and the changing trends for different wt% GNP concrete with different F-T cycles is similar.

4. Conclusions

This paper researched the effect of GNP on the freeze-thaw performance of concrete. A series of experimental investigations were carried out. Concrete samples consist of 0%, 0.02%, 0.05%, 0.1%, 0.2%, 0.3%, and 0.4% graphene nanoplatelets were prepared for the rapid F-T tests. The workability, compressive strength, and durability graphene of concrete subjected to F-T cycles of the specimens were studied, and the main conclusions were as follows.
(1)
The SEM micrographs indicate that the effect of GNP enhanced the freeze-thaw resistance of concrete. It can be concluded that graphene nanoplatelets with the appropriate additional acts effectively in enhancing the durability of concrete under freezing-thawing cycles.
(2)
Adding graphene nanoparticles could reduce the workability of graphene concrete, and the slump of the specimen decreases with the increasing nanoparticles addition.
(3)
Concrete with GNP displayed less mass loss during F-T actions, particularly the concrete with the 0.05% GNP addition. In addition, GNP concrete exhibited fewer damages on the sample’s surfaces than the control concrete.
(4)
Adding graphene nanoparticles up to 0.3% could improve the compressive strength of concrete; before F-T test, the maximum increase of compressive strength in GC0.05 relative to that of GC0 was 22.40%. However, above 0.4%, the incorporation of GNP had a negative influence on enhancing the compressive strength of concrete. Furthermore, concrete with the appropriate additional GNP showed less compressive strength loss after 200 F-T cycles compare to the control specimens.

Author Contributions

G.C. wrote the manuscript, Y.Z. designed the theoretical framework, M.Y. and Y.W. performed the experiments, L.X. corrected the language.

Funding

This research was funded by the National Natural Science Foundation of PR. China (Grant No.51308166), Shandong Provincial Natural Science Foundation (Grant No. ZR2019MEE090) and Weihai Science and technology Development Plan Project (Grant No.2015DXGJMS011).

Acknowledgments

We thank the Analysis and Testing Center of Harbin University of Technology (Weihai) for assistance with the SEM analysis.

Conflicts of Interest

The authors declare no conflict of interest.

References

  1. Fan, Y.; Zhang, S.; Wang, Q.; Shah, S.P. Effects of nano-kaolinite clay on the freeze–thaw resistance of concrete. Cem. Concr. Compos. 2015, 62, 1–12. [Google Scholar] [CrossRef]
  2. Du, H.; Du, S.; Liu, X. Durability performances of concrete with nano-silica. Constr. Build. Mater. 2014, 73, 705–712. [Google Scholar] [CrossRef] [Green Version]
  3. Mukharjee, B.B.; Barai, S.V. Statistical techniques to analyze properties of nano-engineered concrete using Recycled Coarse Aggregates. J. Clean. Prod. 2014, 83, 273–285. [Google Scholar] [CrossRef]
  4. Stynoski, P.; Mondal, P.; Marsh, C. Effects of silica additives on fracture properties of carbon nanotube and carbon fiber reinforced Portland cement mortar. Cem. Concr. Compos. 2015, 55, 232–240. [Google Scholar] [CrossRef]
  5. Li, H.; Xiao, H.; Guan, X.; Wang, Z.; Yu, L. Chloride diffusion in concrete containing nano-TiO2 under coupled effect of scouring. Compos. Part. B Eng. 2014, 56, 698–704. [Google Scholar] [CrossRef]
  6. Shahrajabian, F.; Behfarnia, K. The effects of nano particles on freeze and thaw resistance of alkali-activated slag concrete. Constr. Build. Mater. 2018, 176, 172–178. [Google Scholar] [CrossRef]
  7. Lv, S.; Ma, Y.; Qiu, C.; Sun, T.; Liu, J.; Zhou, Q. Effect of graphene oxide nanosheets of microstructure and mechanical properties of cement composites. Constr. Build. Mater. 2013, 49, 121–127. [Google Scholar] [CrossRef]
  8. Du, H.; Pang, S.D. Enhancement of barrier properties of cement mortar with graphene nanoplatelet. Cem. Concr. Res. 2015, 76, 10–19. [Google Scholar] [CrossRef]
  9. Mingli, C.; Huixia, Z.; Cong, Z. Effect of graphene on mechanical properties and microstructure of cement paste. J. Harbin. Inst. Technol. 2015, 47, 26–30. [Google Scholar]
  10. Pan, Z.; He, L.; Qiu, L.; Korayem, A.H.; Li, G.; Zhu, J.W.; Collins, F.; Li, D.; Duan, W.H.; Wang, M.C. Mechanical properties and microstructure of a graphene oxide–cement composite. Cem. Concr. Compos. 2015, 58, 140–147. [Google Scholar] [CrossRef]
  11. Wang, Q.; Wang, J.; Lu, C.-X.; Liu, B.-W.; Zhang, K.; Li, C.-Z. Influence of graphene oxide additions on the microstructure and mechanical strength of cement. New Carbon Mater. 2015, 30, 349–356. [Google Scholar] [CrossRef]
  12. Du, H.; Gao, H.J.; Pang, S.D. Improvement in concrete resistance against water and chloride ingress by adding graphene nanoplatelet. Cem. Concr. Res. 2016, 83, 114–123. [Google Scholar] [CrossRef]
  13. Gong, K.; Pan, Z.; Korayem, A.H.; Qiu, L.; Collins, F.; Wang, C.M.; Duan, W.H. Reinforcing Effects of Graphene Oxide on Portland Cement Paste. J. Mater. Civ. Eng. 2016, 27, A4014010. [Google Scholar] [CrossRef]
  14. Ming-li, C.; Hui-xia, Z.; Cong, Z. Effect of graphene on mechanical properties of cement mortars. J. Cent. South Univ. 2016, 23, 919–925. [Google Scholar]
  15. Mohammed, A.; Sanjayan, J.G.; Duan, W.H.; Nazari, A. Graphene Oxide Impact on Hardened Cement Expressed in Enhanced Freeze–Thaw Resistance. J. Mater. Civ. Eng. 2016, 28, 1–6. [Google Scholar] [CrossRef]
  16. Tong, T.; Fan, Z.; Liu, Q.; Wang, S.; Tan, S.; Yu, Q. Investigation of the effects of graphene and graphene oxide nanoplatelets on the micro- and macro-properties of cementitious materials. Constr. Build. Mater. 2016, 106, 102–114. [Google Scholar] [CrossRef]
  17. Li, X.; Lu, Z.; Chuah, S.; Li, W.; Liu, Y.; Duan, W.H.; Li, Z. Effects of graphene oxide aggregates on hydration degree, sorptivity, and tensile splitting strength of cement paste. Compos. Part. A Appl. Sci. Manuf. 2017, 100, 1–8. [Google Scholar] [CrossRef]
  18. Xu, J.; Zhang, D. Pressure-sensitive properties of emulsion modified graphene nanoplatelets/cement composites. Cem. Concr. Compos. 2017, 84, 74–82. [Google Scholar] [CrossRef]
  19. Wang, B.; Zhao, R. Effect of graphene nano-sheets on the chloride penetration and microstructure of the cement based composite. Constr. Build. Mater. 2018, 161, 715–722. [Google Scholar] [CrossRef]
  20. Liu, J.; Li, Q.; Xu, S. Reinforcing Mechanism of Graphene and Graphene Oxide Sheets on Cement-Based Materials. J. Mater. Civ. Eng. 2019, 34, 1–9. [Google Scholar] [CrossRef]
  21. Yang, H.; Cui, H.; Tang, W.; Li, Z.; Han, N.; Xing, F. A critical review on research progress of graphene/cement based composites. Compos. Part. A Appl. Sci. Manuf. 2017, 102, 273–296. [Google Scholar] [CrossRef]
  22. China National Standard. Standard for Test Methods of Mechanical Properties on Ordinary Concrete (GB/T50081-2002); China Architecture and Building Press: Beijing, China, 2002. [Google Scholar]
  23. China National Standard. Standard for Test Methods of Long-Term Performance and Durability of Ordinary Concrete (GB/T 50082-2009); China Architecture and Building Press: Beijing, China, 2009. [Google Scholar]
Figure 1. Scanning electron microscope (SEM) images of graphene nanoplatelets (GNP).
Applsci 09 03582 g001
Figure 2. SEM images of the specimens before freeze-thaw tests.
Applsci 09 03582 g002
Figure 3. SEM images of the specimens after 30 freeze-thaw tests.
Applsci 09 03582 g003
Figure 4. SEM images of the specimens after 200 freeze-thaw tests.
Applsci 09 03582 g004
Figure 5. The slump of concrete.
Applsci 09 03582 g005
Figure 6. Mass loss ratio of concrete versus F-T cycles.
Applsci 09 03582 g006
Figure 7. (a). Twenty-eight-day compressive strength of different GNP additives. (b) Df versus F-T actions. The compressive strength of concrete with different GNP additives.
Applsci 09 03582 g007
Table 1. Chemical composition of P.O 42.5R cement.
CompositionCaOSiO2Al2O3Fe2O3SO3MgOLossOf Ignition
Content (%)63.7922.64.623.262.291.703.14
Table 2. Visual observations of GNP concrete at different F-T cycles.
CyclesGNP Additives
0%0.02%0.05%0.1%0.2%0.3%0.4%
0 Applsci 09 03582 i001 Applsci 09 03582 i002 Applsci 09 03582 i003 Applsci 09 03582 i004 Applsci 09 03582 i005 Applsci 09 03582 i006
30 Applsci 09 03582 i007 Applsci 09 03582 i008 Applsci 09 03582 i009 Applsci 09 03582 i010 Applsci 09 03582 i011
50 Applsci 09 03582 i012 Applsci 09 03582 i013 Applsci 09 03582 i014 Applsci 09 03582 i015 Applsci 09 03582 i016 Applsci 09 03582 i017 Applsci 09 03582 i018
150 Applsci 09 03582 i019 Applsci 09 03582 i020 Applsci 09 03582 i021 Applsci 09 03582 i022 Applsci 09 03582 i023 Applsci 09 03582 i024 Applsci 09 03582 i025
200 Applsci 09 03582 i026 Applsci 09 03582 i027 Applsci 09 03582 i028 Applsci 09 03582 i029 Applsci 09 03582 i030 Applsci 09 03582 i031 Applsci 09 03582 i032
Table 3. Elastic modulus of concrete samples after F-T cycles (unit: GPa).
F-T CyclesGC0GC0.02GC0.05GC0.1GC0.2GC0.3GC0.4
030.89535.59336.06035.48533.74031.90030.355
1029.445--34.01033.49031.44529.830
2029.375--32.41533.21530.65529.395
3028.265--32.79031.84030.83529.190
5028.29532.01933.42031.75530.41030.43027.550
10026.70031.44032.67030.38029.86528.57525.560
15025.17529.37530.39328.82528.21027.83525.060
20023.04528.46029.72528.14027.08026.66523.315
Table 4. Peak strain of concrete after F-T cycles.
F-T CyclesGC0GC0.02GC0.05GC0.1GC0.2GC0.3GC0.4
00.001880.002240.002320.002290.002200.002090.00189
100.00194--0.002360.002140.002030.00185
200.00178--0.002170.002140.001990.00180
300.00175--0.001950.002070.001950.00184
500.001730.001870.001920.001850.001840.001740.00167
1000.010510.001630.001710.001610.001580.001540.00158
1500.001520.001560.001660.001570.001610.001510.00154
2000.001390.001520.001640.001510.001470.001440.00133

