Abstract
Recent research has proven the existence of statistical relation among fragmented QRS and several highly prevalence diseases, such as cardiac sarcoidosis, acute coronary syndrome, arrythmogenic cardiomyopathies, Brugada syndrome, and hypertrophic cardiomyopathy. One out of five hundred people suffer from hypertrophic cardiomyopathies. The relation among the fragmentation and arrhythmias drives the objective of this work, which is to propose a valid method for QRS fragmentation detection. With that aim, we followed a two-stage approach. First, we identified the features that better characterize the fragmentation by analyzing the physiological interpretation of multivariate approaches, such as principal component analysis (PCA) and independent component analysis (ICA). Second, we created an invariant transformation method for the multilead electrocardiogram (ECG), by scrutinizing the statistical distributions of the PCA eigenvectors and of the ICA transformation arrays, in order to anchor the desired elements in the suitable leads in the feature space. A complete database was compounded incorporating real fragmented ECGs, surrogate registers by synthetically adding fragmented activity to real non-fragmented ECG registers, and standard clean ECGs. Results showed that the creation of beat templates together with the application of PCA over eight independent leads achieves 0.995 fragmentation enhancement ratio and 0.07 dispersion coefficient. In the case of ICA over twelve leads, the results were 0.995 fragmentation enhancement ratio and 0.70 dispersion coefficient. We conclude that the algorithm presented in this work constructs a new paradigm, by creating a systematic and powerful tool for clinical anamnesis and evaluation based on multilead ECG. This approach consistently consolidates the inconspicuous elements present in multiple leads onto designated variables in the output space, hence offering additional and valid visual and non-visual information to standard clinical review, and opening the door to a more accurate automatic detection and statistically valid systematic approach for a wide number of applications. In this direction and within the companion paper, further developments are presented applying this technique to fragmentation detection.
1. Introduction
The electrocardiogram (ECG) is a clinical test used to record the myocardial electrical activity. In healthy subjects, this activation is homogeneous, and it does not present abrupt changes generating clear deflections in the ECG. In some diseases the ECG homogeneity is broken, and this is reflected as abrupt changes in the myocardial electric activation, generating the apparition of additional peaks and notches in the ECG, a condition that is known as fragmentation.
One of the causes of this phenomena is fibrosis, which is characterized by apparition of non-conductive tissue zones dispersed in healthy myocardial the tissue, so that these non-conductive zones break the homogeneous conduction. The fibrosis is an unspecific tissue response, which is shared by several illness, such as: Ischemic cardiopathy; Dilated, hypertrophic, or restrictive cardiomyopathy; Or heart failure [1,2,3,4]. The effects of fibrosis can be divided in two groups: Mechanical, in which fibrosis increases the myocardial rigidity difficulties the diastole; and electrical, because the dispersion of non-conductive tissue aids the appearance of reentry arrhythmias, which are potentially serious and are related with the sudden death. The fibrosis diagnoses is performed by pathological anatomy, which requires the extraction of tissue fragment to analyze. In clinical practice, this detection is carried by the use of magnetic resonance image with late gadolinium enhanced (MRI-LGE), but this technique is expensive and cannot be performed in all cases.
The potential relation between the fibrosis and the fragmentation presented in the ECG suggest searching for fragmentation markers in it, as it would represent a cheaper and faster technique than MRI-LGE. Nevertheless, the fragmentation detection by clinicians presents some drawbacks, as the different definitions presented by the fragmentation literature, and the high inter-observer variability, due to the fragmentation magnitude is low and it can be masked by noise. Therefore, the main goal of this paper is to elaborate, and if possible to propose, a multilead transformation of the ECG that effectively consolidates the existing fragmentation components into one, or into a minimum number of leads, where this information is enhanced for clinical inspection or for further processing, and eventually to suggest a specific pathology index detection. To do so, we propose the use of multivariate techniques, such as principal components analysis (PCA) and independent component analysis (ICA), which can allow us to decompose the ECG in different sub-signals as a new approach to the fragmentation detection. Although a few works have been recently published in this field [5,6], the strategy proposed in those papers mainly focus on standard morphological analysis, after a previous denoising process, but this kind of approach presents a critical drawback. As fragmentation is revealed in the ECG as a high frequency noise, a significant part of its expression is filtered out by standard and conventional high-frequency filtering. In other words, it is especially thoughtful in these analysis the fact that high-frequency noise filtering could have undesired effects on the fragmentation components as they may (or at least partially) share the same spectrum. However, of course, if no denoising is performed, high-frequency noise might hinder the extraction of the fragmentation itself. So, traditional approaches will always require a choice between soft-filtering to prevent cancelling of fragmentation effect but keeping the noise, or a much harder filtering that might remove part of the fragmentation. In our work, and with the aim of not damaging the target-components, we propose a statistical filtering by properly averaging specific consecutive beats. This technique allows us to statistically eliminate random noise, without damaging the relevant part of the fragmentation present in high frequencies. We used records from patient suffering hypertrophic myocardiopathy (HMC) diagnosed by MRI-LGE, due to this disease is highly related with the risk of suffer sudden death. This illness is characterized by the increase of the heart wall thickness (hypertrophy) in the absence of extramyocardical causes such as hypertension or valvopathies.
This paper is structured as follows. Section 2 describes the existing literature of PCA and ICA applications over ECG, especially all those ones suggesting or incorporating any physiological meaning in the analysis. In Section 3, the used databases are described, as well as the methods and techniques used throughout the experiments. Section 4 presents the results of the experiments carried out, both with the subrogated models and with the real diagnosed records. The mentioned section presents in detail the followed process, which incorporates novel work in terms of morphological and physiological analysis, to ensure the coherence of the finally validated model. Finally, Section 5 presents the conclusions of this work, and it also describes the next steps, which are rigorously collected in the companion paper [7], and which leverage on the results and conclusions of this first paper, to propose effective diagnostic risk indexes for the aforementioned diseases, by making use of advanced signal processing techniques and statistical learning techniques.
2. Background
In ECG processing, a number of researchers have proposed the use of PCA or ICA to detect clinically relevant waveforms that cannot be straightforwardly observed visually. The applications in this field could be divided into four main groups according to their goal, namely, noise reduction, atrial fibrillation (AF) detection, fetal ECG decoupling, and breathing signal isolation.
The first group of works is composed by algorithms implementing ICA or PCA to reduce noise on the ECG. In [8], the authors used the auto-correlation function of the ICA output applied over measured limb leads (I and II) of 9 healthy subjects. The component with the lowest value of area under the curve was reported as the noisiest component, and the signals without noise were computed by subtracting this noisy contribution to the original signals. A PCA approximation to the denoising problem was proposed also in [9], where the authors used a database consisting of normal ECGs artificially contaminated with noise. The algorithm presented included two steps. First, twelve-lead ECGs were detached by beats and compiled into matrices, one per each beat, hence making up one beat of every single lead. PCA was then applied to these matrices, those components achieving 95% of the standard deviation were selected, and then the PCA transformation was inverted. In the second step, the previous matrices were recomputed using the denoised beats, and then PCA was applied over these new matrices by selecting those components achieving the 98% of the standard deviation. Finally, PCA anti-transform was applied to the components computed before, hence obtaining the denoised signals. It can be summarized that these algorithms did not use the multivariate decomposition on a physiological basis, but rather under a computational and statistical rationale.
The second group of works is composed by algorithms using ICA or PCA in order to extract the AF signal from the ECG. A PCA approximation to solve this problem was proposed in [10], where the authors presented an algorithm that can quantify the presence of AF, using for that purpose a database compounded by six twelve-lead ECG registers with 300 s each. The registers were divided in two sets of 150 s, and each set was divided again in subsets of 10 s. Each subset was PCA-processed to extract the AF frequency by searching in the frequency domain in every principal component. Finally, the mean and the standard deviation of the AF frequency were computed for the complete record and the 150-second subset. An ICA approximation to solve this problem was proposed in [11], where the authors presented an algorithm to breakdown beats into the classification as normal, AF, and atrial flutter. The algorithm was tested over the MIT-BIH AF database. The beats were firstly detected using the Pan-Tompkins algorithm, and then isolated with a 150-sample window centered on the R-wave. A high order bispectrum was computed for each beat in order to enhance the hidden complexities present in nonlinear signals, and ICA was then applied to the bispectrum output to extract features from each beat. Consecutively, these features were processed with a K–Nearest–Neighbours classifier in order to assign beats to the defined classes. In summary, the multivariate exploration of conventional ECG leads, ICA, or PCA, opens the door to the physiological analysis as it transforms the geographical projections of standard ECG, as well as to a new domain more focused on the originating signal itself, and therefore bundled to the physiological reality.
The third group of works consists of algorithms which use ICA to derive the fetal ECG from the recordings of the mother ECG. An approximation to solve this problem is proposed in [12], where the signal was firstly filtered to reduce the noise in the ECG, and then processed by using a compressive sensed sparse binary matrix, which transforms the signal in a set of words from a previously created dictionary. ICA was applied over the processed signal in order to extract the independent components, and they were reconstructed by applying the inversion of a compressive sensed sparse binary matrix. Finally, the beats were classified into mother or fetal originated, according to their similarity to the dictionary words. Another algorithm to solve this problem is presented in [13], where the signal was firstly processed to reduce the noise, then the mother ECG was enhanced using ICA, and the mother QRS complexes were detected and cancelled from the original signal in order to reduce the interference with the fetal ECG. Then, the fetal ECG was enhanced using ICA over the signal without mother ECG, and the fetal QRS complexes were detected. This kind of algorithms stands for another application in which the physiological meaning of the components is specifically dealt, however, they explode the mother and fetal QRS complexes similarity, and the fact that the two kinds of QRS are not too overlapped.
The fourth group of works is compounded by algorithms which use PCA or ICA to extract the respiratory signal from the conventional ECG. In [14], an algorithm was proposed to extract this signal from the ECG, which was firstly filtered to reduce the noise, each QRS was then detected and aligned to create a matrix containing every beat, and then ICA or PCA were applied in order to extract the respiratory signal. The component containing this signal was selected by computing the power spectral density using the Welch method. Then, the extracted signal was interpolated to get the complete respiratory signal. Another algorithm with the same objective is presented in [15], where the signal was firstly filtered to reduce the presence of noise, and then the QRS complexes were detected. Wave matrices were then created using the detected beats, namely, one containing all the P waves, one containing all the T waves, and one containing all the QRS complexes. Finally, PCA was applied over each matrix to extract the three first principal components, which where compared with a reference signal to select the best respiratory signal. This kind of algorithms corresponds to an alternative application in which the physiological meaning of the components is specifically dealt, however, their focus is not the detection of a wave inside the ECG, but rather of a wave modulating the whole ECG.
In addition to these sets of algorithms, PCA and ICA are widely used in several different applications in the field of ECG processing. Examples of this include the feature extraction for bio-metric characterization [16,17,18], as well as to dimensionality reduction and beat classification [19,20], or ECG compression [21,22], among many others [23]. A number of applications take into account the physiological meaning of the PCA/ICA components applying the whole ECG, such as AF detectors or respiratory signal isolators, or the decoupling of originally separated overlapping signals, as fetal ECG, but none of them considers the localized isolation of elements that are present at individual waves in the existing ECG, as fragmentation-revealing requires.
3. Materials and Methods
This section is divided into three main parts. We firstly presented the used databased and we focused on the subrogated model, a set of signals manually fragmented that we used to modeling our algorithm. In second part, the preprocessing stage from the proposed algorithm is presented. Finally, the used multivariate transformations are shortly explained, and its peculiarities are presented.
3.1. Database and Subrogated Model
In this work, two patient databases are presented and used. The first one, called fragmented hypertrophic cardiomyopathy (FHCM) database, is compounded by 80 standard twelve-lead ECG records which were collected, analyzed, and diagnosed by expert clinicians in our group from Hospital Clínico Universitario Virgen de la Arrixaca (Murcia, Spain). These records were selected from a larger database compounded by 225 patients with standard twelve-lead ECG records, and we selected those ones which were in electronic format. The demographic data of the complete database were years and men-to-women ratio of 152/73. These ECG were recorded with GE-MAC 5000 system from General ElectricTM, at 500 Hz sampling rate and 4.88 resolution. An example of fragmented ECG and non-fragmented ECG in FHCM database can be seen in Figure 1a,b, respectively. The second database, called Control database, is compounded of the first 200 records from a database of 418 standard twelve-lead ECG from students of Universidad Católica de Murcia, where the demographic data of the complete database were years and men-to-women ratio was 314/104. These ECGs were recorded with ELI 350 system from MortaraTM and digitized at 1000 Hz sampling rate and 2.5 resolution. An example of control ECG can be seen in Figure 1c.
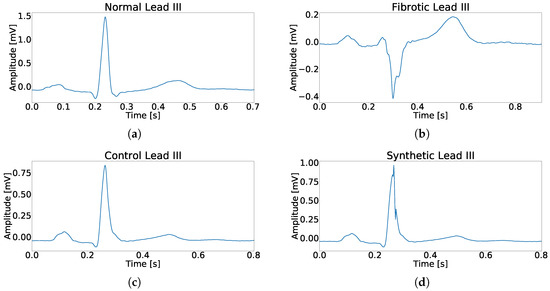
Figure 1.
Example for each type of used register in this work. (a) Example of a beat without fragmentation. (b) Example of a fragmented beat. (c) Example of a beat from control patient. (d) Example of a synthetically fragmented beat.
In addition to the before described databases, in this work we developed a new set of signals, so-called subrogate modeled signals, which comprise the control records after their artificial modification by adding a synthetic fragmented-wave component. This fragmented wave was added randomly in terms of number of the leads affected and of the time-slot in the QRS complex where it was located. The function used for the fragmented-wave component follows the expression of a simple sinusoid, as follows,
where A is a random number between 1% and 30% of the main peak amplitude, t is the time vector an its values going from 0 to , w is a random number between 4 ms and 24 ms that represents the fragmentation duration, and n represents the number of semi-cycles of the sinusoid. An example of synthetically fragmented ECG can be seen in Figure 1d.
3.2. ECG Preprocessing
The importance of pre-processing has been widely described in the literature for any kind of signal, but in biological signals is it undoubtedly a key stage. In the case of the ECG, it is extremely relevant as it is not possible to physically set a noise-free environment, as a number physiological events are simultaneously taking place side by side to heart beat. Examples of that are breathing, and involuntary muscle activation among others. In this work we designed the preprocessing in three phases, namely, signal settlement, QRS detection, and beat template creation.
The signal settlement process included three different processes as well: (i) Starting with a low-order band-pass filtering from 0.5 Hz to 100 Hz, to reduce the out-of-band noise without changing the wave forms; (ii) Then applying a set of notch filters centered on 50 Hz and its harmonics, to reduce the power-line interference, to the signal; and (iii) finally applying a baseline wander filter, based on cubic spline interpolation [24].
In the QRS detection according to the implementation in [25], after filtering the input record, the derivative feature signals are computed, and QRS complexes are detected through an adaptive threshold.
According to physiological knowledge, the fragmentation is supposed to be present in almost every beat scoping the heart region where this affection is visible. Therefore, the creation of a beat template for each lead could be understood as a a morphology-emphasizing statistical filtering, as far as this affection in concerned. Beat templates were computed by averaging highly correlated beats of each lead, according to [26].
3.3. Multivariate Analysis for Fragmented-Wave Isolation
In an attempt to boost fragmentation waves within the ECG, two approaches were explored. Taking into account that, according to medical knowledge, fragmented waves are expected to debut in the ECG as an additive limited amplitude wave over standard QRS Complex, our first approach assumed uncorrelation among the QRS components and the fragmentation waves. Hence, PCA is proposed as a likely valid tool to detach and consolidate all the diffused constituents of the different projections of the affection over the separate leads. In our second approach, we assumed that the fragmented waves could be modeled as statistically independent from the other waves in the ECG, and accordingly we proposed the use of ICA for the same objective. A deep description on PCA and ICA multivariable techniques and applications can be easily found in the corresponding references included hereafter, although a short description is included next for the reader convenience.
PCA is a statistical multivariate processing tool that allows us to decompose a signal in uncorrelated sub-signals, so-called principal components. From a mathematical point of view, PCA can be defined as an orthogonal linear transformation that maps the input signals to a new coordinate system where the new orthogonal axes are the directions of maximum variation of the input signals. This also means that we are implicitly assuming a multivariate Gaussian distribution on the time samples of the analyzed multivariate recording. In order to compute the PCA of the ECG signals, several steps must be followed, which are summarized next: First, the data must be centered and scaled, and this process is done by subtracting the mean from each variable and dividing by its standard deviation, in order to get the input signals with zero mean and unit variance; Second, the covariance matrix of the input signals is computed, and this matrix takes into account the variance of each variable in our signals; Third, the eigenvectors and eigenvalues of the covariance matrix are computed; Then, the eigenvectors are sorted according to the decreasing value of their eigenvalues; Finally, the principal components are computed by vector-multiplying the eigenvectors and the input signals [27].
ICA is a statistical multivariate method for decomposing signals in a set of new ones that are statistically independent. Let us denote
where is the matrix that contains the recorded multichannel ECGs, is matrix that represents the effect of the patient body over the heart surface signals represented by a mixing matrix, and represents the heart surface signals. ICA is defined as a linear transformation that can unmix the previously mixed signals, in other words, ICA can compute matrix without knowing and , as far as the source signals in meet some special conditions, namely, the source signals must be statistically independent, and the statistical distribution of the source signals must be non-Gaussian. The steps to compute ICA are next summarized. First, the input signal is centered and whitened, in order to get an uncorrelated input signal with zero mean and unit variance. Second, the independent components are computed, and for this purpose the method selected here (FastICA) uses an iterative process that minimizes the Gaussianity of the extracted components by using the concept of negentropy. Finally, and due to the unmixed signal given by ICA are unsorted, it is necessary to sort them, and for this purpose we proposed the use of the kurtosis as sorting key to sort the variables from less Gaussian to more Gaussian [28].
The use of PCA or ICA has two drawbacks that can especially affect us. The first one is referred to the sign of the output. According to PCA processing, the eigenvectors are computed by solving the next equation,
where is the eigenvector, is the input-signals matrix, and is the eigenvectors matrix. As it can be derived from this equation, both and are solutions for it. In the case of ICA, the process that minimize the Gaussianity has a similar property. This effect should be managed in order to extract information about the PCA or ICA output. The second inconvenient is referred to the loss of the spatial information, as both transformations compute new signals by using linear operators removing the spatial information given by the leads in the input signals. These two drawbacks are explored and addressed in the next section.
4. Experiments and Results
In this section we present different experiments and their corresponding results, and they are divided into three sets. In the first set of experiments, we developed and applied different techniques plus PCA transformation in order to enhance the presence of fragmentation waves in the ECG. In the second set of experiments, we applied ICA with the same objective. Finally, we benchmarked these techniques from both groups over real fragmented signals.
4.1. PCA as Fragmentation-Wave Enhancement Tool
The aim of the following set of experiments is to determine the behavior of the PCA transformation to enhance the presence of fragmentation in common twelve-lead ECG. For this purpose we applied PCA over the beat templates, as according to medical knowledge, the fragmentation is the result of a missconductions over the myocardium, thus it must be replicable for the beats within each lead. Being said that, we could argue on how PCA will manage the fragmented wave, and if it will consistently consolidate the presence of this singular additive element over a certain component. In other words, and with a much wider view, we need to determine how the presence of fragmentation in the ECG could alter the order in the PCA-components output, and how these new components will be consolidated in the PCA output. To do so, we propose the use of a subrogated database to compare the PCA output between non-affected and affected equivalent cases. Our database for this purposed consisted of the control beat templates and for their synthetically fragmented copies, as described earlier. We also compared the PCA output of the control and subrogated through the Pearson correlation coefficient (PCC) to identify effective fragmented waves contribution transference among different principal components.
As a result, we built the confusion matrix presented in Table 1. As it can be observed in this table, components from 6-th to 11-th exhibited a ratio of paired components lower than 0.90, showing a relevant leakage among components. We can conclude that the use of this technique does not make possible the isolation of the fragmentation contribution into a few components.

Table 1.
Normalized confusion matrix of PCA for 12-lead ECG. The value of the table represent the ratio of i-th component of control patient that is paired with the j-th component of synthetically fragmented patient according to the value of PCC.
To obtain better knowledge of how PCA methodology is affected by fragmentation, and how fragmentation is distributed over the output components, we defined the dispersion coefficient given by
where N is the number of principal components, and denotes the confusion matrix coefficients. This coefficient reflects the aggregated leakage effect of confusion matrix, and for the case of PCA applied over twelve-leads, the obtained value was 0.14. As it can be seen in Figure 2, which illustrates the swapping effect among in-and-out components, the existence of a low-power fragmentation waves (red lines in the third column) induces a some position swapping in the PCA output, and this effect can be observed in the fourth column, which shows the correlation between the fragmented and the non-fragmented components.
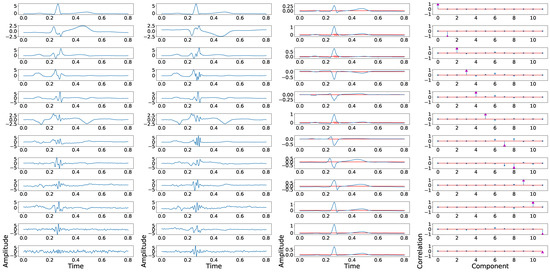
Figure 2.
Example of principal components position swapping in twelve-lead PCA model. The first column shows the principal components of a control ECG, the second column shows the principal components of a synthetically fragmented replication of the previous control ECG, the third column shows the control ECG in blue, and the fragmented wave added in red. The fourth column shows the PCC between the principal component of control ECG with each component of synthetically fragmented.
In order to further improve the dispersion coefficient, we proposed the use of linearly independent leads in the PCA process, to elaborate whether the inclusion of not duplicated information could make a difference in this topic. According to medical knowledge, leads I, II, III, aVF, aVR, and aVL are related according to the following equations,
Therefore, and due to the fact that leads III, aVF, aVR, and aVL add nothing more than redundant information to the rest of the leads, we could explore the fragmentation isolation capabilities of the suggested methodology when these leads are not considered in this process. Results of this experiment are shown in Table 2, where a lower dispersion rate can be observed compared with Table 1. Similar results are observed in terms of dispersion coefficient, which is reduced to 0.07. However, the findings in Table 2 are even more illustrative and relevant, confirming that only three components presented figures lower than 0.90, hence narrowing the uncertainty of PCA output components. Figure 3 shows an example of relevant component in-and-out cross-signal-transference applying this technique. An exceptional and singular case could be found in Panels (2,3) of said figure, where this swap is due to the non-physiological case of the prominent amplitude of the additive fragmented wave, the magnitude of which positively compares to the T-wave.
Table 2.
Normalized confusion matrix of PCA for the 8 independent leads from ECG. The value of the table represent the ratio of i-th component of control patient that is paired with the j-th component of synthetically fragmented patient according to the value of PCC.
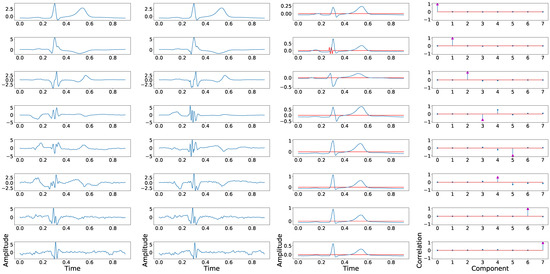
Figure 3.
Example of principal component position swapping in 8 independent leads configuration. The first column shows the principal components associated with the control ECG. The second column shows the principal components derived from the synthetically fragmented replication of the control ECG. The third column shows the original signal in blue and the fragmented wave in red. The fourth column shows the PCCs between the component of the control signal and each component of the fragmented signal.
In order to highlight fragmentation in PCA transformed components, we also operated with the previously defined database, but only taking into account the independent leads, namely, I, II, V1, V2, V3, V4, V5 and V6, by following the methodology described hereafter: First, PCA was computed for control and subrogated records; Then, the root mean square error (RMSE) was calculated for control () and subrogated () signals; and finally, coefficient was evaluated. RMSE and were computed using the closed form,
where l correspond to the lead of the original ECG signal, is the matrix that contains the beat templates of the original ECG signal, is the fragmented replication of , c is the principal component, is a matrix that contains the principal components of , and is the matrix that contains the principal components of . This coefficient belongs to the interval [−1,1], and positive values of this coefficient represent RMSE values computed over normalized principal components higher than the RMSE values computed over normalized ECG. Finally, we compute the enhancement ratio as the proportion of cases where .
In Figure 4a the distribution of along each principal component is shown. As it can be noticed, the effect of fragmentation is higher in the detail-components, those ones that exhibit low variance, as they usually consolidate higher frequency constituents. Figure 4b shows the defined enhancement ratio for each output-component, offering a view of the number of cases presenting the fragmentation enhancement using this technique. Finally, Figure 4c shows the joint enhancement ratio as the number of components that jointly achieve a complete detection of the fragmentation. As it can be observed, a trade-off between results and computational efficiency is reached using the 3 detail components.
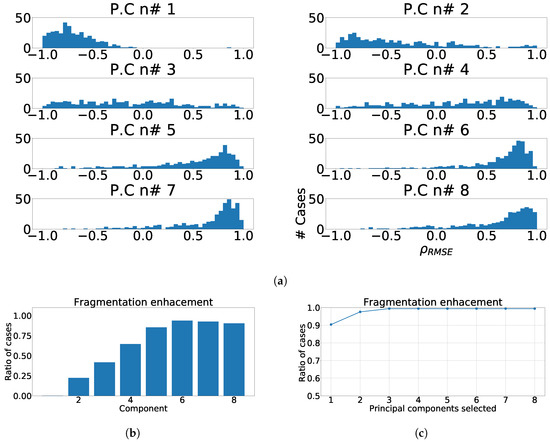
Figure 4.
Measurements of fragmentation enhancement using PCA over independent leads. (a) Distribution of coefficient for each component, values higher than 0 represent fragmented wave enhancement. (b) Enhancement ratio for each component. (c) Joint enhancement ratio.
As we reported in the previous experiments, the fragmented wave could be a source of divergence among the principal component output. Therefore, we designed this experiment to quantify the effect of the different parameters of the fragmented wave over the principal component order. We used a subset of 50 cases from the control database. We created copies of these cases and we varied the fragmented wave parameters to better understand the effects in terms of where the fragmentation ends up swapping after PCA. The varied features were: amplitude, which was varied from 1 to 50% of the maximum amplitude of the signal; width of the fragmented wave, which was varied from 10 to 200 ms; number of cycles of the fragmented wave, which was varied from 0.5 to 25 cycles; and number of lead affected by the fragmentation, which was varied from 1 to 8 leads. These parameters were varied one by one to ensure that the effect of one of them over the position swapping was not contaminated by the others. We computed the confusion matrices for each case and the dispersion coefficient. In Figure 5, the dependence of the dispersion coefficient with each parameter is shown. As we can see, the parameters with the strongest effect over the dispersion coefficient are the amplitude of the fragmented wave and its width.
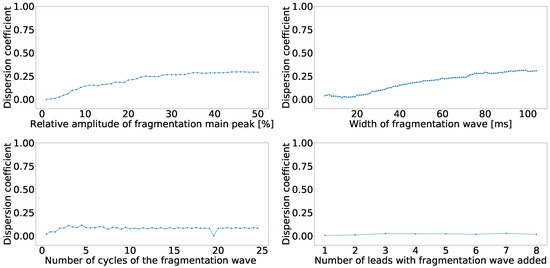
Figure 5.
Dispersion coefficient against the fragmented wave amplitude (upper left), fragmented wave width (upper right), fragmented wave number of cycles (lower left), and number of affect lead (lower right) for independent-lead PCA model.
The next experiment was performed to evaluate the effect of the fragmentation wave parameters variation over the coefficient. For this experiment, we used the same values of the previous ones and computed the coefficient for each parameter and for each principal component. As a result, Figure 6a shows the effects of fragmented wave amplitude variation on the coefficient, Figure 6b shows the effects of fragmented wave width on the coefficient, Figure 6c shows the effects of the number of cycles included in the fragmented wave on the coefficient, Figure 6d shows the effect of the variation on the number of leads affected. As can be seen in Figure 6a,b, the coefficient distribution is positive in the majority of the principal components. This effect is due to the emergence of new components caused by large amplitude or width that PCA tends to isolate them. As it can be seen in Figure 6c,d, the distribution is negative in the higher (detail) components and it becomes positive when we go to the lower (baseline) components. According to literature and knowledge, and as an expected behavior, this is due to the fact that these two parameters are not solid enough to create new components.
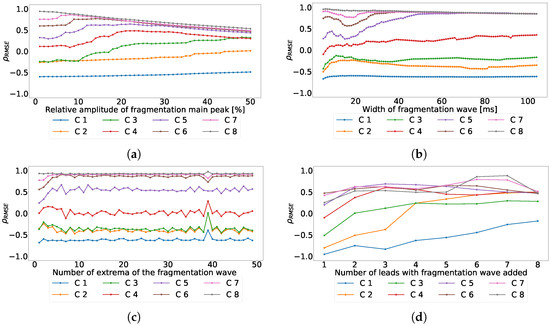
Figure 6.
Effect of the different parameters of the subrogated fragmented wave over the coefficient for independent-lead PCA model. Values lower than 0 correspond with RMSE higher in the ECG than in the principal components, values higher than 0 correspond with RMSE higher in principal components than in the ECG. (a) Effect of the fragmented wave amplitude, (b) effect of the fragmented wave width, (c) effect of the cycle number of fragmented waves, and (d) effect of the number of affected leads.
The last set of PCA experiments was created to try out the enhancement in fragmentation detection through heart-region projections. According wto medical knowledge, the ECG leads can be divided in three main groups related to the heart region that they reflect. These regions are: ntero-septal, which includes V1, V2, V3 and V4; Lateral, which includes I, aVL, V5 and V6; and inferior, which includes II, III and aVF.
The first experiment of this set will determine if the presence of fragmentation in the ECG could change the order in the PCA-components output. To do so, we proposed the use of a subrogated database to compare the principal component output under a controlled situation. We proceeded as follows for the control ECG and for their synthetically fragmented copies. First the beat templates were created according to the method described before. Then, we compared the principal component of the control and synthetically fragmented beat templates by using the signal correlation. We the used the PCC or Pearson correlation coefficient to test whether the PCA components position is maintained when fragmentation is synthetically added to the signal. This analysis was performed for each region individually. Results are summarized in the confusion matrices presented in Table 3a–c. The dispersion coefficient for each region are 0.009 in antero-septal region, 0.034 in lateral region, and 0 in inferior region. These results are much better than the achieved by the independent-lead case in terms of PCA component mismatching.
Table 3.
Normalized confusion matrix for each heart region, (a) antero-septal, (b) lateral region, and (c) inferior region by using PCA. For each one, the value of the table represent the ratio of i-th component of control patient that is paired with the j-th component of synthetically fragmented patient according to the value of PCC.
Given that the order in the position of the principal components provided apparently better results in a regional approach than the previously evaluated independent-lead model, we again moved forward to quantify the enhancement using this approach. To do so, this experimental setup was similar to the used in the independent-leads model. First, we extracted the principal components for control ECG and fragmented ECG using PCA. Finally, we computed the coefficient , and we derived the enhancement ratio as the portion of cases where .
Figure 7a, Figure 8a and Figure 9a show the distribution of for each region and component. As it can be observed, the distributions did not improve the results obtained by PCA over independent-lead model. The value of RMSE measured in the ECG was greater than the value of RMSE measured in principal components. Figure 7b, Figure 8b and Figure 9b show the enhancement ratio for each component, which is also lower than the value achieved in the independent-lead model. Finally, Figure 7c, Figure 8c and Figure 9c show the joint enhancement ratios that again did not outperform the independent-lead model. Therefore, we should elaborate the use of the regionalization in the detection of fragmentation using PCA does not provide better results than the use of the independent leads. Table 4 summarizes the most relevant results of this set of experiments.
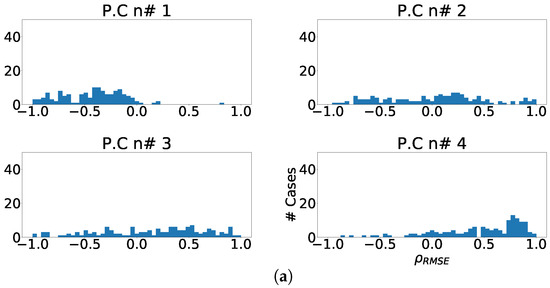
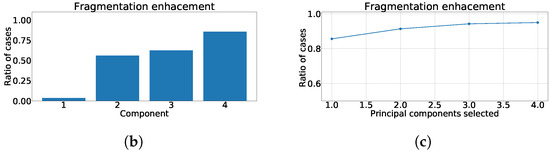
Figure 7.
Different measurements for PCA over antero-septal heart region. (a) Distribution of coefficient for each independent component, values lower than zero represents cases where the RMSE measured over the ECG is greater than RMSE measured over the independent component. (b) Ratio of fragmentation wave enhancement for each independent component, this ratio is computed as cases where the value is greater than zero. (c) Cumulative ratio of fragmentation wave enhancement, this ratio is computed by joining the results of isolated independent components.
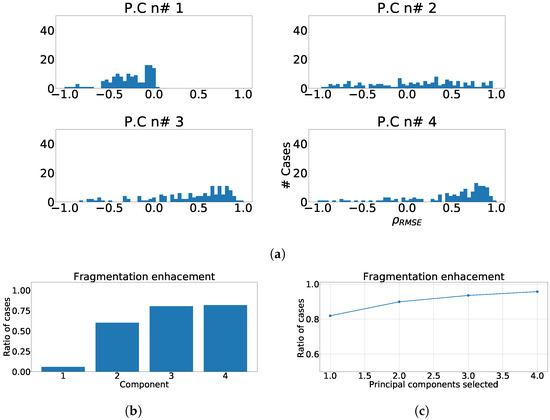
Figure 8.
Different measurements for PCA over lateral heart region. (a) Distribution of coefficient for each independent component, values lower than zero represents cases where the RMSE measured over the ECG is greater than RMSE measured over the independent component. (b) Ratio of fragmentation wave enhancement for each independent component, this ratio is computed as cases where the value is greater than zero. (c) Cumulative ratio of fragmentation wave enhancement, this ratio is computed by joining the results of isolated independent components.
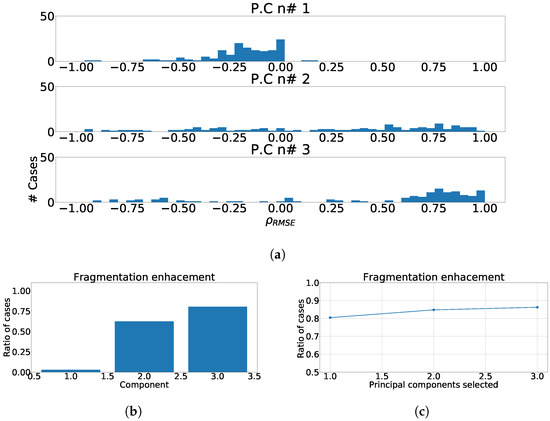
Figure 9.
Different measurements for PCA over inferior heart region. (a) Distribution of coefficient for each independent component, values lower than zero represents cases where the RMSE measured over the ECG is greater than RMSE measured over the independent component. (b) Ratio of fragmentation wave enhancement for each independent component, this ratio is computed as cases where the value is greater than zero. (c) Cumulative ratio of fragmentation wave enhancement, this ratio is computed by joining the results of isolated independent components.
Table 4.
Summary table with the relevant values for each proposed method based on PCA.
4.2. ICA as Fragmentation-Wave Enhancement Tool
In this new set of experiments, we discuss about whether the use of multivariate transform ICA can enhance the presence of fragmentation wave in common ECG. For this purpose, we applied the same processes described earlier on PCA. Namely, the signal is firstly filtered and detrended, then the beats are detected, then beat templates are created by averaging those well-correlated beats, and finally ICA is applied over these beat templates. One relevant difference between the present analysis and the previous one, is the fact that the output of ICA is not expected to be sorted. Hence, to better evaluate and work with this technique, we used the kurtosis of each of the ICA output as a sorting criterion, setting from higher to lower. Just as a reminder for the reader, we would like to mention that kurtosis is a very well-known indicator of Gaussianity [28].
As well as in the PCA part, we computed to compare the RMSE of the ECG with the RMSE of the independent component. In order to ensure proper order of ICA outputs, we designed an additional starting experiment. In this experiment we worked with 400 control cases and their respective fragmented replications, ICA was applied over the pairs control-fragmented beat templates, and outputs were sorted according to their decreasing kurtosis. Then, we computed the PCC between the independent components of the fragmented and control cases. Finally, we created the confusion matrix shown in Table 5.
Table 5.
Normalized confusion matrix of ICA for the twelve-lead ECG. The value of the table represent the ratio of i-th component of control patient that is paired with the j-th component of synthetically fragmented patient according to the value of PCC.
As it can be seen in the aforementioned table, the values in the diagonal are lower than in the PCA analysis, and in these cases the value of was 0.70, due to the fragmentation wave inducing larger changes in the independent components than in the previous case. After this analysis, we performed a careful visual inspection to detect which components were more affected by the fragmentation wave. We noticed that the use of the kurtosis in fragmented waves tends to group the independent components in two main groups, namely, the non-affected components, which appear in the first positions, and the affected components, which appear in the last positions.
Considering the previous results, we designed as mentioned a replicable, structured, and coherent, statistical property, for a later computation of value and the ratio of enhancement described earlier. To do so, we first computed ICA over the pair control-fragmented waves and output is sorted according to kurtosis. Then, correlation was computed among the sorted fragmented and control components. Finally, sign inversion was applied when the absolute value of the highest PCC is negative, to ensure proper transformation taking into account that positive and negative solutions are both valid and that the standard process does not guaranty the same outcome when signals slightly differ. The distributions of for each independent component are shown in Figure 10a. As it can be seen, fragmentation wave information is spread over every independent component, but it this contribution is significantly higher in the components with lower kurtosis. This behavior follows previous PCA results, where fragmentation information was strongly present, and clearly in the components with lower variance.
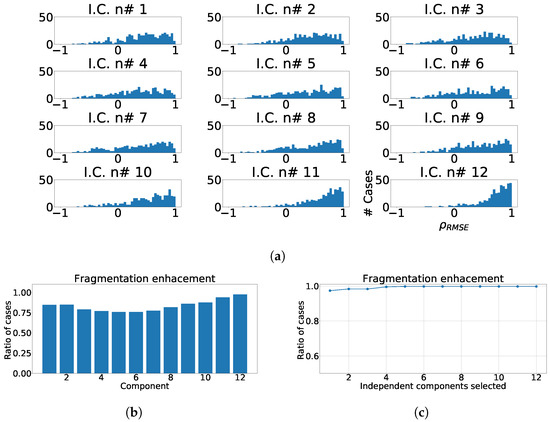
Figure 10.
Different measurements for ICA applied over twelve-lead ECG. (a) Distribution of coefficient for each independent component, values lower than zero represents values of RMSE over ECG greater than values of RMSE over ICA output. (b) Ratio of fragmentation wave enhancement for each independent component, ratio of cases where the coefficient is greater than zeros. (c) Cumulative ratio of fragmentation wave enhancement, this ratio is computed by joining the results of isolated independent components.
In next step and for statistical analysis purposes, we computed the ratio of cases in which the presence of fragmentation wave was enhanced in the corresponding components. For this purpose, when value is greater than zero, it is considered considered the existence of fragmentation-boost or enhancement in the selected component. Figure 10b shows the ratio of cases which presents fragmentation wave enhancement, and it can be observed that the greater values of improvement appear in the components with lower kurtosis, which is also like in case of PCA where they appeared in components with lower variance. Finally, we calculated the ratio of fragmentation wave enhancement depending of the number of independent components, in order to know the number of them that we must to take to achieve a complete detection of fragmentation, and as it can be observed, the optimal is reached by taking the last four components as shown in Figure 10c.
In the subsequent experiment, we calculated the dependency of with the variables which model the fragmentation wave. We used the same parameter variation as in the preceding PCA parts, namely, amplitude of the wave from 1% to 50% of the maximum beat template amplitude, number of cycles of the wave from 0.5 to 25, width of the wave from 10 to 200 ms, and number of leads affected by fragmentation from 1 to 12. In this experiment, we worked with a subset of 50 cases from the control database. We created replications of these cases and we varied the fragmentation wave parameters according to previous values. Figure 11 shows the variation of with each parameter variation. As it can be observed, the parameters that induce major changes in the value are amplitude (Figure 11a) and width (Figure 11b) of the fragmentation wave. Unlike the PCA part, these two parameters present a decreasing curve because when they increase the sine, which models the fragmentation wave, it is more easily separable by ICA and the fragmentation information is isolated in only one component, which varies its position in the output.
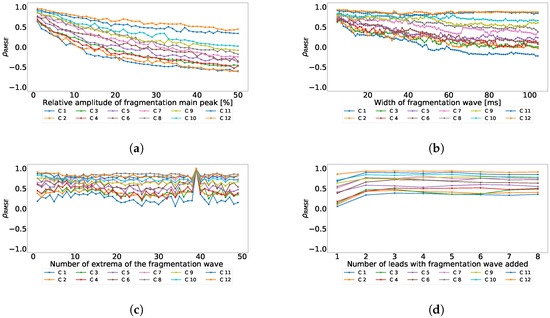
Figure 11.
Effect of the different parameters of the subrogated fragmented wave over the coefficient using the ICA twelve-lead model. Values lower than 0 correspond with RMSE higher in the ECG than in the principal components, values higher than 0 correspond with RMSE higher in principal components than in the ECG. (a) Effect of the fragmented wave amplitude; (b) Effect of the fragmented wave width; (c) Effect of the cycle number of fragmented waves; (d) Effect of the number of affected leads.
In the following subset of experiments inside the ICA series, we applied the processing over heart regions, as ECG leads can be consolidated in three main groups, related to the heart region they collect the electrical projection from. These are the antero-septal (which includes V1, V2, V3 and V4), the lateral (which includes I, aVL, V5 and V6) and the inferior (which includes II, III and aVF).
The first experiment of this new set was designed to determine if the presence of fragmentation in the ECG would make a difference in ICA output when sorted by kurtosis. To do so, we proceeded as follows, using the control ECGs and for their synthetically fragmented replications. First, the beat templates were created according to the method described before. ICA was secondly applied over them and the outputs were sorted according to their kurtosis. Then, the PCC was computed among control and fragmented replications. PCC was stablished as the driver to identify the portion of the signal transferred during the process. This technique was applied for each region. Results were merged into confusion matrices, hereafter presented in Table 6. As it can be observed, the use of regionalized models plus kurtosis sorting improved the matching between independent components compared with the twelve-lead model, moreover the, , dispersion coefficients were 0.23, 0.21, and 0.26, which are lower than the twelve-lead model.
Table 6.
Normalized confusion matrix for each heart region for ICA model, for (a) antero-septal, (b) lateral region, and (c) inferior region using ICA plus kurtosis. For each one, the value of the table represents the ratio of i-th component of control patient that is paired with the j-th component of synthetically fragmented patient according to the value of PCC.
The next experiment numerically quantified the improvement on the fragmentation wave information using coefficient. In this experiment we used the complete subrogated model including 400 control cases and 400 synthetically fragmented replications. The process followed in this case was the following. First, for pair-control-fragmented cases, ICA was computed over each region separately. Then, the outputs were sorted according to their kurtosis. Afterward, we computed the PCC between the kurtosis sorted output of fragmented case and control case. Finally, outputs of control cases were sorted according to PCC and the coefficient was computed. The coefficient distribution is shown in Figure 12a, Figure 13a and Figure 14a. As it can be observed, the distribution is almost flat due to the sparse information of the fragmented waves dealt in each component. This effect is clearly visible in Figure 12b, Figure 13b and Figure 14b, which show the ratio of cases that exhibited a certain enhancement, understood as the cases where coefficient is greater than zero. We can observe the similarity between the enhancement ratio of each independent component in the three panels. The values are close to 0.75 of enhancement. Finally, we computed the cumulative ratio of enhancement in order to select several components that combined would eventually contains improvement in the mentioned ratio of the cases. Figure 12c, Figure 13c and Figure 14c show this cumulative ratio, and it can be observed that these values are lower than the twelve-lead model. The maximum values reached for each region were 0.921 in antero-septal region, 0.920 in lateral region, and 0.877 in inferior region.
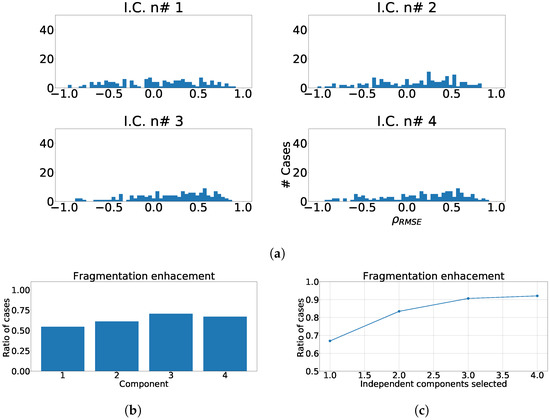
Figure 12.
Different measurements for the antero-septal region of the heart with ICA model. The panel (a) shows the distribution of coefficient for each independent component, values lower than zero represents cases where the RMSE measured over the ECG is greater than RMSE measured over the independent component. Panel (b) shows the ratio of fragmentation wave enhancement for each independent component, this ratio is computed as cases where the value is greater than zero. Panel (c) shows the cumulative ratio of fragmentation wave enhancement, this ratio is computed by joining the results of isolated independent components.
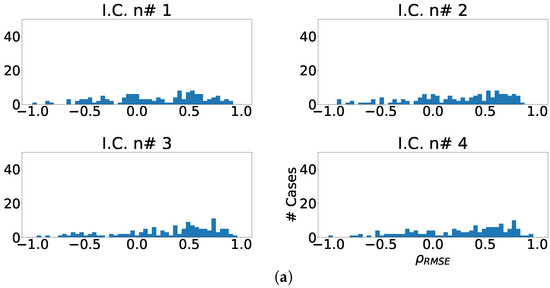
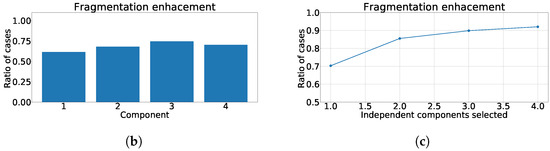
Figure 13.
Different measurements for the lateral region of the heart with ICA model. (a) Distribution of coefficient for each independent component, values lower than zero represents cases where the RMSE measured over the ECG is greater than RMSE measured over the independent component. (b) Ratio of fragmentation wave enhancement for each independent component, this ratio is computed as cases where the value is greater than zero. (c) Cumulative ratio of fragmentation wave enhancement, this ratio is computed by joining the results of isolated independent components.
Figure 14.
Different measurements for the inferior region of the heart with ICA model. (a) Distribution of coefficient for each independent component, values lower than zero represents cases where the RMSE measured over the ECG is greater than RMSE measured over the independent component. (b) Ratio of fragmentation wave enhancement for each independent component, this ratio is computed as cases where the value is greater than zero. (c) Cumulative ratio of fragmentation wave enhancement, this ratio is computed by joining the results of isolated independent components.
In the last group of experiments of this set, we tested the viability of using just the eight mathematically independent lead as the input to our ICA model. An equivalent process was applied to this case as described in prior experiments. The confusion matrix for this case is presented using the kurtosis as sorting criteria in Table 7. In this experiment, the figures in the diagonal showed better performance than the twelve-lead model, moreover this case showed a 0.40 . Finally, we measured the enhancement in fragmentation waves by using , the ratio of fragmentation enhancement, and the ratio of cumulative fragmentation enhancement as described earlier. As it can be observed in Figure 15a, the distribution of the fragmentation wave information is spread through all the independent components, but with a much more relevant intensity in the lower components, and they present a higher number of cases with positive . As it can be seen in Figure 15b, the shape of the distribution is similar to the twelve-lead model, but the ratio of component-by-component enhancement is much lower. Finally, Figure 15c shows the ratio of cumulative fragmentation enhancement that in this case reached the best results using four components. Table 8 shows a summary of the results, and according to the displayed figures, the best model according to the represented figures was the using the twelve-lead.
Table 7.
Normalized confusion matrix of ICA over 8 independent lead model. The value of the table represent the ratio of i-th component of control patient that is paired with the j-th component of synthetically fragmented patient according to the value of PCC.
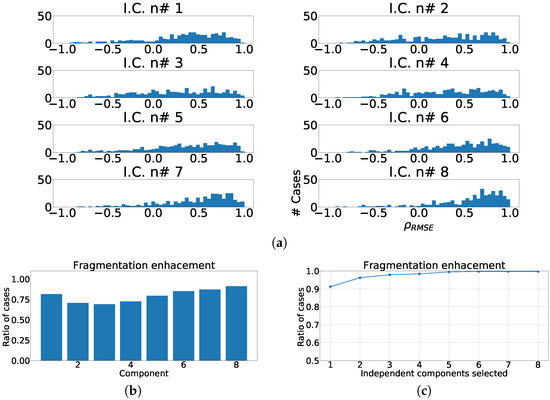
Figure 15.
Different measurements for ICA over independent leads model. (a) Distribution of coefficient for each independent component, values lower than zero represents cases where the RMSE measured over the ECG is greater than RMSE measured over the independent component. (b) ratio of fragmentation wave enhancement for each independent component, this ratio is computed as cases where the value is greater than zero. (c) Cumulative ratio of fragmentation wave enhancement, this ratio is computed by joining the results of isolated independent components.
Table 8.
Summary table with the most relevant values of each proposed method based on ICA.
4.3. Real Case for Fragmentation-Wave Enhancement
In this experiment we checked the behavior of the previously described methods, but this time applied it to real fragmented cases. The experimental set-up was divided similarly to the earlier approach, in two stages; namely, preprocessing and fragmentation analysis. The preprocessing followed very much the setup described earlier, but for the reader convenience and in an attempt to provide a summarized full picture, it is sketched here again: First, the signals were band-pass filtered in order to reduce noise; Second, baseline wander was removed using cubic spline interpolation; Third, the main peaks were detected using the algorithmic carefully developed in our group for years working in this area [25]; Finally, the beat templates were created for each lead, through statistical filtering, averaging only high-correlated peaks. For more detailed information on the method, the interested reader can see [26]. As a second step, the wave enhancement evaluation differed from previous analysis as we do not benchmark with the corresponding un-fragmented pair, although comparisons is possible but only over control signal and again only in statistical terms. The first proposed method that was conveyed was PCA transformation and we followed the strategy described here after. First, the beat templates were selected according to independence criteria, in other words, we picked the mathematically eight independent leads (I, II, V1, V2, V3, V4, V5 and V6). Then PCA was applied over beat templates, and we selected the three components with lower variance. For the second case, we applied ICA transformation over beat templates, and output components were sorted according to kurtosis. Then, the last four independent components according to their kurtosis were selected.
As it can be seen in Panel (c) from Figure 16, Figure 17, Figure 18, Figure 19 and Figure 20, the fragmentation in PCA appears of two different ways, namely, as a large number of independent peaks Figure 16c and Figure 19c, or as notchs and slurs similar to those ones which appears in fragmented ECG. In ICA cases (Panel (d) from Figure 16, Figure 17, Figure 18, Figure 19 and Figure 20), the fragmentation waves appear as a high frequency noise inside the QRS window.
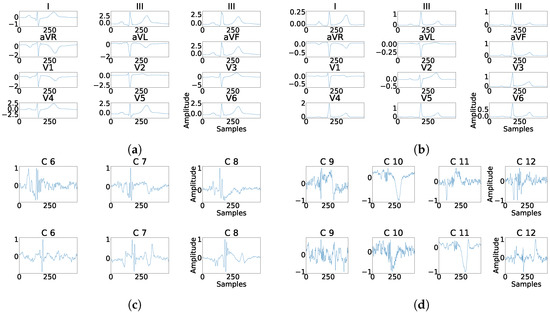
Figure 16.
Example of fragmentation wave enhancement over real fragmented case. (a) Beat templates for each lead of real fragmented case. (b) Beat templates for each lead of control case. (c) Results of the best PCA method for the real fragmented case, in top subpanels and control case in bottom panels. (d) Results of the best ICA method for the real fragmented case, in top subpanels and for the control case in bottom panels.
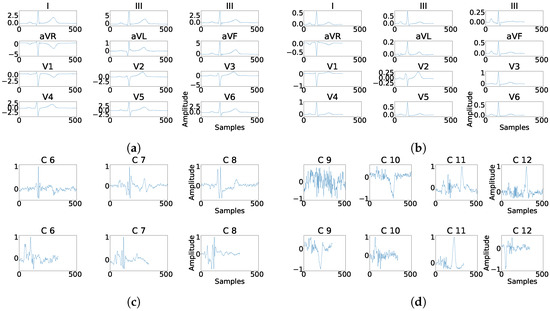
Figure 17.
Example of fragmentation wave enhancement over real fragmented case. (a) Beat templates for each lead of real fragmented case. (b) Beat templates for each lead of control case. (c) Results of the best PCA method for the real fragmented case, in top subpanels and control case in bottom panels. (d) Results of the best ICA method for the real fragmented case, in top subpanels and for the control case in bottom panels.
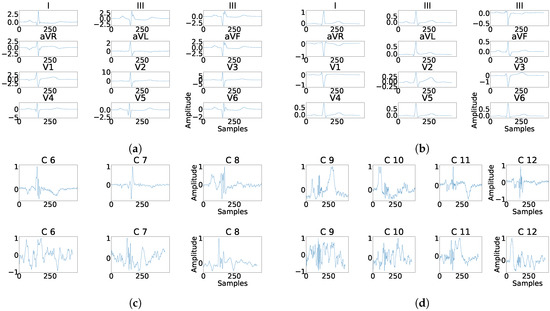
Figure 18.
Example of fragmentation wave enhancement over real fragmented case. (a) Beat templates for each lead of real fragmented case. (b) Beat templates for each lead of control case. (c) Results of the best PCA method for the real fragmented case, in top subpanels and control case in bottom panels. (d) Results of the best ICA method for the real fragmented case, in top subpanels and for the control case in bottom panels.
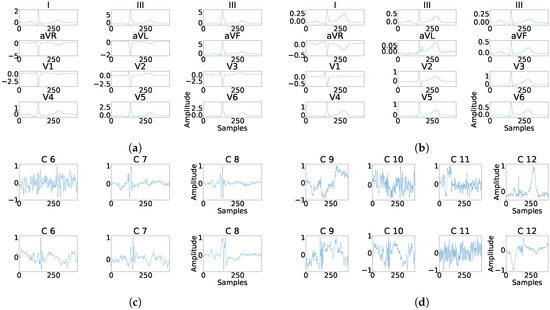
Figure 19.
Example of fragmentation wave enhancement over real fragmented case. (a) Beat templates for each lead of real fragmented case. (b) Beat templates for each lead of control case. (c) Results of the best PCA method for the real fragmented case, in top subpanels and control case in bottom panels. (d) Results of the best ICA method for the real fragmented case, in top subpanels and for the control case in bottom panels.
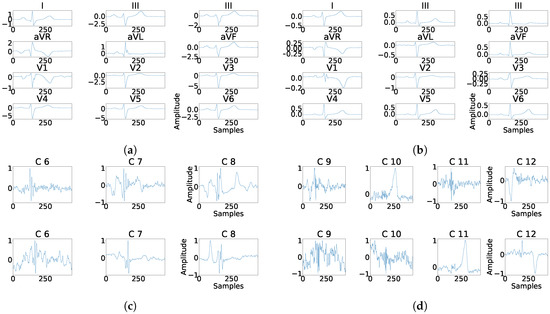
Figure 20.
Example of fragmentation wave enhancement over real fragmented case. (a) Beat templates for each lead of real fragmented case, (b) beat templates for each lead of control case, (c) results of the best PCA method for the real fragmented case, in top subpanels and control case in bottom panels, and (d) results of the best ICA method for the real fragmented case, in top subpanels and control case in bottom panels.
4.4. Transformation-Matrices Behavior
The focus of this last experiment was to determine the existence of some kind of interesting behavior in the distribution of the matrices that transform the recorded leads into principal (independent) components. The experimental setup was the following. First, we extracted the transformation matrices for PCA and ICA. Second, we normalized these matrices, in the PCA case using the eigenvectors as they stayed in [−1,1] interval. For ICA, we perform a normalization similar to the PCA case, but using eigenvectors and eigenvalues, as follows: , where is the new transformation matrix, is the original transformation matrix derived from ICA process, and is a normalization coefficient computed as .
In the last part, the transformation matrices were split in eigenvectors and grouped accordingly. Then, each one of this group was aligned by eigenvalues in absolute terms, to prevent sign changes. The alignment was performed inversion when correlation value resulted negative, computed with the maximum non-normalized transformation vector of each group.
As it can be observed in Figure 21, the distribution of the transformation matrix for the control records, Figure 21a,c is similar to the distribution matrix for the manually fragmented records, Figure 21b,d. This effect shows that PCA transformation is stable and its transformation matrices values appear to be concentrated. Alternatively for ICA, Figure 22 shows the distribution of the transformation matrix for the control records appears to be somehow more spread in Figure 22b,d. Figure 22a,c were also similar to the distribution of the manually fragmented records. As a result it was found that the number of components affected by fragmentation was larger than in the PCA case.
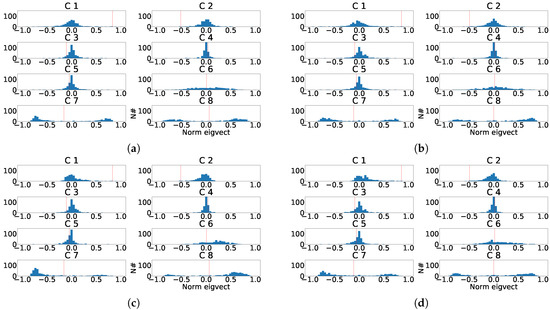
Figure 21.
Distribution of the eigenvector components values for the last principal component of the eight independent lead model. (a) Distribution of the eigenvector components for each control patient. (b) Distribution of the eigenvector components for each subrogated fragmented patient. (c) Aligned distribution of eigenvector components for each control patient. (d) Aligned distribution of eigenvector components for each subrogated fragmented patient. The red line shows the value of transformation vector used in the alignment.
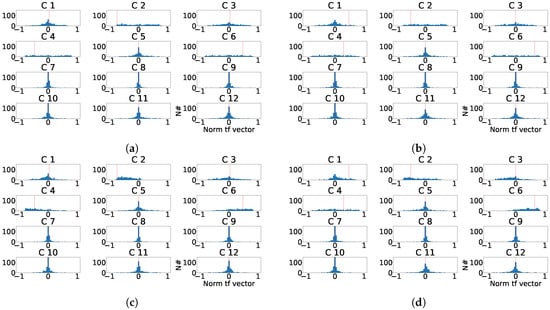
Figure 22.
Distribution of the normalized ICA transformation matrix for the last principal component of the twelve-lead model. (a) Distribution of the transformation matrix components for each control patient. (b) Distribution of the transformation matrix components for each subrogated fragmented patient. (c) Aligned distribution of transformation matrix components for each control patient. (d) Aligned distribution of transformation matrix components for each subrogated fragmented patient. The red line shows the value of transformation vector used in the alignment.
5. Discussion and Conclusions
The main objective of the work has been to characterize the fragmentation within the ECG, and more specifically inside the QRS complex. To this end, preprocessing has been carried out to eliminate noise and non-intrinsic components. Signal adjustment was performed applying the described statistical signal filtering, which consolidates a suitable shaping of the signal for further processing using the described beat templates. For convenience and to analyze fragmentation behavior with multivariate analysis, a subrogated model including fragmented components, has been developed based on said beats templates from healthy patients. The results of the different experiments, using PCA and ICA, have originated to the conclusions detailed below.
First, the exclusive use of the independent components of the ECG, both in PCA and in ICA, substantially improves the behavior in the comparative analysis of the subrogated signals versus the signals not including fragmentation. In particular, in the case of PCA using only the 8 independent components, it was shown a dispersion reduction to the half (0.14 to 0.07), compared to case when all ECG components were incorporated in the processing.
Second, although it would be desirable the fragmentation consolidation in the principal and cleaner lower order components after PCA or ICA transformations, our results did not show it. Alternatively, results showed that the injected fragmentation materializes with a greater proportion in the detail-leads (larger order). In particular, its average quadratic contribution, estimated as the RMSE of the difference of both signals before and after the transformation, for the case of PCA, showed quantitative improvement in more than 99% of the cases using only the three last components of the transformed signals, versus the best results in the original signals.
Third, since this type of affections visually debut in certain regions, and being consistent with the clinical criteria, we assumed that the analysis using only the corresponding leads where the fragmentation is found, would eventually facilitate the automated detection. However, the results obtained contradict this assumption. From this perspective, it could be argued that, although conceptually it makes sense, the existence of a greater number of components, together with the redundancy of the information included the mathematically dependent leads, contributes positively to the fragmentation isolation in the detail components.
Finally, note that the obtained results showed better performance of the multivariate analysis using PCA versus ICA. In this setting, it could be argued that the requirement of independence of the components challenges the model, forcing not necessary and additional restrictions to the multivariate transformation, and limiting the consolidation capacity of the fragmented elements to be isolated in the detail components.
Additionally, it should be mentioned that a very extensive analysis has been developed in this work as far as the fragmentation is concerned. We evaluated most of the mathematically possible alternatives for representing the fragmentation wave. In particular, a wide range of amplitudes, duration’s, frequencies, and affected leads were evaluated. This extremely complex variety of possibilities really challenged the model beyond clinically real expected fragmentation events. In other words, this experimental analysis could be considered to be the worst-case scenario. Therefore, it could be suggested that, in real cases, we could expect much better results using the presented model, as the existing restrictions of different pathologies will set further restrictions to the possible events, opening the door to more accurate detection in clinical practice. For that reason, in the companion paper [7] we characterize certain specific pathologies using this technique, and we evaluate the detection capabilities of the suggested strategy for fragmentation-based ECG modification. As it can be checked, the companion paper deeply evaluates a relevant number of machine learning techniques in order to statistically set the accuracy of the described methods, leveraging on both, machine learning and multivariate analysis.
Author Contributions
Conceptualization, F.-J.G.-B., A.G.-A. and J.L.R.-Á.; Data curation, M.-E.S.-A., J.-R.G.-B. and J.M.-S.; Formal analysis, F.-J.G.-B., A.G.-A. and J.L.R.-Á.; Investigation, F.-M.M.-M.; Software, F.-M.M.-M.; Supervision, F.-J.G.-B., A.G.-A. and J.L.R.-Á.; Writing—original draft, F.-M.M.-M., F.-J.G.-B., M.-E.S.-A., J.-R.G.-B., J.M.-S., A.G.-A. and J.L.R.-Á.; Writing—review & editing, F.-M.M.-M., F.-J.G.-B., M.-E.S.-A., J.-R.G.-B., J.M.-S., A.G.-A. and J.L.R.-Á.
Funding
This work was supported by Research Grants FINALE (TEC2016-75161-C2-1-R, and TEC2016-75161-C2-2-R) by Ministerio de Economía, Industria y Competitividad—Agencia Estatal de Investigación and cofunded by Fondos FEDER and KERMES (TEC2016-81900-REDT) from Spanish Government.
Conflicts of Interest
The authors declare no conflicts of interest.
References
- Pietrasik, G.; Zareba, W. QRS fragmentation: Diagnostic and prognostic significance. Cardiol. J. 2012, 19, 114–121. [Google Scholar] [CrossRef] [PubMed]
- Brenyo, A.; Pietrasik, G.; Barsheshet, A.; Huang, D.T.; Polonsky, B.; McNitt, S.; Moss, A.J.; Zareba, W. QRS fragmentation and the risk of sudden cardiac death in MADIT II. J. Cardiovasc. Electrophysiol. 2012, 23, 1343–1348. [Google Scholar] [CrossRef] [PubMed]
- Take, Y.; Morita, H. Fragmented QRS: What Is The Meaning? Indian Pacing Electrophysiol. J. 2012, 12, 213–225. [Google Scholar] [CrossRef]
- Konno, T.; Hayashi, K.; Fujino, N.; Oka, R.; Nomura, A.; Nagata, Y.; Hodatsu, A.; Sakata, K.; Furusho, H.; Takamura, M.; et al. Electrocardiographic QRS Fragmentation as a Marker for Myocardial Fibrosis in Hypertrophic Cardiomyopathy. J. Cardiovasc. Electrophysiol. 2015, 26, 1081–1087. [Google Scholar] [CrossRef] [PubMed]
- Goovaerts, G.; Vandenberk, B.; Varon, C.; Willems, R.; Van Huffel, S. Phase:Rectified Signal Averaging for Automatic Detection of QRS Fragmentation. Comput. Cardiol. 2017, 43, 2–5. [Google Scholar]
- Melgarejo-Meseguer, F.M.; Salar-Alcaraz, M.; Molins-Bordallo, Z.; Gimeno-Blanes, F.J.; Everss Villalba, E.; Flores-Yepes, J.A.; Rojo-Álvarez, J.L.; García-Alberola, A. QRS Fragmentation Index as a New Discriminator for Early Diagnosis of Heart Diseases. Comput. Cardiol. 2018, 44. [Google Scholar] [CrossRef]
- Melgarejo-Meseguer, F.M.; Gimeno-Blanes, F.J.; Salar-Alcaraz, M.E.; Gimeno-Blanes, J.R.; Martínez-Sánchez, J.; García-Alberola, A.; Rojo-Álvarez, J. Electrocardiographic Fragmented Activity (II): A Machine Learning Approach to Detection Electrocardiogram. Appl. Sci. 2019, in press. [Google Scholar]
- Milanesi, M.; Martini, N.; Vanello, N.; Positano, V.; Santarelli, M.F.; Landini, L. Independent component analysis applied to the removal of motion artifacts from electrocardiographic signals. Med. Biol. Eng. Comput. 2008, 46, 251–261. [Google Scholar] [CrossRef] [PubMed]
- Gupta, C.N.; Palaniappan, R. Denoising cyclostationary framework for enhanced electrocardiogram analysis. Comput. Cardiol. 2007, 34, 93–96. [Google Scholar]
- Langley, P.; Bourke, J.; Murray, A. Frequency analysis of atrial fibrillation. Comput. Cardiol. 2002, 27, 65–68. [Google Scholar]
- Prasad, H.; Martis, R.J.; Acharya, U.R.; Min, L.C.; Suri, J.S. Application of higher order spectra for accurate delineation of atrial arrhythmia. In Proceedings of the Annual International Conference of the IEEE Engineering in Medicine and Biology Society, Osaka, Japan, 3–7 July 2013; pp. 57–60. [Google Scholar]
- Da Poian, G.; Bernardini, R.; Rinaldo, R. Separation and Analysis of Fetal-ECG Signals From Compressed Sensed Abdominal ECG Recordings. IEEE Trans. Biomed. Eng. 2016, 63, 1269–1279. [Google Scholar] [CrossRef] [PubMed]
- Varanini, M.; Tartarisco, G.; Billeci, L.; Macerata, A.; Pioggia, G.; Balocchi, R. An efficient unsupervised fetal QRS complex detection from abdominal maternal ECG. Physiol. Meas. 2014, 35, 1607–1619. [Google Scholar] [CrossRef] [PubMed]
- Tiinanen, S.; Noponen, K.; Tulppo, M.; Kiviniemi, A.; Seppänen, T. ECG-derived respiration methods: Adapted ICA and PCA. Med. Eng. Phys. 2015, 37, 512–517. [Google Scholar] [CrossRef] [PubMed]
- Langley, P.; Bowers, E.J.; Murray, A. Principal component analysis as a tool for analyzing beat-to-beat changes in ECG features: Application to ECG-derived respiration. IEEE Trans. Biomed. Eng. 2010, 57, 821–829. [Google Scholar] [CrossRef] [PubMed]
- Hejazi, M.; Al-Haddad, S.A.; Singh, Y.P.; Hashim, S.J.; Abdul Aziz, A.F. ECG biometric authentication based on non-fiducial approach using kernel methods. Digit. Signal Process. 2016, 52, 72–86. [Google Scholar] [CrossRef]
- Boumbarov, O.; Velchev, Y.; Sokolov, S. ECG personal identification in subspaces using radial basis neural networks. In Proceedings of the 5th IEEE International Workshop on Intelligent Data Acquisition and Advanced Computing Systems: Technology and Applications, Rende, Italy, 21–23 September 2009; pp. 446–451. [Google Scholar]
- Wang, D.; Si, Y.; Yang, W.; Zhang, G.; Liu, T. A Novel Heart Rate Robust Method for Short-Term Electrocardiogram Biometric Identification. Appl. Sci. 2019, 9, 201. [Google Scholar] [CrossRef]
- Thanapatay, D.; Suwansaroj, C.; Thanawattano, C. ECG beat classification method for ECG printout with Principle Components Analysis and Support Vector Machines. In Proceedings of the International Conference on Electronics and Information Engineering, Kyoto, Japan, 1–3 August 2010; Volume 1. [Google Scholar]
- Afsar, F.A.; Arif, M. Robust electrocardiogram beat classification using discrete wavelet transform. In Proceedings of the 2008 2nd International Conference on Bioinformatics and Biomedical Engineering, Shanghai, China, 16–18 May 2008; Volume 29, pp. 1867–1870. [Google Scholar]
- Khawaja, A.; Dössel, O. A PCA-based technique for QRS complex estimation. Comput. Cardiol. 2005, 32, 747–750. [Google Scholar]
- Fira, C.M.; Goras, L. An ECG signals compression method and its validation using NNs. IEEE Trans. Biomed. Eng. 2008, 55, 1319–1326. [Google Scholar] [CrossRef]
- Castells, F.; Laguna, P.; Sörnmo, L.; Bollmann, A.; Roig, J.M. Principal component analysis in ECG signal processing. EURASIP J. Adv. Signal Process. 2007, 2007, 074580. [Google Scholar] [CrossRef]
- Everss-Villalba, E.; Melgarejo-Meseguer, F.M.; Blanco-Velasco, M.; Gimeno-Blane, F.J.; Sala-Pla, S.; Rojo-Álvarez, J.L.; García-Alberola, A. Noise maps for quantitative and clinical severity towards long-term ECG monitoring. Sensors 2017, 17, 2448. [Google Scholar] [CrossRef]
- Melgarejo-Meseguer, F.M.; Everss-Villalba, E.; Gimeno-Blanes, F.J.; Blanco-Velasco, M.; Molins-Bordallo, Z.; Flores-Yepes, J.A.; Rojo-Álvarez, J.L.; García-Alberola, A. On the beat detection performance in long-term ECG monitoring scenarios. Sensors 2018, 18, 1387. [Google Scholar] [CrossRef] [PubMed]
- Casanez-Ventura, A.; Gimeno-Blanes, F.J.; Rojo-Álvarez, J.L.; Flores-Yepes, J.A.; Gimeno-Blanes, J.R.; Lopez-Ayala, J.M.; García-Alberola, A. QRS delineation algorithms comparison and model fine tuning for automatic clinical classification. Comput. Cardiol. 2013, 40, 1163–1166. [Google Scholar]
- Jolliffe, I.T. Principal Component Analysis; Springer: New York, NY, USA, 2002. [Google Scholar]
- Hyvärinen, A.; Oja, E. Independent component analysis: Algorithms and applications. Neural Netw. 2000, 13, 411–430. [Google Scholar] [CrossRef]
© 2019 by the authors. Licensee MDPI, Basel, Switzerland. This article is an open access article distributed under the terms and conditions of the Creative Commons Attribution (CC BY) license (http://creativecommons.org/licenses/by/4.0/).