Recent Advances in Spectroscopy Technology for Trace Analysis of Persistent Organic Pollutants

Abstract
1. Introduction
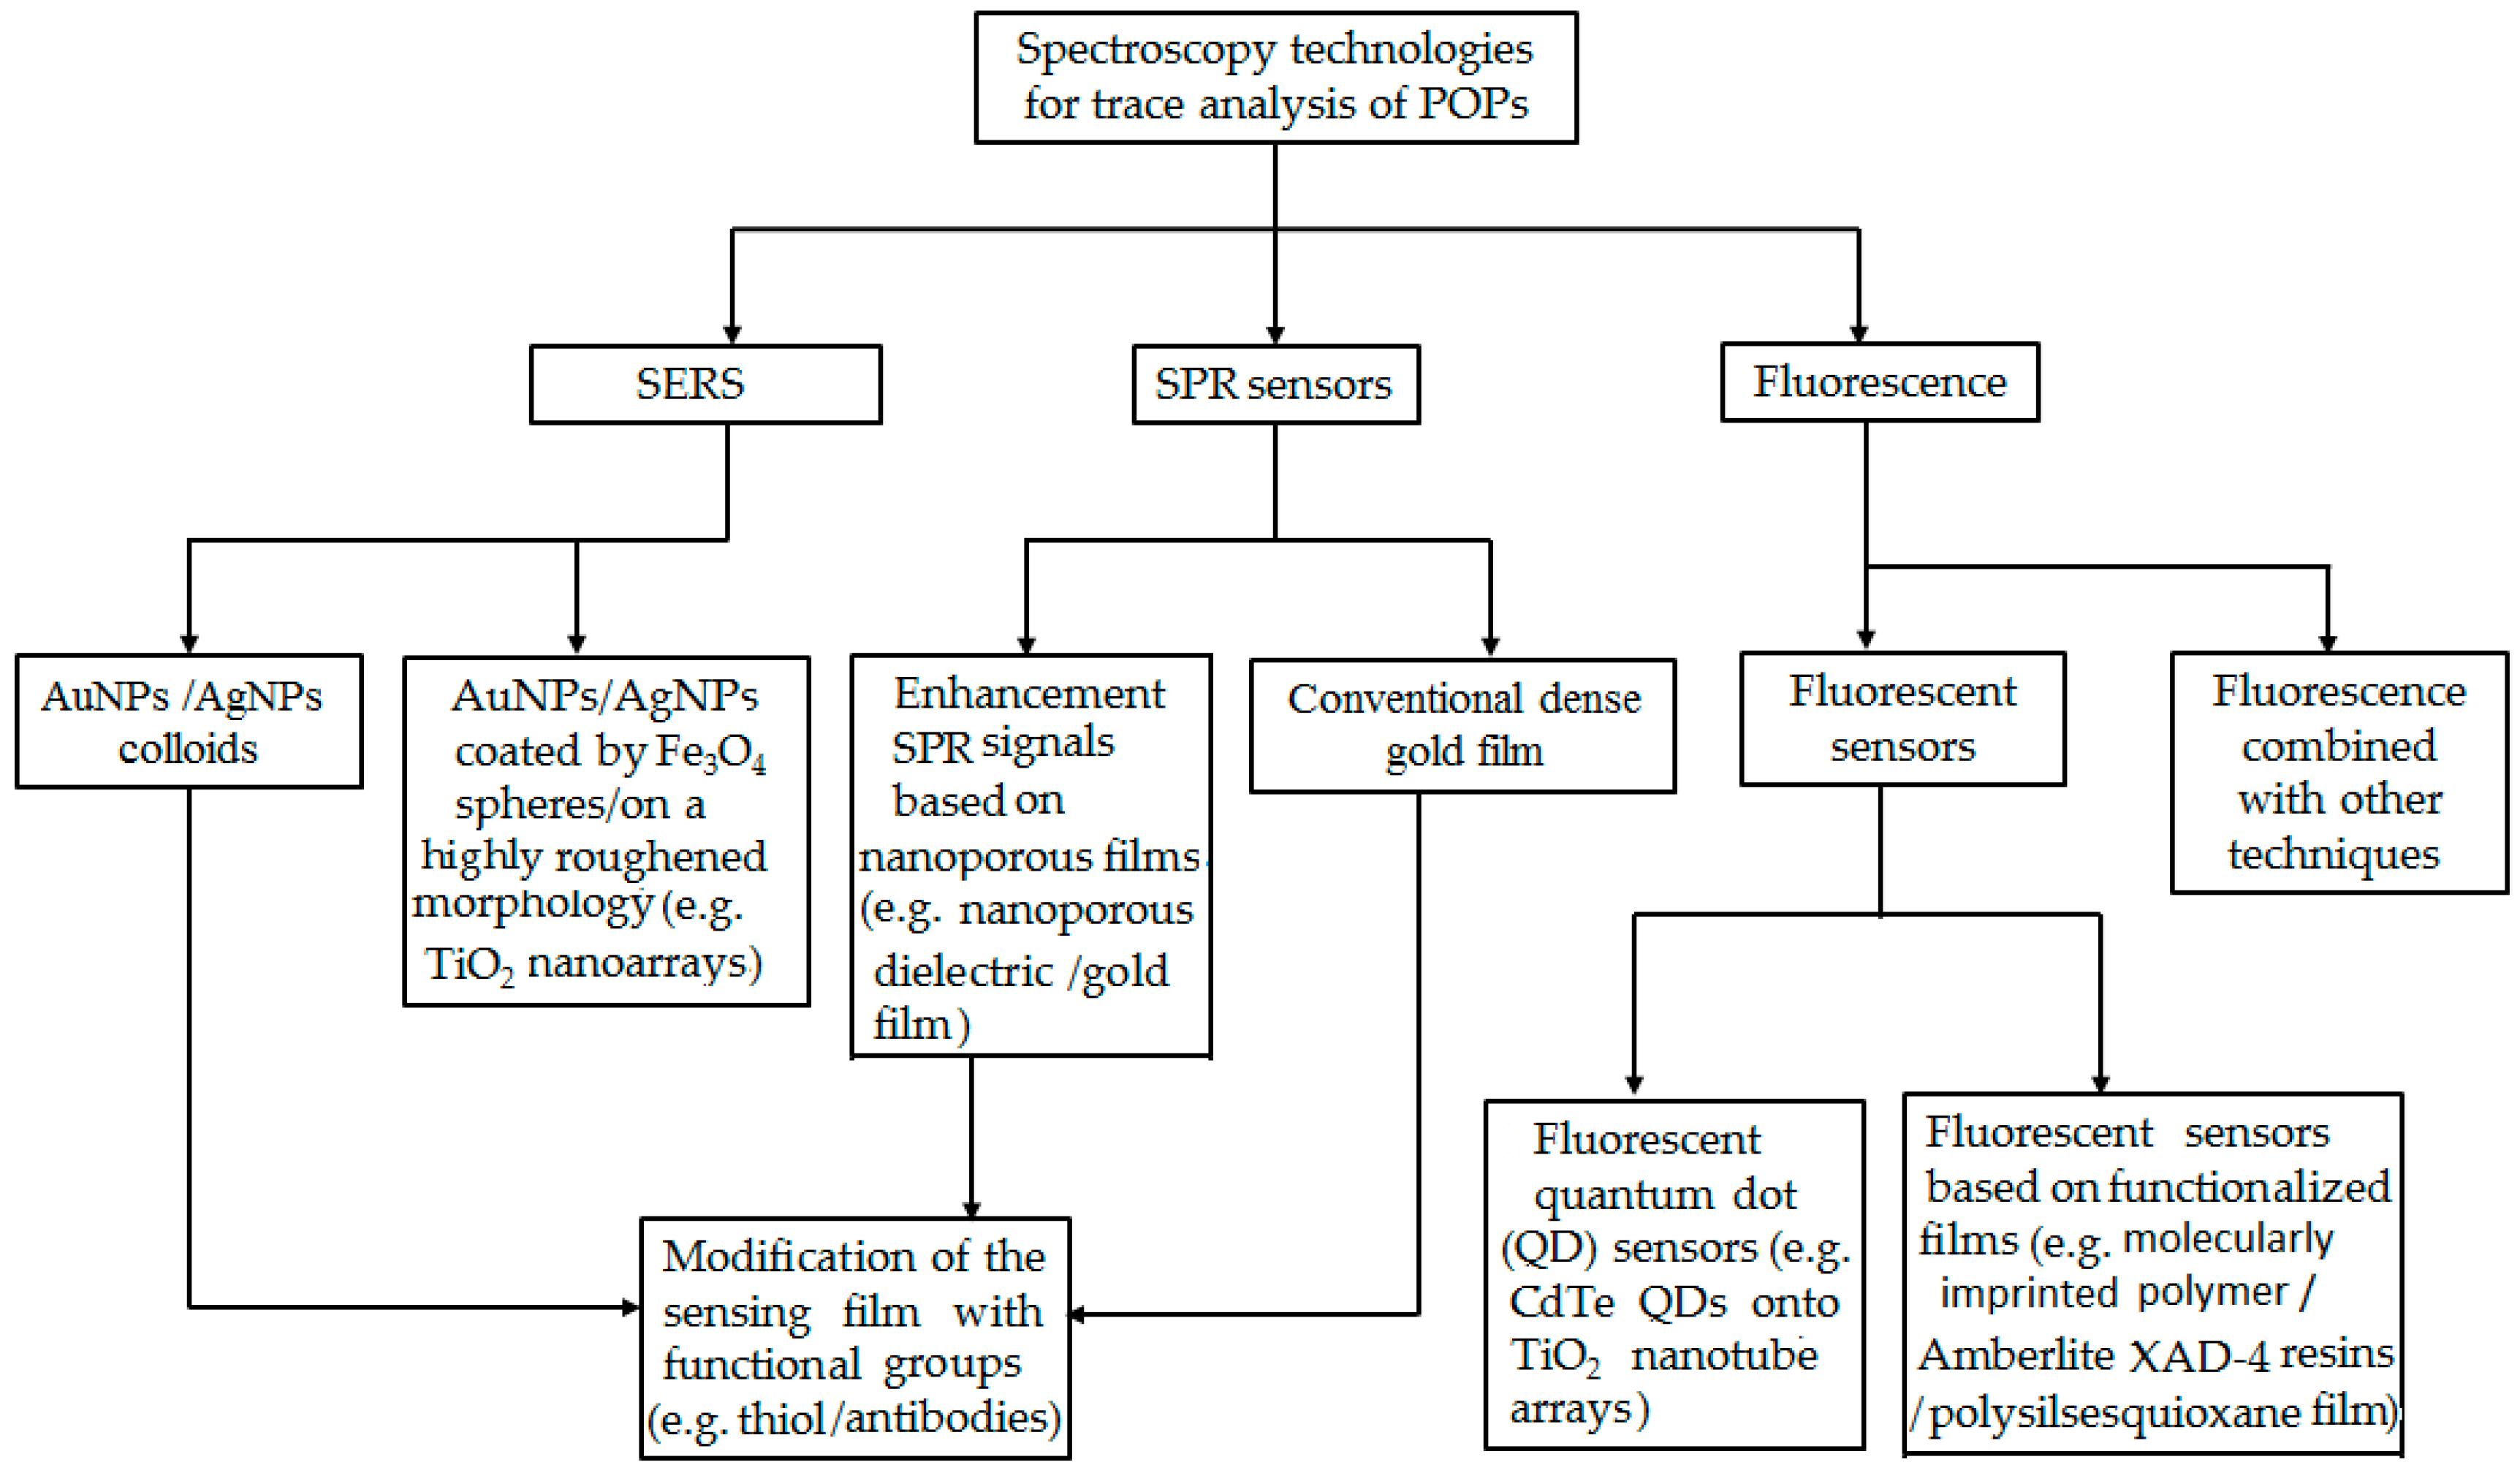
2. Applications of Spectroscopy Technology in Detection of POPs
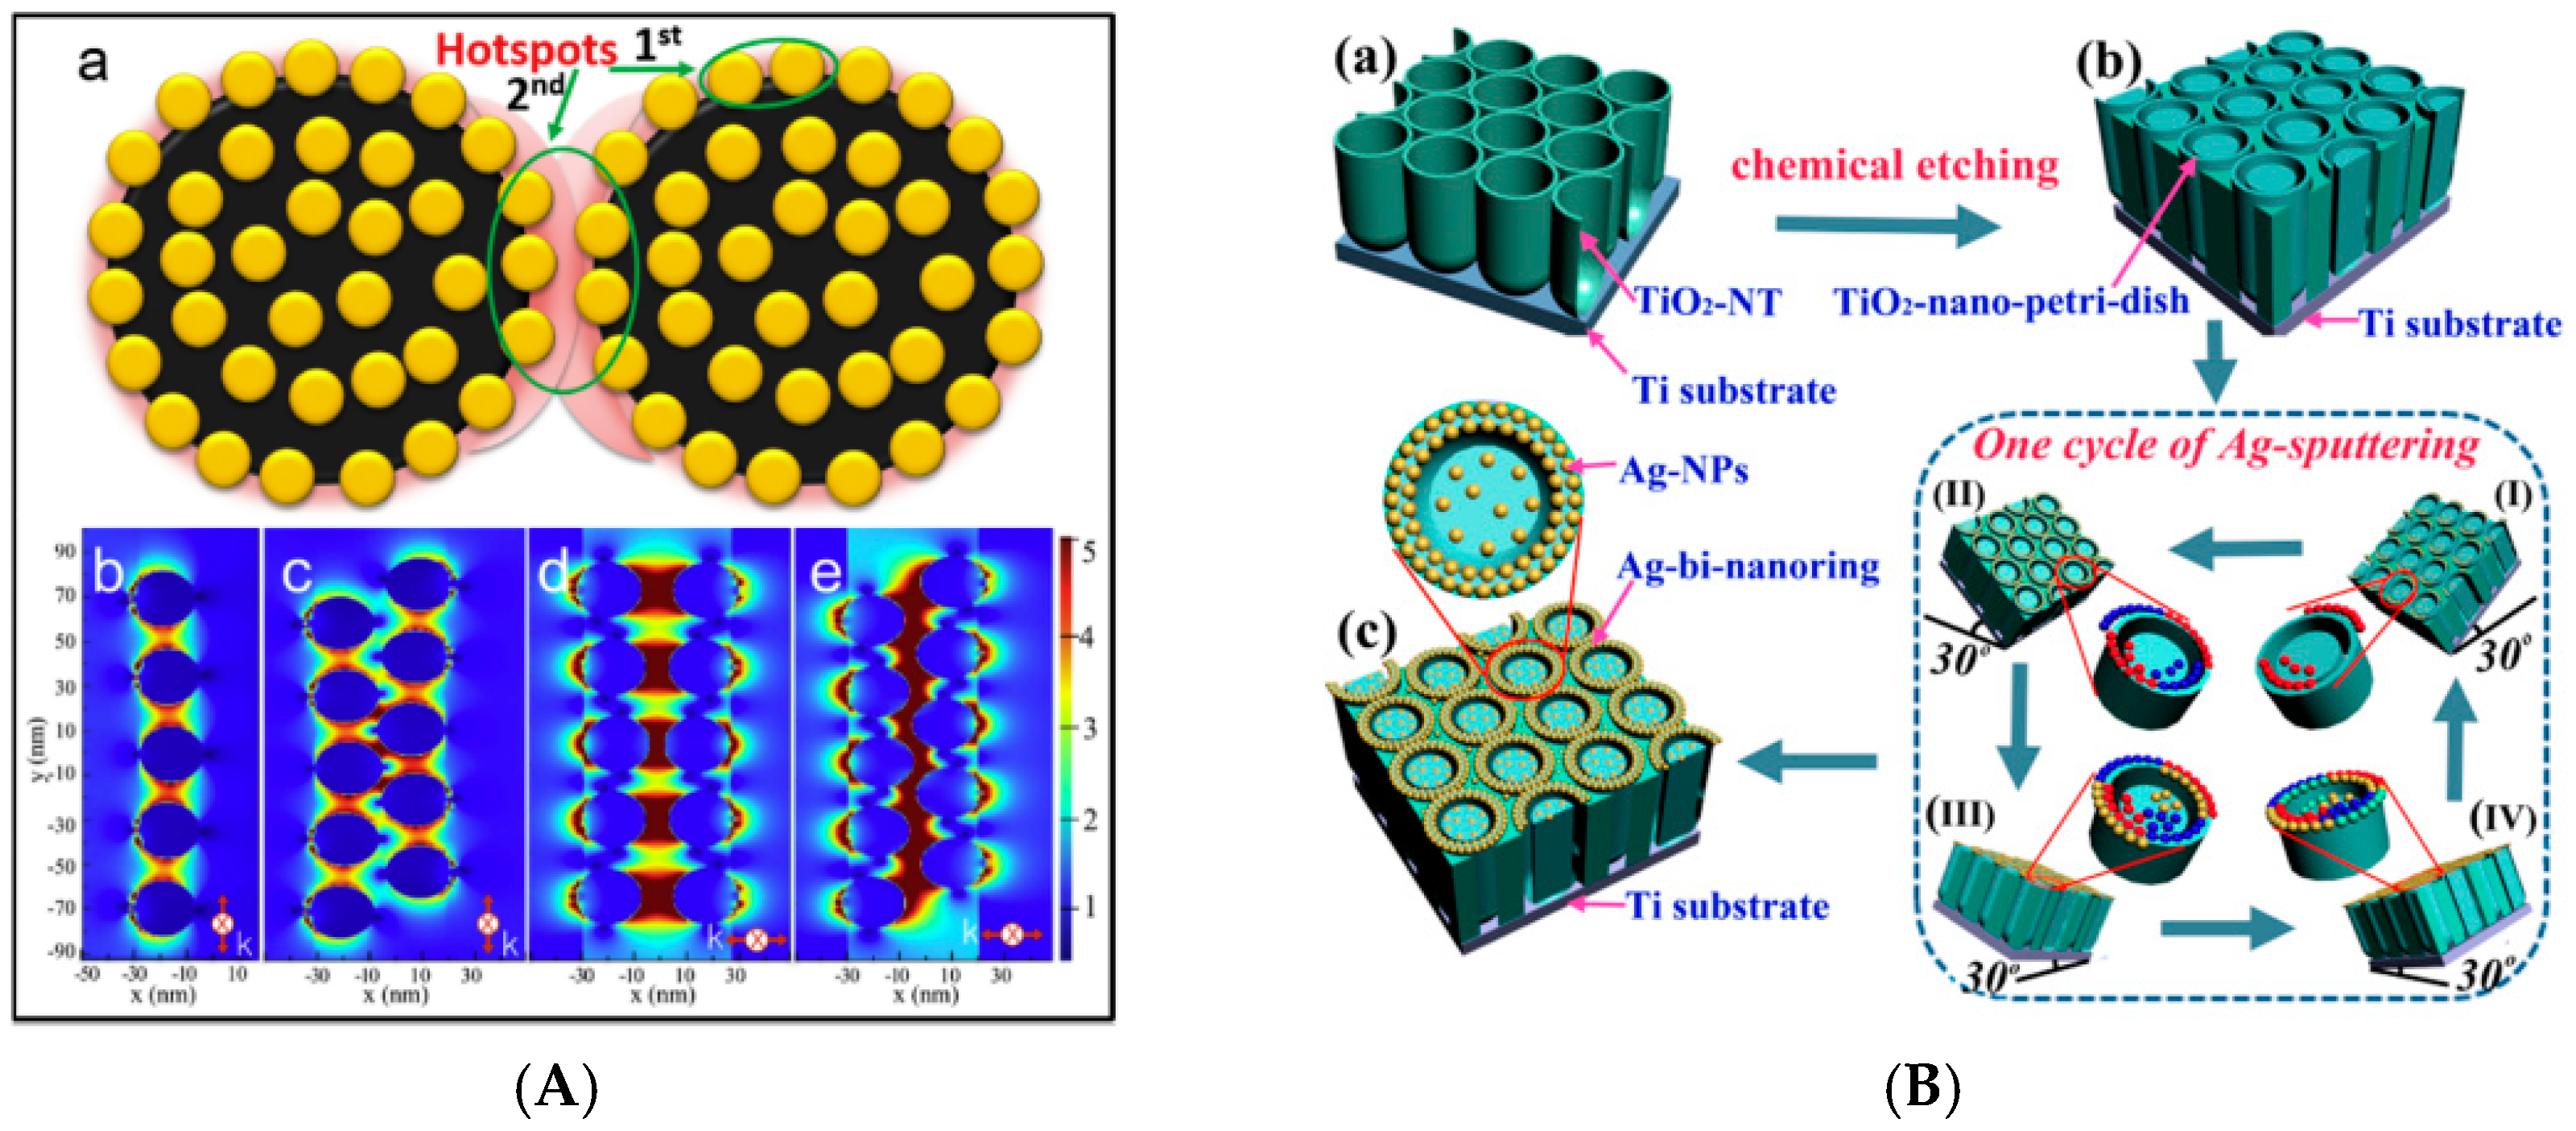
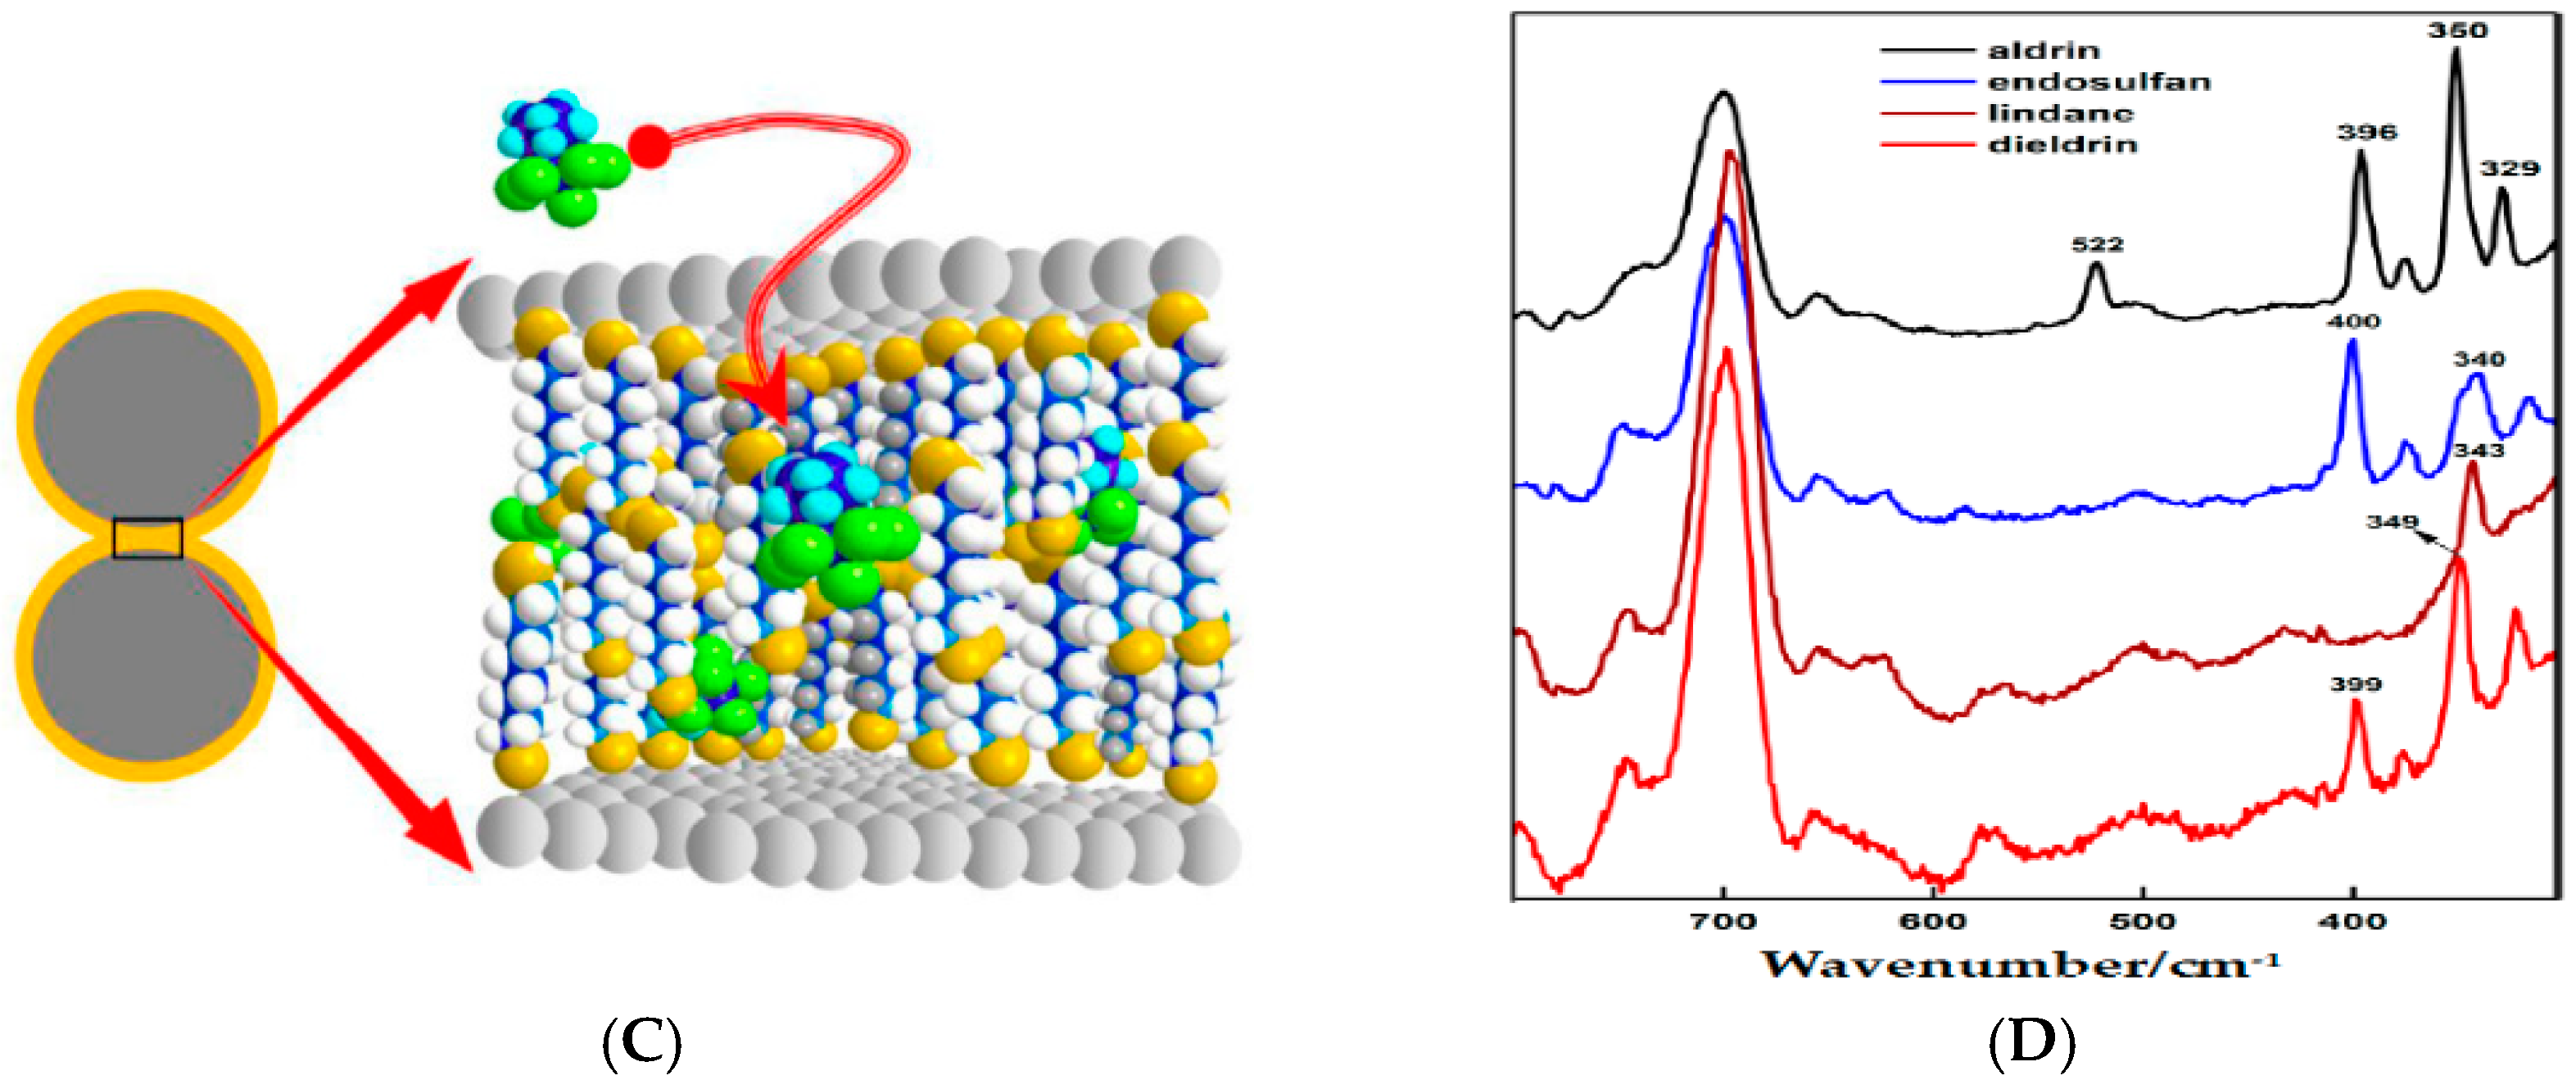
2.1. SERS
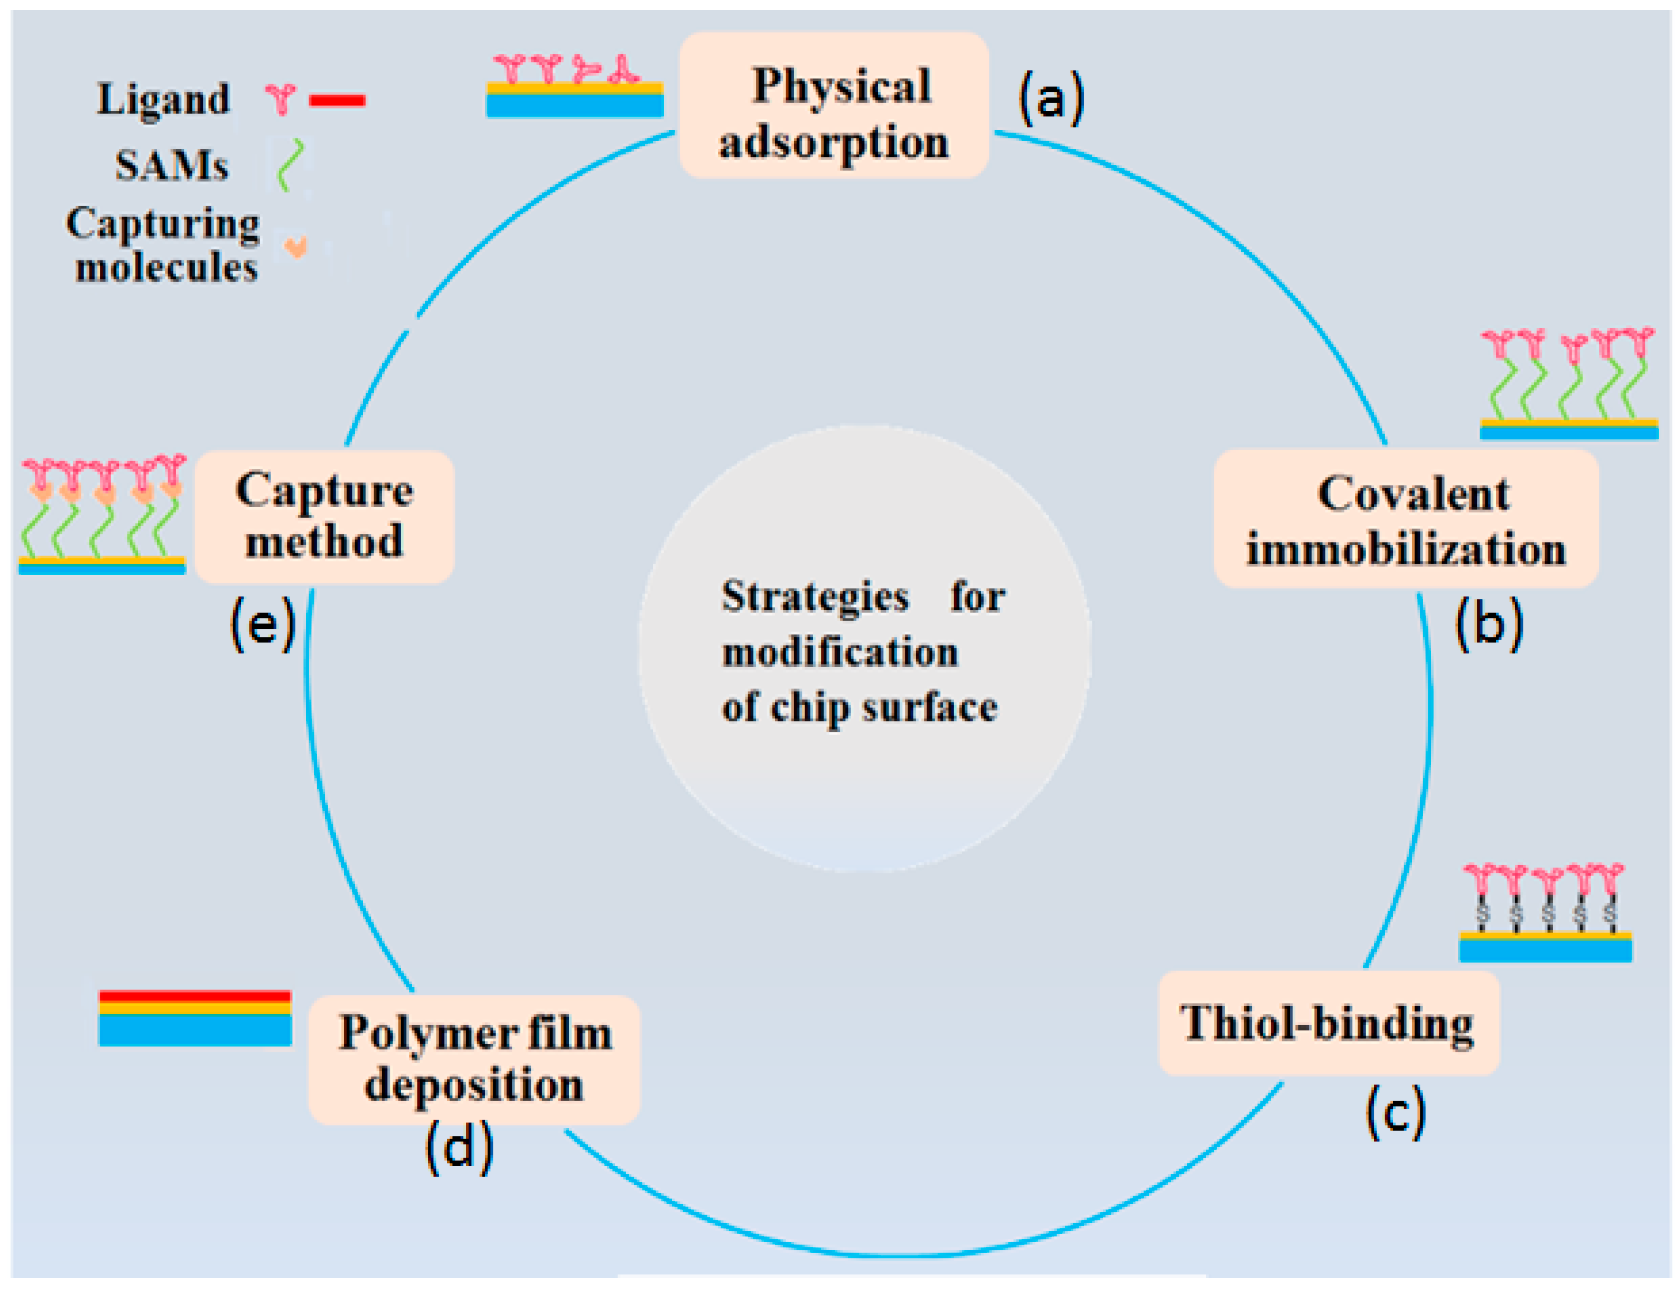
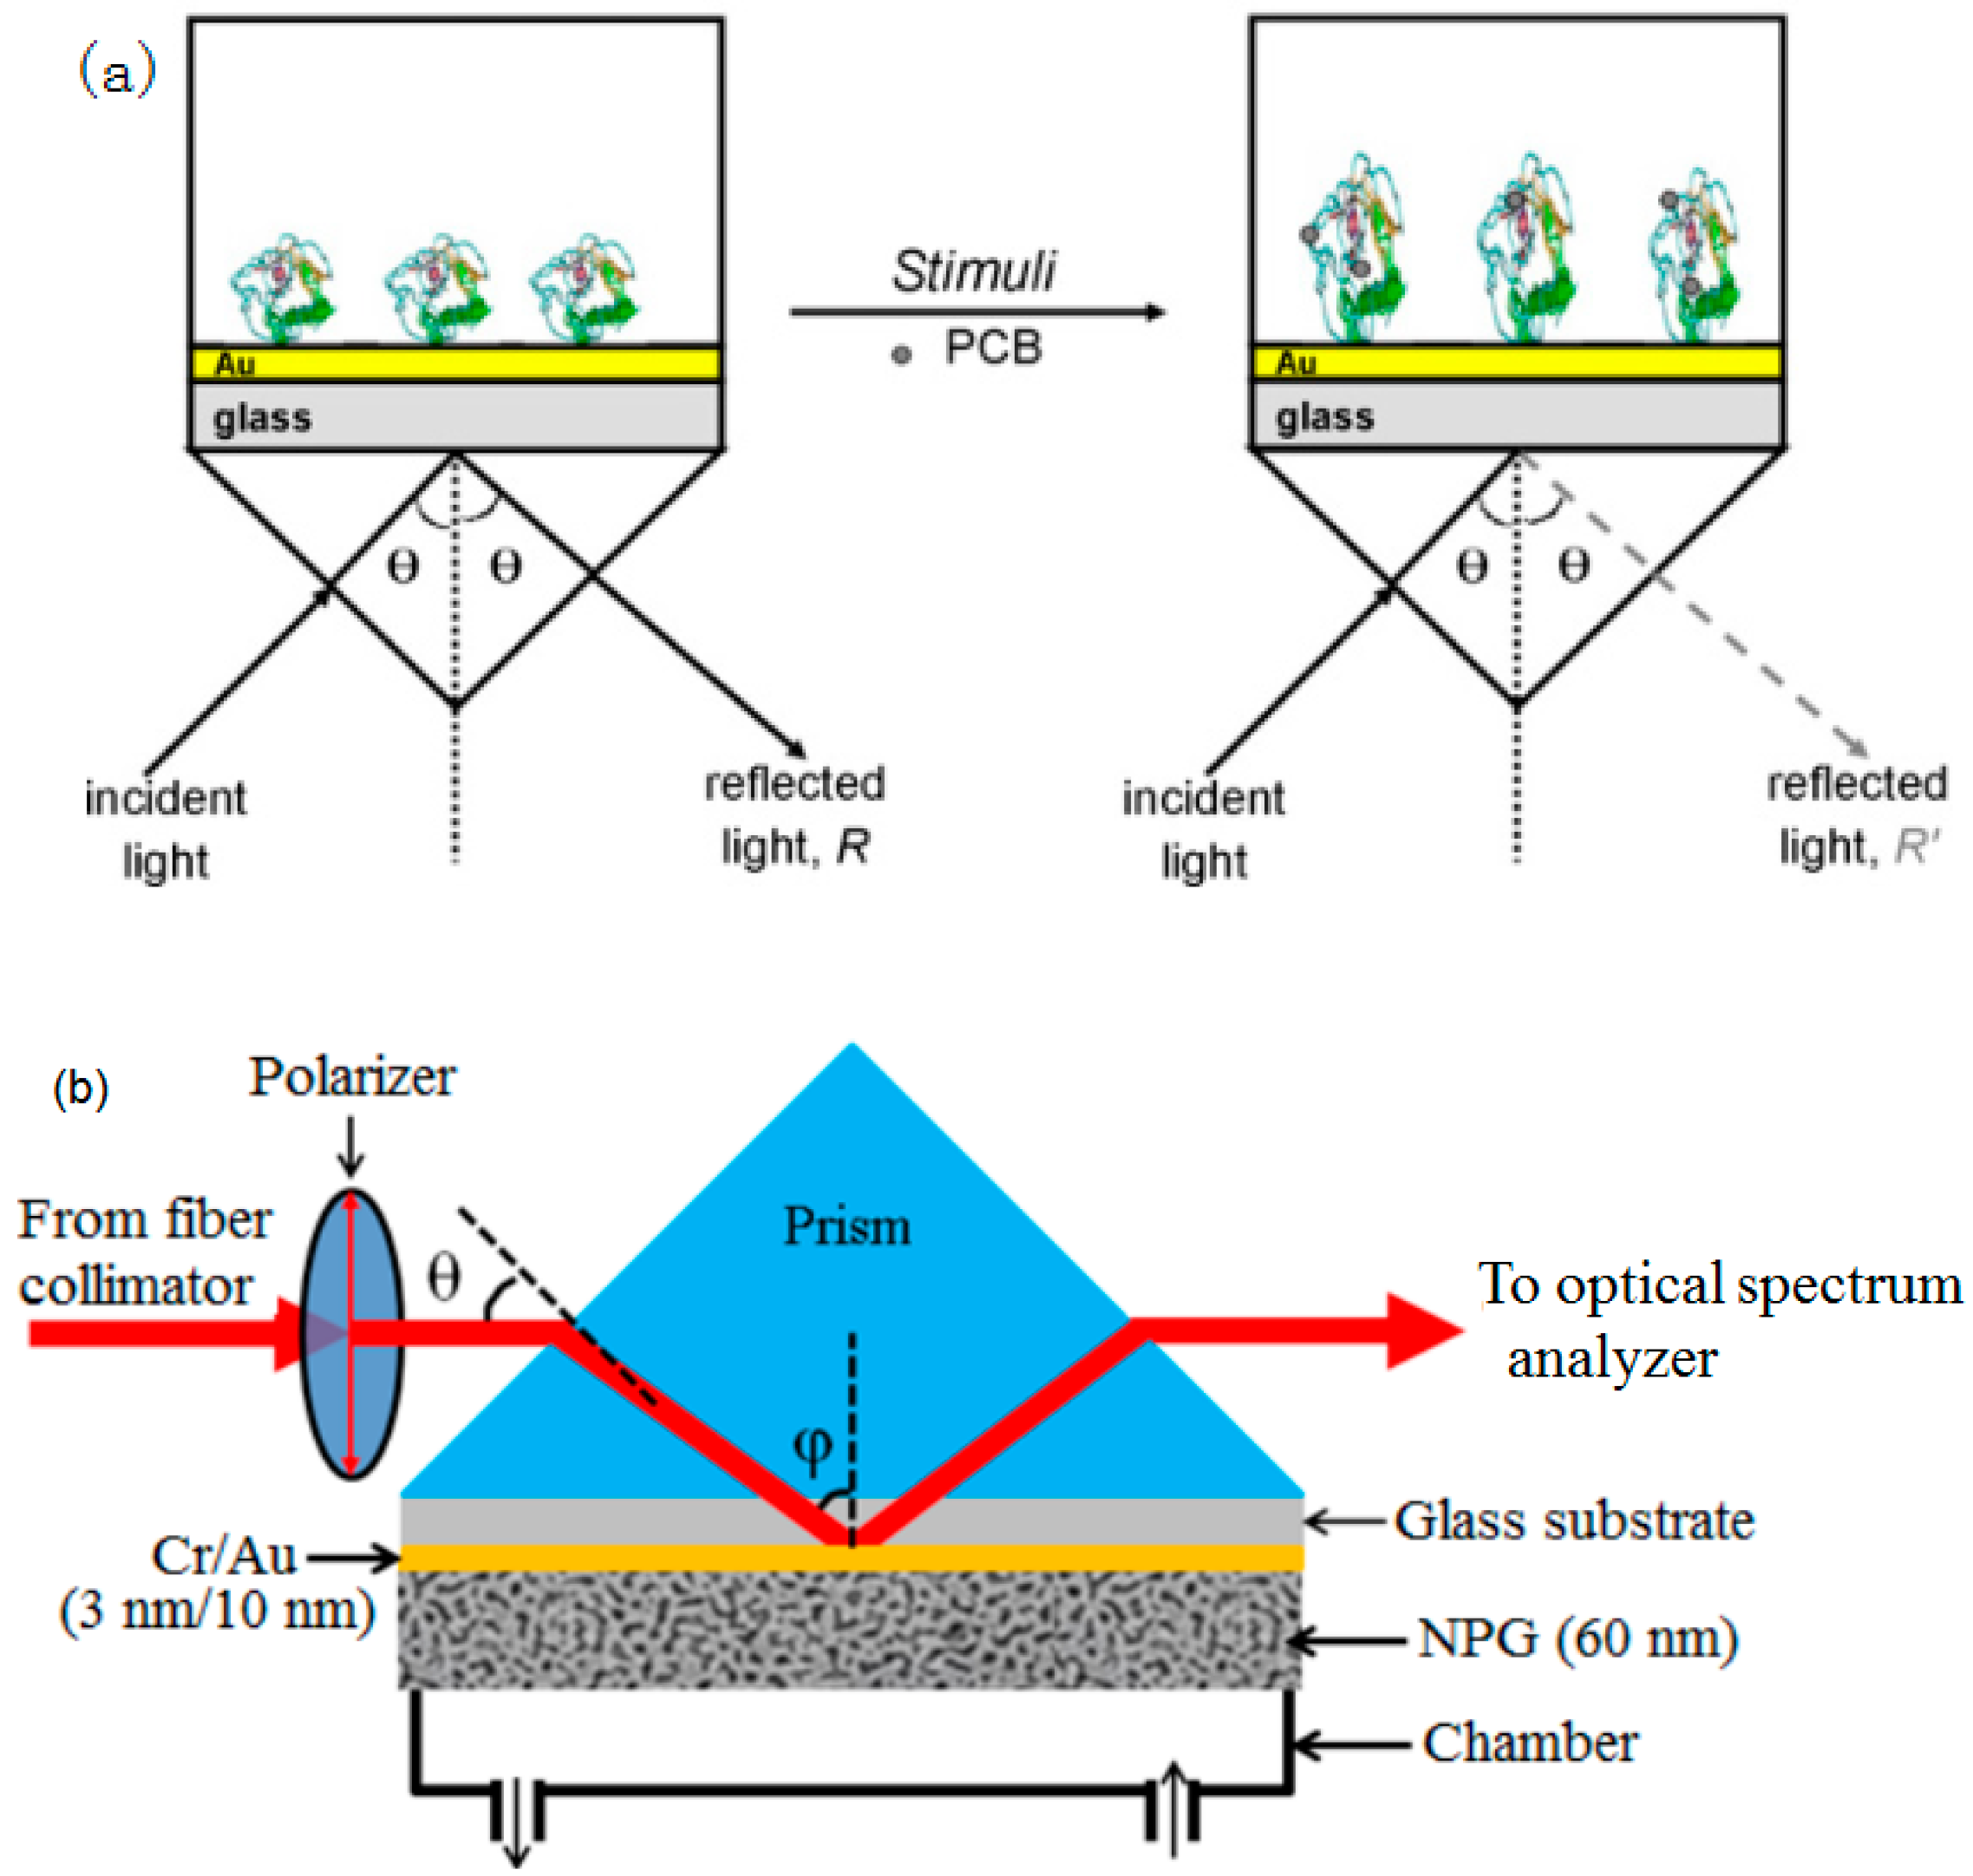
2.2. SPR Sensors
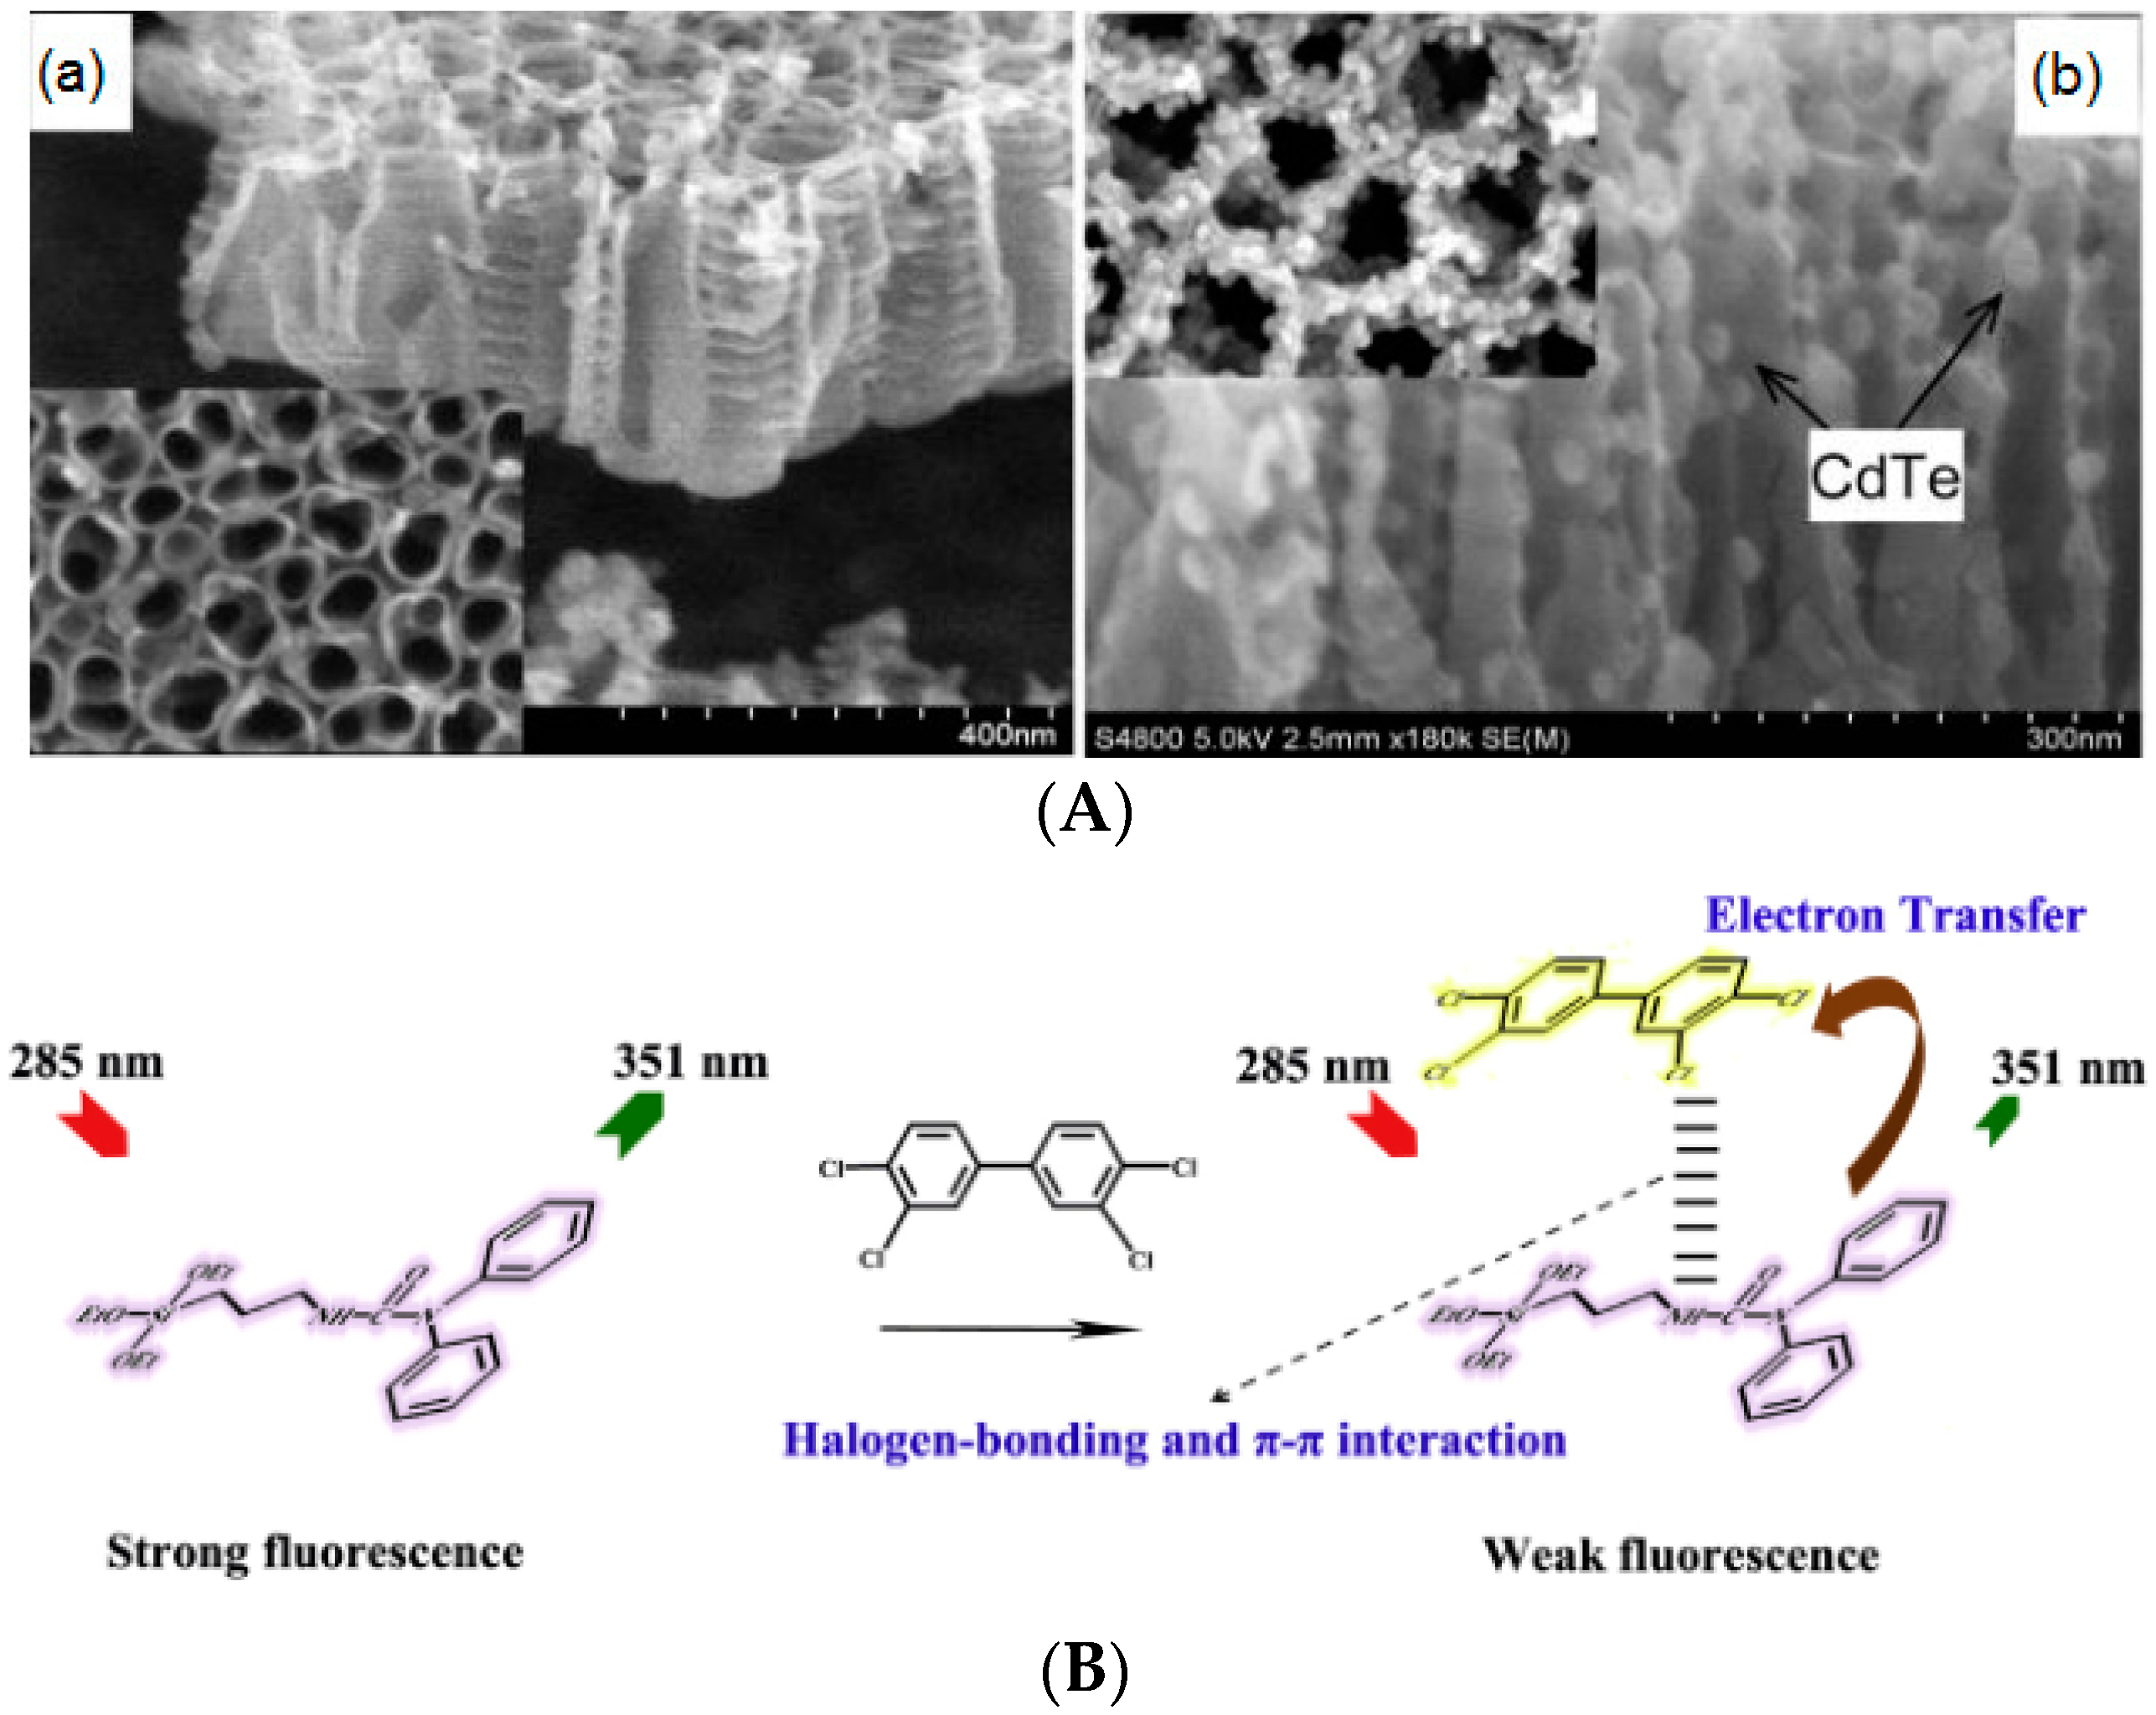
2.3. Fluorescence
2.4. Some Considerations in Spectroscopy Technology Detection of POPs
3. Conclusions and Prospects
Author Contributions
Funding
Acknowledgments
Conflicts of Interest
References
- Kumar, J.; Lind, P.M.; Salihovic, S.; Bavel, B.; Ekdahl, K.N.; Nilsson, B.; Lind, L.; Ingelsson, E. Influence of persistent organic pollutants on the complement system in a population-based human sample. Environ. Int. 2014, 71, 94–100. [Google Scholar] [CrossRef] [PubMed]
- Pariatamby, A.; Kee, Y.L. Persistent Organic Pollutants Management and Remediation. Procedia Environ. Sci. 2016, 31, 842–848. [Google Scholar] [CrossRef]
- Augusto, S.; Máguas, C.; Branquinho, C. Guidelines for biomonitoring persistent organic pollutants (POPs), using lichens and aquatic mosses—A review. Environ. Pollut. 2013, 180, 330–338. [Google Scholar] [CrossRef] [PubMed]
- Bajaj, S.; Singh, D.K. Biodegradation of persistent organic pollutants in soil, water and pristine sites by cold-adapted microorganisms: Mini review. Int. Biodeterior. Biodegrad. 2015, 100, 98–105. [Google Scholar] [CrossRef]
- Wang, X.; Hao, W.; Zhang, H.; Pan, Y.; Kang, Y.; Zhang, X.; Zou, M.; Tong, P.; Du, Y. Analysis of polycyclic aromatic hydrocarbons in water with gold nanoparticles decorated hydrophobic porous polymer as surface-enhanced Raman spectroscopy substrate. Spectrochim. Acta Part A Mol. Biomol. Spectrosc. 2015, 139, 214–221. [Google Scholar] [CrossRef] [PubMed]
- Starek-Świechowicz, B.; Budziszewska, B.; Starek, A. Hexachlorobenzene as a persistent organic pollutant: Toxicity and molecular mechanism of action. Pharmacol. Rep. 2017, 69, 1232. [Google Scholar]
- Johnson, P.I.; Stapleton, H.M.; Sjodin, A.; Mekeer, J.D. Relationships between Polybrominated Diphenyl Ether Concentrations in House Dust and Serum. Environ. Sci. Technol. 2010, 44, 5627–5632. [Google Scholar] [CrossRef]
- Kato, K.; Shoda, S.; Takahashi, M.; Doi, N.; Yoshimura, Y.; Nakazawa, H. Determination of three phthalate metabolites in human urine using on-line solid-phase extraction-liquid chromatography-tandem mass spectrometry. J. Chromatogr. B 2003, 788, 407–411. [Google Scholar] [CrossRef]
- Olatunji, O.S.; Fatoki, O.S.; Opeolu, B.O.; Ximba, B.J. Determination of polycyclic aromatic hydrocarbons [PAHs] in processed meat products using gas chromatography-Flame ionization detector. Food Chem. 2014, 156, 296–300. [Google Scholar] [CrossRef]
- Ratola, N.; Lacorte, S.; Barceló, D.; Alves, A. Microwave-assisted extraction and ultrasonic extraction to determine polycyclic aromatic hydrocarbons in needles and bark of Pinus pinaster Ait. And Pinus pinea L. by GC-MS. Talanta 2009, 77, 1120–1128. [Google Scholar] [CrossRef]
- Du, J.; Jing, C. Preparation of Thiol Modified Fe3O4@Ag Magnetic SERS Probe for PAHs Detection and Identification. J. Phys. Chem. C 2011, 115, 17829–17835. [Google Scholar] [CrossRef]
- López-Tocón, N.I.; Otero, J.C.; Arenas, J.F.; Garcia-Ramos, J.V.; Sanchez-Cortes, S. Multicomponent Direct Detection of Polycyclic Aromatic Hydrocarbons by Surface-Enhanced Raman Spectroscopy Using Silver Nanoparticles Functionalized with the Viologen Host Lucigenin. Anal. Chem. 2011, 83, 2518–2525. [Google Scholar] [CrossRef]
- Karsunke, X.Y.; Pschenitza, M.; Rieger, M.; Weber, E.; Niessner, R.; Knopp, D. Screening and characterization of new monoclonal anti-benzo[a]pyrene antibodies using automated flow-through microarray technology. J. Immunol. Methods 2011, 371, 81–90. [Google Scholar] [CrossRef]
- Hua, G.; Killham, K.; Singleton, I. Potential application of synchronous fluorescence spectroscopy to determine benzo[a]pyrene in soil extracts. Environ. Pollut. 2006, 139, 272–278. [Google Scholar] [CrossRef] [PubMed]
- Smith, W.E. Practical understanding and use of surface enhanced Raman scattering/surface enhanced resonance Raman scattering in chemical and biological analysis. Chem. Soc. Rev. 2008, 37, 955–964. [Google Scholar] [CrossRef]
- Pieczonka, N.P.W.; Aroca, R.F. ChemInform Abstract: Single Molecule Analysis by Surfaced-Enhanced Raman Scattering. Cheminform 2010, 39, 946. [Google Scholar] [CrossRef]
- Sarfo, D.K.; Izake, E.L.; O’Mullane, A.P.; Ayoko, G.A.A. Molecular recognition and detection of Pb(II) ions in water by aminobenzo-18-crown-6 immobilised onto a nanostructured SERS substrate. Sens. Actuators B 2018, 255, 1945–1952. [Google Scholar] [CrossRef]
- Yang, L.; Chen, Y.; Shen, Y.; Yang, M.; Li, X.; Han, X.; Jiang, X.; Zhao, B. SERS strategy based on the modified Au nanoparticles for highly sensitive detection of bisphenol A residues in milk. Talanta 2018, 179, 37. [Google Scholar] [CrossRef] [PubMed]
- Rifat, A.A.; Mahdiraji, G.A.; Sua, Y.M.; Ahmed, R.; Shee, Y.G.; Adikan, F.R. Highly sensitive multi-core flat fiber surface plasmon resonance refractive index sensor. Optics Express 2016, 24, 2485. [Google Scholar] [CrossRef]
- Giorgini, A.; Avino, S.; Malara, P.; Gagliardi, G.; Casalino, M.; Coppola, G.; Iodice, M.; Adam, P.; Chadt, K.; Homola, J.; et al. Surface plasmon resonance optical cavity enhanced refractive index sensing. Opt. Lett. 2013, 38, 1951–1953. [Google Scholar] [CrossRef] [PubMed]
- Das, D.; Sahoo, G.P.; Mazumdar, P.; Maity, A.; Chattopadhyay, D.; Guillermo, S.M. Morphology directing synthesis of benzo[a]pyrene microstructures and their photo physical properties. J. Mol. Liquids 2015, 206, 47–55. [Google Scholar] [CrossRef]
- Costa, J.C.S.; Sant’Ana, A.C.; Corio, P.; Temperini, M.L. Chemical analysis of polycyclic aromatic hydrocarbons by surface-enhanced Raman spectroscopy. Talanta 2006, 70, 1011–1016. [Google Scholar] [CrossRef] [PubMed]
- Nahorniak, M.L.; Booksh, K.S. Excitation-emission matrix fluorescence spectroscopy in conjunction with multiway analysis for PAH detection in complex matrices. Analyst 2006, 131, 1308–1315. [Google Scholar] [CrossRef] [PubMed]
- Li, D.W.; Zhai, W.L.; Li, Y.T.; Long, Y.T. Recent progress in surface enhanced Raman spectroscopy for the detection of environmental pollutants. Microchim. Acta 2014, 181, 23–43. [Google Scholar] [CrossRef]
- Singh, P. SPR Biosensors: Historical Perspectives and Current Challenges. Sens. Actuators B Chem. 2016, 229, 110–130. [Google Scholar] [CrossRef]
- Ho, A.H.-P.; Kim, D.; Somekh, M.G. Handbook of Photonics for Biomedical Engineering; Springer: Dordrecht, The Netherlands, 2017; pp. 1–19. [Google Scholar]
- Morris May, C. Fluorescence-Based Biosensors; Elsevier/Academic Press: Cambridge, MA, USA, 2013; pp. 193–216. [Google Scholar]
- Lin, W.H.; Lu, Y.H.; Hsu, Y.J. Au nanoplates as robust, recyclable SERS substrates for ultrasensitive chemical sensing. J. Colloid Interface Sci. 2014, 418, 87–94. [Google Scholar] [CrossRef] [PubMed]
- Krupadam, R.J.; Bhagat, B.; Wate, S.R.; Bodhe, G.L.; Sellergren, B.; Anjaneyulu, A. Fluorescence Spectrophotometer Analysis of Polycyclic Aromatic Hydrocarbons in Environmental Samples Based on Solid Phase Extraction Using Molecularly Imprinted Polymer. Environ. Sci. Technol. 2009, 43, 2871–2877. [Google Scholar] [CrossRef] [PubMed]
- Zhang, C.Y.; Lu, Y.; Zhao, B.; Hao, Y.W.; Liu, Y.Q. Facile fabrication of Ag dendrite-integrated anodic aluminum oxide membrane as effective three-dimensional SERS substrate. Appl. Surface Sci. 2016, 377, 167–173. [Google Scholar] [CrossRef]
- Du, J.; Xu, J.; Sun, Z.; Jing, C. Au nanoparticles grafted on Fe3O4 as effective SERS substrates for label-free detection of the 16 EPA priority polycyclic aromatic hydrocarbons. Anal. Chim. Acta 2016, 915, 81–89. [Google Scholar] [CrossRef]
- Yamamoto, Y.; Ishizaki, A.; Kataoka, H. Biomonitoring method for the determination of polycyclic aromatic hydrocarbons in hair by online in-tube solid-phase microextraction coupled with high performance liquid chromatography and fluorescence detection. J. Chromatogr. B 2015, 1000, 187–191. [Google Scholar] [CrossRef]
- Rivera-Figueroa, A.M.; Ramazan, K.A.; Finlayson-Pitts, B.J. Fluorescence, Absorption, and Excitation Spectra of Polycyclic Aromatic Hydrocarbons as a Tool for Quantitative Analysis. J. Chem. Educ. 2004, 81, 242. [Google Scholar] [CrossRef]
- Bao, L.; Sheng, P.; Li, J.; Wu, S.; Cai, Q.; Yao, S. Surface enhanced Raman spectroscopic detection of polycyclic aromatic hydrocarbons (PAHs) using a gold nanoparticles-modified alginate gel network. Analyst 2012, 137, 4010. [Google Scholar] [CrossRef] [PubMed]
- Wang, L.; Wang, X.M.; Gao, R.; Lu, D.F.; Qi, Z.M. Nanoporous Gold Films Prepared by a Combination of Sputtering and Dealloying for Trace Detection of Benzo[a]pyrene Based on Surface Plasmon Resonance Spectroscopy. Sensors 2017, 17, 1255. [Google Scholar] [CrossRef] [PubMed]
- Haruna, K.; Saleh, T.A.; Hossain, M.K.; Al-Saadi, A.A. Hydroxylamine Reduced Silver colloid for Naphthalene and Phenanthrene detection using Surface-Enhanced Raman Spectroscopy. Chem. Eng. J. 2016, 304, 141–148. [Google Scholar] [CrossRef]
- Guerrini, L.; Garcia-Ramos, J.V.; Domingo, C.; Sanchez-Cortes, S. Sensing Polycyclic Aromatic Hydrocarbons with Dithiocarbamate-Functionalized Ag Nanoparticles by Surface-Enhanced Raman Scattering. Anal. Chem. 2009, 81, 953–960. [Google Scholar] [CrossRef] [PubMed]
- Hong, S.; Kang, T.; Oh, S.; Moon, J.; Choi, I.; Choi, K.; Yi, J. Label-free sensitive optical detection of polychlorinated biphenyl (PCB) in an aqueous solution based on surface plasmon resonance measurements. Sens. Actuators B Chem. 2008, 134, 300–306. [Google Scholar] [CrossRef]
- Nguyen, A.L. Detection of polychlorinated biphenyls by photoactivated fluorescence and by sensitized laser photolysis. Anal. Chim. Acta 1996, 319, 221–229. [Google Scholar] [CrossRef]
- Belfatmi, R.; Lamotte, M.; Ait-Lyazidi, S.; Violet, P.F. Detection of PCBs in natural waters by front face fluorometry on solid sorbent on account of their fluorescence quantum yields and interaction with humic substances. Chemosphere 2005, 61, 761–769. [Google Scholar] [CrossRef]
- Hu, X.; Meng, G.; Huang, Q.; Zhu, C.; Chen, B.; Huang, Z.; Li, F.; Wang, Z. Nano-petri-dish Array Assisted Glancing Angle Sputtering for Ag-NP Assembled Bi-nanoring Arrays as Effective SERS Substrates. ACS Appl. Mater. Interfaces 2014, 6, 7991–7995. [Google Scholar] [CrossRef]
- Shanta, P.V.; Cheng, Q. Graphene Oxide Nanoprisms for Sensitive Detection of Environmentally Important Aromatic Compounds with SERS. ACS Sens. 2017, 2, 817–827. [Google Scholar] [CrossRef]
- Bantz, K.C.; Haynes, C.L. Surface-enhanced Raman scattering detection and discrimination of polychlorinated biphenyls. Vib. Spectrosc. 2009, 50, 29–35. [Google Scholar] [CrossRef]
- Lu, Y.; Yao, G.; Sun, K.; Huang, Q. β-Cyclodextrin coated SiO2@Au@Ag core–shell nanoparticles for SERS detection of PCBs. Phys. Chem. Chem. Phys. 2015, 17, 21149–21157. [Google Scholar] [CrossRef] [PubMed]
- Chen, J.; Huang, Y.; Kannan, P.; Lin, Z.; Zhang, J.; Guo, L.; Chen, T. Flexible and Adhesive SERS Active Tape for Rapid Detection of Pesticide Residues in Fruits and Vegetables. Anal. Chem. 2016, 88, 2149–2155. [Google Scholar] [CrossRef] [PubMed]
- Yao, G.H.; Liang, R.P.; Huang, C.F.; Wang, Y.; Qiu, J.D. Surface Plasmon Resonance Sensor Based on Magnetic Molecularly Imprinted Polymers Amplification for Pesticide Recognition. Anal. Chem. 2013, 85, 11944–11951. [Google Scholar] [CrossRef] [PubMed]
- Zhang, K.; Mei, Q.; Guan, G.; Liu, B.; Wang, S.; Zhang, Z. Ligand Replacement-induced fluorescence switch of quantum dots for ultrasensitive detection of organophosphorothioate pesticides. Anal. Chem. 2010, 82, 9579–9586. [Google Scholar] [CrossRef] [PubMed]
- Kubackova, J.; Fabriciova, G.; Miskovsky, P.; Jancura, D.; Sanchez-Cortes, S. Sensitive Surface-Enhanced Raman Spectroscopy (SERS) Detection of Organochlorine Pesticides by Alkyl Dithiol- Functionalized Metal Nanoparticles-Induced Plasmonic Hot Spots. Anal. Chem. 2014, 87, 663–669. [Google Scholar] [CrossRef] [PubMed]
- Azab, H.A.; Khairy, G.M.; Kamel, R.M. Time-resolved fluorescence sensing of pesticides chlorpyrifos, crotoxyphos and endosulfan by the luminescent Eu(III)-8-allyl-3- carboxycoumarin probe. Spectrochim. Acta Part A Mol. Biomol. Spectrosc. 2015, 148, 114–124. [Google Scholar] [CrossRef]
- Mauriz, E.; Calle, A.; Manclús, J.J.; Montoya, A.; Hilderbrandt, A.; BarcelÓ, D.; Lechuga, L.M. Optical immunosensor for fast and sensitive detection of DDT and related compounds in river water samples. Biosens. Bioelectron. 2007, 22, 1410–1418. [Google Scholar] [CrossRef]
- Chen, Y.; Ge, F.; Guang, S.; Cai, Z. Low-cost and large-scale flexible SERS-cotton fabric as a wipe substrate for surface trace analysis. Appl. Surface Sci. 2017, 436, 111–116. [Google Scholar] [CrossRef]
- Fleischmann, M.; Hendra, P.J.; Mcquillan, A.J. Raman spectra of pyridine adsorbed at a silver electrode. Chem. Phys. Lett. 1974, 26, 163–166. [Google Scholar] [CrossRef]
- Thi, B.H.N. Surface-Enhanced Raman Scattering (SERS) for In-Situ Analysis of Mixture of Polycyclic Aromatic Hydrocarbons (PAHs) in Sea-Water. Ph.D. Thesis, Technische Universität Berlin, Berlin, Germany, 2004. [Google Scholar]
- Ding, G.; Xie, S.; Liu, Y.; Wang, L.; Xu, F. Graphene oxide-silver nanocomposite as SERS substrate for dye detection: Effects of silver loading amount and composite dosage. Appl. Surface Sci. 2015, 345, 310–318. [Google Scholar] [CrossRef]
- Shi, G.; Wang, M.; Zhu, Y.; Shen, L.; Wang, Y.; Ma, W.; Chen, Y.; Li, R. A flexible and stable surface-enhanced Raman scattering (SERS) substrate based on Au nanoparticles/Graphene oxide/Cicada wing array. Opt. Commun. 2018, 412, 28–36. [Google Scholar] [CrossRef]
- Szlag, V.M.; Sarahi, R.R.; Jiayi, H.E.; Hudson-Smith, N.V.; Hyunho, K.; Ngoc, L.; Reineke, T.M.; Haynes, C.L. Molecular Affinity Agents for Intrinsic Surface–enhanced Raman Scattering (SERS) Sensors. ACS Appl. Mater. Interfaces 2018, 10, 31825–31844. [Google Scholar] [CrossRef] [PubMed]
- Huang, J.; Chen, F.; Zhang, Q.; Ma, D.; Xu, K.; Zhao, Y. 3D Silver Nanoparticles Decorated Zinc Oxide/Silicon Heterostructured Nanomace Arrays as High-Performance Surface-Enhanced Raman Scattering Substrates. ACS Appl. Mater. Interfaces 2015, 7, 5725–5735. [Google Scholar] [CrossRef]
- Hu, F.; Lin, H.; Zhang, Z.; Liao, F.; Shao, M.; Lifshitz, Y.; Lee, S.T. Smart Liquid SERS Substrates based on Fe3O4/Au Nanoparticles with Reversibly Tunable Enhancement Factor for Practical Quantitative Detection. Sci. Rep. 2014, 4, 7204. [Google Scholar] [CrossRef]
- Liang, H.; Li, Z.; Wang, W.; Wu, Y.; Xu, H. Highly Surface-roughened “Flower-like” Silver Nanoparticles for Extremely Sensitive Substrates of Surface-enhanced Raman Scattering. Adv. Mater. 2009, 21, 4614–4618. [Google Scholar] [CrossRef]
- Sun, Y.; Liu, K.; Miao, J.; Wang, Z.; Tian, B.; Zhang, L.; Li, Q.; Fan, S.; Jiang, K. Highly Sensitive Surface-Enhanced Raman Scattering Substrate Made from Superaligned Carbon Nanotubes. Nano Lett. 2010, 10, 1747–1753. [Google Scholar] [CrossRef] [PubMed]
- Zhang, Z.; Lu, D.F.; Liu, Q.; Qi, Z.; Yang, L.; Liu, J. Wavelength-interrogated surface plasmon resonance sensor with mesoporous-silica-film-enhanced sensitivity to small molecules. Analyst 2012, 137, 4822–4828. [Google Scholar] [PubMed]
- Zhang, Z.; Liu, J.; Qi, Z.M.; Lu, D.F. In situ study of self-assembled nanocomposite films by spectral SPR sensor. Mater. Sci. Eng. C Mater. Biol. Appl. 2015, 51, 242–247. [Google Scholar] [CrossRef]
- Rapiphun, J.; Sopis, C.; Saengrawee, S.; Akira, B.; Sukon, P. Functional Conducting Polymers in the Application of SPR Biosensors. J. Nanotechnol. 2012, 2012, 1–7. [Google Scholar]
- Wood, W.R. On a Remarkable Case of Uneven Distribution of Light in a Diffraction Grating Spectrum. Proc. Phys. Soc. Lond. 1902, 18, 269–275. [Google Scholar] [CrossRef]
- Otto, A. Excitation of nonradiative surface plasma waves in silver by the method of frustrated total reflection. Zeitschrift Für Physik a Hadrons Nuclei 1968, 216, 398–410. [Google Scholar] [CrossRef]
- Kretschmann, E.; Raether, H. Notizen: Radiative Decay of Non Radiative Surface Plasmons Excited by Light. Zeitschrift Für Naturforschung A 1968, 23, 2135–2136. [Google Scholar] [CrossRef]
- Nylander, C.; Liedberg, B.; Lind, T. Gas detection by means of surface plasmon resonance. Sens. Actuators 1983, 3, 79–88. [Google Scholar] [CrossRef]
- Breault-Turcot, J.; Masson, J.F. Nanostructured substrates for portable and miniature SPR biosensors. Anal. Bioanal. Chem. 2012, 403, 1477–1484. [Google Scholar] [CrossRef] [PubMed]
- Li, J.; Lu, D.F.; Zhang, Z.; Liu, Q.; Qi, Z.M. Hierarchical mesoporous silica film modified near infrared SPR sensor with high sensitivities to small and large molecules. Sens. Actuators B Chem. 2014, 203, 690–696. [Google Scholar] [CrossRef]
- Ashley, J.; Piekarska, M.; Segers, C.; Trinh, L.; Rodgers, L.; Willey, R.; Tothill, E. An SPR based sensor for allergens detection. Biosens. Bioelectron. 2016, 88, 109–113. [Google Scholar] [CrossRef]
- Zhang, P.; Chen, Y.P.; Wang, W.; Shen, Y.; Guo, J.S. Surface plasmon resonance for water pollutant detection and water process analysis. TrAC Trends Anal. Chem. 2016, 85, 153–165. [Google Scholar] [CrossRef]
- Miura, N.; Sasaki, M.; Sakai, G.; Gobi, K.V. Regenerable surface plasmon resonance (SPR)-based immunosensor for highly sensitive measurement of sub-ppb levels of benzo (a) pyrene. Chem. Lett. 2002, 31, 342–343. [Google Scholar] [CrossRef]
- Yin, P.; Wang, Y.; Li, Y.; Deng, C.; Zhang, X.; Yang, P. Preparation of sandwich-structured graphene/mesoporous silica composites with C8-modified pore wall for highly efficient selective enrichment of endogenous peptides for mass spectrometry analysis. Proteomics 2012, 12, 2784. [Google Scholar] [CrossRef]
- Tao, Y.; Kanoh, H.; Abrams, L.; Kaneko, K. Mesopore-Modified Zeolites: Preparation, Characterization, and Applications. Chem. Rev. 2006, 106, 896–910. [Google Scholar] [CrossRef] [PubMed]
- Vyhmeister, E.; Valdés-González, H.; Muscat, A.J.; Sulleiman, D.; Estévez, L.A. Surface Modification of Porous Silicon-Based Films Using Dichlorosilanes Dissolved in Supercritical Carbon Dioxide. Ind. Eng. Chem. Res. 2013, 52, 4762–4771. [Google Scholar] [CrossRef]
- Michael, S. Fluorescence-based Biosensors. In Encyclopedia of Analytical Chemistry; Meyers, R.A., Ed.; John Wiley & Sons Ltd.: Hoboken, NY, USA, 2011. [Google Scholar]
- Reid, C. Book Reviews: Excited States in Chemistry and Biology. Science 1957, 126, 1021. [Google Scholar]
- Ariese, F.; Gooijer, C.; Velthorst, N.H. Application of fluorescence spectroscopic techniques in the determination of PAHs and PAH metabolites. Tech. Instrum. Anal. Chem. 2000, 21, 789–824. [Google Scholar]
- Nsibande, S.A.; Forbes, P.B.C. Fluorescence detection of pesticides using quantum dot materials—A review. Anal. Chim. Acta 2016, 945, 9–22. [Google Scholar] [CrossRef] [PubMed]
- Yang, R.; Dong, G.; Sun, X.; Yang, Y.; Yu, Y.; Liu, H.; Zhang, W. Feasibility of the simultaneous determination of polycyclic aromatic hydrocarbons based on two-dimensional fluorescence correlation spectroscopy. Spectrochim. Acta Part A Mol. Biomol. Spectrosc. 2018, 190, 342–346. [Google Scholar] [CrossRef] [PubMed]
- Apicella, B.; Ciajolo, A.; Tregrossi, A. Fluorescence Spectroscopy of Complex Aromatic Mixtures. Anal. Chem. 2004, 76, 2138–2143. [Google Scholar] [CrossRef] [PubMed]
- Chen, W.; Qi, F.; Li, C.; Cao, J.; Li, Z.; Dou, J.; Bei, Y.; Zhan, J.; Zhu, Q. Functionalized polysilsesquioxane film fluorescent sensors for sensitive detection of polychlorinated biphenyls. J. Organomet. Chem. 2014, 749, 296–301. [Google Scholar] [CrossRef]
- Fernández-Sánchez, J.F.; Carretero, A.S.; Cruces-Blanco, C.; Fernández-Gutiérrz, A. The development of solid-surface fluorescence characterization of polycyclic aromatic hydrocarbons for potential screening tests in environmental samples. Talanta 2003, 60, 287–293. [Google Scholar] [CrossRef]
- Fernández-Sánchez, J.F.; Carretero, A.S.; Cruces-Blanco, C.; Fernández-Gutiérrez, A. Highly sensitive and selective fluorescence optosensor to detect and quantify benzo[a]pyrene in water samples. Anal. Chim. Acta 2004, 506, 1–7. [Google Scholar] [CrossRef]
- Adegoke, O.; Montaseri, H.; Nsibande, S.A.; Forbes, P.B.C. Alloyed quaternary/binary core/shell quantum dot-graphene oxide nanocomposite: Preparation, characterization and application as a fluorescence “switch ON” probe for environmental pollutants. J. Alloys Compd. 2017, 720, 70–78. [Google Scholar] [CrossRef]
- Yang, L.; Chen, B.; Luo, S.; Li, J.; Liu, R.; Cai, Q. Sensitive detection of polycyclic aromatic hydrocarbons using CdTe quantum dot-modified TiO2 nanotube array through fluorescence resonance energy transfer. Environ. Sci. Technol. 2010, 44, 7884. [Google Scholar] [CrossRef] [PubMed]


| Spectroscopy Technologies | SERS | SPR | Fluorescence | ||||
|---|---|---|---|---|---|---|---|
| Analytes | Substrate | LOD | Substrate | LOD | Substrate/Method | LOD | |
| PAHs | Pyrene | Au nanoplates | 5 × 10⁻¹⁰ M [28] | / | / | Fluorescence spectrophotometer based on a molecularly imprinted polymer (MIP) | 5 ηg·L−1 [29] |
| Fluoranthene | Anodic aluminumoxid based Ag dendritic substrates | 10−8 M [30] | / | / | 5 ηg·L−1 [29] | ||
| Fluorene | Fe3O4 @Au particles | 10−7 M [31] | / | / | 6 ηg·L−1 [29] | ||
| Acenaphthylene | / | / | |||||
| Acenaphthene | Online in-tube solid-phase microextraction coupled with high- performance liquid chromatography and fluorescence detection in hair | 5.4 ηg·mL−1 [32] | |||||
| Benzo[a]anthracen | 5 × 10⁻⁹ M [31] | / | / | Fluorescence spectrophotometer based on a molecularly imprinted polymer (MIP) | 7 ηg·L−1 [29] | ||
| benzo[b]fluoranthene | Online in-tube solid-phase microextraction coupled with high performance liquid chromatography and fluorescence detection in hair | 2.3 pg·mL−1 [32] | |||||
| benzo[k]fluoranthene | UV absorption spectrometry | 0.04 μg·L−1 [33] | |||||
| Benzo(g,hi)perylene | Online in-tube solid-phase microextraction coupled with high- performance liquid chromatography and fluorescence detection in hair | 5.0 pg·mL−1 [32] | |||||
| Indeno(1,2,3-cd)pyrene | 20.4 pg·mL−1 [32] | ||||||
| Chrysene | Fluorescence spectrophotometer based on a molecularly imprinted polymer (MIP) | 5 ηg·L−1 [29] | |||||
| Dibenzo[a,h]anthracene | 10−8 M [31] | / | / | Online in-tube solid-phase microextraction coupled with high- performance liquid chromatography and fluorescence detection in hair | 3.3 pg·mL−1 [32] | ||
| Anthracene | 10−8 M [31] | / | / | 0.5 pg·mL−1 [32] | |||
| Benzo(a)pyrene | Gold nanoparticles-embedded alginate gel | 3.65 × 10⁻¹⁰ M [34] | The nanoporous gold film | 5 pM [35] | Fluorescence spectrophotometer based on a molecularly imprinted polymer (MIP) | 3 ηg·L−1 [29] | |
| Naphthalene | Hydroxylamine reduced silver colloid | 10−12 M [36] | / | / | Online in-tube solid-phase microextraction coupled with high- performance liquid chromatography and fluorescence detection in hair | 9.3 pg·mL−1 [32] | |
| Phenanthrene | 10−10 M [36] | / | / | Fluorescence spectrophotometer based on a molecularly imprinted polymer (MIP) | 6 ηg·L−1 [29] | ||
| Triphenylene | Ag nanoparticles functionalized with dithiocarbamate calix [4] arene | 10−8 M [37] | / | / | / | / | |
| Benzo[c]phenanthrene | 10−9 M [37] | / | / | / | / | ||
| Coronene | 10−10 M [37] | / | / | / | / | ||
| PCBs | 3,3′,5,5′-tetrachlorobiphenyl (PCB 80) | / | / | Gold thin film immobilized with Cytochrome c | 0.1 ppb [38] | / | / |
| 2,3,3′,4,4′-tetrachlorobiphenyl (PCB105) | / | / | / | / | Photoactivated fluorescence procedure with a laser system for photoactivation | 0.05 μg·mL−1 [39] | |
| 4-chlorobiphenyl (PCB3) | / | / | / | / | Extraction/concentration with tab- shaped elements cut from C18 fiber glass SPE disks coupled with a fluorescence detection | 0.07 μg·L−1 [40] | |
| 4,4′-dichlorobiphenyl (PCB15) | / | / | / | / | 0.40 μg·L−1 [40] | ||
| 3,4,4′-trichlorobiphenyl (PCB37) | / | / | / | / | 0.30 μg·L−1 [40] | ||
| 2,3′,4,4′-5-Pentachlorobiphenyl (PCB118) | / | / | / | / | 1. 0 μg·L−1 [40] | ||
| 3,3′,4,4′ 5-pentachlorobiphenyl (PCB126) | / | / | / | / | 0.80 μg·L−1 [40] | ||
| 3,3′,4, 4′, 5,5′-Hexachlorobiphenyl (PCB169) | / | / | / | / | 0.20 μg·L−1 [40] | ||
| 2,2′,3,4,5′-pentachlorobiphenyl (PCB87) | / | / | / | / | 1.0 μg·L−1 [40] | ||
| 2,3,3′,4′,6′-pentachlorobiphenyl (PCB110) | / | / | / | / | 6.0 μg·L−1 [40] | ||
| 3,3′,4,4′-tetrachlorobiphenyl (PCB77) | Ag-NPassembled Bi-nanoring Arrays | 10−9 M [41] | / | / | 0.50 μg·L−1 [40] | ||
| 2,2′,3,3′-tetrachlorobiphenyl (PCB40) | Nanostructured GO assemblies with Ag nanoprisms | 10−7 M [42] | / | / | / | / | |
| 2,2′,5,5′-tetrachlorobiphenyl (PCB52) | 3.33 × 10⁻⁴ M [42] | / | / | / | / | ||
| 2,2′,4,4′-tetrachlorobiphenyl (PCB47) | 5 × 10⁻¹¹ M [43] | / | / | / | / | ||
| 3-chlorobiphenyl (PCB2) | β-cyclodextrin coated SiO2@Au@Ag core/shell nanoparticles | 10−6 M [44] | / | / | / | / | |
| 2,4,5-trichlorobiphenyl (PCB29) | / | / | / | / | |||
| OPs | Chlorpyrifos | Colloidal gold nanoparticles | 3.51 ng·(cm2) −1 [45] | SPR chip coated by magnetic molecular imprinting polymer chlorpyrifos | 0.76 nM [46] | CdTe QD Fluorescence Switch | 0.1 nM [47] |
| endosulfan | Silver and gold colloids functionalized with alkyl dithiols | 170 μg·L−1 [48] | / | / | Time-resolved fluorescence in microtiter plates | 0.004 μM [49] | |
| Lindane | 1028 μg·L−1 [48] | / | / | / | / | ||
| dieldrin | 316 μg·L−1 [48] | / | / | / | / | ||
| aldrin | 45 μg·L−1 [48] | / | / | / | / | ||
| DDT | / | / | Dense gold film functionalized by alkanethiol monolayer | 15 ng·L−1 [50] | / | / | |
© 2019 by the authors. Licensee MDPI, Basel, Switzerland. This article is an open access article distributed under the terms and conditions of the Creative Commons Attribution (CC BY) license (http://creativecommons.org/licenses/by/4.0/).
Share and Cite
Wang, L.; Pang, S.; Zhou, G. Recent Advances in Spectroscopy Technology for Trace Analysis of Persistent Organic Pollutants. Appl. Sci. 2019, 9, 3439. https://doi.org/10.3390/app9173439
Wang L, Pang S, Zhou G. Recent Advances in Spectroscopy Technology for Trace Analysis of Persistent Organic Pollutants. Applied Sciences. 2019; 9(17):3439. https://doi.org/10.3390/app9173439
Chicago/Turabian StyleWang, Li, Shujie Pang, and Gang Zhou. 2019. "Recent Advances in Spectroscopy Technology for Trace Analysis of Persistent Organic Pollutants" Applied Sciences 9, no. 17: 3439. https://doi.org/10.3390/app9173439
APA StyleWang, L., Pang, S., & Zhou, G. (2019). Recent Advances in Spectroscopy Technology for Trace Analysis of Persistent Organic Pollutants. Applied Sciences, 9(17), 3439. https://doi.org/10.3390/app9173439