Article

A Multi-Scale Modeling of CH4 and H2O Adsorption on Coal Molecules and the Water Blocking Effect in Coalbed Methane Extraction

1
PetroChina Huabei Oilfield Company, No. 1 Jianshe Middle Road, Renqiu City, Hebei 062552, China
2
School of Chemistry and Chemical Engineering, Southwest Petroleum University, Chengdu 610500, China
3
National Supercomputing Center in Shenzhen, Shenzhen 518055, China
*
Author to whom correspondence should be addressed.
Appl. Sci. 2019, 9(16), 3421; https://doi.org/10.3390/app9163421
Submission received: 24 July 2019 / Revised: 11 August 2019 / Accepted: 13 August 2019 / Published: 19 August 2019

Abstract

:
Coalbed methane (CBM) is of great economic value. However, at the same time, CBM is facing a multitude of technological challenges. The water blocking effect (WBE) is one of the physical effects that controls the production of CBM. To alleviation WBE, it is necessary to study its mechanisms at the molecular level. In this study, we used a combined first-principles calculation and molecular simulation approach to investigate the adsorption and diffusion of both methane and water in coal. The results suggest that water does not compete with methane in the adsorption on coal surfaces, yet the presence of water significantly slows down the diffusion of methane within the micropores of coal. This work not only explains the fundamental mechanisms of the WBE but also provides a simulation framework for building strategies to alleviate WBE.

Graphical Abstract

1. Introduction

Coalbed methane (CBM) is one kind of natural gas found in a coal reservoir [1]. A report by Mastalerz et al. shows that, in 2014, the global CBM production reached over 240 billion cubic meters [2]. Despite its large production and considerable economic value, CBM is fundamentally different from the conventional gas, and its production put forward numerous scientific and technical challenges [3,4]. It is generally presumed that gas holding capacity and permeability are two important factors which characterize a CBM reservoir. The former factor determines the gas capacity of the reservoir, while the latter one suggests the easiness of gas extraction [1]. Moreover, CBM is often found with other components, including water and carbon dioxide, in the coal reservoir. Water can also be introduced into the coalbed via hydraulic fracturing during well development processes. Therefore, a study on the adsorption and diffusion behaviors of methane on coal, especially in the presence of water, can generate a better understanding of CBM reservoirs and provide insights on the development of the exploration technologies.
Methane adsorption in the coal matrix has been widely studied at the molecular level by using both first-principles methods [5,6,7,8,9,10] and molecular simulation techniques [11,12,13,14,15,16]. These works provide valuable insights into the mechanisms of methane adsorption and diffusion in the coal matrix. However, there are still several topics which are not fully discussed, as follows: 1. The molecular models for coal used in previous first-principles studies are often simplified as graphene or a single carbon sheet, while the effect of other functional groups in coal is neglected. 2. The effect of water, including its competitive adsorption with methane and its effect on methane diffusion, is not fully covered. However, in engineering practice, it has been found that the water blocking effect (WBE) is one of the major reasons that limit the production rate of CBM wells [17,18,19,20]. 3. The effect of microstructures, including micropores, are usually not considered in previous molecular models, although it is generally believed that methane is held within micropores in the CBM reservoirs.
In this study, we aim at bridging these gaps above by performing a combined density-functional theory (DFT) and molecular dynamics (MD) study, with emphasis on the effect of functional groups in coal, the competitive adsorption between water and methane, and the desorption and diffusion of methane with micropores in the presence and absence of water. In Section 3.2.1, insights generated from DFT calculations on the adsorption of methane and water on different sites of coal are presented, and in Section 3.2.2, the diffusion of the CH4/H2O system within micropores of coal is analyzed.

2. Materials and Methods

2.1. DFT Calculations

We used plane-wave density functional theory (DFT) to predict the adsorption behaviors of methane and water on the coal surfaces at the molecular level. All calculations were performed using the DMol3 program in the Materials Studio software package. (Version 2017 R2, Dassault Systèmes BIOVIA, San Diego, 5005 Wateridge Vista Drive, CA, USA) [21,22]. The Perdew–Burke–Ernzerhof (PBE) [23] form of the generalized gradient approximation (GGA) was used as the exchange-correlation functional. Grimme’s DFT-D method was adopted to account for the dispersion effect [24]. We also tested other forms of functionals, including revised PBE (RPBE) [25] and Becke-Lee-Yang-Parr (BLYP) [26] forms of GGA functionals, as well as two typical higher-level meta-GGA functionals, namely m11-L [27] and revtpss [28], but found that PBE coupled with DFT-D can closely reproduce the well-established adsorption energy value of methane on the surface of graphene, while keeping the computational cost reasonably low. A detailed comparison between functionals is given in Section 3.1.1. The triple numerical plus polarization (TNP) basis set (version 4.4) was used in all DFT calculations [21]. All other parameters related to the electronic and geometric steps were set to the default values at the fine level provided by the DMol3 program.
Coal is a chemical complex consists of C, O, H, N, and S. It does not have a fixed molecular structure and can be subdivided into different types, including anthracite coals, bituminous coals, subbituminous coals, and lignite coals, depending on the concentration of the C element [29]. In this study, we focused on bituminous coals and selected three classical molecular models, which are shown in Figure 1a–c, to simulate the coalbed. In this paper, these three models in Figure 1a–c are referred to as Given type 1 model (G1) [30], Given type 2 model (G2) [31], and Fuchs-Sandoff (FS) model [32], respectively, according to their original references. We chose these three models because they contain a wide range of structural elements and functional groups, including but not limited to aromatic planes, alkane chains, hydroxyl groups, carbonyl groups, and pyridine. These models can represent different structures of coal molecules. As shown later in Section 3.1, although our calculations were based on these three bituminous coals molecules, the results are general and can be extended to other types of coals.

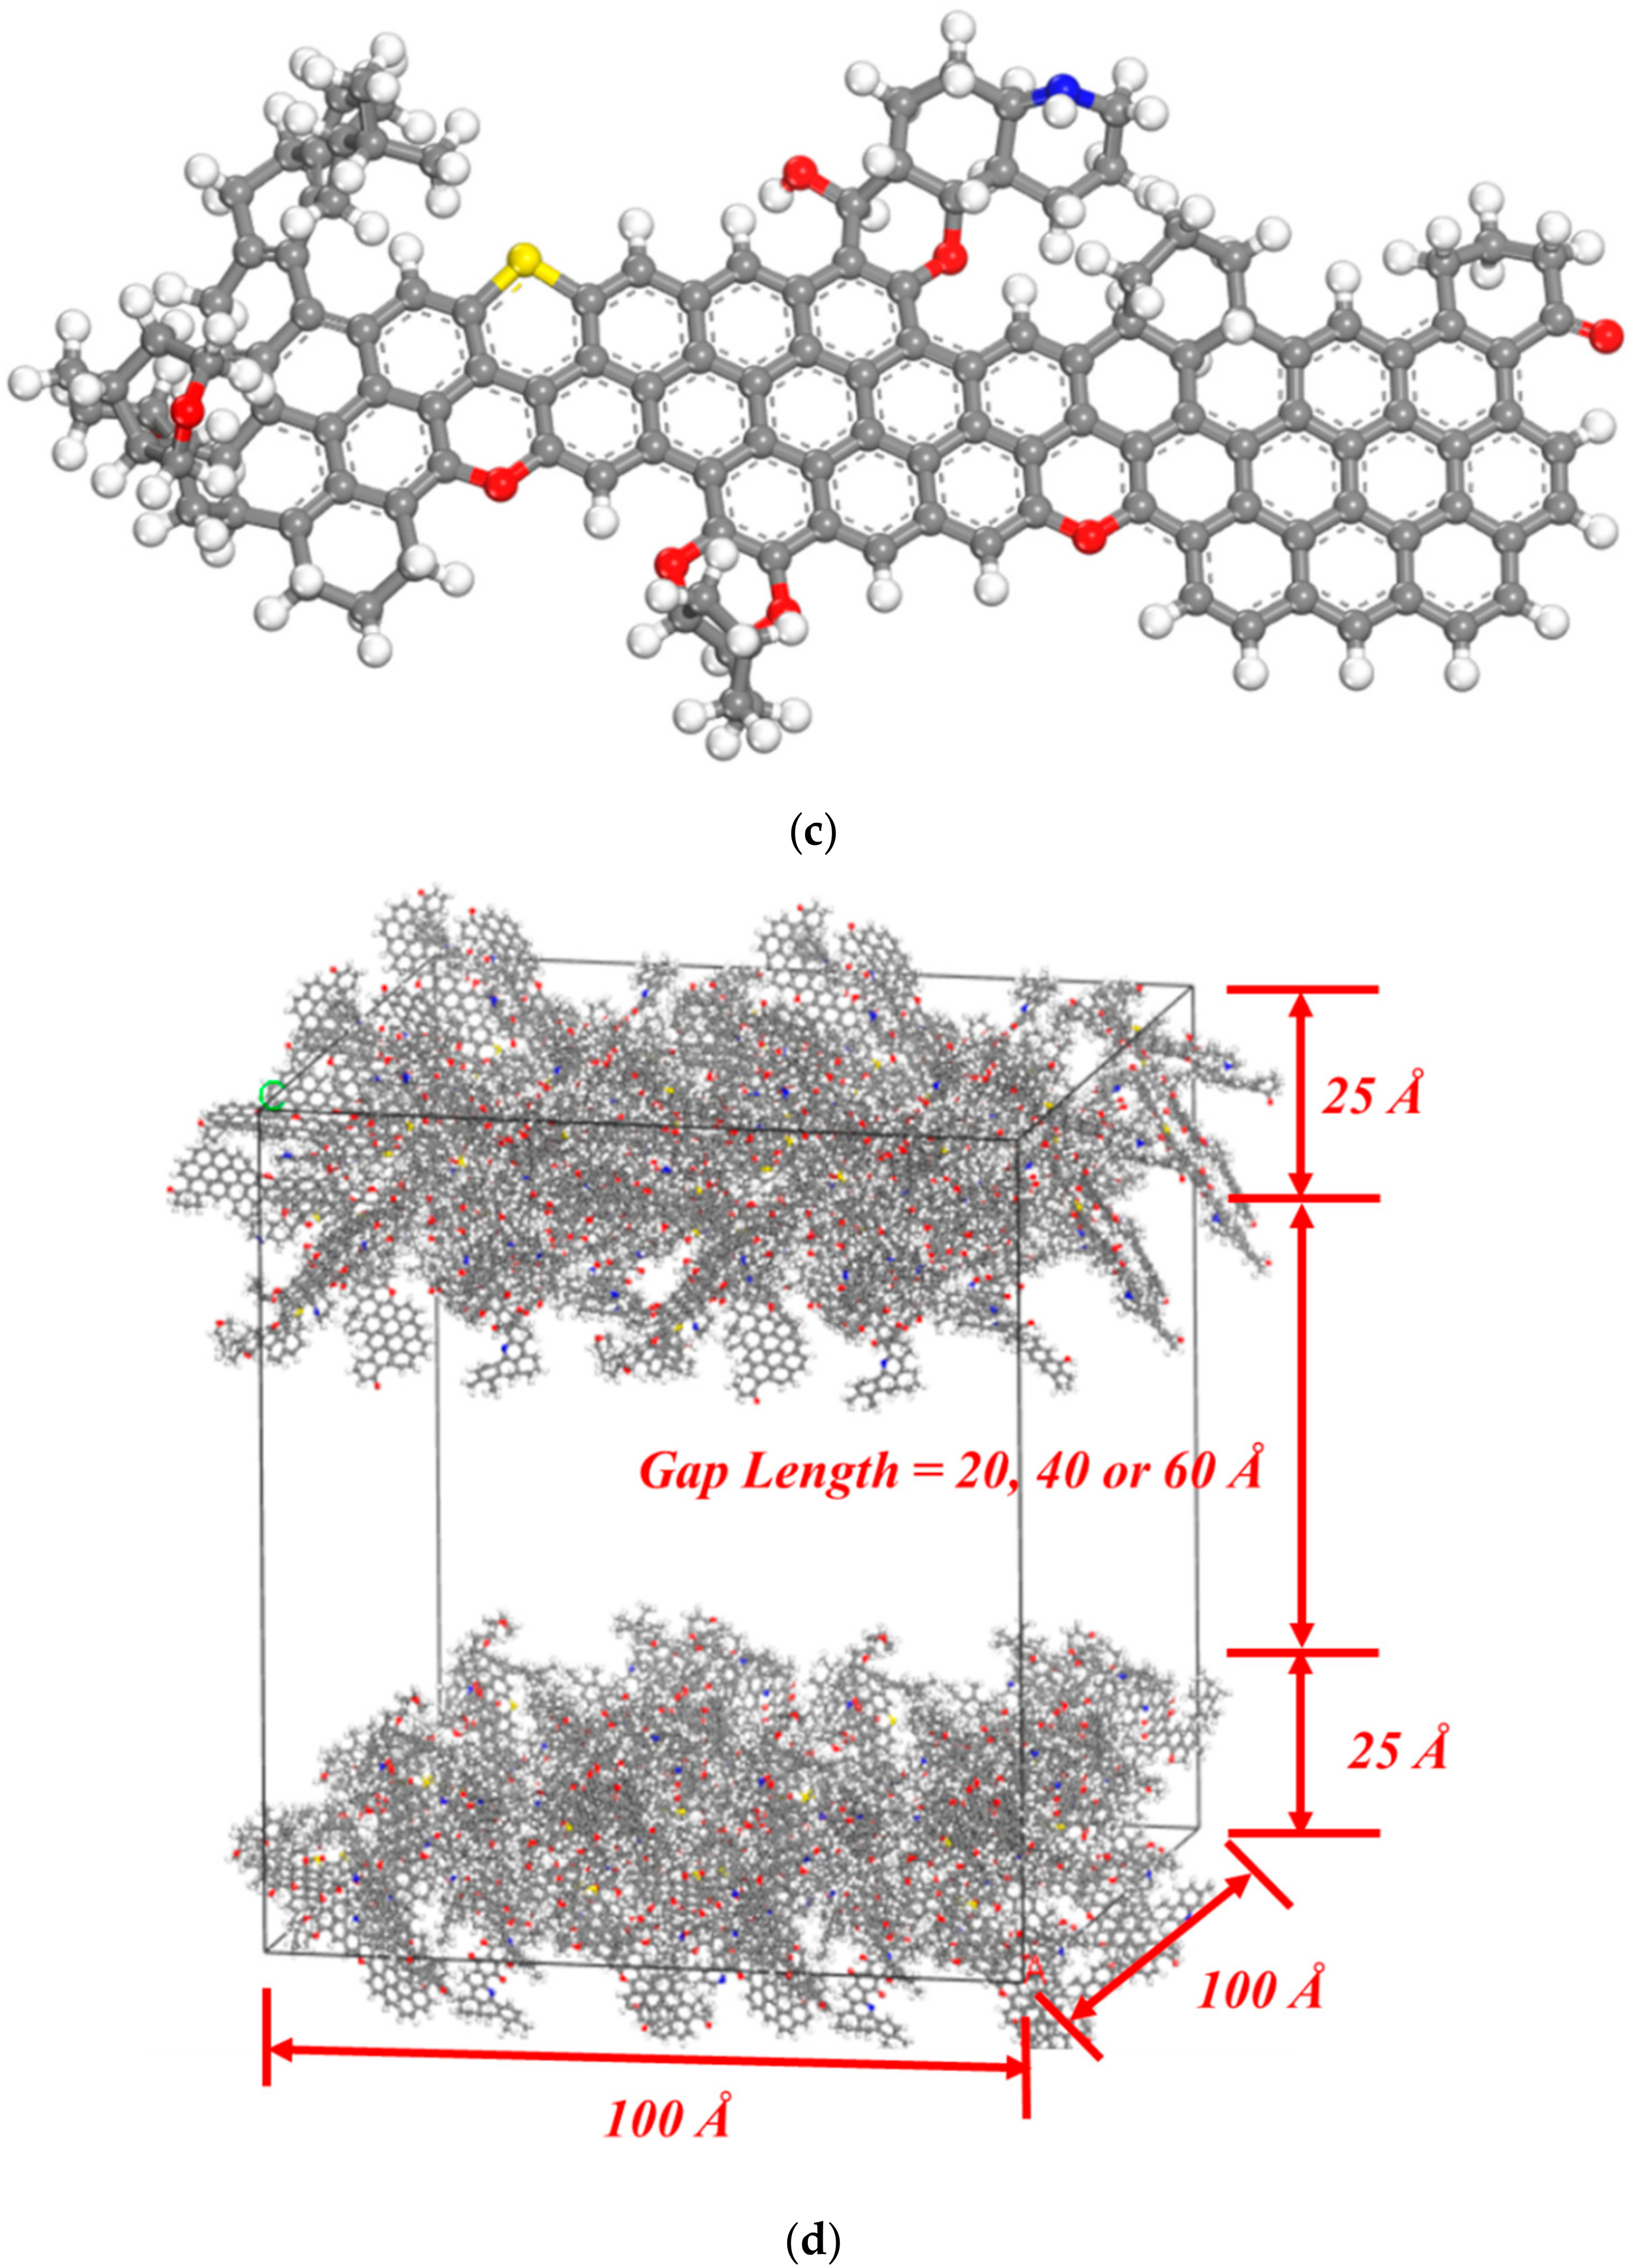
2.2. Molecular Simulation

Molecular simulation methods were used to study the desorption and diffusion of CH4 in coalbed. The coalbed model used in this study is shown in Figure 1d, which is a large periodic cell with both length and width being 100 Å. This model was obtained from an amorphous cell construction from 80 G1 molecules, 80 FS molecules, and 8 G2 molecules. The cell contains 16,736 C atoms, 13,712 H atoms, 1200 O atoms, 176 N atoms, 80 S atoms, and, therefore, totally 31,904 atoms. The upper and lower part of the amorphous cell was separated by 20 Å, 60 Å and 100 Å, respectively, to create a gap which represents micropores in the coalbed where CH4 and H2O can be adsorbed.
Methane and water were represented by full atomic models. The COMPASS forcefield was used in this work [33]. Electrostatic interactions were calculated by using forcefield assigned charges. The summation methods for electrostatic and van der Waals interactions were Ewald and atom-based, respectively.
Grand canonical Monte Carlo (GCMC) simulations were used to calculate the adsorption isotherms of CH4, H2O and the mixture of CH4 and H2O at various pressures in coalbed with different pore sizes. The temperature was fixed at 318.15 K (45 °C) since this is a typical coalbed temperature in coalbed gas extraction processes. For each case, 104 configurations at equilibrium were generated and the configuration with the lowest energy was used as the initial input in a MD simulation.
The MD simulations were performed in the constant-temperature, constant-volume (NVT) ensemble with a Nosé–Hoover thermostat to calculate the diffusivities [34]. The cutoff radius of 15.5 Å and time step of 1 fs were used. During simulations, the coalbed model atoms were kept fixed. The diffusion coefficients were calculated by the mean squared displacement (MSD) based on the Einstein relation given by Equation (1).
D = lim t 1 6 t N k = 1 N r k t r k 0 2 ,
where N is the number of CH4 molecules, and r k t is the position of the C atom of the k-th CH4 molecule at time t.

3. Results and Discussion

3.1. DFT Calculated CH4 and H2O Adsorption on Coal

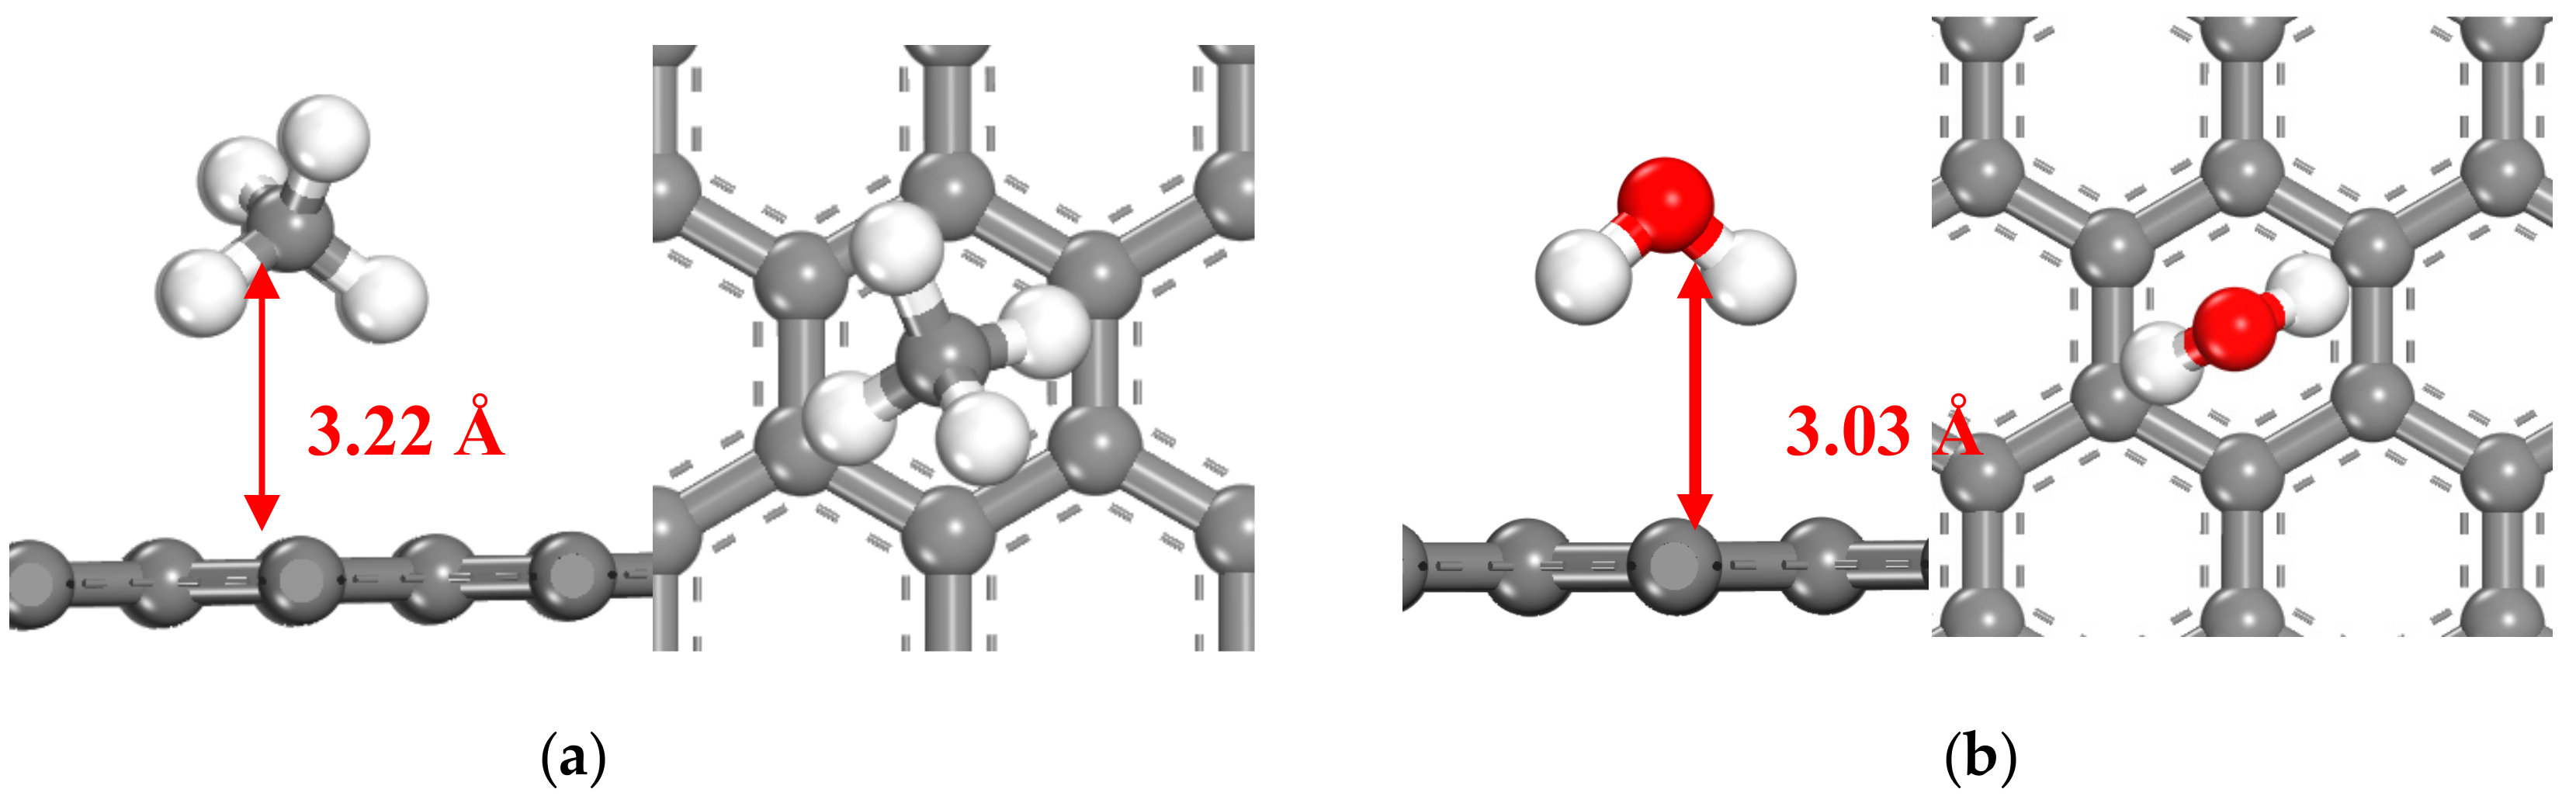
3.1.1. CH4 and H2O Adsorption on Graphene

Graphene, or a single layer of carbon rings, was often used as a simplified model for coal in previous studies [5,9,35]. In this work, CH4 and H2O adsorptions on graphene were tested in order to validate our computational methods, as well as to provide a baseline for the binding affinity to CH4 and H2O.
The most stable adsorption geometries of CH4 and H2O on graphene predicted by the PBE functional with DFT-D dispersion corrections are shown in Figure 2. Table 1 lists the adsorption energies (Eads) calculated by the PBE+DFT-D and other methods, along with the distances between the graphene plane and the CH4 or H2O molecules.
The binding energy (−24.90 kJ/mol) and distance (3.22 Å) of CH4 adsorption on graphene predicted by PBE+DFT-D closely match the experimental values of −13.5 kJ/mol and 3.03 Å [38]. They also resemble the values found in previous theoretical calculations; for example, −31.8 kJ/mol and 3.36 Å, as reported by [36]. A similar study based on a smaller carbon model (C6H8) predicted the adsorption energy and distance to be −13.3~−13.89 kJ/mol and 3.36~3.39 Å [5].
The results in Table 1 suggest that the dispersion effect is indispensable for the correct prediction of CH4 and H2O adsorption since, without dispersion, the interactions between the carbon layer and the small molecules become rather weak so that the equilibrium distances are larger than the experimental value. The results also suggest that PBE+DFT-D can achieve accuracy equivalent to that produced by m11-L, which is a meta-GGA functional and computational more expensive [27]. Moreover, H2O adsorption is slightly stronger (−31.63 kJ/mol) than CH4 adsorption (−24.90 kJ/mol), with both hydrogen atoms facing towards the graphene layer.
As a comparison, we also tested the accuracy of the COMPASS forcefield. For methane adsorption, the COMPASS forcefield predicted value (−5.38 kJ/mol) is slightly weaker than the experimental result (−13.5 kJ/mol) but is qualitative correct. For H2O adsorption, COMPASS forcefield generates an adsorption energy (−17.4 kJ/mol) rather close to the experimental value. The results suggest that the accuracy of the COMPASS forcefield is adequate for the molecular simulation calculations performed in this study.

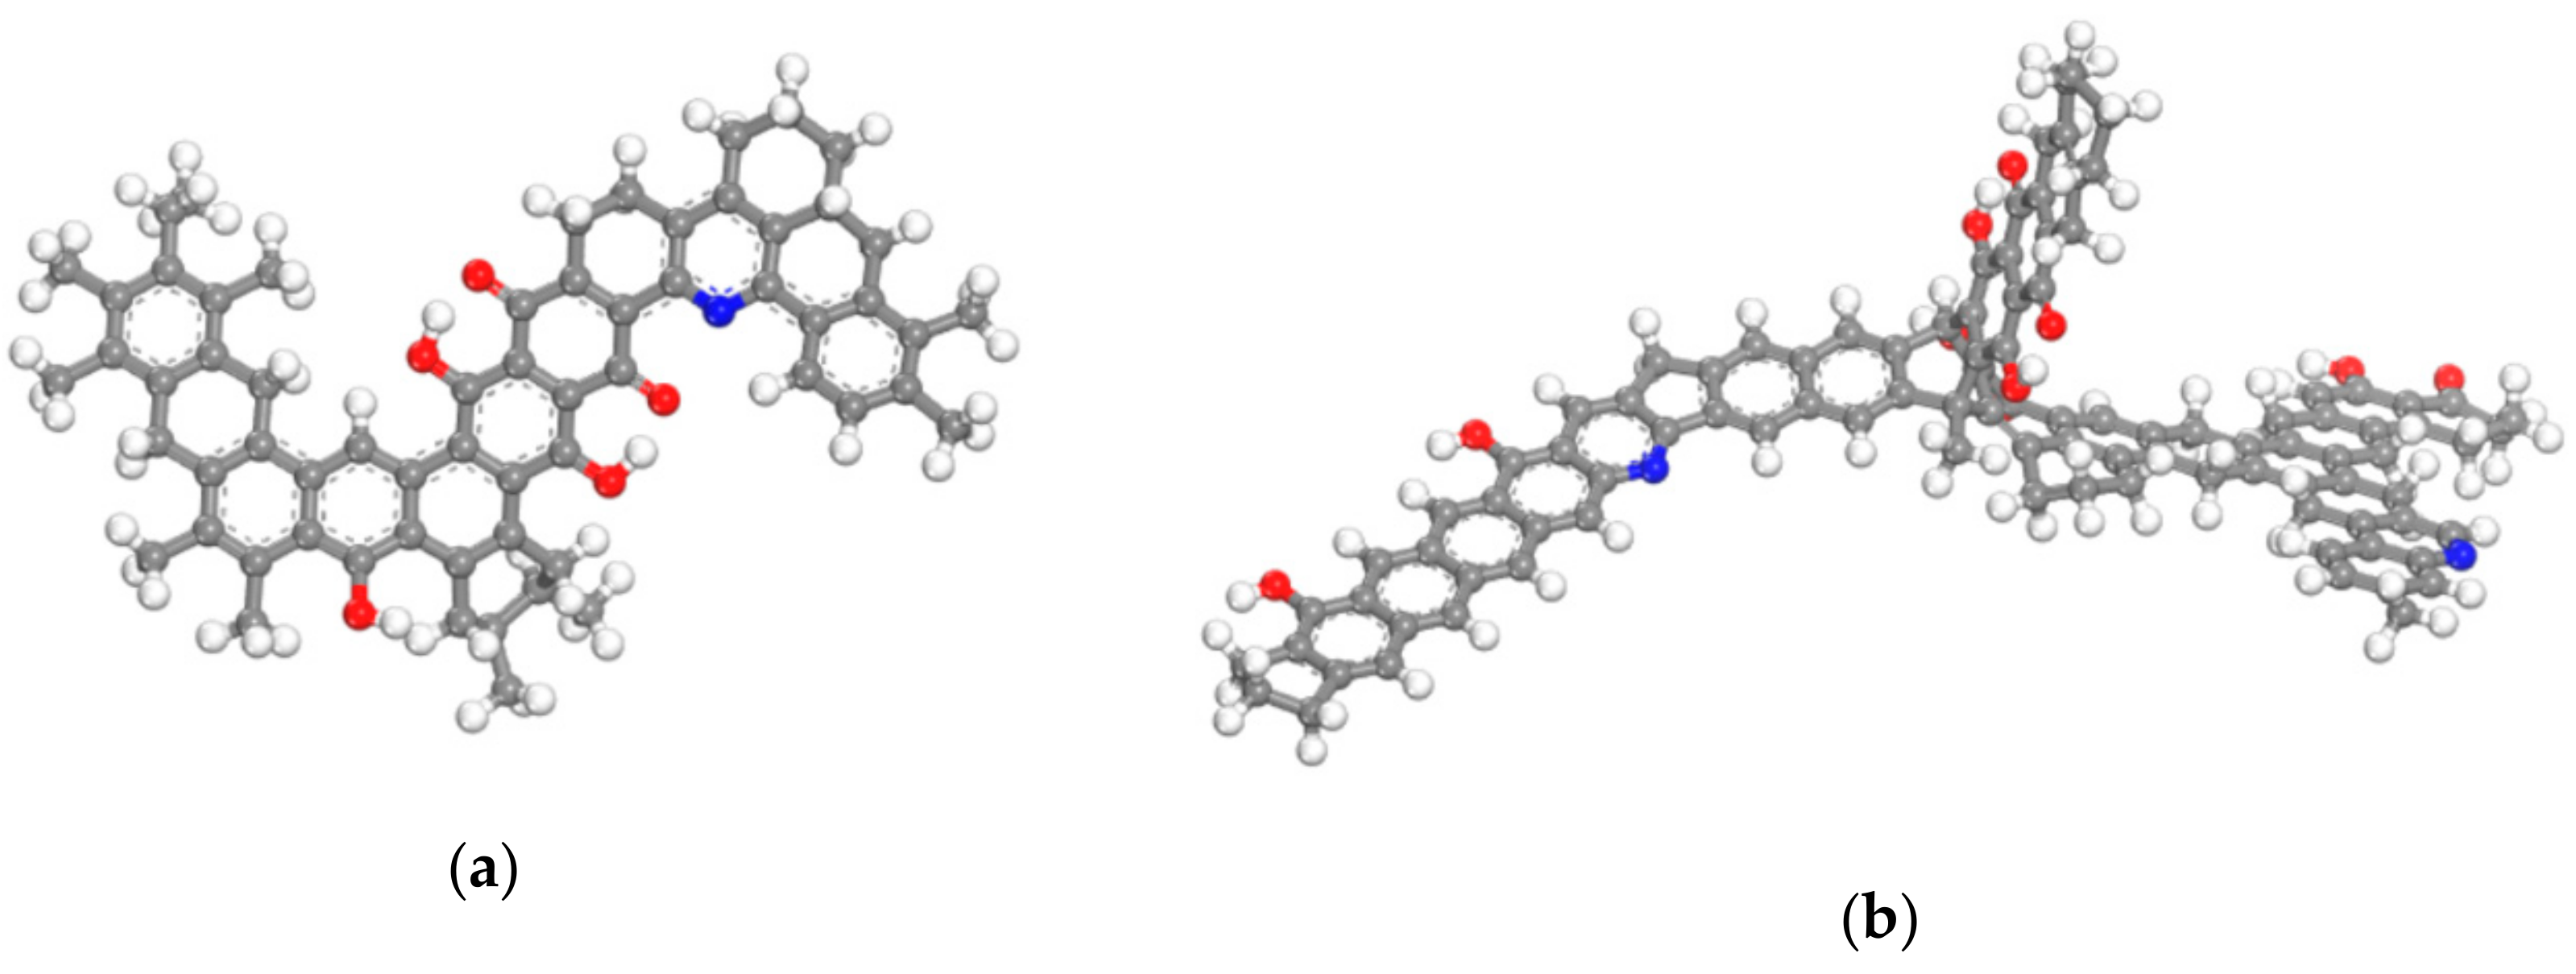
3.1.2. CH4 and H2O Adsorption on Coal Molecules

We calculated the adsorption of CH4 and H2O on various sites on the three representative coal molecules as described in Section 2. The results suggest that the binding affinity of CH4 and H2O to coal is primarily determined by the local chemical environment, i.e., the functional groups, on the coal molecules. Chemical compositions and structures of the portions on the coal molecules which are greater than 5 Å away from the CH4 or H2O molecule have little effect on the binding energy. Table 2 enumerates the binding energies of CH4 versus the functional groups, beside which CH4 is adsorbed. For each type of adsorption site, several typical adsorption structures are shown, along with their respective adsorption energies. Table 3 gives the same information for H2O adsorption.
Several observations can be made based on the results in Table 2 and Table 3.
  • The most stable adsorption site for CH4 is above aromatic planes, especially if a CH4 molecule interacts with more than one aromatic planes, such as the case in row 1 of Table 2. Polycyclic aromatic planes, which resemble the graphene plane, have slightly stronger bind affinity with CH4, than monocyclic aromatic planes.
  • The most stable adsorption site for H2O is N atom sites with H2O can form strong hydrogen bonds with N. However, considering that the percentage of the N element in coal is rather low, the amount of H2O molecule that can be attracted in coal by N atoms by hydrogen bonding is limited.
  • Water can form hydrogen bonds with O atoms or be adsorbed on aromatic planes, both of which have similar adsorption energies (around −33 kJ/mol). The adsorption of H2O on aromatic planes is slightly stronger than CH4 adsorption, which has Eads values around 20 kJ/mol. However, this difference is not large enough to allow the coal surface to have a strong binding preference with H2O.
  • The presence of substituents on the aromatic rings, such as hydroxyl, carbonyl, -O-, -N=, and -S -groups, often have little influence (<5 kJ/mol) on the adsorption energies of CH4 and H2O.
  • The least favorable adsorption sites for both CH4 and H2O are alkane groups and chains. It suggests that the molecular surfaces of anthracite coals, which have high carbon concentrations, should have stronger binding affinity with CH4 and H2O than bituminous coals, subbituminous coal, and lignite. This observation is consistent with previous findings that methane binding is stronger on larger aromatic planes [5]. However, this observation does not necessarily suggest that anthracite coals have stronger methane holding capacity, since other morphological factors, including pore sizes and specific surface areas, can also influence the methane sorption behaviors of coals.

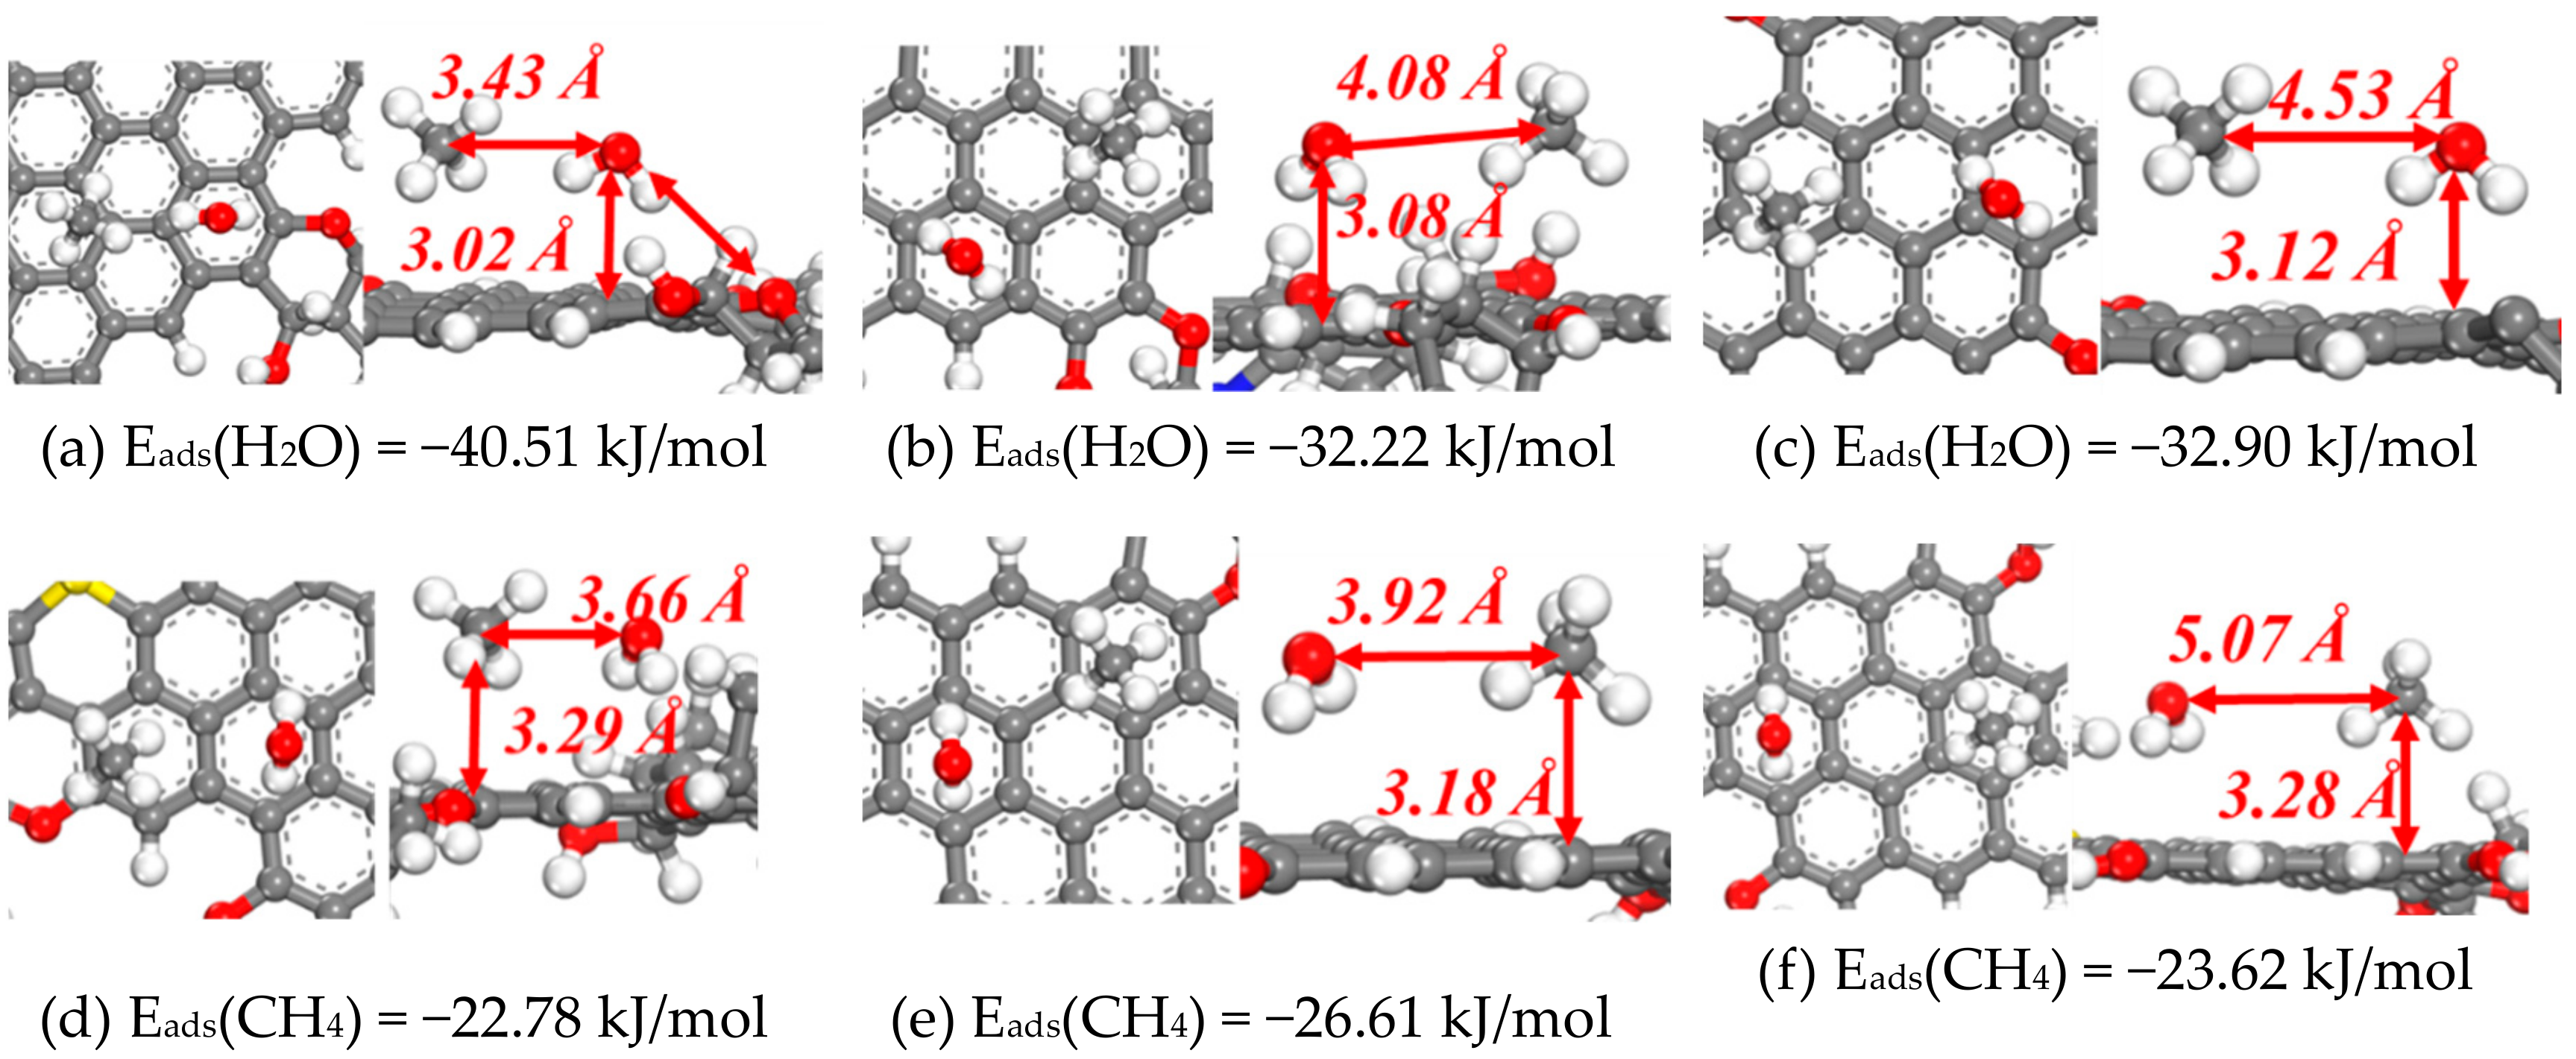
3.1.3. Co-Adsorption of CH4 and H2O on Coal Molecules

As demonstrated in Section 3.1.2, both CH4 and H2O prefer aromatic planes over alkane chains. Therefore, CH4 and H2O may be adsorbed competitively on the aromatic planes of coal. To quantitatively investigate their intermolecular interactions, we examined the co-adsorption of CH4 and H2O and calculated the adsorption energy of CH4 in the presence of a nearby H2O and vice versa. The geometries and energies of six co-adsorption structures are shown in Figure 3.
A comparison between Figure 3a,c and row 4 of Table 3 suggest that the presence of a nearby CH4 has a negligible influence on the adsorption of H2O, even if the distance between CH4 and H2O is as small as 3.43 Å. The same conclusion holds for CH4 adsorption. As shown in Figure 3d,f and row 2 of Table 2, the adsorption energy of CH4 above aromatic planes is around 22 kJ/mol, regardless of whether a nearby H2O molecule is present.
The results in Figure 3 suggest CH4 and H2O have rather weak interactions. They will neither enhance nor weaken the adsorption of each other. The results also imply that H2O does not have the ability to dispel CH4 from the coal surface if CH4 is already adsorbed on the surface. Water is usually found in CBM wells. In some cases, water coexists with coal in the well, and the CBM well needs to be dewatered before the extraction. In other instances where the CBM wells are fractured, external water is introduced through the fracturing fluid. This conclusion implies that water does not facilitate the desorption of CH4 from the coalbed. In Section 3.2, the effect of water on the desorption of CH4 from the coal surface is further investigated from the MD point of view.

3.2. MD Simulation of CH4 Desorption and Diffusion in Coalbed

In Section 3.1, we analyzed the adsorption of CH4 and H2O on the surface of coal molecules using DFT calculations. However, the results in Section 3.1 are from a static point of view. They provide limited information for the dynamic desorption and diffusion process of CH4 in a coalbed with the presence of fracturing fluid, which is crucial in coalbed gas extraction processes. In this section, we use MD methods to simulate the desorption and diffusion of CH4 with and without the presence of H2O.

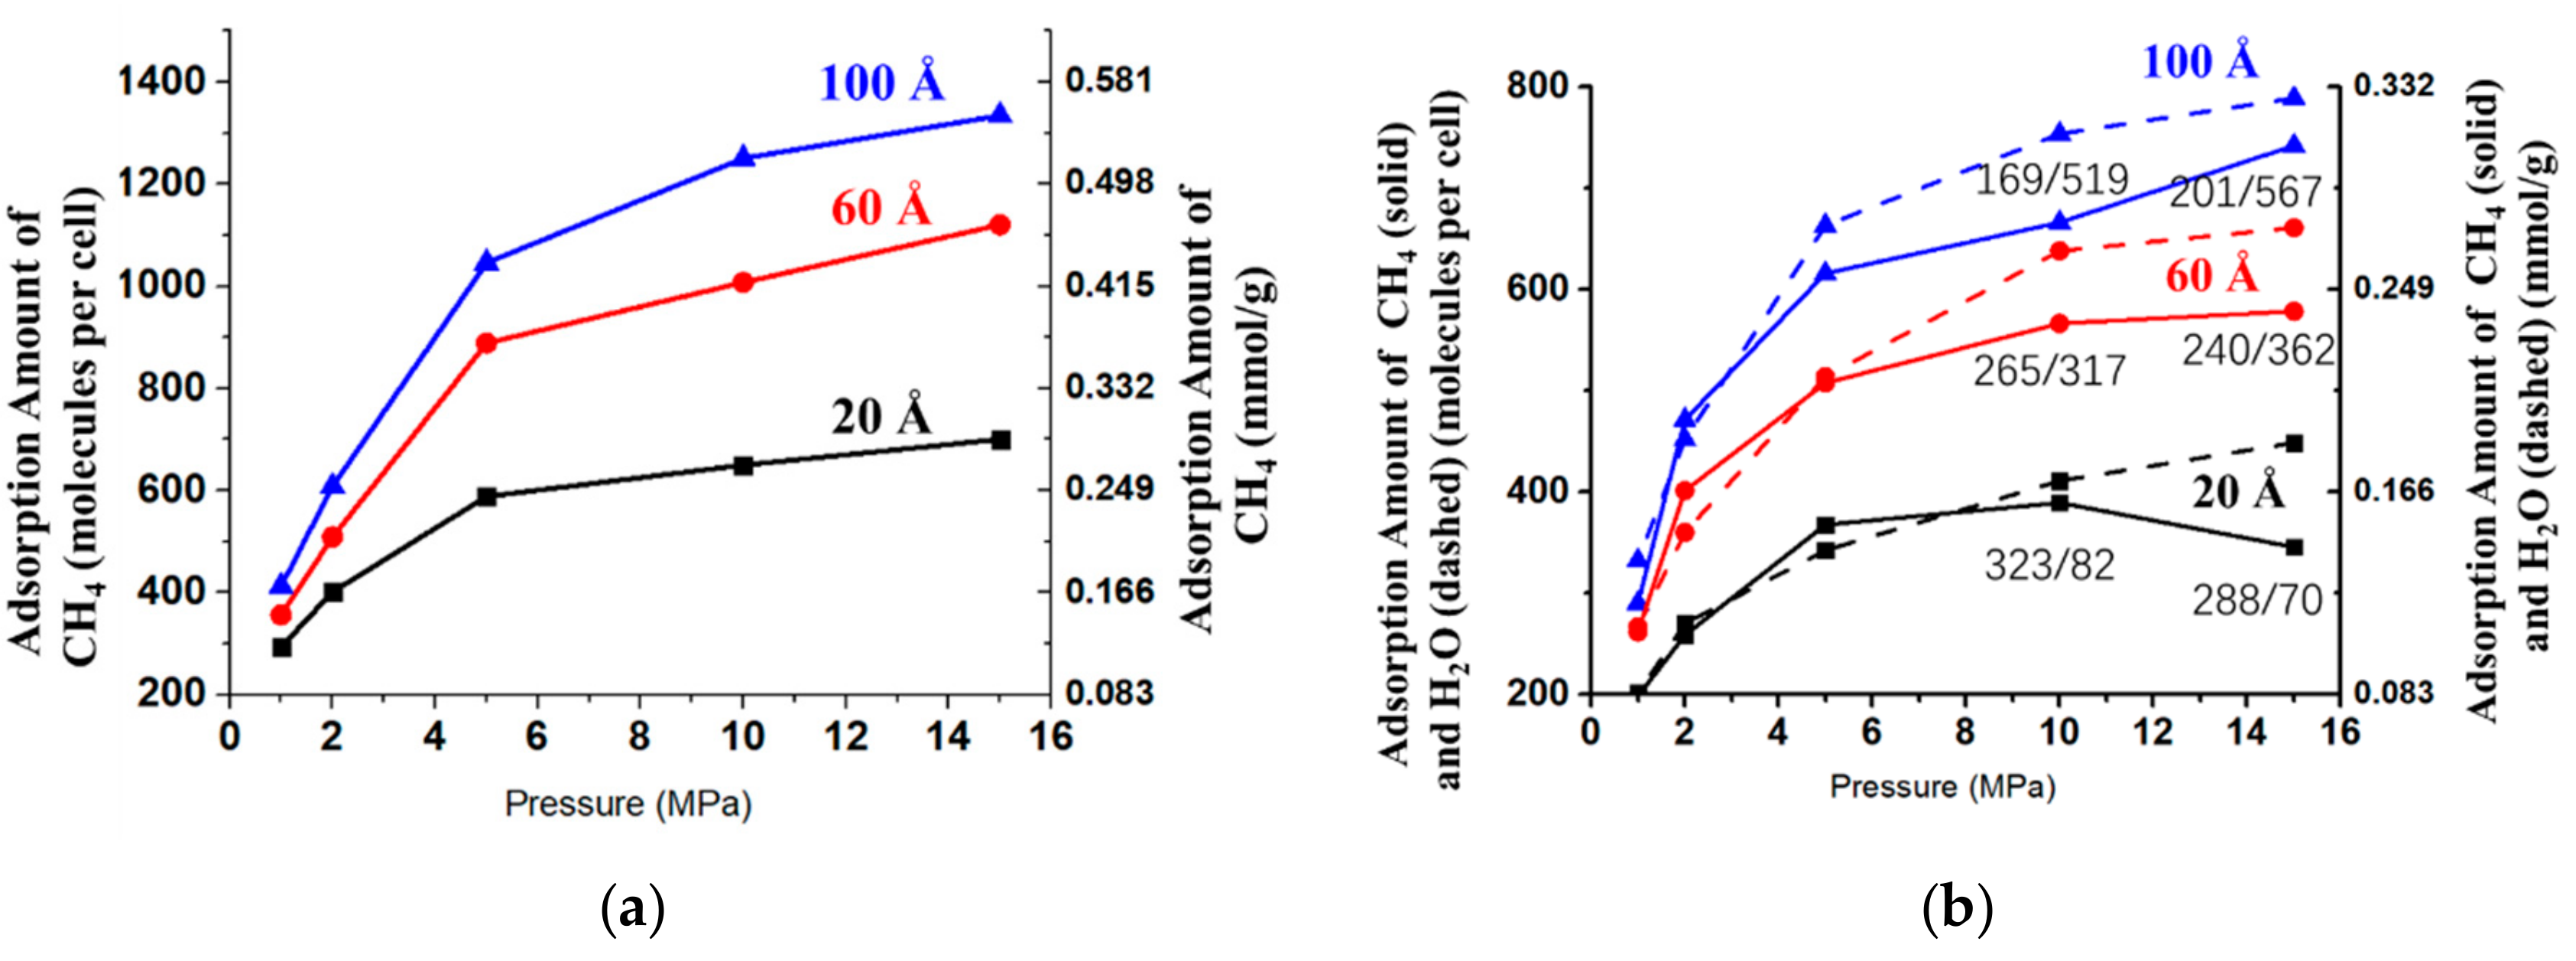
3.2.1. Adsorption Isotherms

The adsorption isotherms of CH4 on coal models with varying pore sizes were tested using the GCMC method. Two sets of calculations were performed. In the first set, the adsorption of pure CH4 was considered. In the second set, a mixture of CH4 and H2O, in which the fugacity of both CH4 and H2O are equal to the values marked on the x-axis, was loaded into the cell. Isotherms generated by these two sets of calculations are shown in Figure 4a,b, respectively.
Figure 4a suggests that the adsorption amount increases as the pore size and pressure become larger. However, the adsorption amount of the coalbed structure with 100 Å pore size is much less than five times of that with the 20 Å pore size. A more careful analysis shows that, under 15 MPa, 300 adsorbed and 1079 free CH4 molecules are in the 100 Å pore size model, if we consider CH4 molecules that are within 5 Å of the coal surface to be adsorbed. While in the 60 Å and 20 Å pore size models, the adsorbed/free CH4 molecules are 392/820 and 498/225, respectively. Therefore, the number of free CH4 is strictly proportional to the pore size, while at the same time a larger pore size promotes the desorption of CH4 from the surface when the pressure is kept constant.
When a mixture of CH4 and H2O was considered, the adsorption amounts of CH4 and H2O as functions of pore sizes and pressures are shown in Figure 4b. As represented by the solid curves, the adsorption amount of CH4 increases as the pressure becomes higher in the models with 100 Å and 60 Å pore sizes, while in the 20 Å model, the adsorption amount of CH4 slightly decreases as the pressures changes from 10 MPa to 15 MPa. Therefore, in the small pore size case, increasing the pressure of H2O contributes to the desorption of CH4 from the coal surface; however, this strategy does not apply to cases where the pore sizes are large.

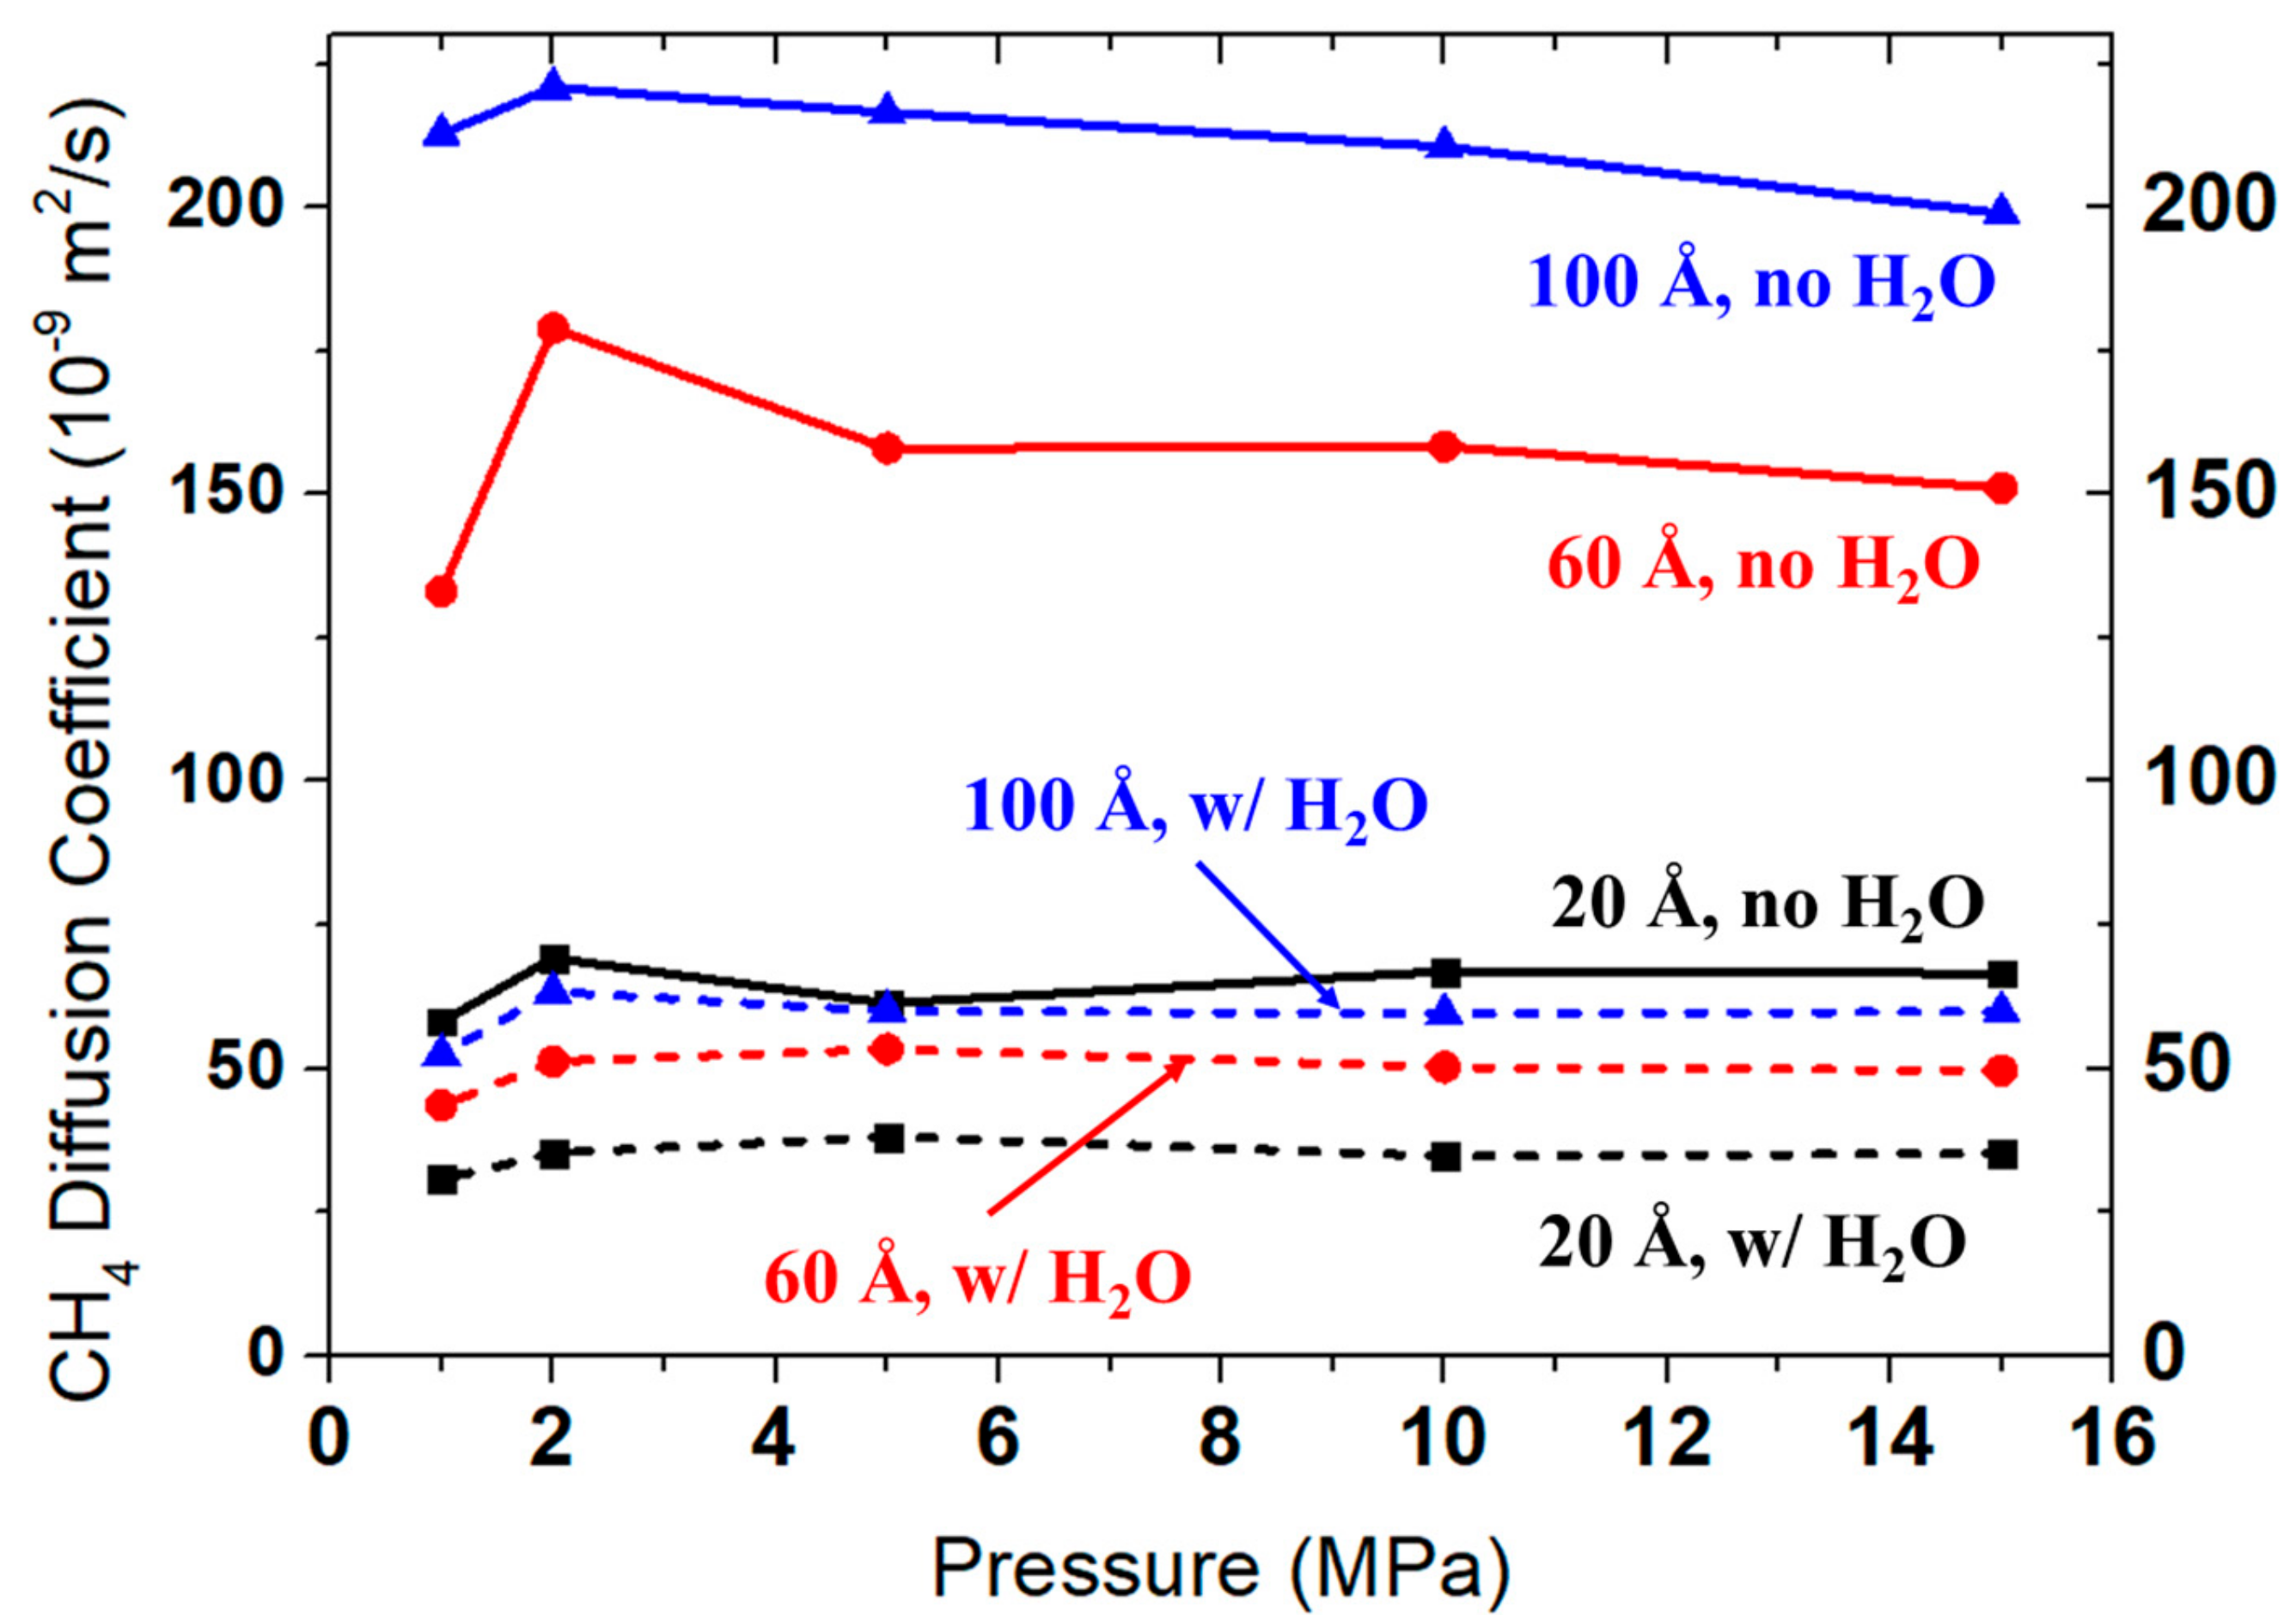
3.2.2. Diffusivity of CH4

MD simulations were performed to investigate the diffusivity of CH4 both in the presence and absence of water. The diffusion coefficients of CH4 under different pressures and in models with varying pore sizes are shown in Figure 5.
The most obvious observation from Figure 5 is that, with H2O present, the diffusion of CH4 is significantly impeded. If mixed with H2O, the diffusion coefficients of CH4 are reduced to only one fourth to one half compared with the cases when only CH4 is considered. The reason is that H2O molecules, which can form a hydrogen-bond network, can partially trap CH4 molecules to reduce their mobility. This effect, sometimes known as the WBE, can be observed in coalbed extraction processes [38]. Residual fracturing fluid can be present at the entrance of micropores in the coalbed and act like seals to prevent methane from leaving those pores.
The results also suggest that the pressure does not have a strong influence on the diffusivity of CH4, while the diffusion coefficient of CH4 is higher in larger pores. In small pores, such as in the 20 Å case, the rugged surface and small crevices within the pore may trap CH4 molecules and hinder the movement of CH4.

4. Conclusions

In this study, we used a combined DFT and molecular simulation approach to study the adsorption and diffusion of methane and water in coal. The results show that the most favorable adsorption sites for methane on coal molecules are aromatic planes. Although water can form hydrogen bonds with O or N atoms in coal, its adsorption energies on aromatic planes, which are the main adsorption sites for methane, are only slightly stronger than that of methane. There is also little mutual influence between water and methane on their separate adsorption energies if they are co-adsorption on the coal surface. These observations suggest water does not compete strongly with methane in the adsorption on coal molecular surfaces. Further MD studies indicate that the WBE on methane diffusion since the diffusivity of methane is significantly reduced when water is present. This study can provide insights into the fundamental reasons behind the WBE. Future works will be focused on the design and verification of strategies that can alleviate the WBE, including the screening of proper surfactants and the removal of water by creating pore negative pressures.

Author Contributions

Conceptualization, Y.Y. and W.L.; methodology, L.L.; software, W.L., C.C.; validation, L.L., M.L. and X.Z.; formal analysis, C.Y.; investigation, Y.W.; resources, B.F.; data curation, Y.Y.; writing—original draft preparation, L.L.; writing—review and editing, W.L.; visualization, C.Y.; supervision, Y.W.; project administration, Y.Y., W.L.; funding acquisition, Y.Y., L.L. and W.L.

Funding

This research was funded by National Science and Technology Major Project, China, grant number 2017ZX05064.

Acknowledgments

Computational resources were provided by the National Supercomputing Center in Shenzhen.

Conflicts of Interest

The authors declare no conflict of interest.

References

  1. Moore, T.A. Coalbed Methane: A Review. Int. J. Coal Geol. 2012, 101, 36–81. [Google Scholar] [CrossRef]
  2. Mastalerz, M. Chapter 7—Coal Bed Methane: Reserves, Production and Future Outlook. In Future Energy, 2nd ed.; Letcher, T.M., Ed.; Elsevier: Boston, MA, USA, 2014; pp. 145–158. [Google Scholar]
  3. Qin, Y.; Moore, T.A.; Shen, J.; Yang, Z.; Shen, Y.; Wang, G. Resources and Geology of Coalbed Methane in China: A Review. Int. Geol. Rev. 2018, 60, 777–812. [Google Scholar] [CrossRef]
  4. Su, X.; Wang, Q.; Lin, H.; Song, J.; Guo, H. A Combined Stimulation Technology for Coalbed Methane Wells: Part 1. Theory and Technology. Fuel 2018, 233, 592–603. [Google Scholar] [CrossRef]
  5. Qiu, N.-X.; Xue, Y.; Guo, Y.; Sun, W.-J.; Chu, W. Adsorption of Methane on Carbon Models of Coal Surface Studied by the Density Functional Theory Including Dispersion Correction (DFT-D3). Comput. Theor. Chem. 2012, 992, 37–47. [Google Scholar] [CrossRef]
  6. Yu, S.; Bo, J.; Fengjuan, L. Competitive Adsorption of CO2/N2/CH4 onto Coal Vitrinite Macromolecular: Effect of Electrostatic Interactions and Oxygen Functionalities. Fuel 2019, 235, 23–38. [Google Scholar] [CrossRef]
  7. Yutong, F.; Yu, S. CO2-Adsorption Promoted Ch4-Desorption onto Low-Rank Coal Vitrinite by Density Functional Theory Including Dispersion Correction (DFT-D3). Fuel 2018, 219, 259–269. [Google Scholar] [CrossRef]
  8. Xu, H.; Chu, W.; Huang, X.; Sun, W.; Jiang, C.; Liu, Z. CO2 Adsorption-Assisted CH4 Desorption on Carbon Models of Coal Surface: A DFT Study. Appl. Surf. Sci. 2016, 375, 196–206. [Google Scholar] [CrossRef]
  9. Liu, X.-Q.; Xue, Y.; Tian, Z.-Y.; Mo, J.-J.; Qiu, N.-X.; Chu, W.; Xie, H.-P. Adsorption of CH4 on Nitrogen- and Boron-Containing Carbon Models of Coal Predicted by Density-Functional Theory. Appl. Surf. Sci. 2013, 285, 190–197. [Google Scholar] [CrossRef]
  10. Pini, R.; Ottiger, S.; Storti, G.; Mazzotti, M. Prediction of Competitive Adsorption on Coal by a Lattice DFT model. Adsorption 2010, 16, 37–46. [Google Scholar] [CrossRef]
  11. Yu, S.; Yan-ming, Z.; Wu, L. Macromolecule Simulation and CH4 Adsorption Mechanism of Coal Vitrinite. Appl. Surf. Sci. 2017, 396, 291–302. [Google Scholar] [CrossRef]
  12. Hu, H.; Du, L.; Xing, Y.; Li, X. Detailed Study on Self- and Multicomponent Diffusion of CO2-CH4 Gas Mixture in Coal by Molecular Simulation. Fuel 2017, 187, 220–228. [Google Scholar] [CrossRef]
  13. Zhou, W.; Wang, H.; Zhang, Z.; Chen, H.; Liu, X. Molecular Simulation of CO2/CH4/H2O Competitive Adsorption and Diffusion in Brown Coal. RSC Adv. 2019, 9, 3004–3011. [Google Scholar] [CrossRef]
  14. Dang, Y.; Zhao, L.; Lu, X.; Xu, J.; Sang, P.; Guo, S.; Zhu, H.; Guo, W. Molecular Simulation of CO2/CH4 Adsorption in Brown Coal: Effect of Oxygen-, Nitrogen-, and Sulfur-Containing Functional Groups. Appl. Surf. Sci. 2017, 423, 33–42. [Google Scholar] [CrossRef]
  15. Xiang, J.; Zeng, F.; Liang, H.; Li, B.; Song, X. Molecular Simulation of the CH4/CO2/H2O Adsorption onto the Molecular Structure of Coal. Sci. China Earth Sci. 2014, 57, 1749–1759. [Google Scholar] [CrossRef]
  16. Zhang, J.; Liu, K.; Clennell, M.B.; Dewhurst, D.N.; Pervukhina, M. Molecular Simulation of CO2–CH4 Competitive Adsorption and Induced Coal Swelling. Fuel 2015, 160, 309–317. [Google Scholar] [CrossRef]
  17. Huang, W.; Lei, M.; Qiu, Z.; Leong, Y.-K.; Zhong, H.; Zhang, S. Damage Mechanism and Protection Measures of a Coalbed Methane Reservoir in the Zhengzhuang Block. J. Nat. Gas Sci. Eng. 2015, 26, 683–694. [Google Scholar] [CrossRef]
  18. Su, X.; Wang, Q.; Song, J.; Chen, P.; Yao, S.; Hong, J.; Zhou, F. Experimental Study of Water Blocking Damage on Coal. J. Pet. Sci. Eng. 2017, 156, 654–661. [Google Scholar] [CrossRef]
  19. Ni, G.; Cheng, W.; Lin, B.; Zhai, C. Experimental Study on Removing Water Blocking Effect (WBE) from Two Aspects of the Pore Negative Pressure and Surfactants. J. Nat. Gas Sci. Eng. 2016, 31, 596–602. [Google Scholar] [CrossRef]
  20. Ni, G.; Li, Z.; Xie, H. The Mechanism and Relief Method of the Coal Seam Water Blocking Effect (WBE) Based on the Surfactants. Powder Technol. 2018, 323, 60–68. [Google Scholar] [CrossRef]
  21. Delley, B. Ground-State Enthalpies:  Evaluation of Electronic Structure Approaches with Emphasis on the Density Functional Method. J. Phys. Chem. A 2006, 110, 13632–13639. [Google Scholar] [CrossRef]
  22. Delley, B. Time Dependent Density Functional Theory with Dmol3. J. Phys. Condens. Matter 2010, 22, 384208. [Google Scholar] [CrossRef] [PubMed]
  23. Perdew, J.P.; Burke, K.; Ernzerhof, M. Generalized Gradient Approximation Made Simple. Phys. Rev. Lett. 1996, 77, 3865–3868. [Google Scholar] [CrossRef] [PubMed] [Green Version]
  24. Grimme, S.; Antony, J.; Ehrlich, S.; Krieg, H. A Consistent and Accurate Ab Initio Parametrization of Density Functional Dispersion Correction (DFT-D) for the 94 Elements H-Pu. J. Chem. Phys. 2010, 132, 154104. [Google Scholar] [CrossRef] [PubMed]
  25. Hammer, B.; Hansen, L.B.; Nørskov, J.K. Improved Adsorption Energetics within Density-Functional Theory Using Revised Perdew-Burke-Ernzerhof Functionals. Phys. Rev. B 1999, 59, 7413–7421. [Google Scholar] [CrossRef]
  26. Becke, A.D. A Multicenter Numerical Integration Scheme for Polyatomic Molecules. J. Chem. Phys. 1988, 88, 2547–2553. [Google Scholar] [CrossRef]
  27. Peverati, R.; Truhlar, D.G. M11-L: A Local Density Functional That Provides Improved Accuracy for Electronic Structure Calculations in Chemistry and Physics. J. Phys. Chem. Lett. 2012, 3, 117–124. [Google Scholar] [CrossRef]
  28. Tao, J.; Perdew, J.P.; Staroverov, V.N.; Scuseria, G.E. Climbing the Density Functional Ladder: Nonempirical Meta-Generalized Gradient Approximation Designed for Molecules and Solids. Phys. Rev. Lett. 2003, 91, 146401. [Google Scholar] [CrossRef] [PubMed]
  29. Jonathan, P.; Mathews, A.L.C. The Molecular Representations of Coal—A Review. Fuel 2012, 96, 1–14. [Google Scholar]
  30. Given, P. Advances in organic geochemistry the Chemical Study of Coal Macerals. In The Chemical Study of Coal Macerals, Proceedings of the International Meeting in Milan, Milan, Italy, 8–11 September 2019; Hobson, G.D., Speers, G.C., Eds.; Macmillan: New York, NY, USA, 1962; pp. 39–48. [Google Scholar]
  31. Given, P. The Distribution of Hydrogen in Coals. Fuel 1960, 39, 147–153. [Google Scholar]
  32. Fuchs, W.; Sandhoff, A.G. Theory of Coal Pyrolysis. Ind. Eng. Chem. 1942, 34, 567–571. [Google Scholar] [CrossRef]
  33. Sun, H. Compass:  An Ab Initio Force-Field Optimized for Condensed-Phase Applications overview with Details on Alkane and Benzene Compounds. J. Phys. Chem. B 1998, 102, 7338–7364. [Google Scholar] [CrossRef]
  34. Hoover, W. Canonical Dynamics: Equilibrium Phase-Space Distributions. Phys. Rev. A 1985, 31, 1695–1697. [Google Scholar] [CrossRef] [PubMed]
  35. Nie, B.; Wang, L.; Li, X.; Wang, C.; Li, L. Simulation of the Interaction of Methane, Carbon Dioxide and Coal. Int. J. Min. Sci. Technol. 2013, 23, 919–923. [Google Scholar] [CrossRef]
  36. Vidali, G.; Ihm, G.; Kim, H.-Y.; Cole, M.W. Potentials of Physical Adsorption. Surf. Sci. Rep. 1991, 12, 135–181. [Google Scholar] [CrossRef]
  37. Li, K.; Li, H.; Yan, N.; Wang, T.; Zhao, Z. Adsorption and Dissociation of CH4 on Graphene: A Density Functional Theory Study. Appl. Surf. Sci. 2018, 459, 693–699. [Google Scholar] [CrossRef]
  38. Alfarge, D.K.; Wei, M.; Bai, B. Numerical simulation study of factors affecting relative permeability modification for water-shutoff treatments. Fuel 2017, 207, 226–239. [Google Scholar] [CrossRef]
  39. Jenness, G.R.; Karalti, O.; Jordan, K.D. Benchmark Calculations of Water–Acene Interaction Energies: Extrapolation to the Water–Graphene Limit and Assessment of Dispersion–Corrected Dft Methods. Phys. Chem. Chem. Phys. 2010, 12, 6375–6381. [Google Scholar] [CrossRef] [PubMed]
Figure 1. Molecular models for coal used in this study. (a) The Given type 1 (G1) model, (b) the Given type 2 (G2) model, and (c) the Fuchs-Sandoff (FS) model were used in the first-principles density-functional theory (DFT) calculations, while the large-cell model in (d) was used in molecular dynamics (MD) studies.
Applsci 09 03421 g001aApplsci 09 03421 g001b
Figure 2. Most stable adsorption geometries of (a) CH4 and (b) H2O on graphene.
Applsci 09 03421 g002
Figure 3. CH4 and H2O co-adsorption geometries and energies. Panel (ac) show different adsorption structures and energies of H2O with the presence of a CH4 molecule. Panel (df) show the adsorption structures and energies of CH4 with the presence of an H2O molecule. For each structure, a top view and a side view are given.
Applsci 09 03421 g003
Figure 4. Adsorption isotherms of (a) CH4 and (b) CH4 and H2O in the coalbed model. Blue, red, and black lines refer to the models with 100 Å, 60 Å, and 20 Å pore sizes, respectively. For convenience, the adsorption amounts are measured in units of both the number of molecules per cell and mmol/g (by assuming that the coal has a specific surface area of 50 m2/g). In (a), CH4 is the only adsorbate. In (b), both CH4 (solid lines) and H2O (dashed lines) with equal fugacity are adsorbed in the cell.
Applsci 09 03421 g004
Figure 5. Diffusion coefficients of CH4 in the coalbed models with varying pore sizes. Solid and dashed lines show the cases where CH4 alone or a mixture of CH4 and H2O is adsorbed in the cell, respectively. Blue, red, and black lines represent the results generated from models with 100 Å, 60 Å, and 20 Å pore sizes, respectively.
Applsci 09 03421 g005
Table 1. Binding energies and distances of CH4 and H2O on the graphene predicted by different DFT functionals and the COMPASS forcefield. For Perdew–Burke–Ernzerhof (PBE) and BLYP functionals, we also tested the effect if no dispersion corrections are considered. Binding energy Eads is defined as Eads = E (surface + adsorbate) − E(surface) − E(adsorbate). A more negative Eads value means stronger binding. For comparison, values from previous theoretical and experimental studies are also included. RPBE = revised PBE.
MethodCH4H2O
Eads (kJ/mol)Distance (Å)Eads (kJ/mol)Distance (Å)
PBE+DFT-D−24.903.22−31.633.03
PBE (no dispersion)−8.243.58−7.123.19
BLYP+DFT-D−29.243.19−28.263.03
BLYP (no dispersion)−0.634.60−12.543.30
RPBE−4.623.96−6.683.64
m11-L−29.472.87−29.483.10
revtpss−4.593.22−11.373.17
COMPASS forcefield−5.383.47−20.193.36
Literature (DFT)−31.8 [36]3.36 [36]−17.4 [37]3.25 [37]
Experimental−13.5 [38]3.03 [38]−19.0 [39]-
Table 2. CH4 adsorption structures and energies on different types of adsorption sites of coal. For each adsorption structure, the adsorption energy (in kJ/mol) and the name of the coal molecule (the codenames G1, G2, and FS refer to Given type 1, Given type 2, and FS, as shown in Figure 1a–c, respectively).
No.Adsorption SiteRepresentative Adsorption Structures and Energies
1Sandwiched by aromatic planes Applsci 09 03421 i001
−37.92 kJ/mol, G2
Applsci 09 03421 i002
−27.37 kJ/mol, G2
2Above polycyclic aromatic planes such as Applsci 09 03421 i003 or Applsci 09 03421 i004 Applsci 09 03421 i005
−24.06 kJ/mol, FS
Applsci 09 03421 i006
−22.05 kJ/mol, FS
Applsci 09 03421 i007
−21.44 kJ/mol, G2
3Above an aromatic ring Applsci 09 03421 i008
with or without substituents
Applsci 09 03421 i009
−19.77 kJ/mol, G1
Applsci 09 03421 i010
−18.97 kJ/mol, G1
Applsci 09 03421 i011
−17.46 kJ/mol, G2
4Beside O, N, and S atoms, for example Applsci 09 03421 i012, Applsci 09 03421 i013,
Applsci 09 03421 i014, and Applsci 09 03421 i015
Applsci 09 03421 i016
−16.28 kJ/mol, G1
Applsci 09 03421 i017
−14.36 kJ/mol, FS
Applsci 09 03421 i018
−13.26 kJ/mol, G1
5Beside alkane groups or chains, such as -CH3, -C2H5,
-C2H4,-,…
Applsci 09 03421 i019
−7.96 kJ/mol, G2
Applsci 09 03421 i020
−7.25 kJ/mol, G1
Applsci 09 03421 i021
−5.90 kJ/mol, G1
Table 3. H2O adsorption structures and energies on different types of adsorption sites of coal.
No.Adsorption SiteRepresentative Adsorption Structures and Energies
1Hydrogen bonding with Applsci 09 03421 i022 or Applsci 09 03421 i023 as proton donor Applsci 09 03421 i024
−54.33 kJ/mol, G2
Applsci 09 03421 i025
−48.48 kJ/mol, G1
Applsci 09 03421 i026
−46.06 kJ/mol, FS
2Sandwiched by aromatic planes Applsci 09 03421 i027
−41.30 kJ/mol, G2
Applsci 09 03421 i028
−33.87 kJ/mol, G2
3Hydrogen bonding with Applsci 09 03421 i029, Applsci 09 03421 i030 or Applsci 09 03421 i031 as proton donor or acceptor Applsci 09 03421 i032
−33.54 kJ/mol, FS
Applsci 09 03421 i033
−33.49 kJ/mol, G2
Applsci 09 03421 i034
−31.39 kJ/mol, G1
4Above monocyclic or polycyclic aromatic planes Applsci 09 03421 i035
−33.49 kJ/mol, G1
Applsci 09 03421 i036
−32.40 kJ/mol, FS
Applsci 09 03421 i037
−29.47 kJ/mol, G2
5Beside alkane groups or chains such as ‒CH3, ‒C2H5,
‒C2H4‒,…
Applsci 09 03421 i038
−9.38 kJ/mol, G2
Applsci 09 03421 i039
−9.19 kJ/mol, G1
Applsci 09 03421 i040
−8.04 kJ/mol, G1
The above observations were made based on the assumptions that an isolated CH4 or H2O molecule was adsorbed on the surface. In fact, both CH4 and H2O can be present on the surface at the same time. In the next section, we examine the co-adsorption of CH4 and H2O.

