Experimental and Numerical Investigation on Structural Performance of Steel Deck Plate Bolted with Truss Girder


Abstract
:1. Introduction
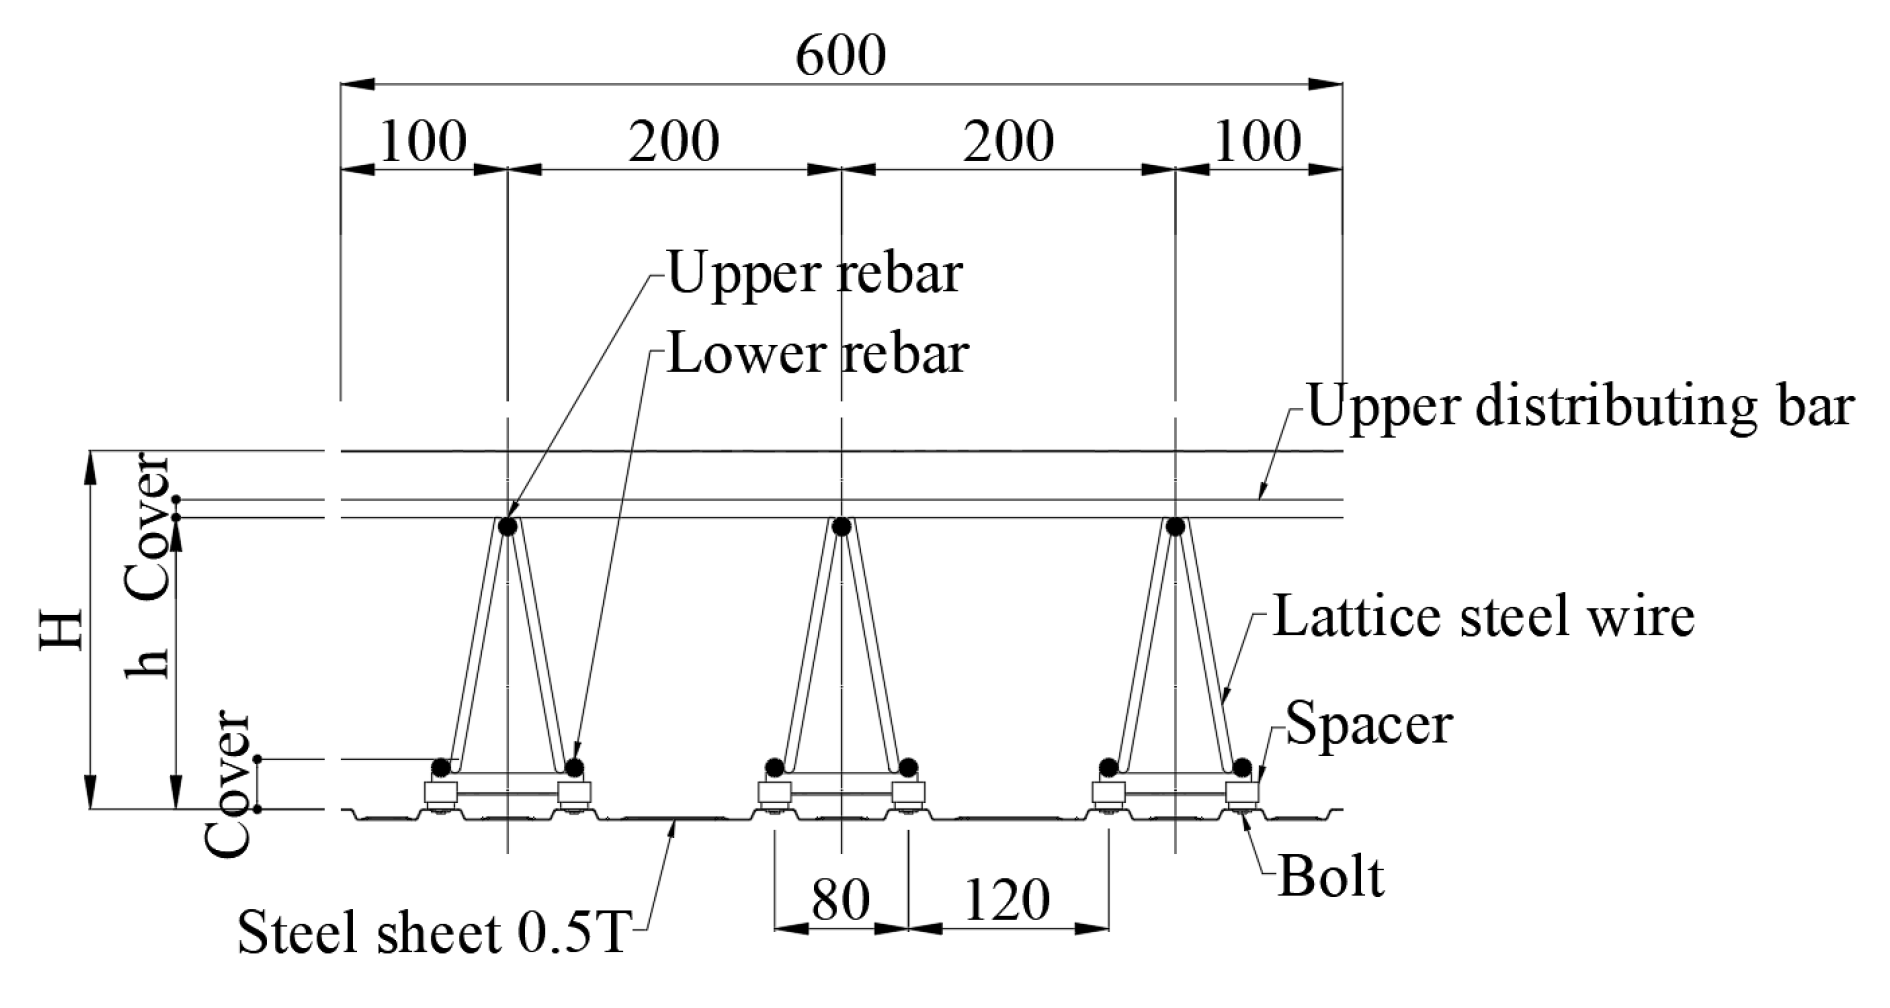
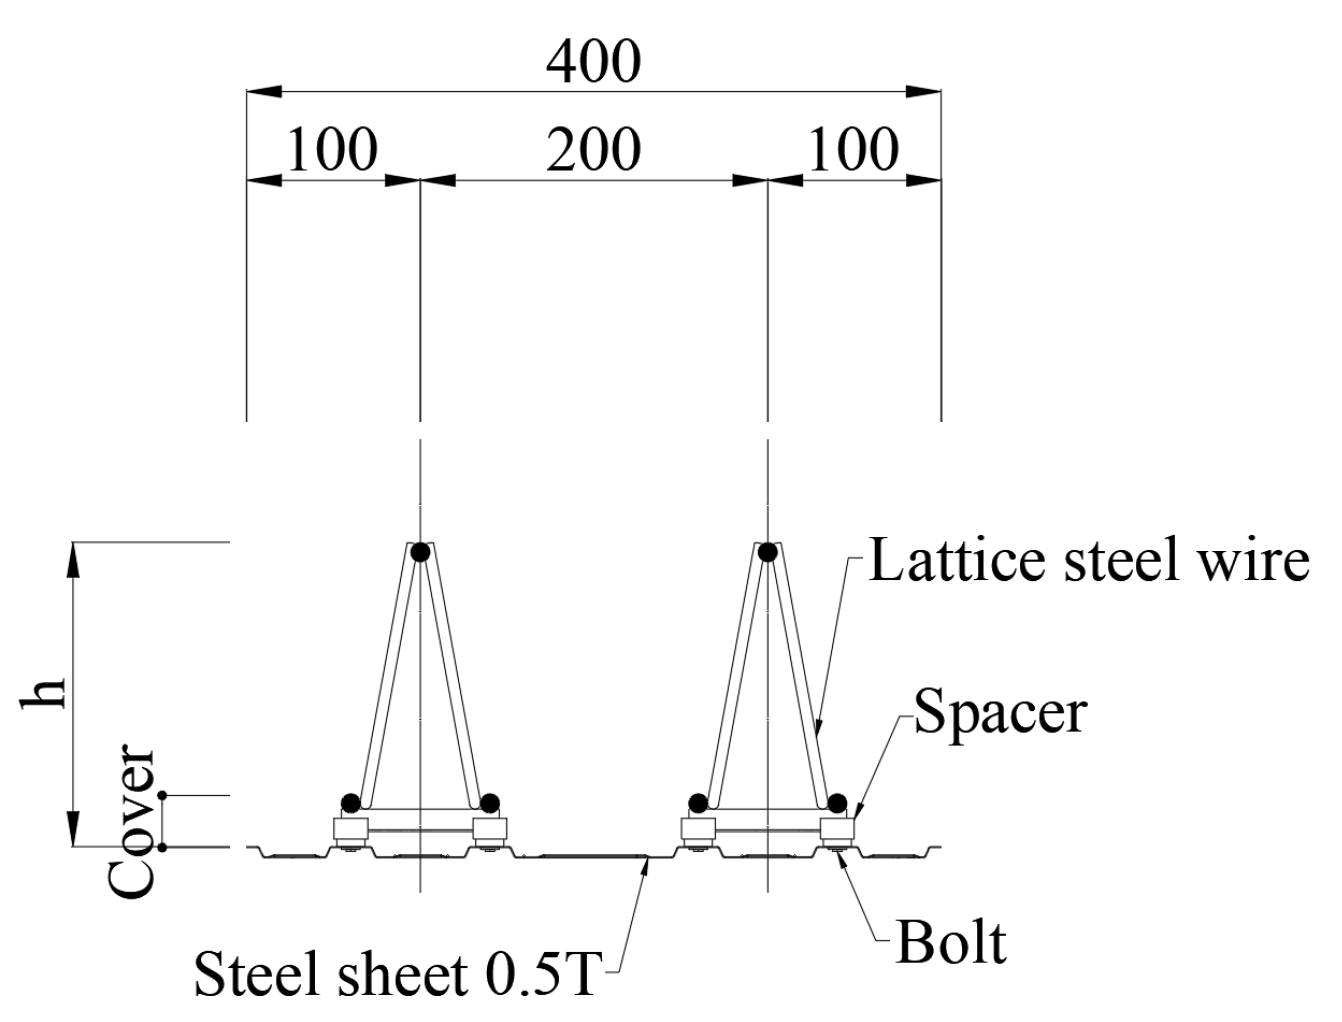
2. Deck Plate Bolted with Truss Girder
3. Test Preparation
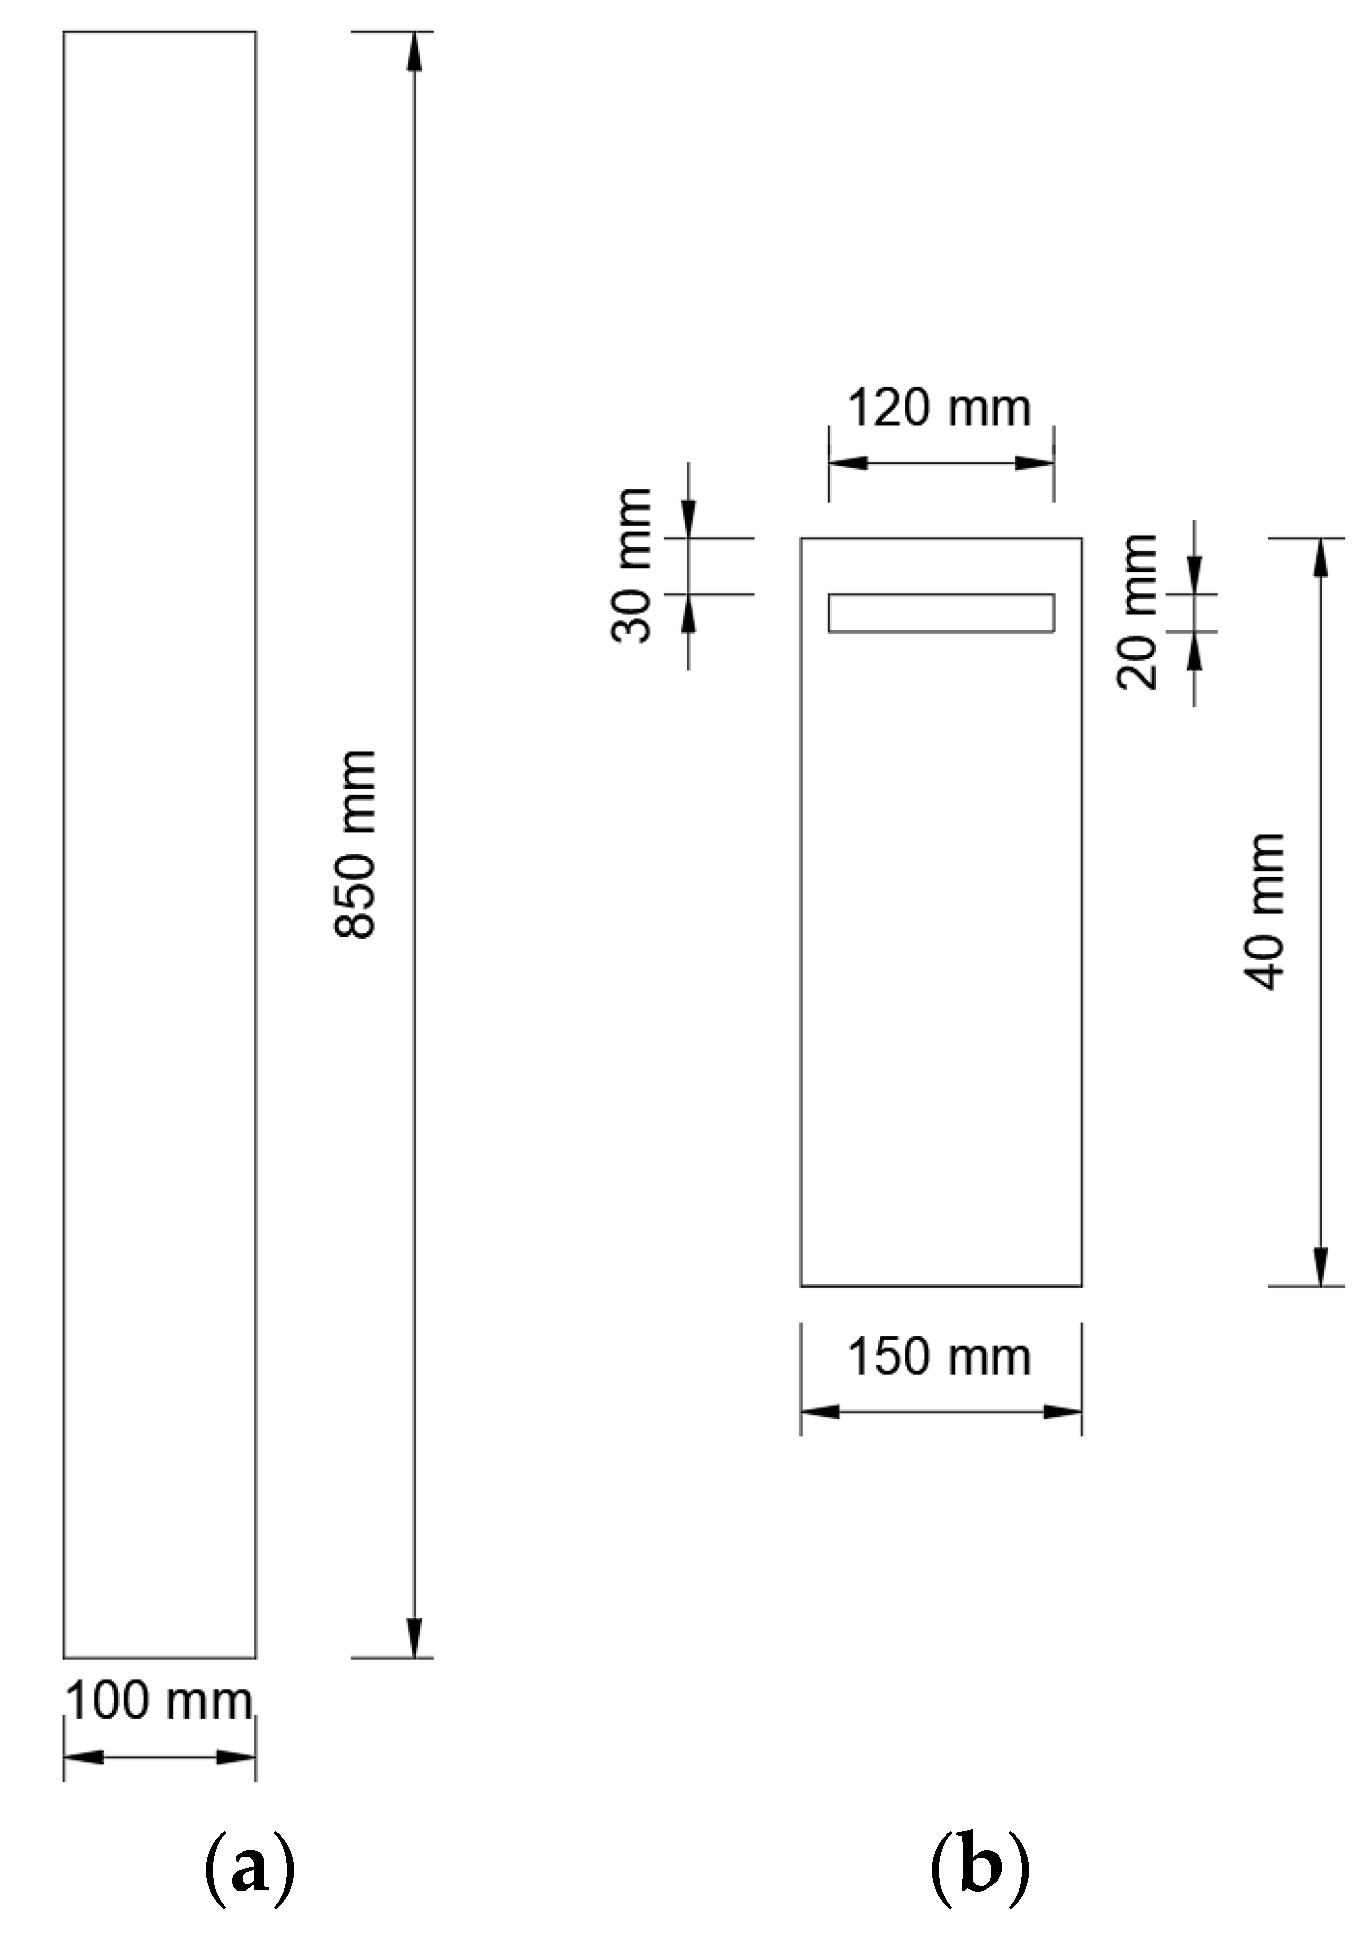
3.1. Specimen Design
3.2. Primary Design Parameter
3.3. Design Criteria
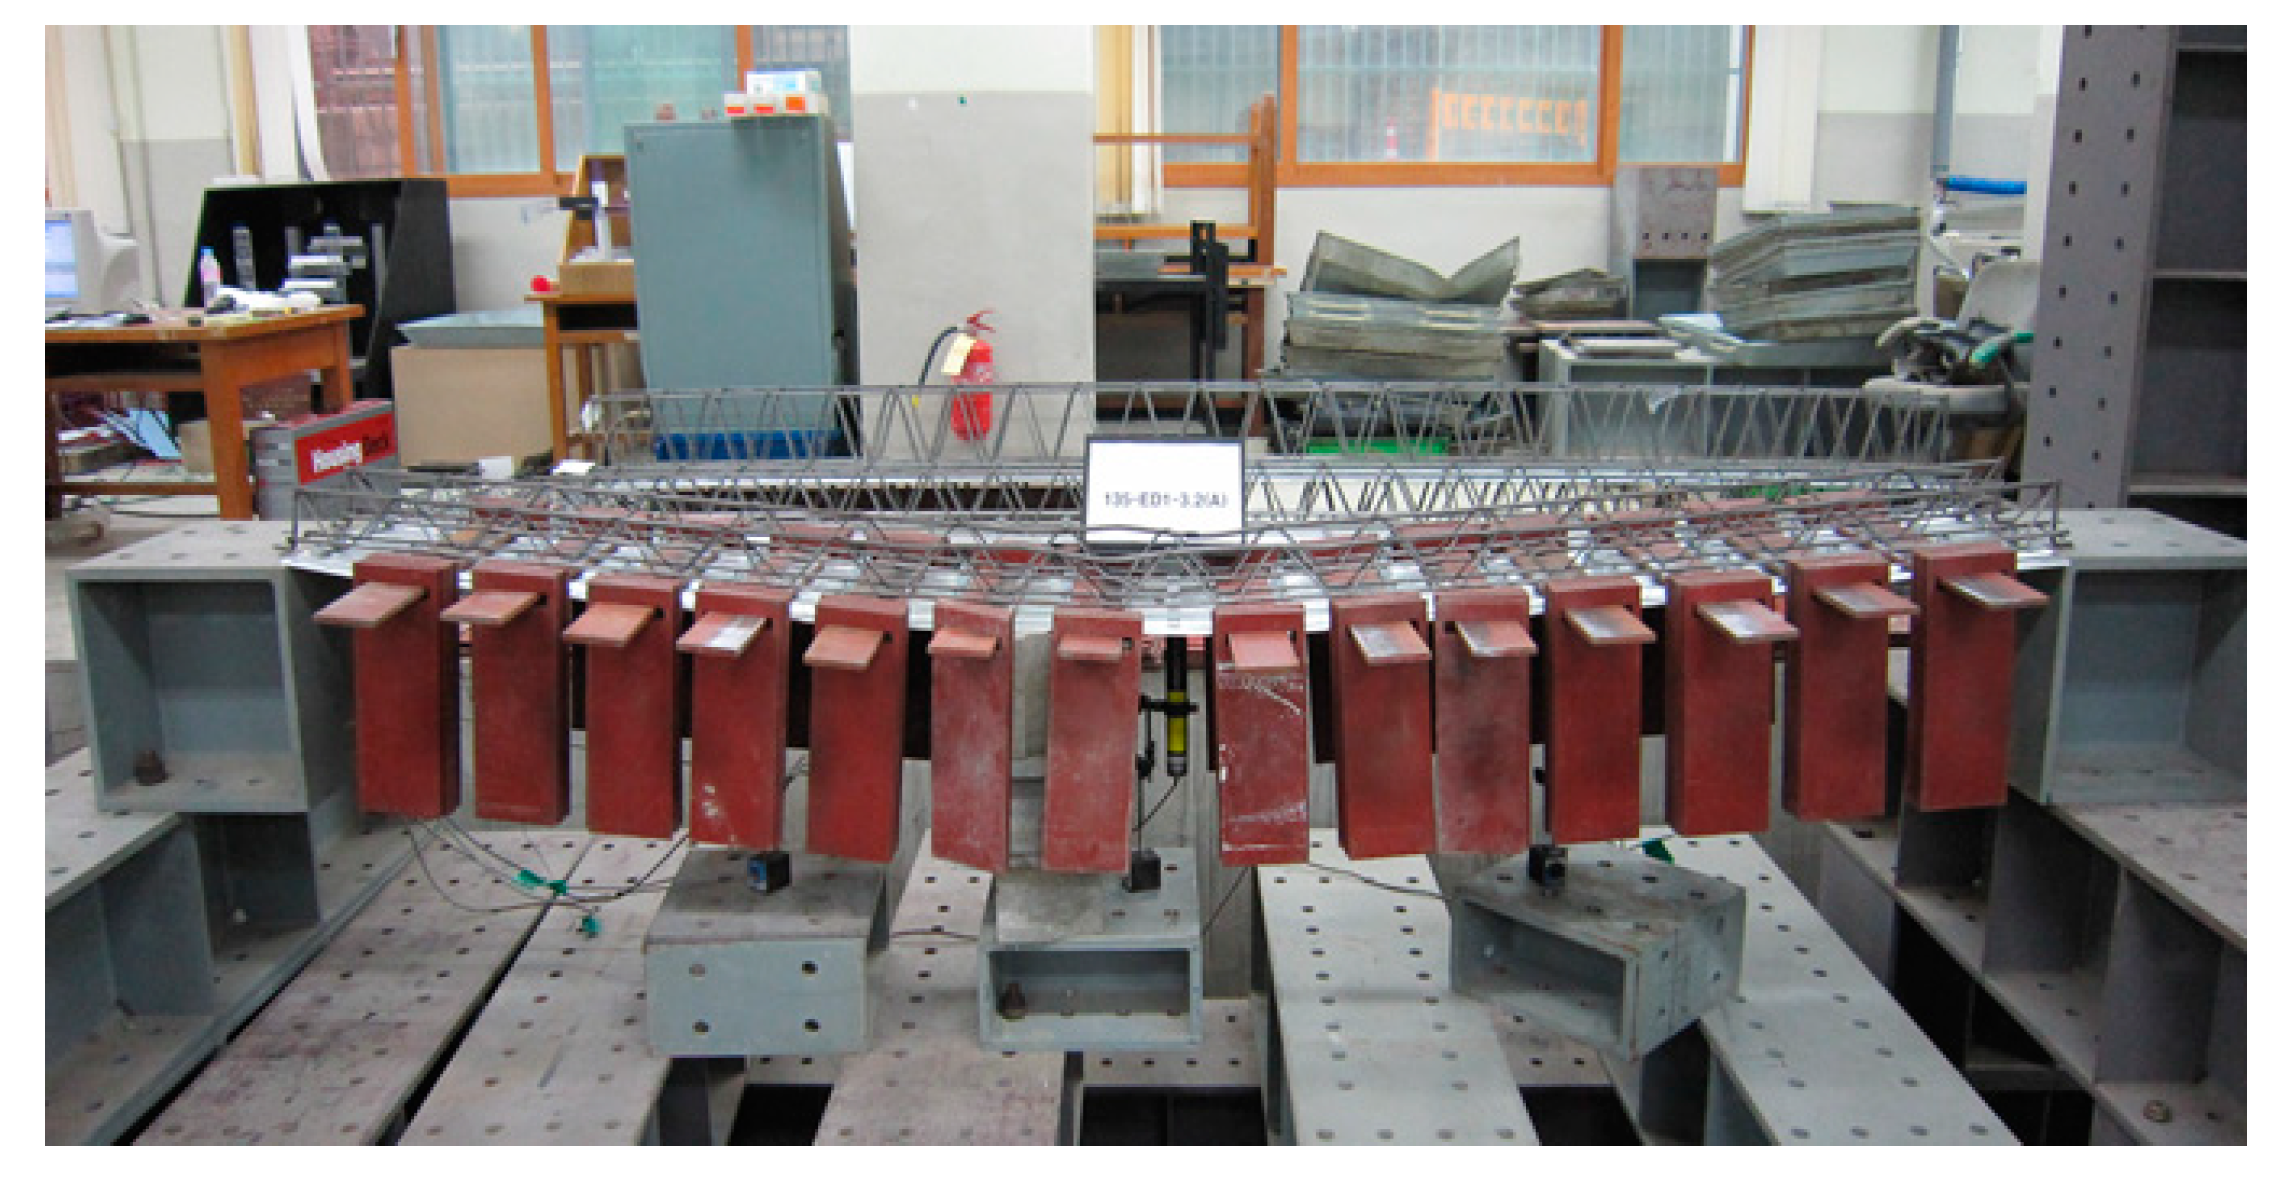
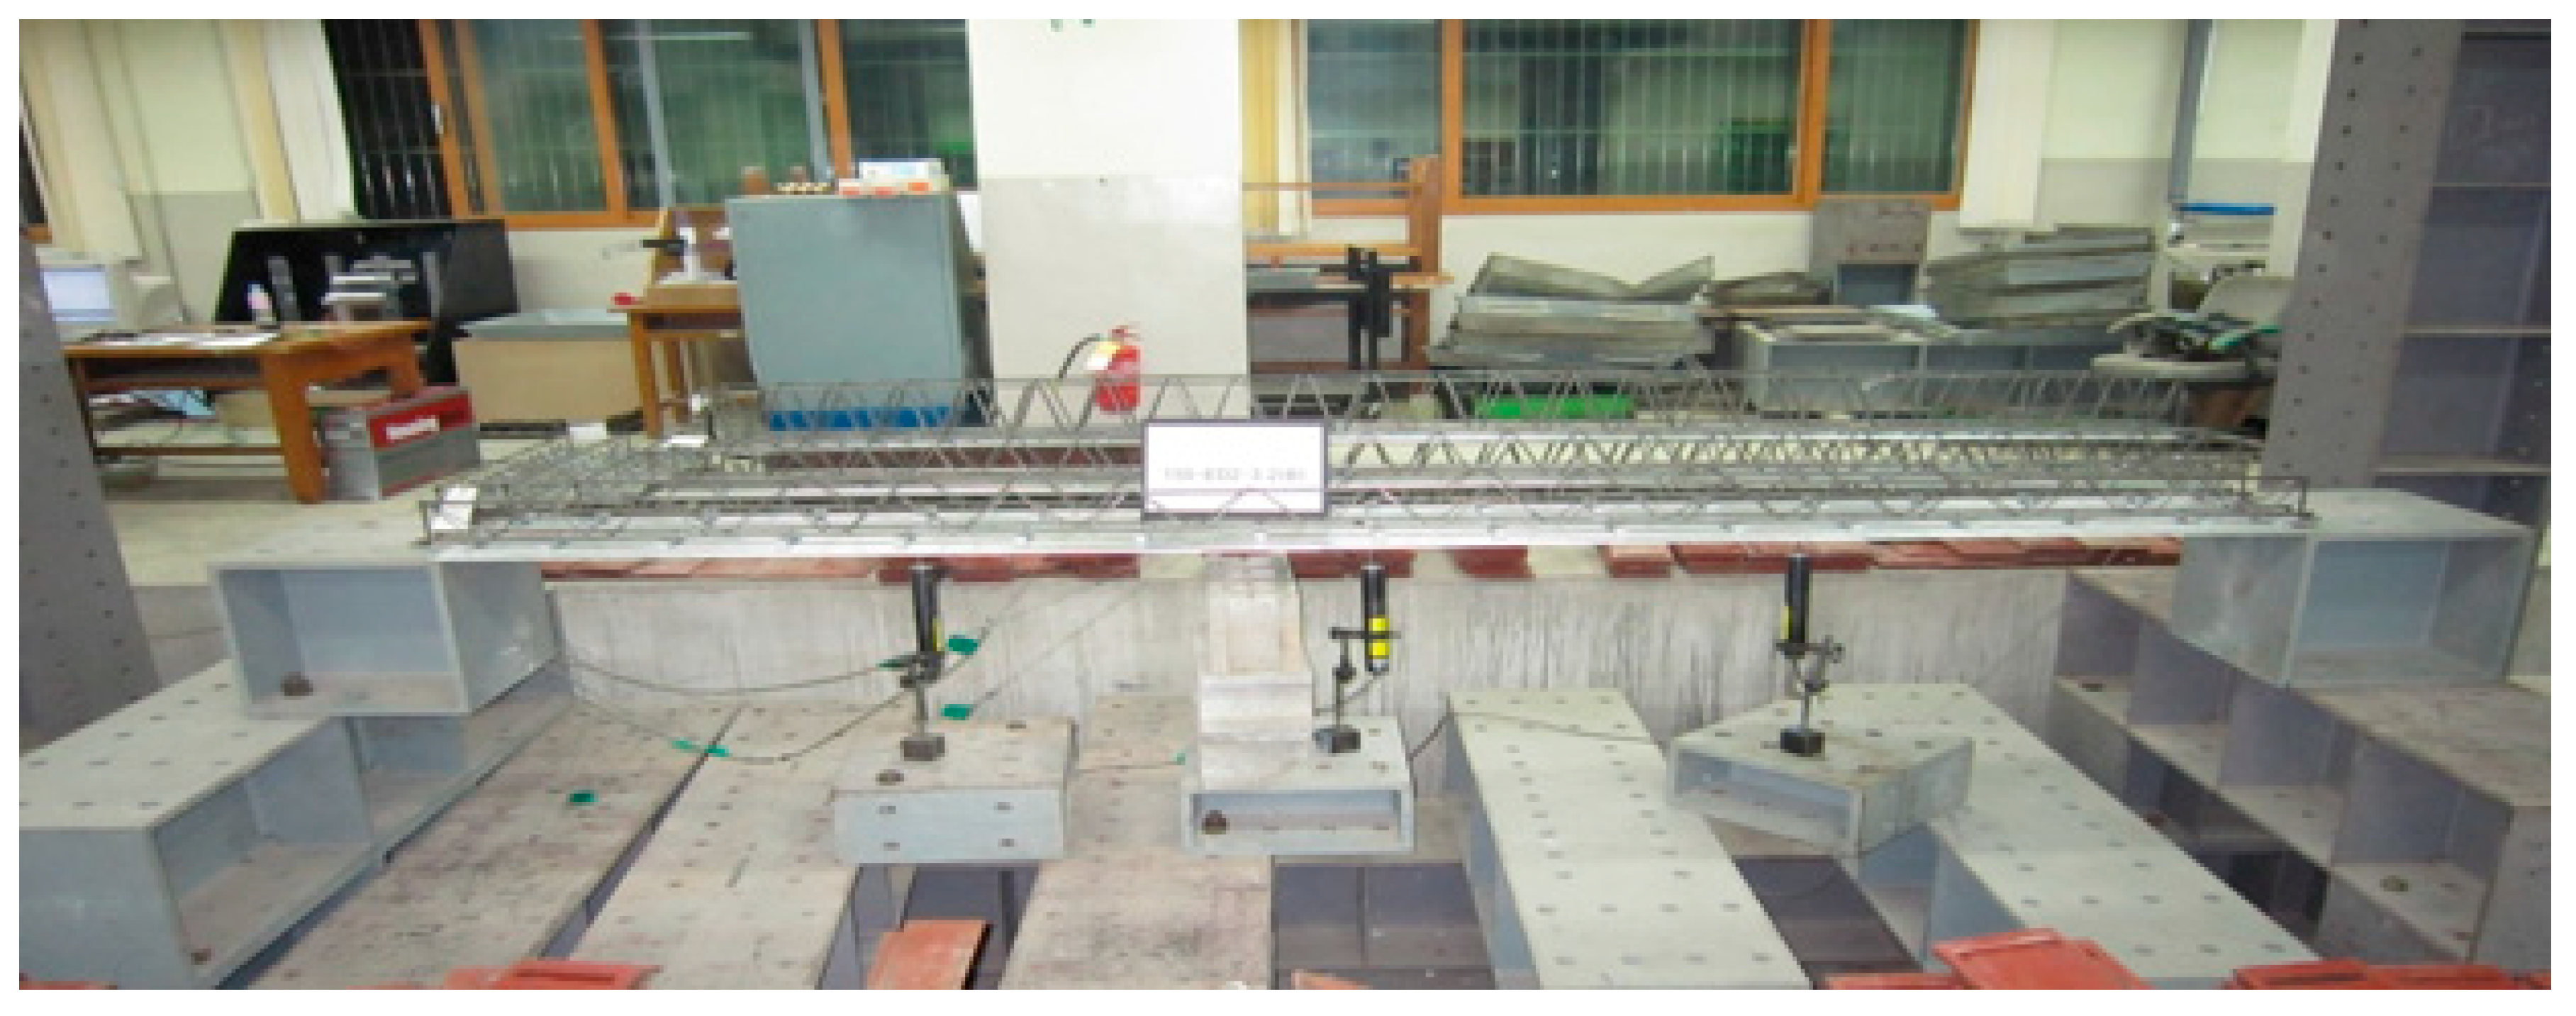
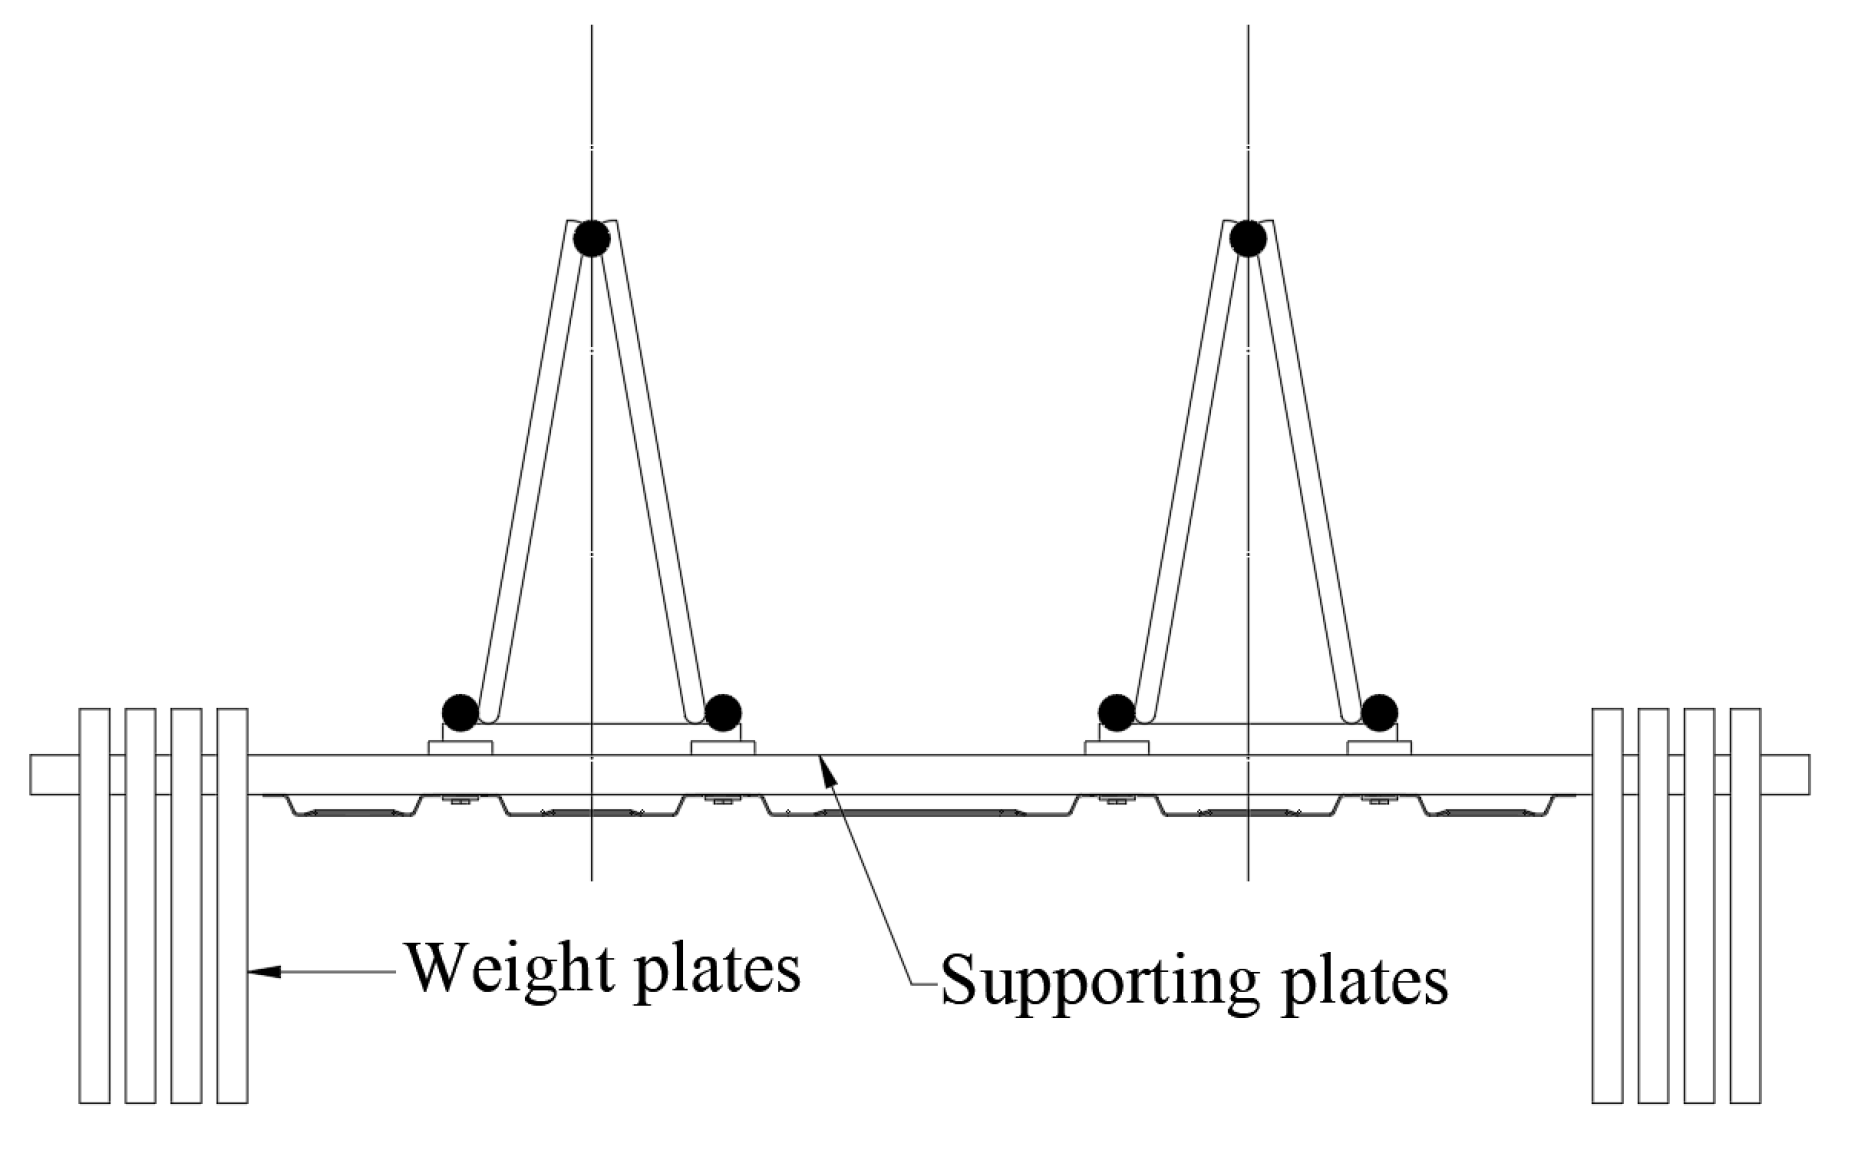
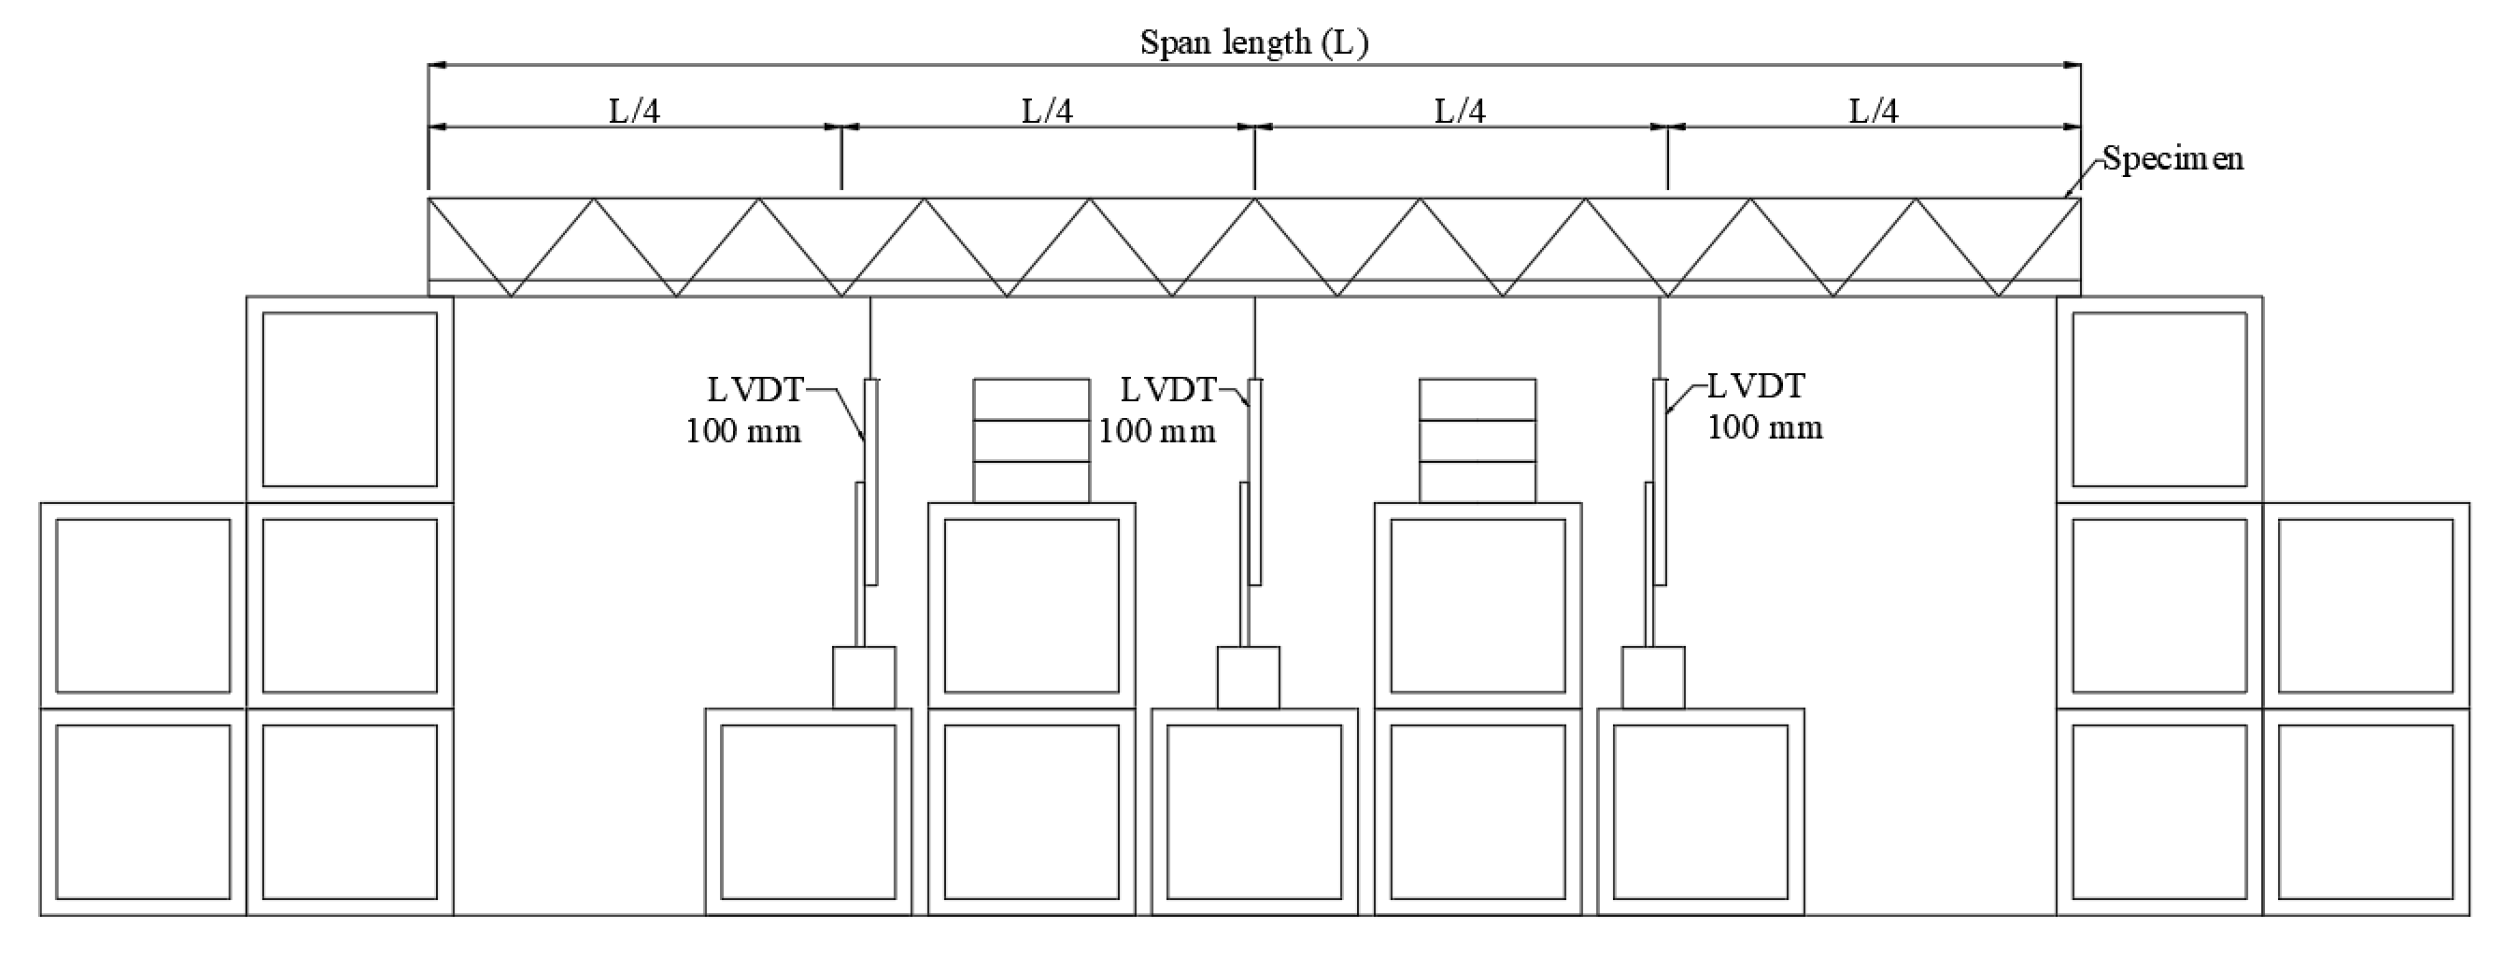
3.4. Loading and Boundary Conditions
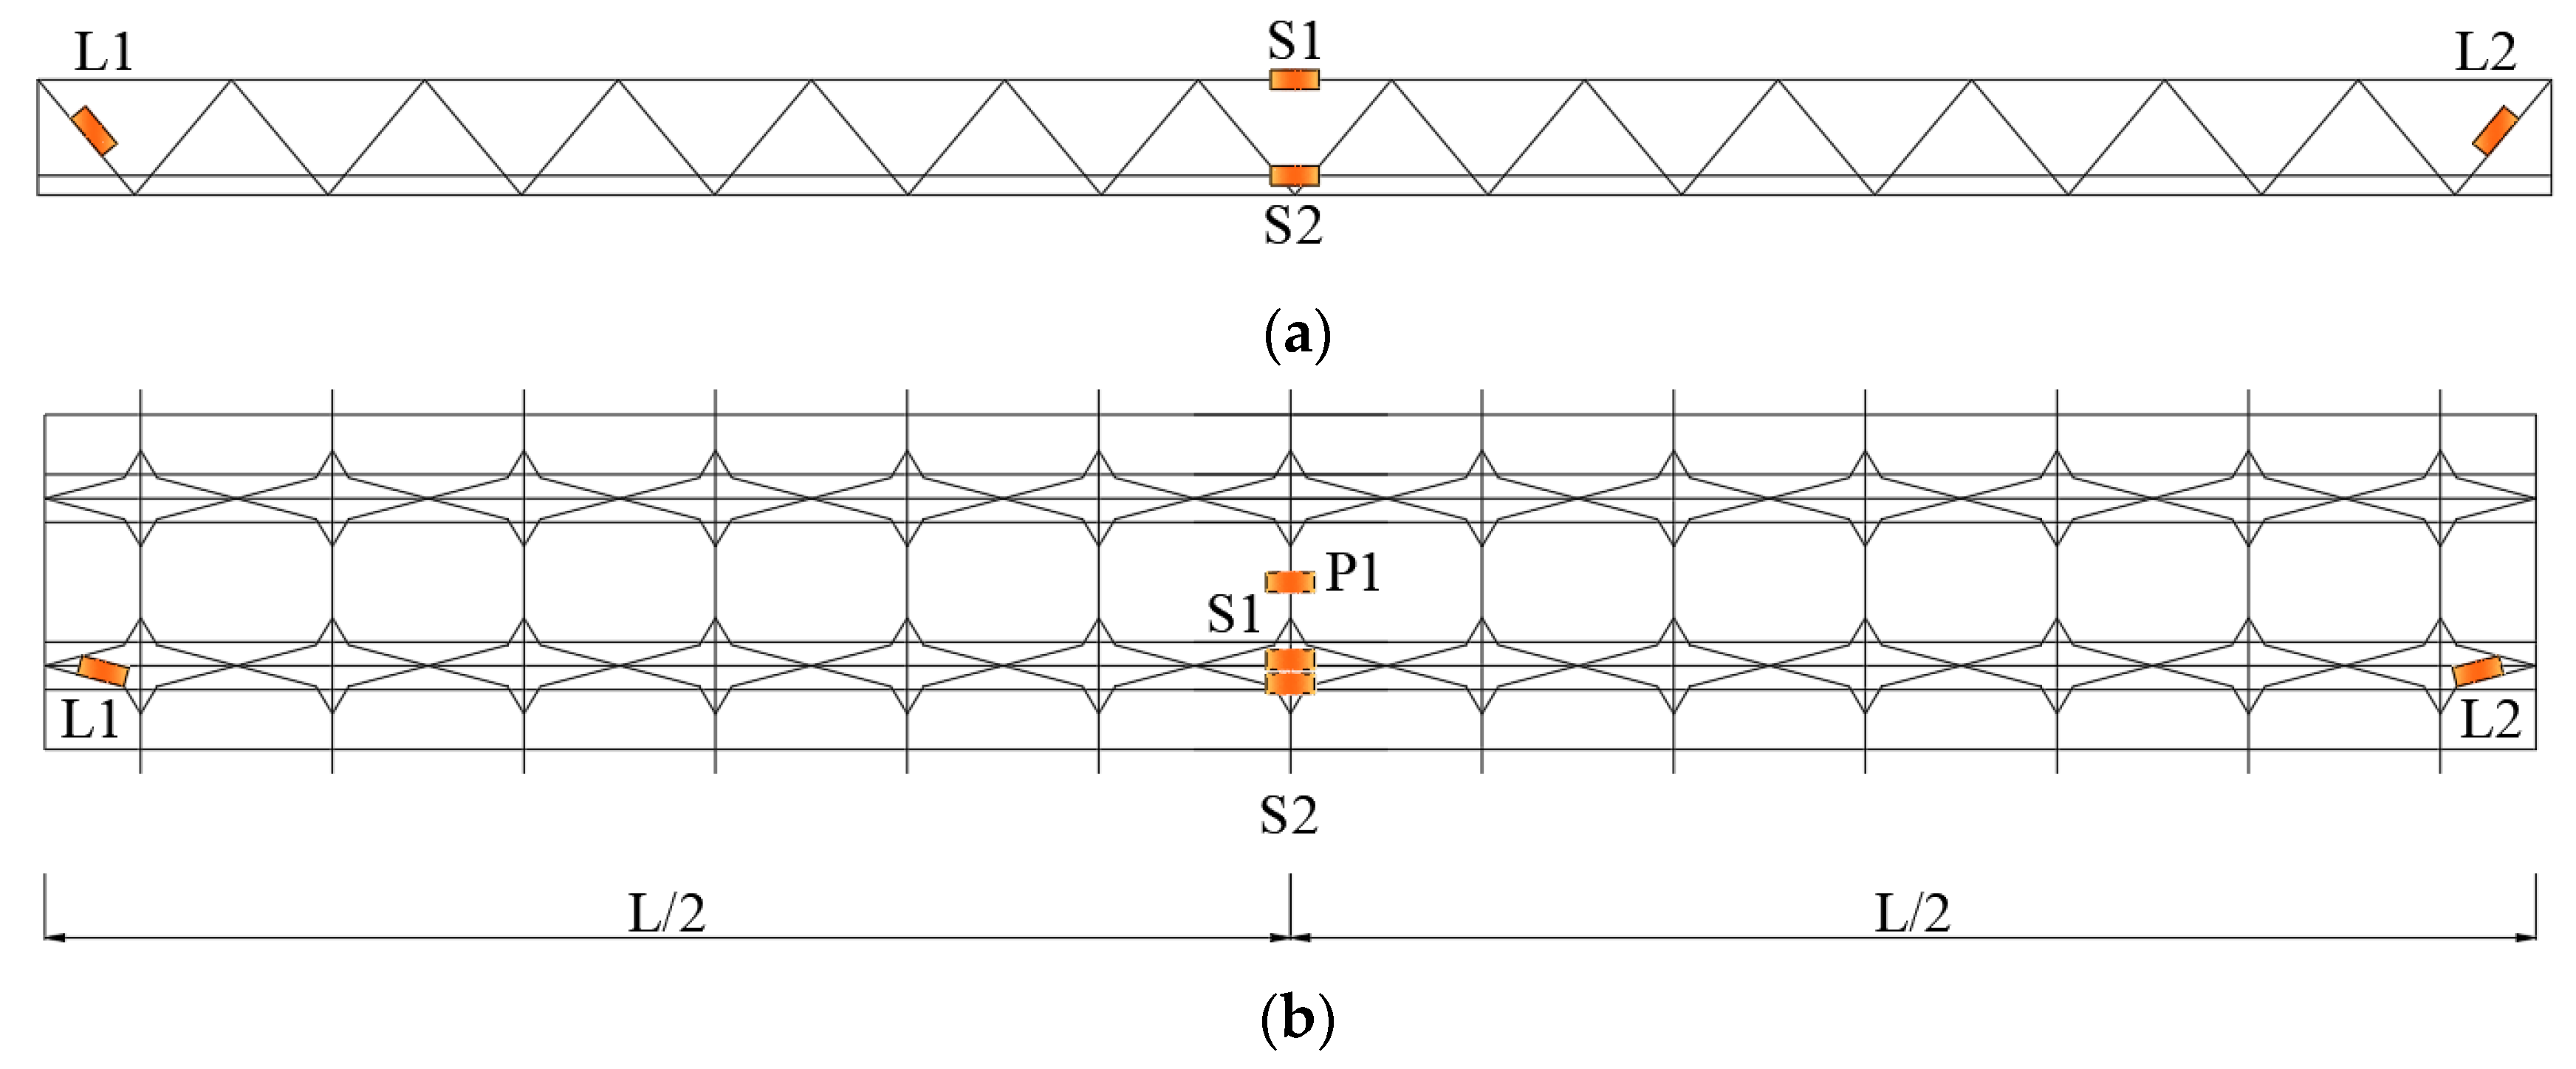
3.5. Deflection and Strain Measuring Plan
4. Test Results
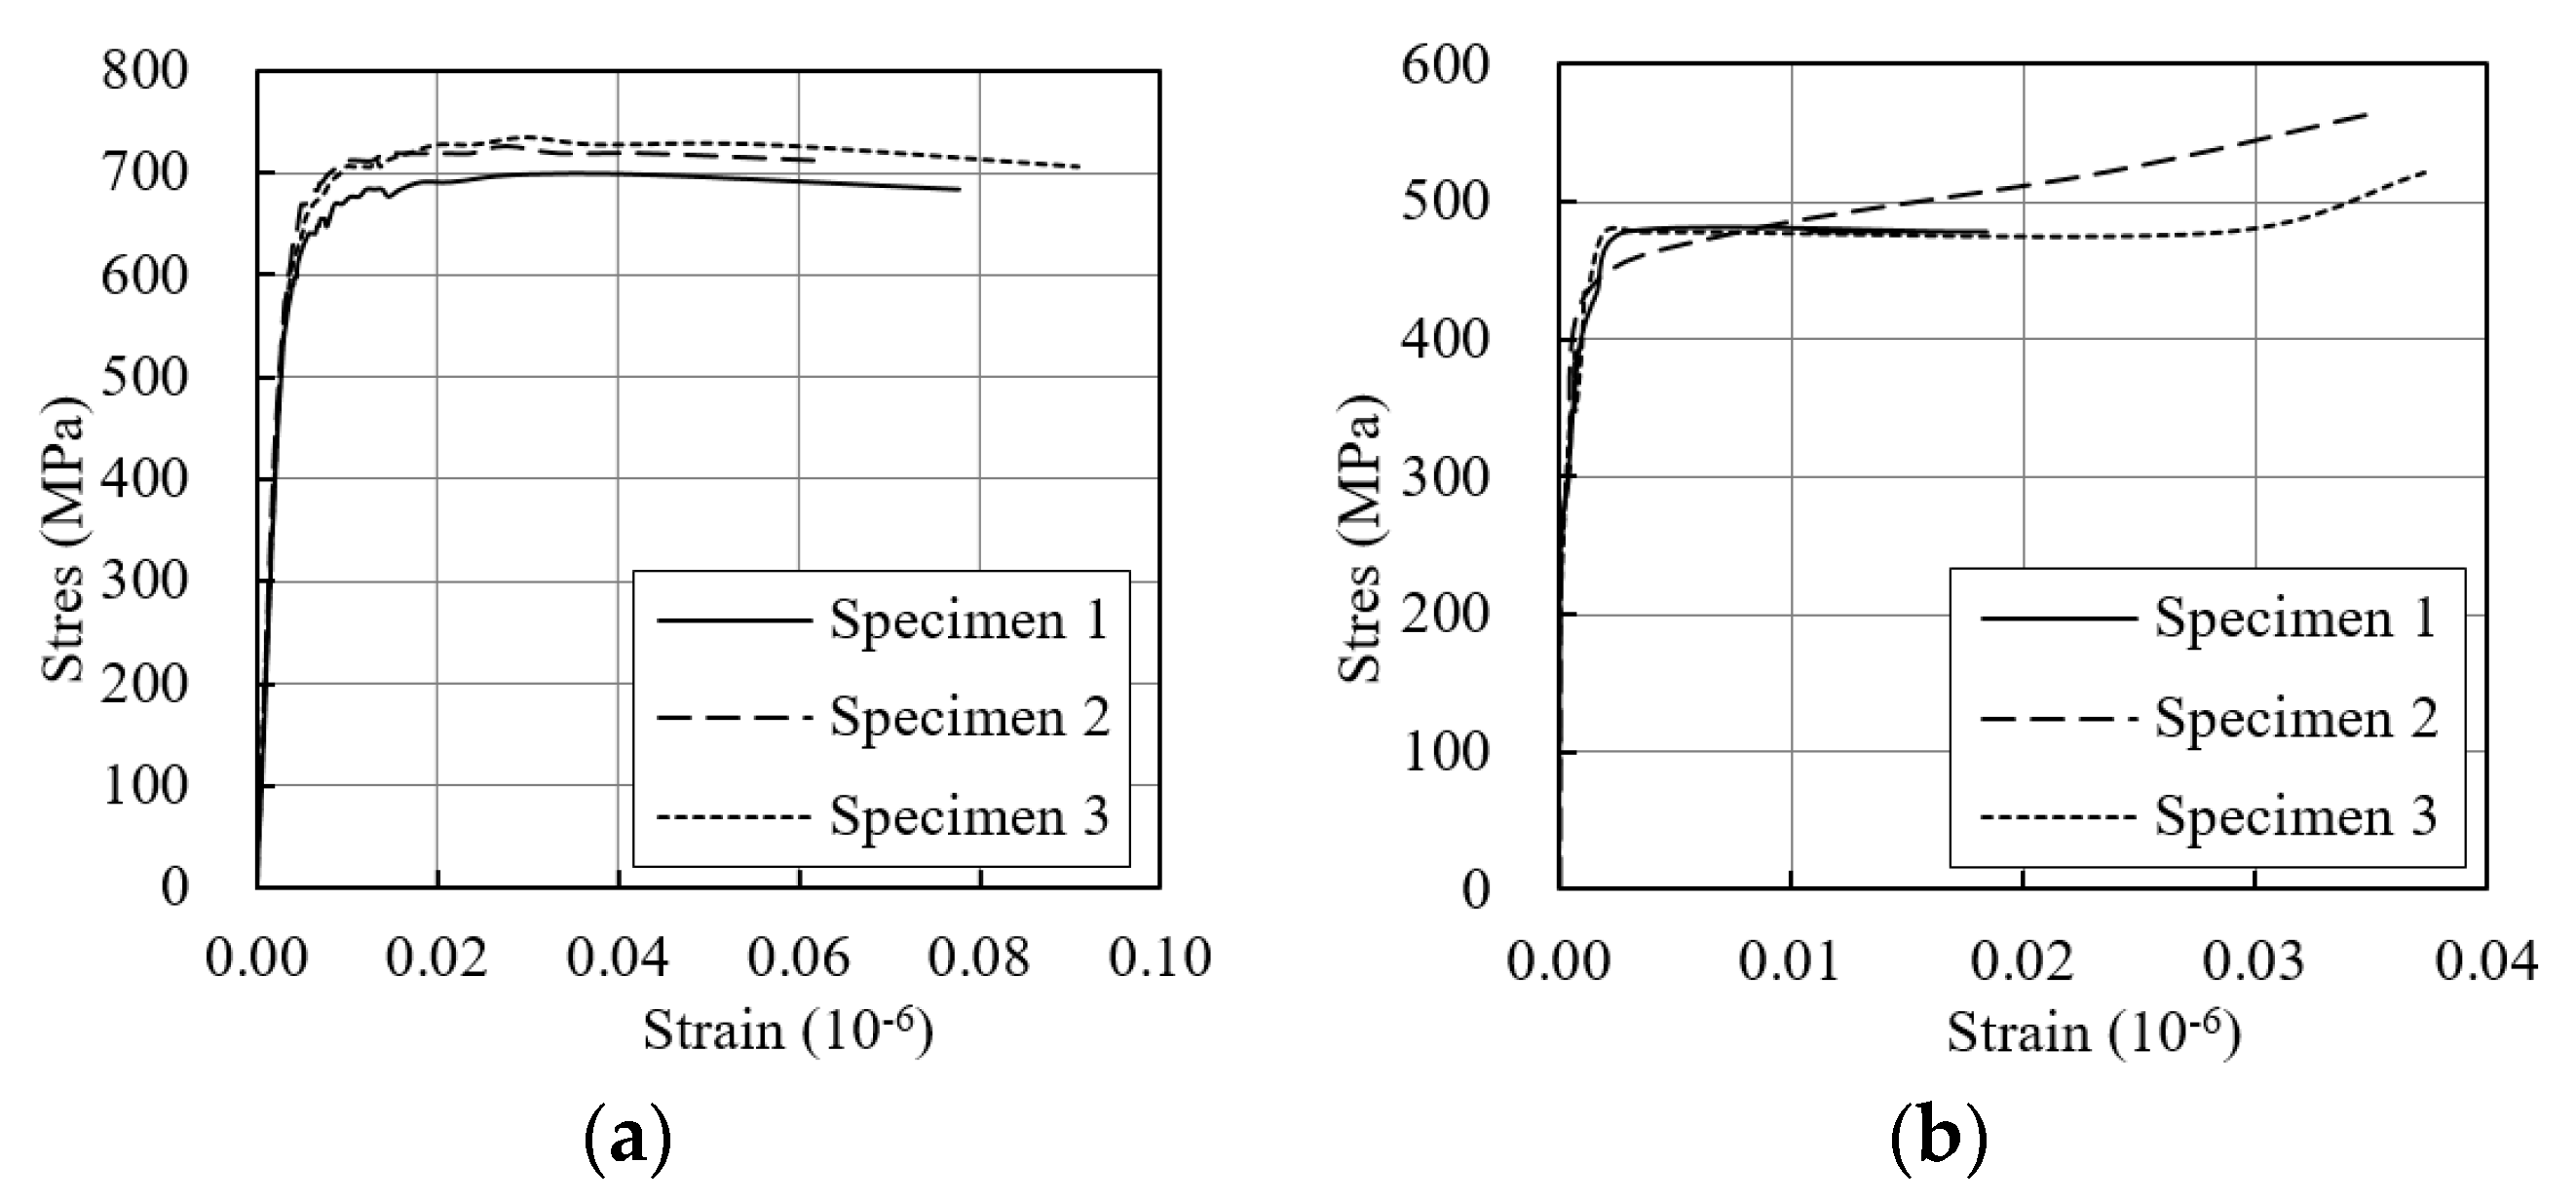
4.1. Material Tests
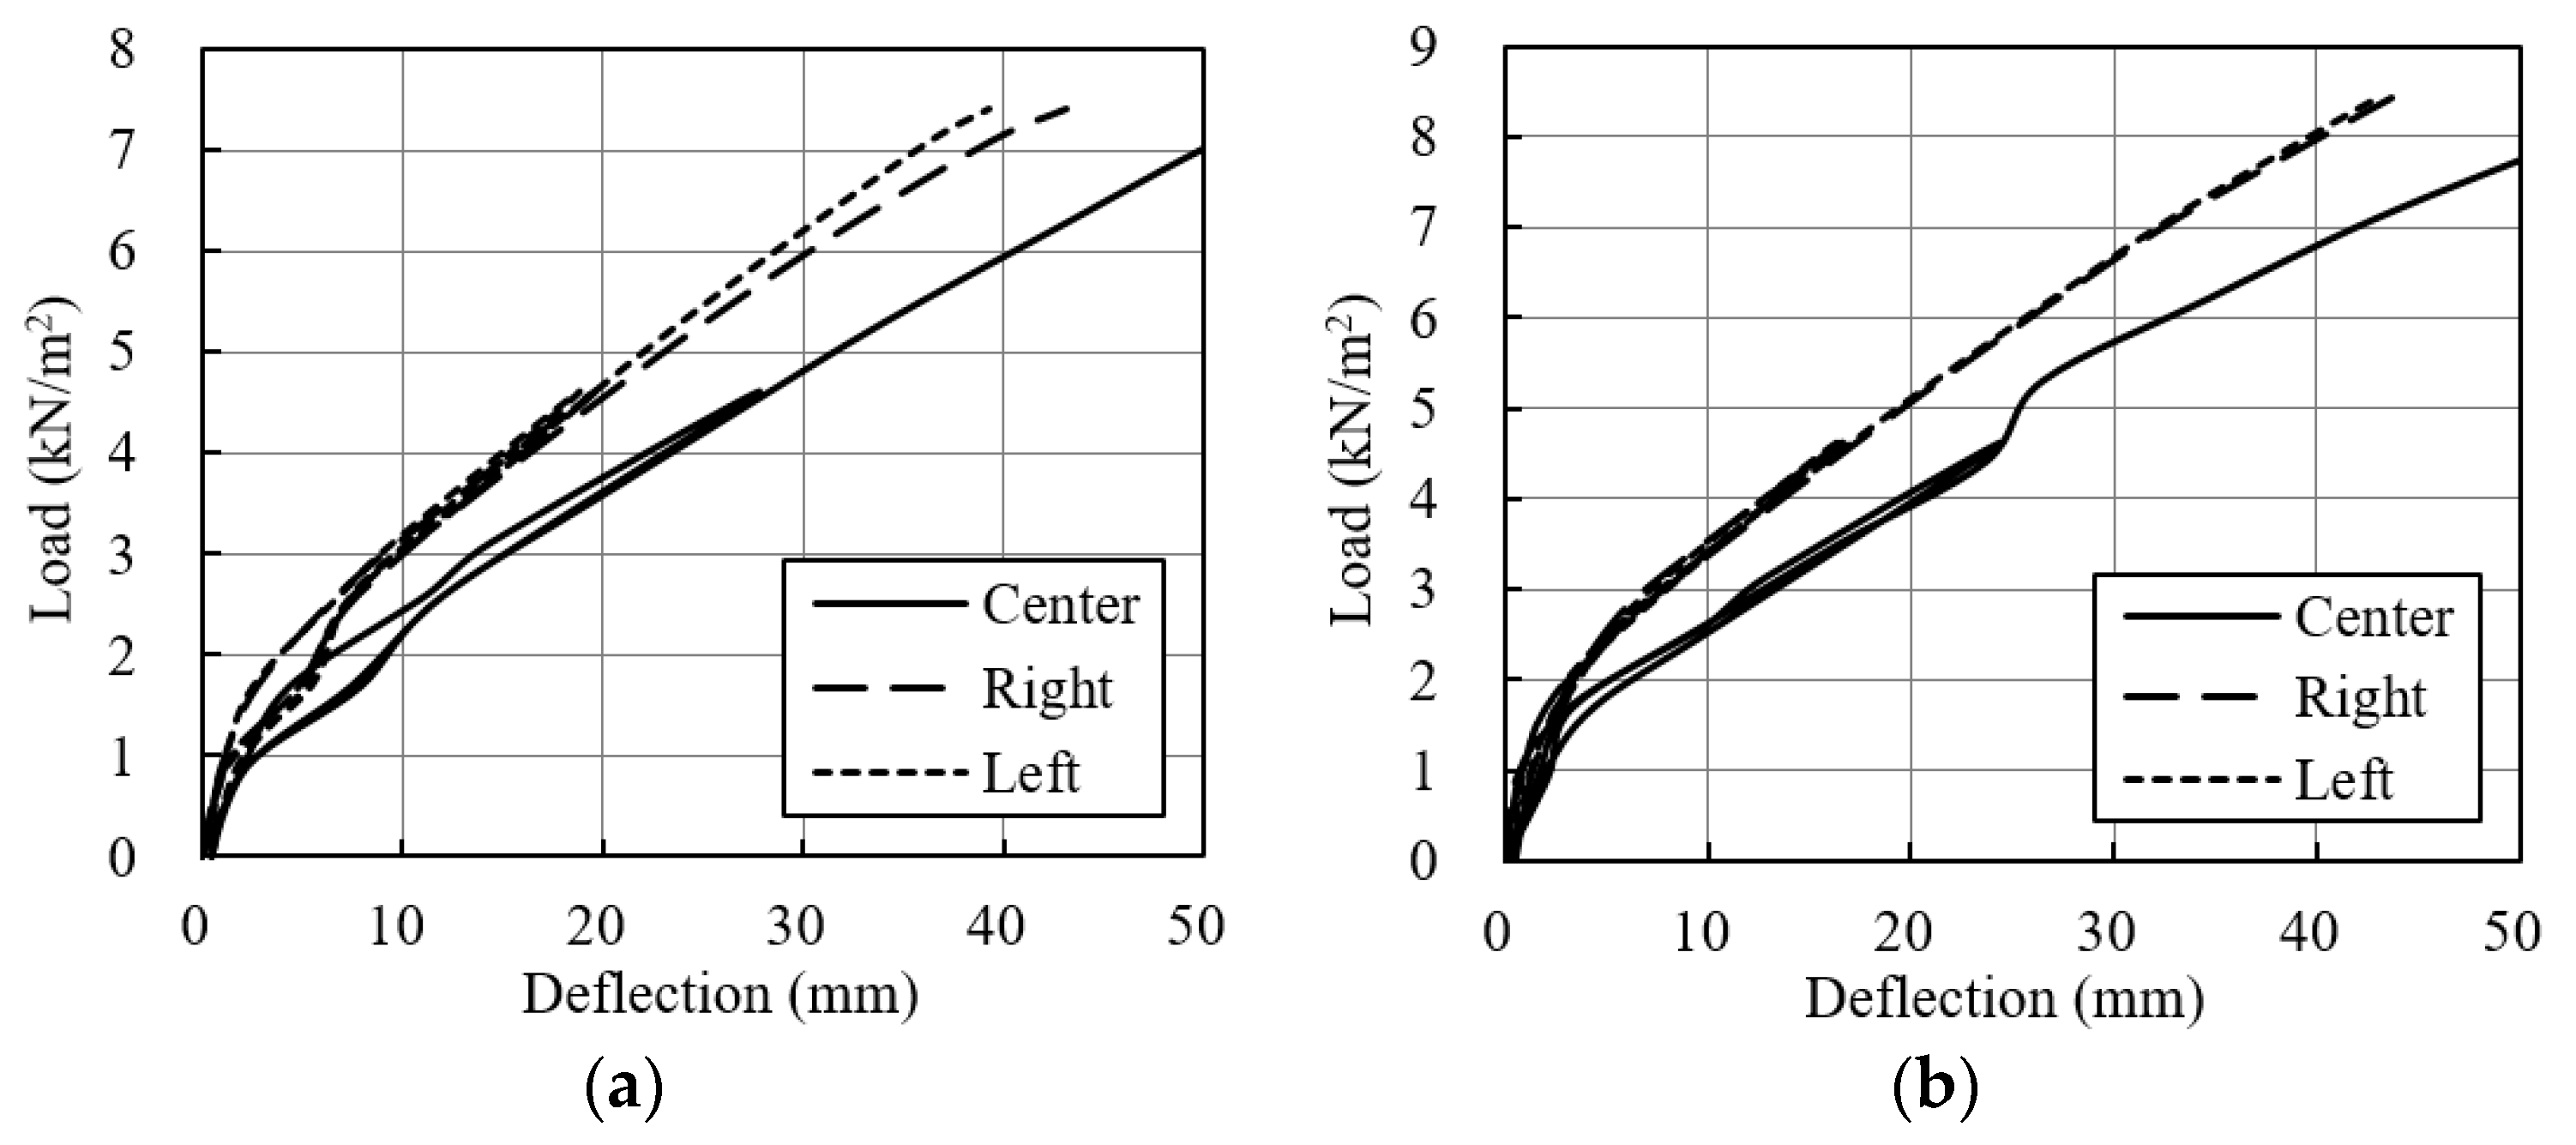
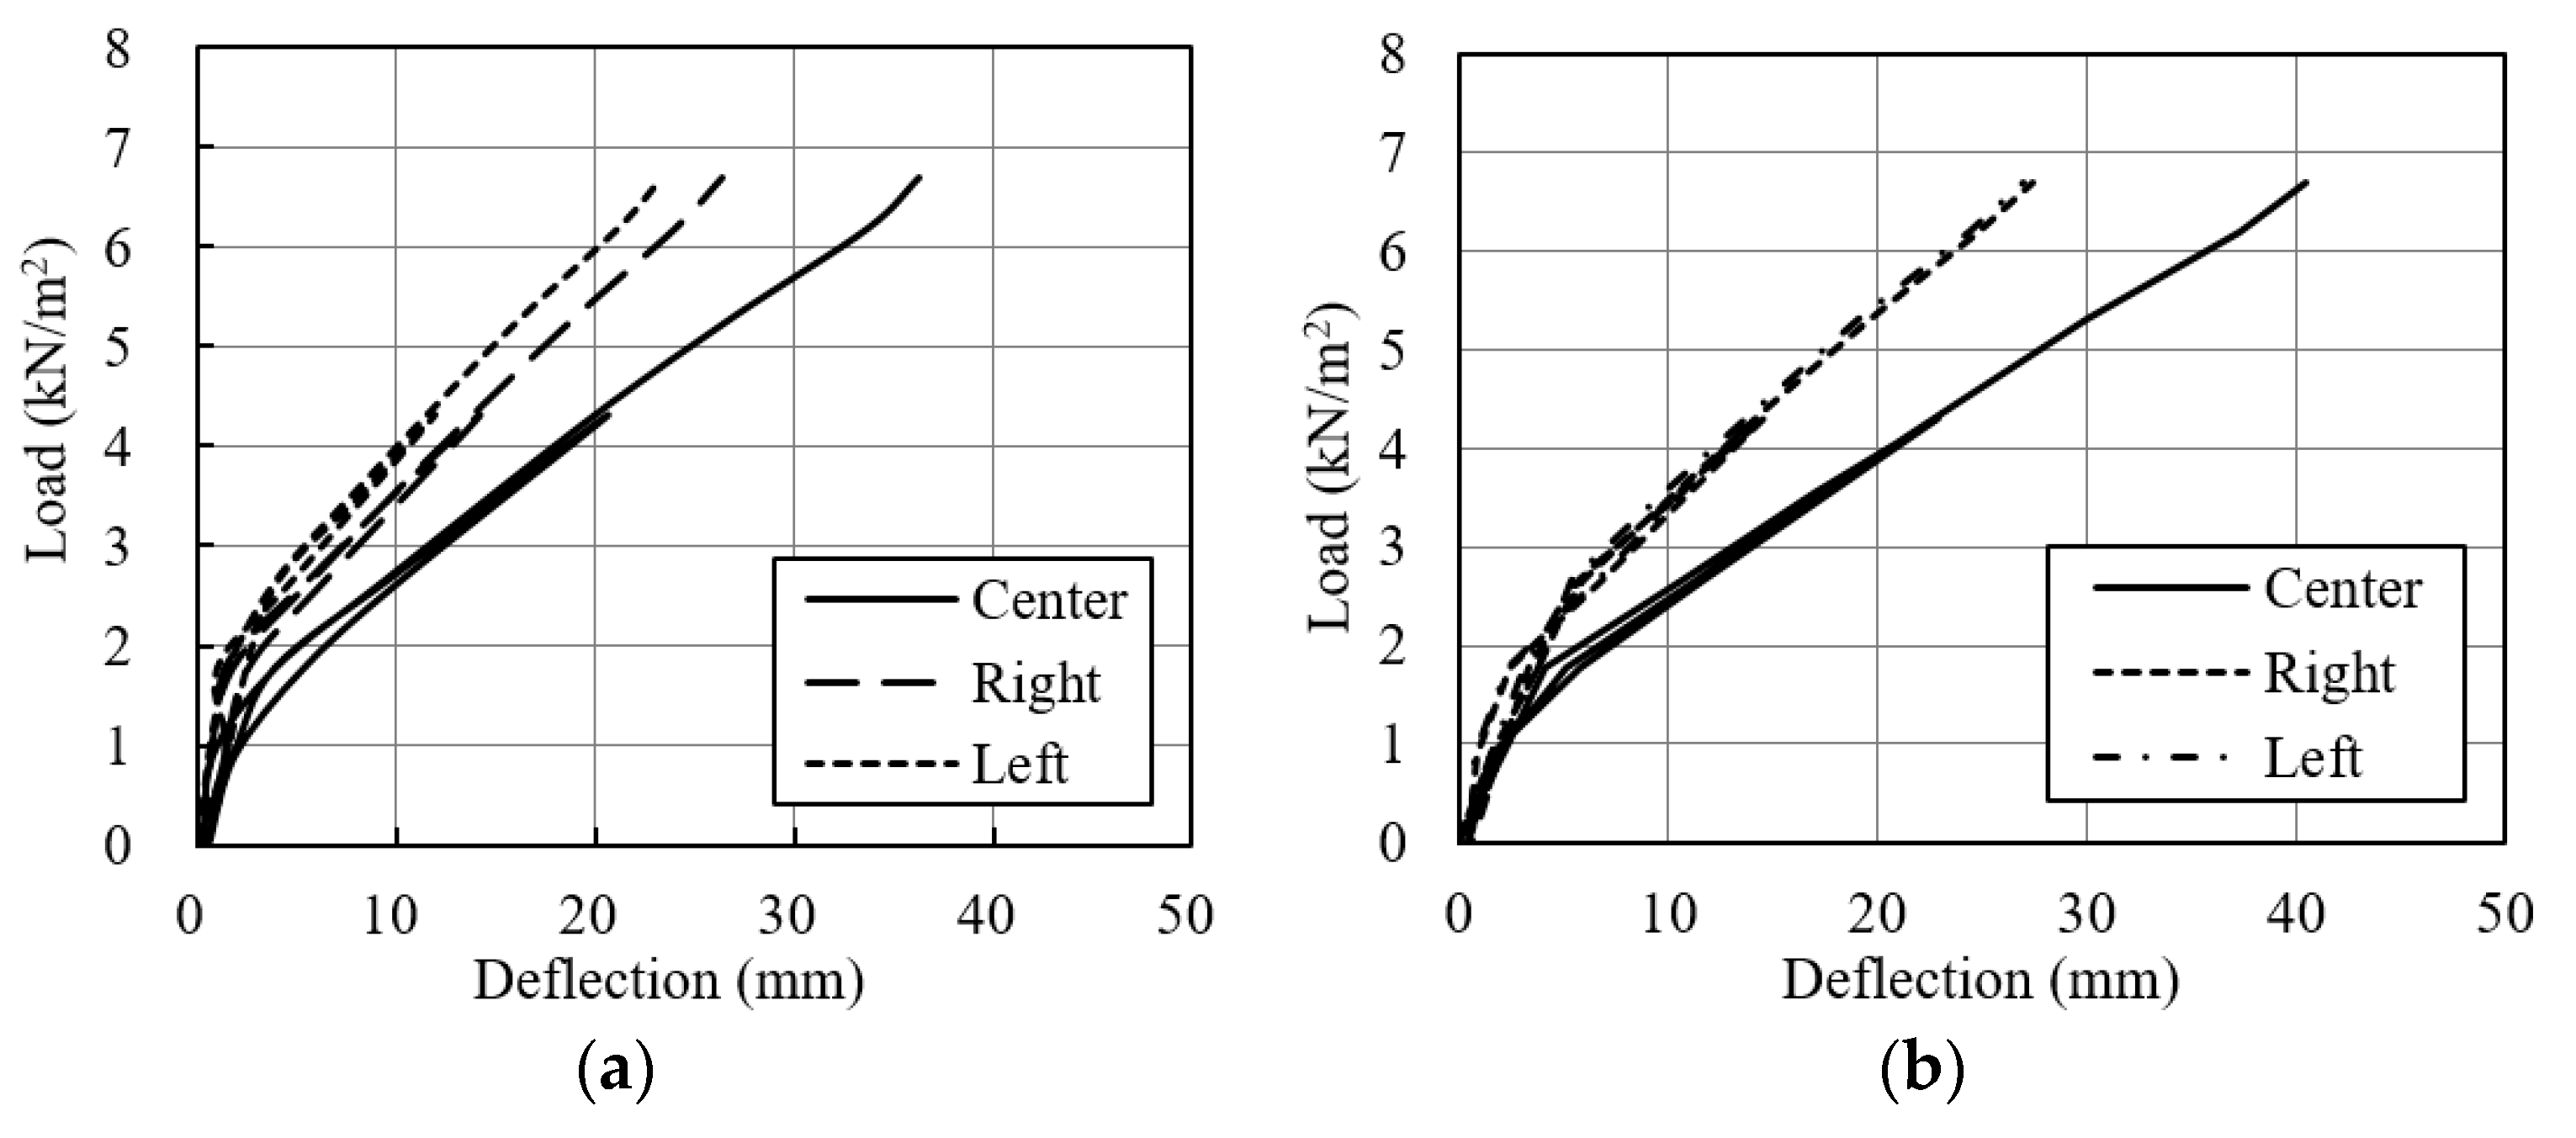
4.2. Specimens 135-ED1-3.2A and B
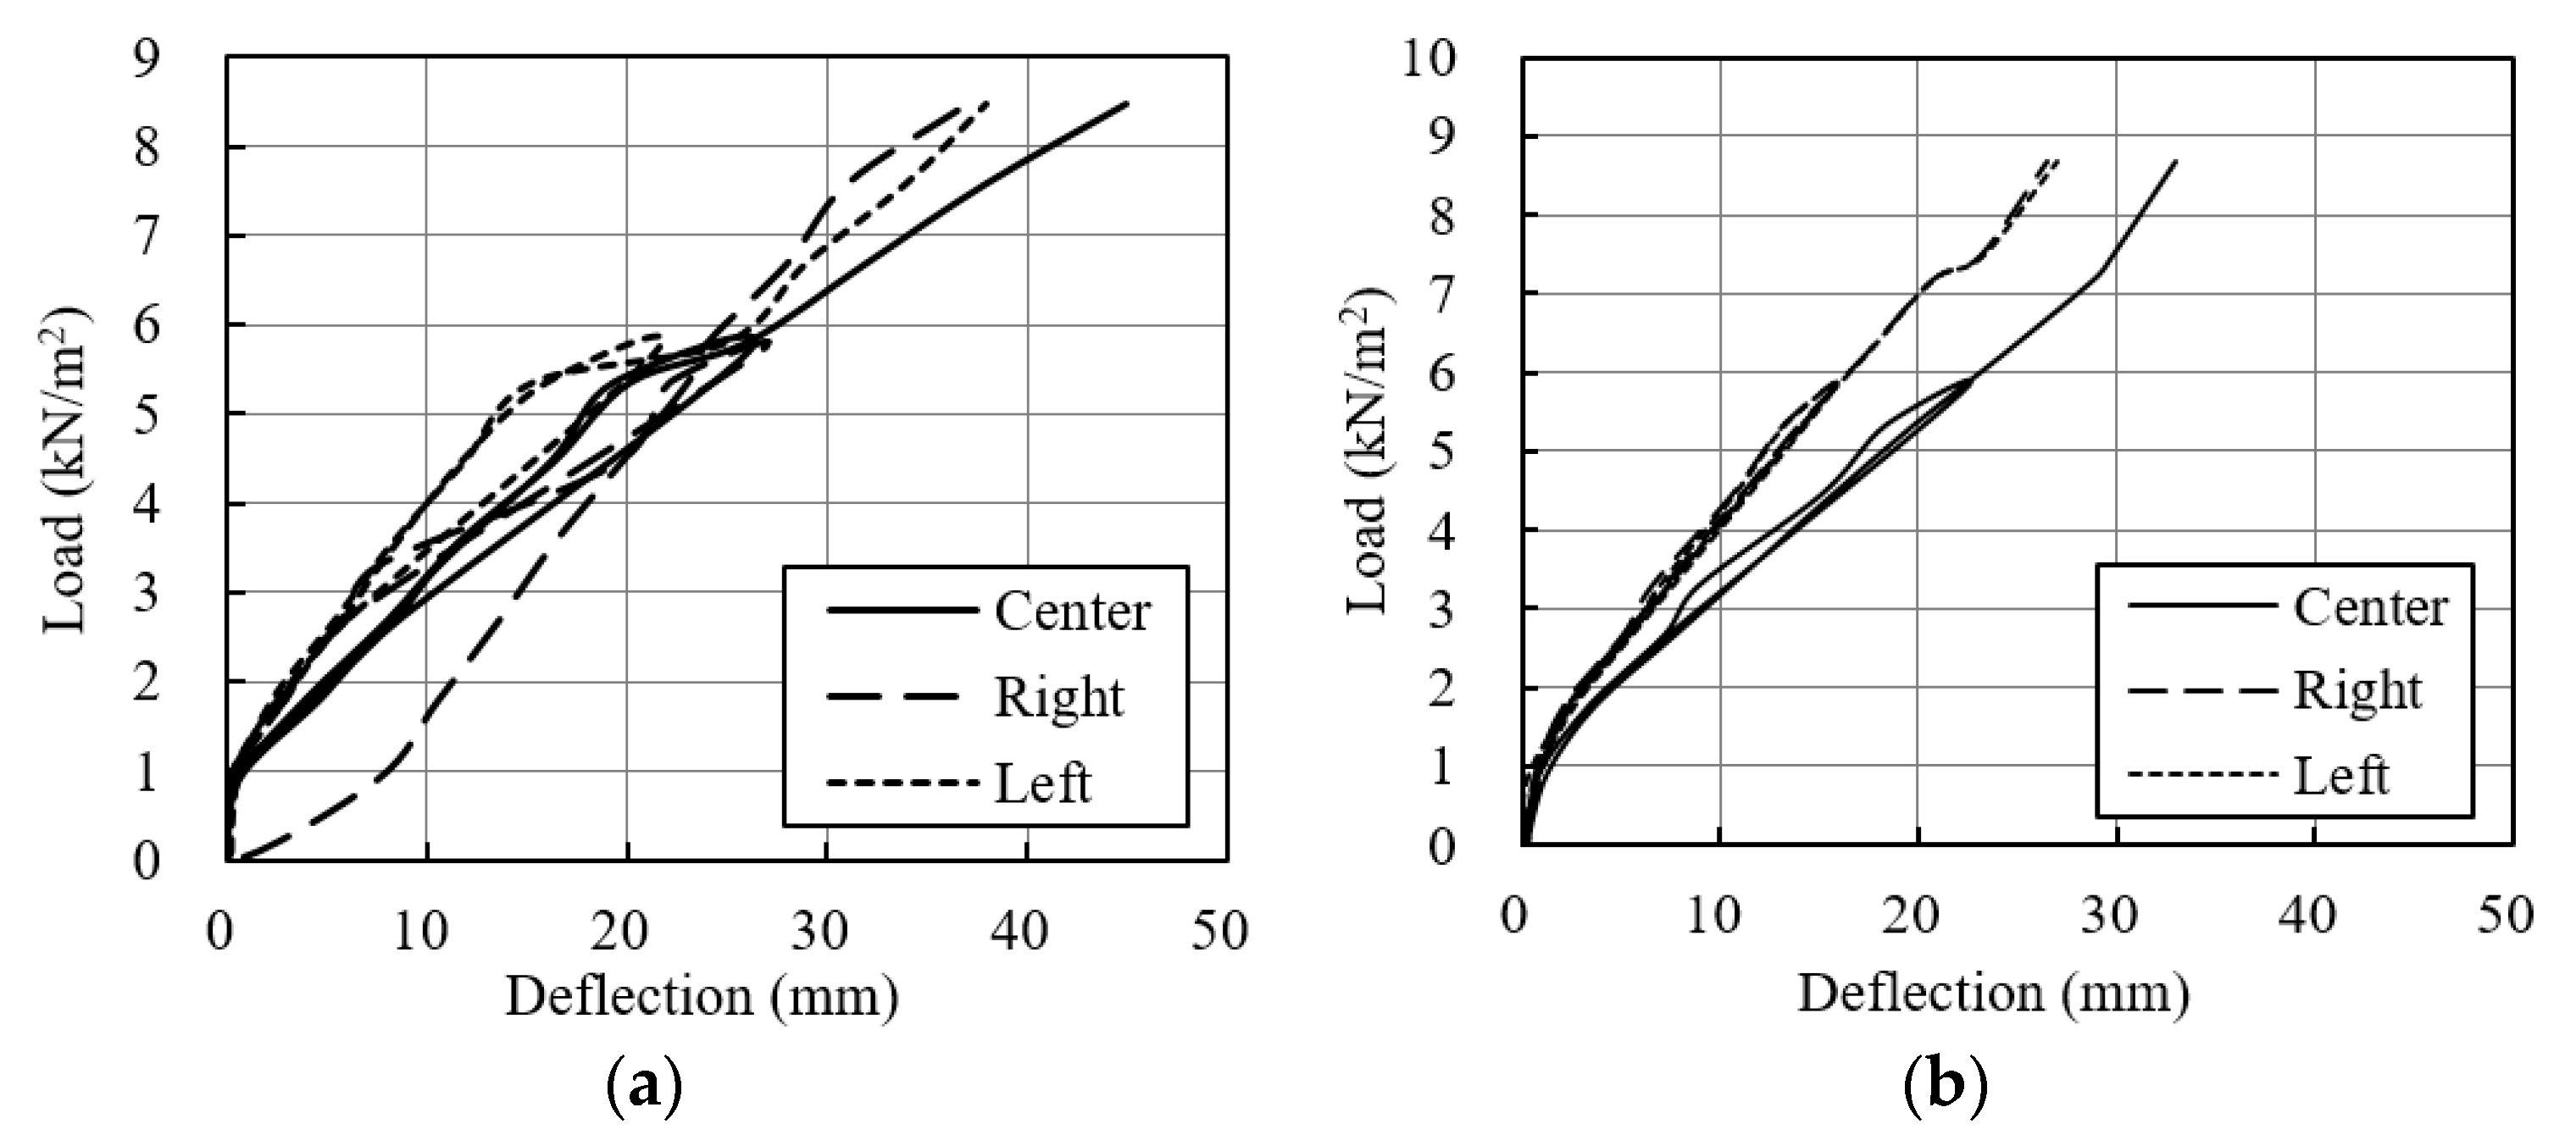
4.3. Specimens 150-ED3-3.8A and B
4.4. Specimens 200-ED5-4.5A and B
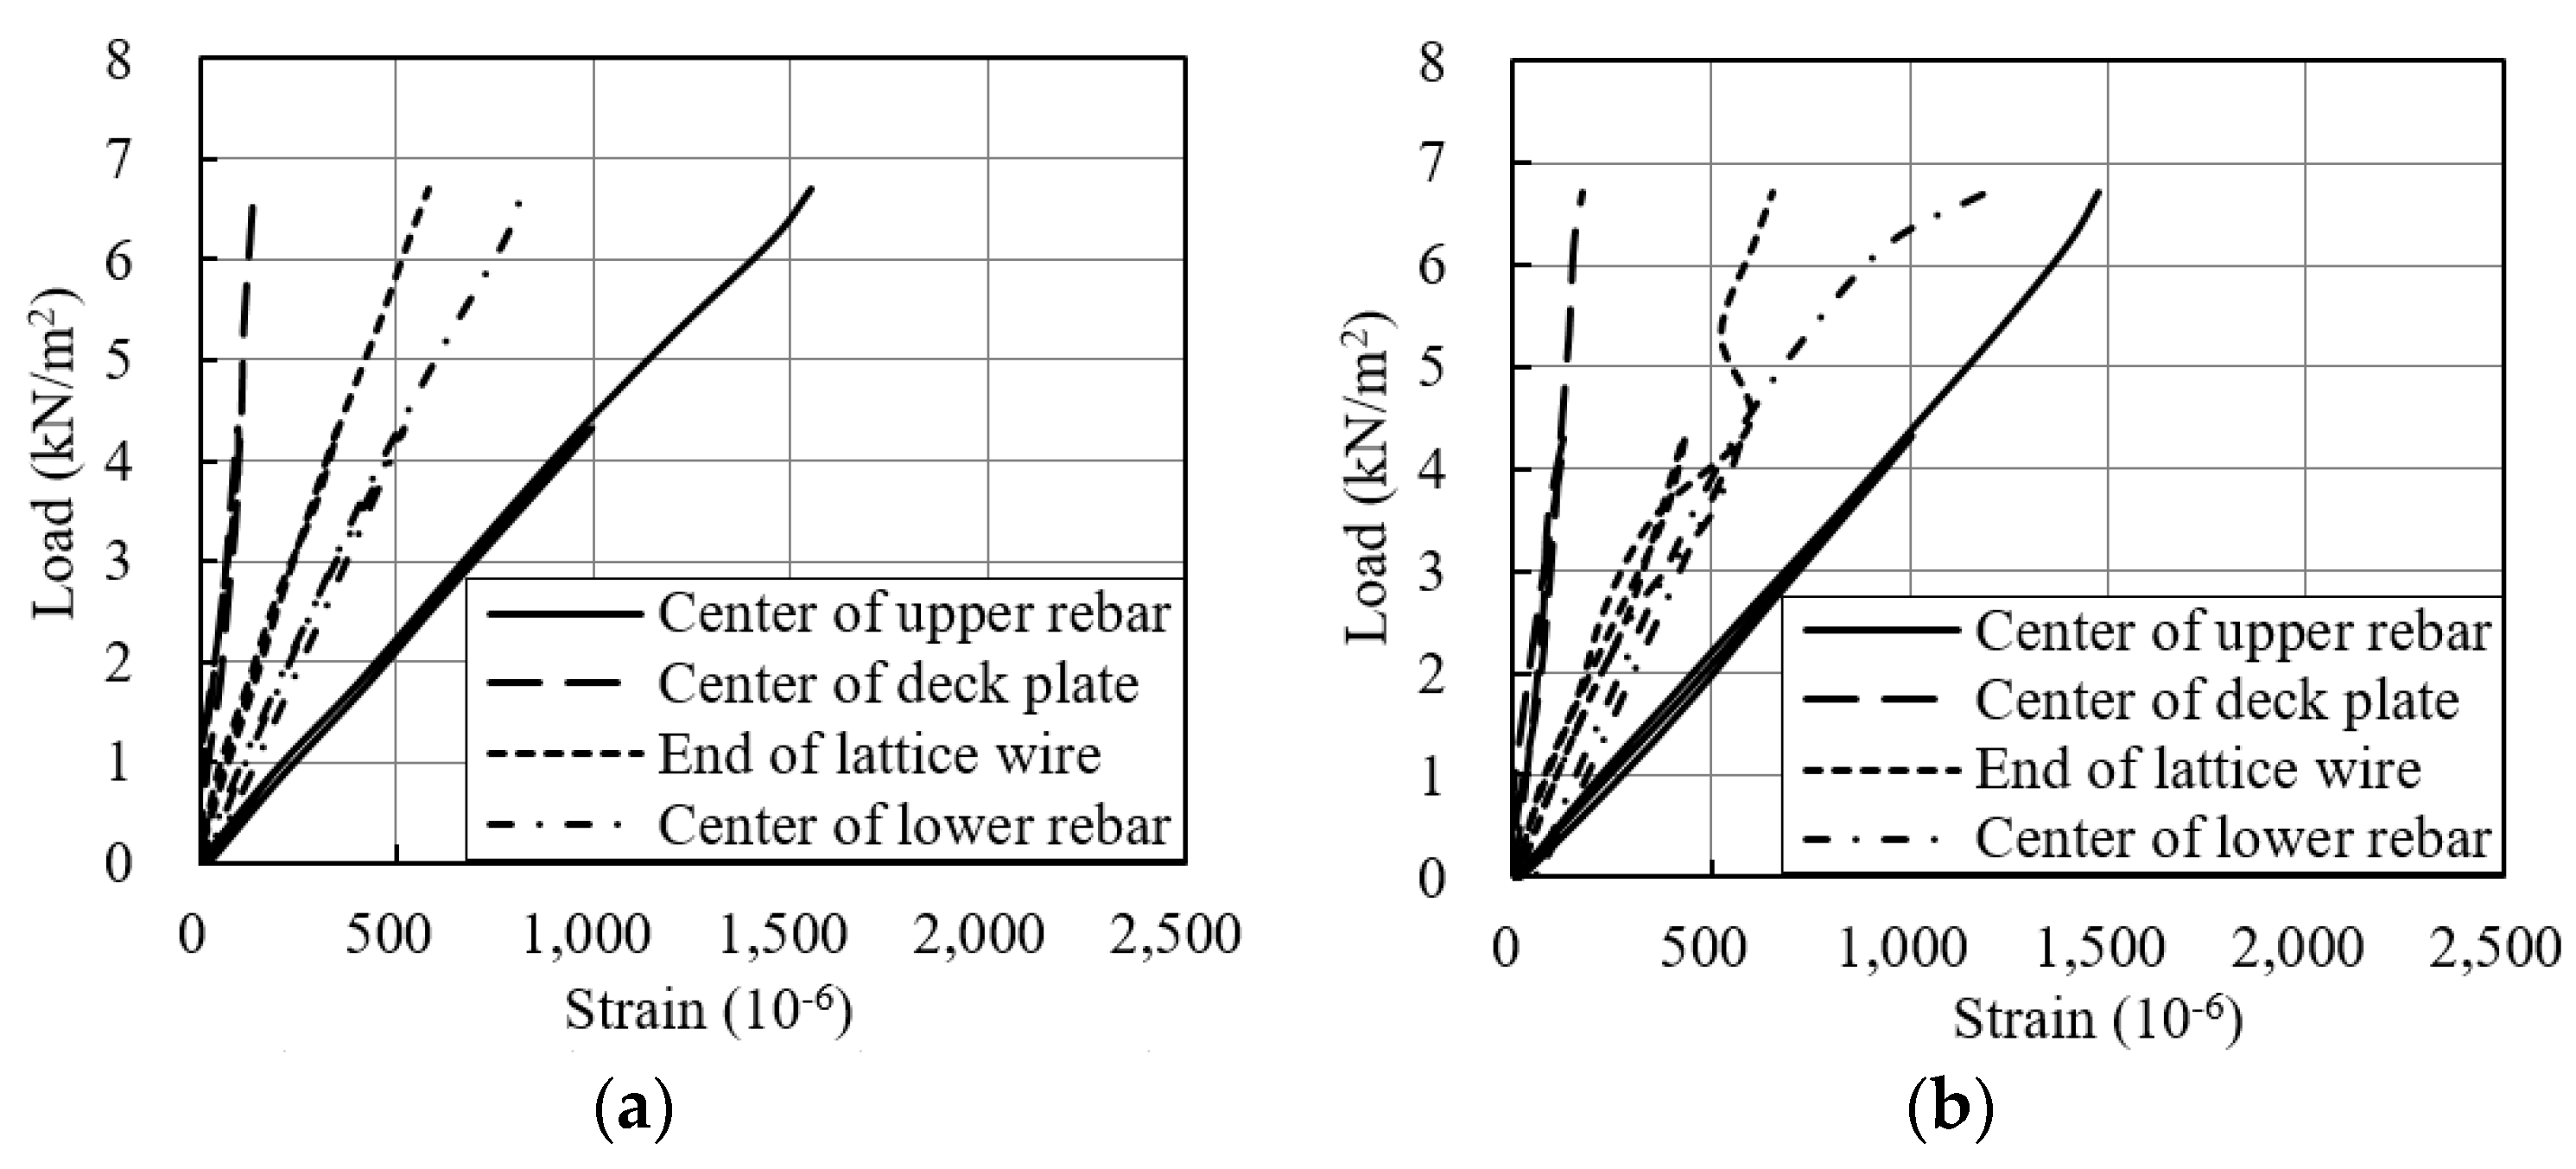
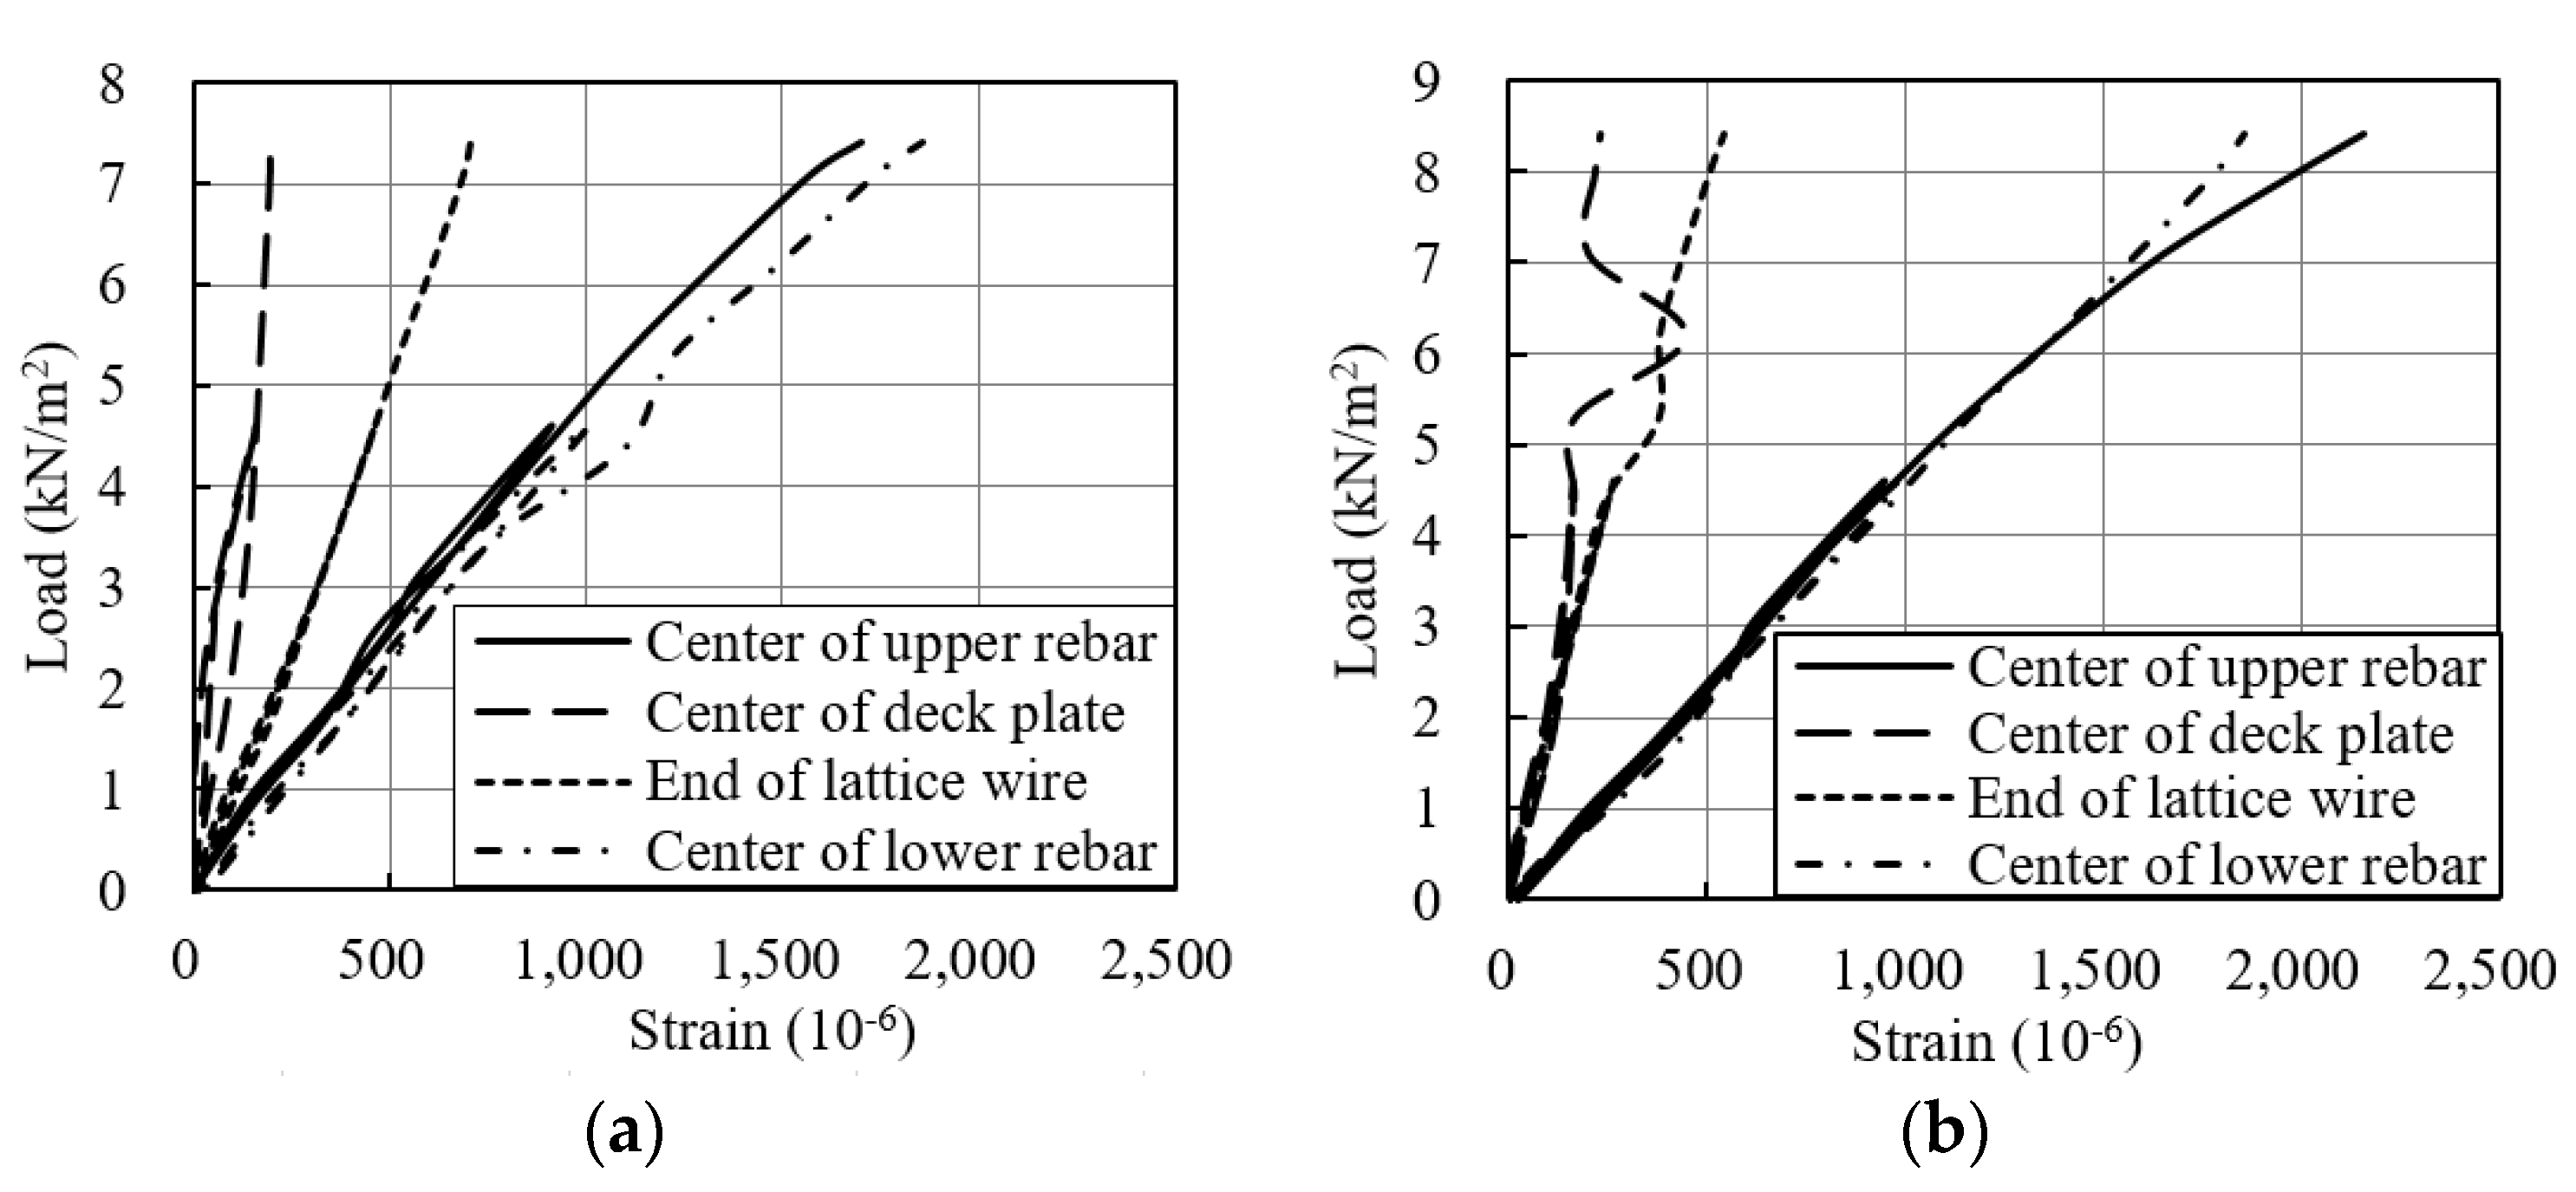
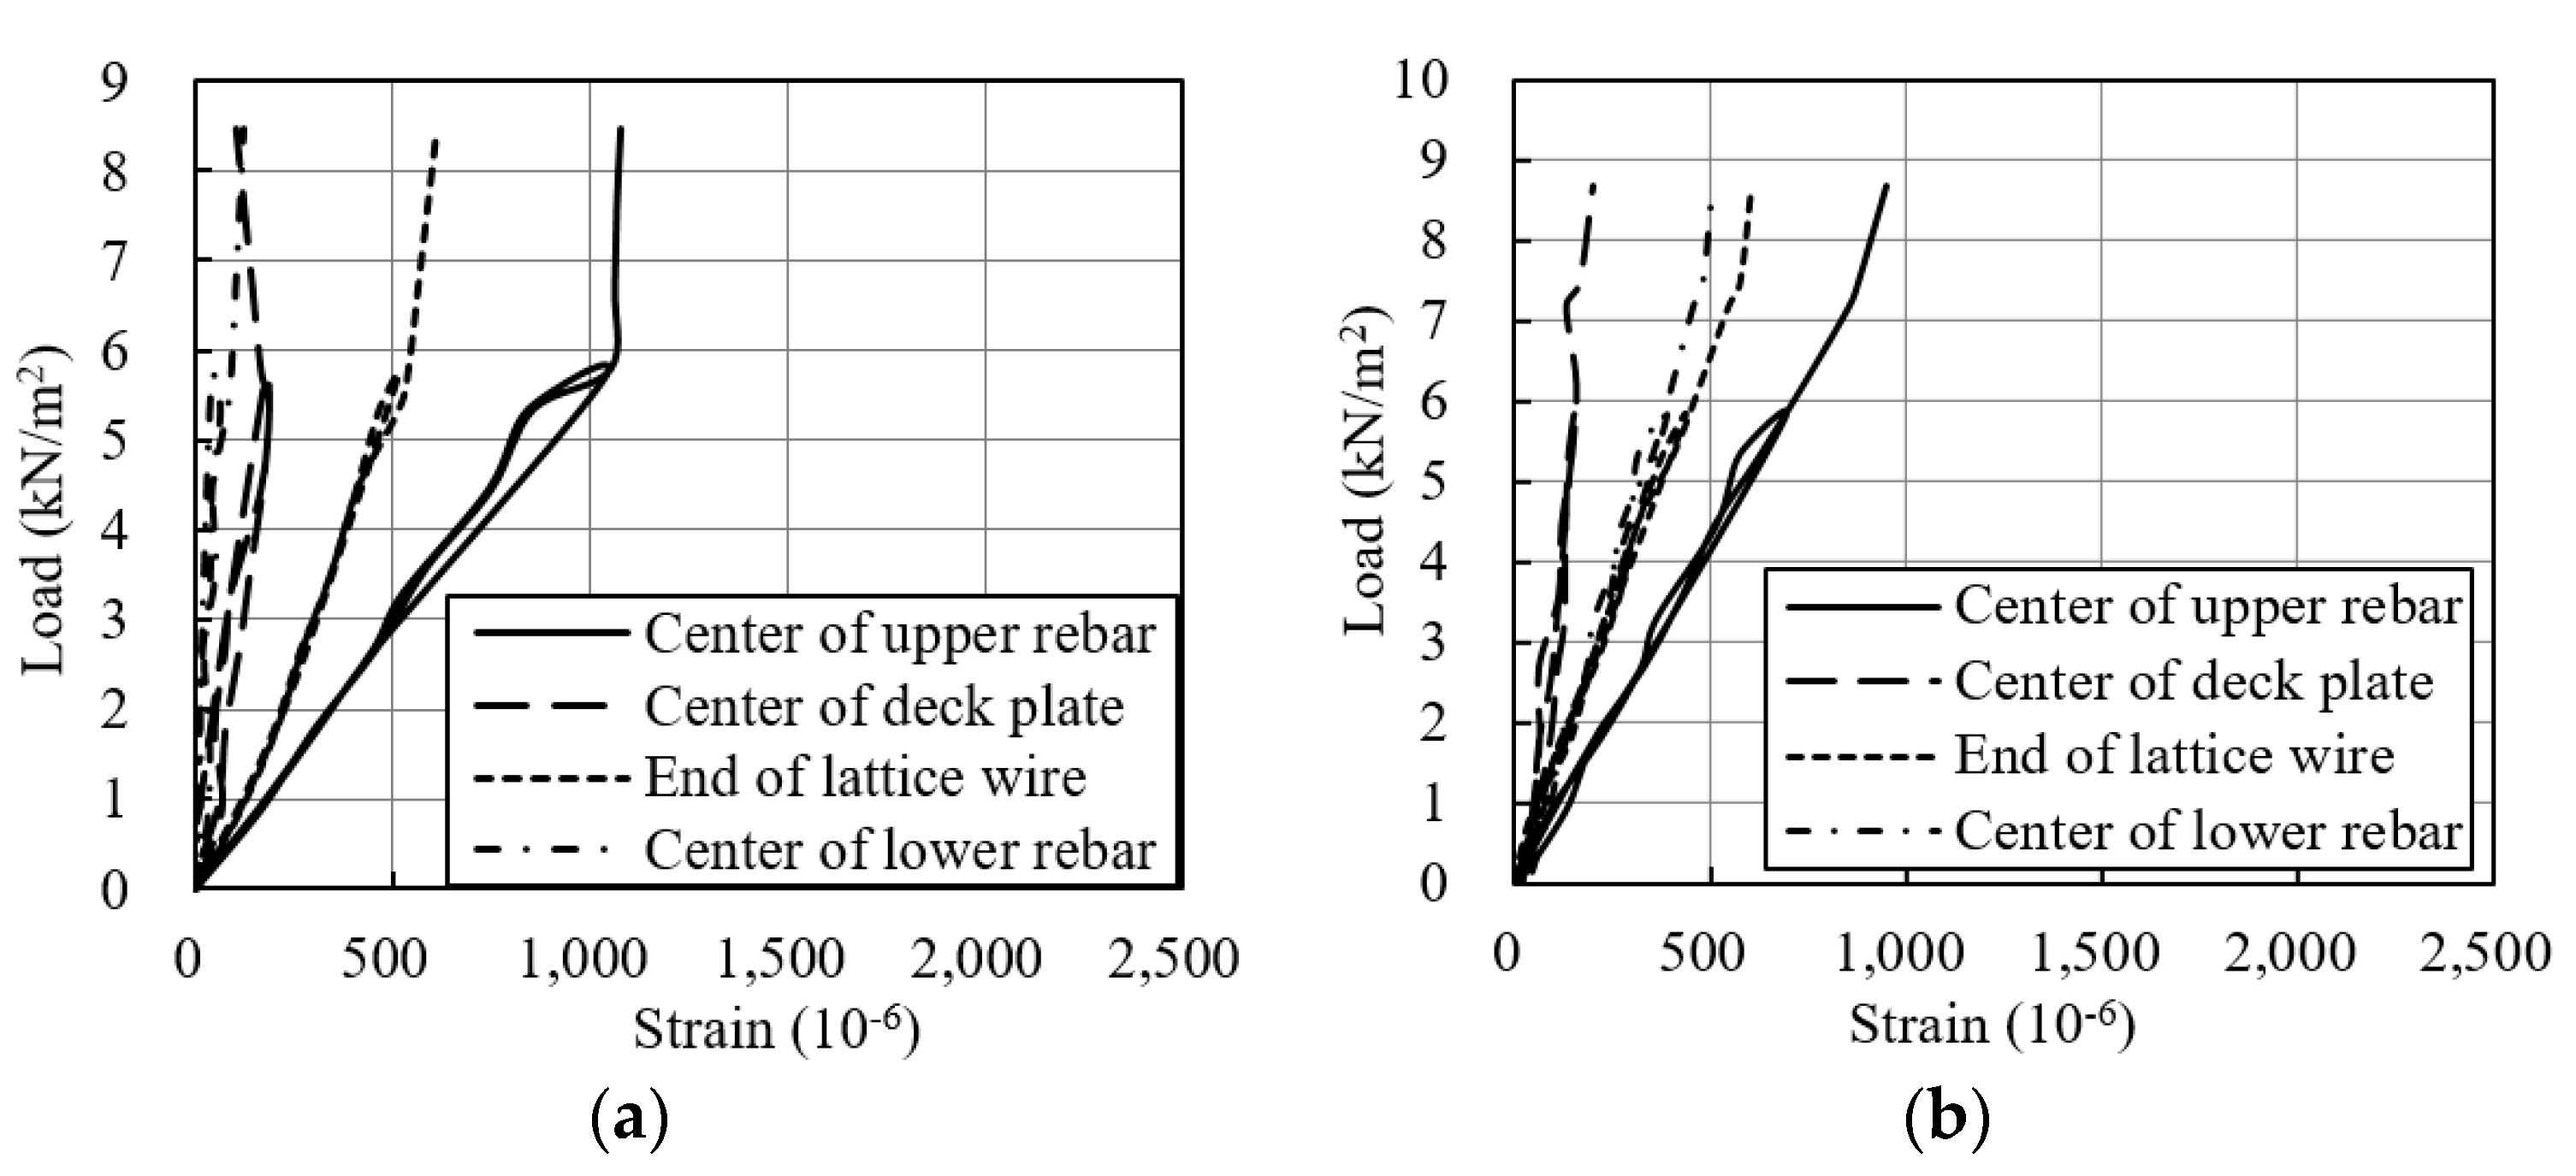
4.5. Local Responses
4.6. Test-Result Summary
5. Numerical Investigation
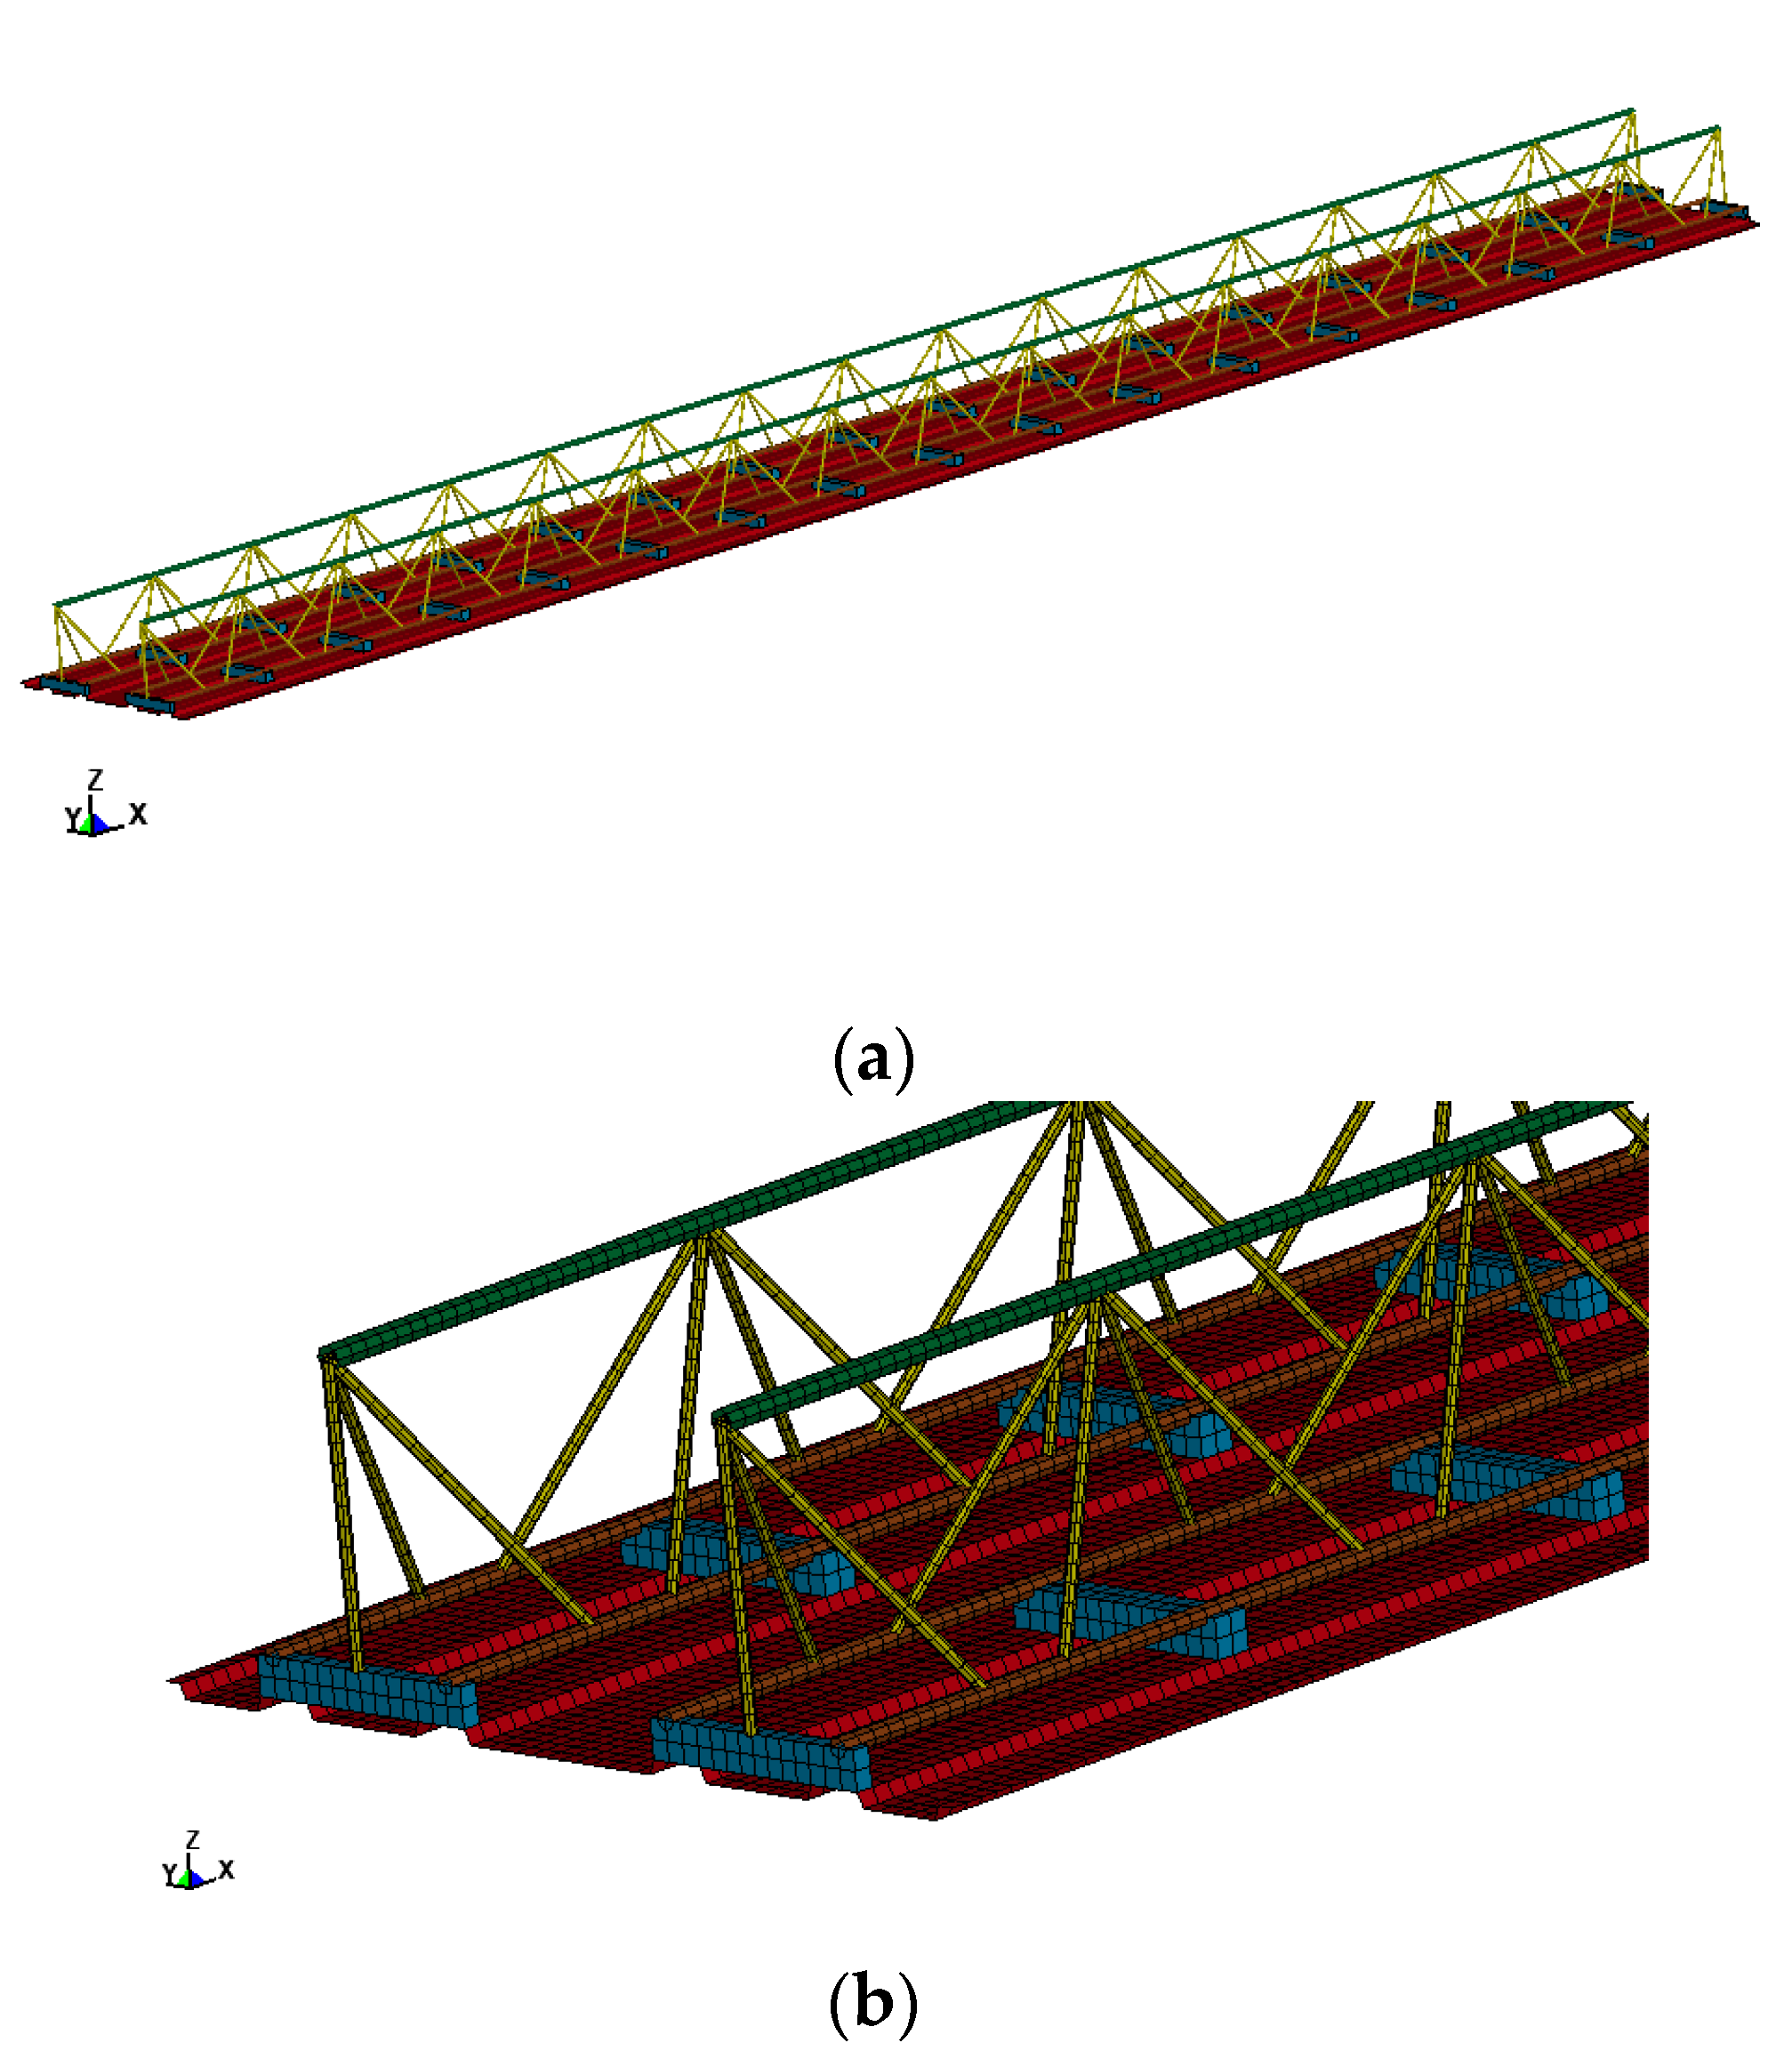
5.1. Finite Element Modeling
5.2. Material Model
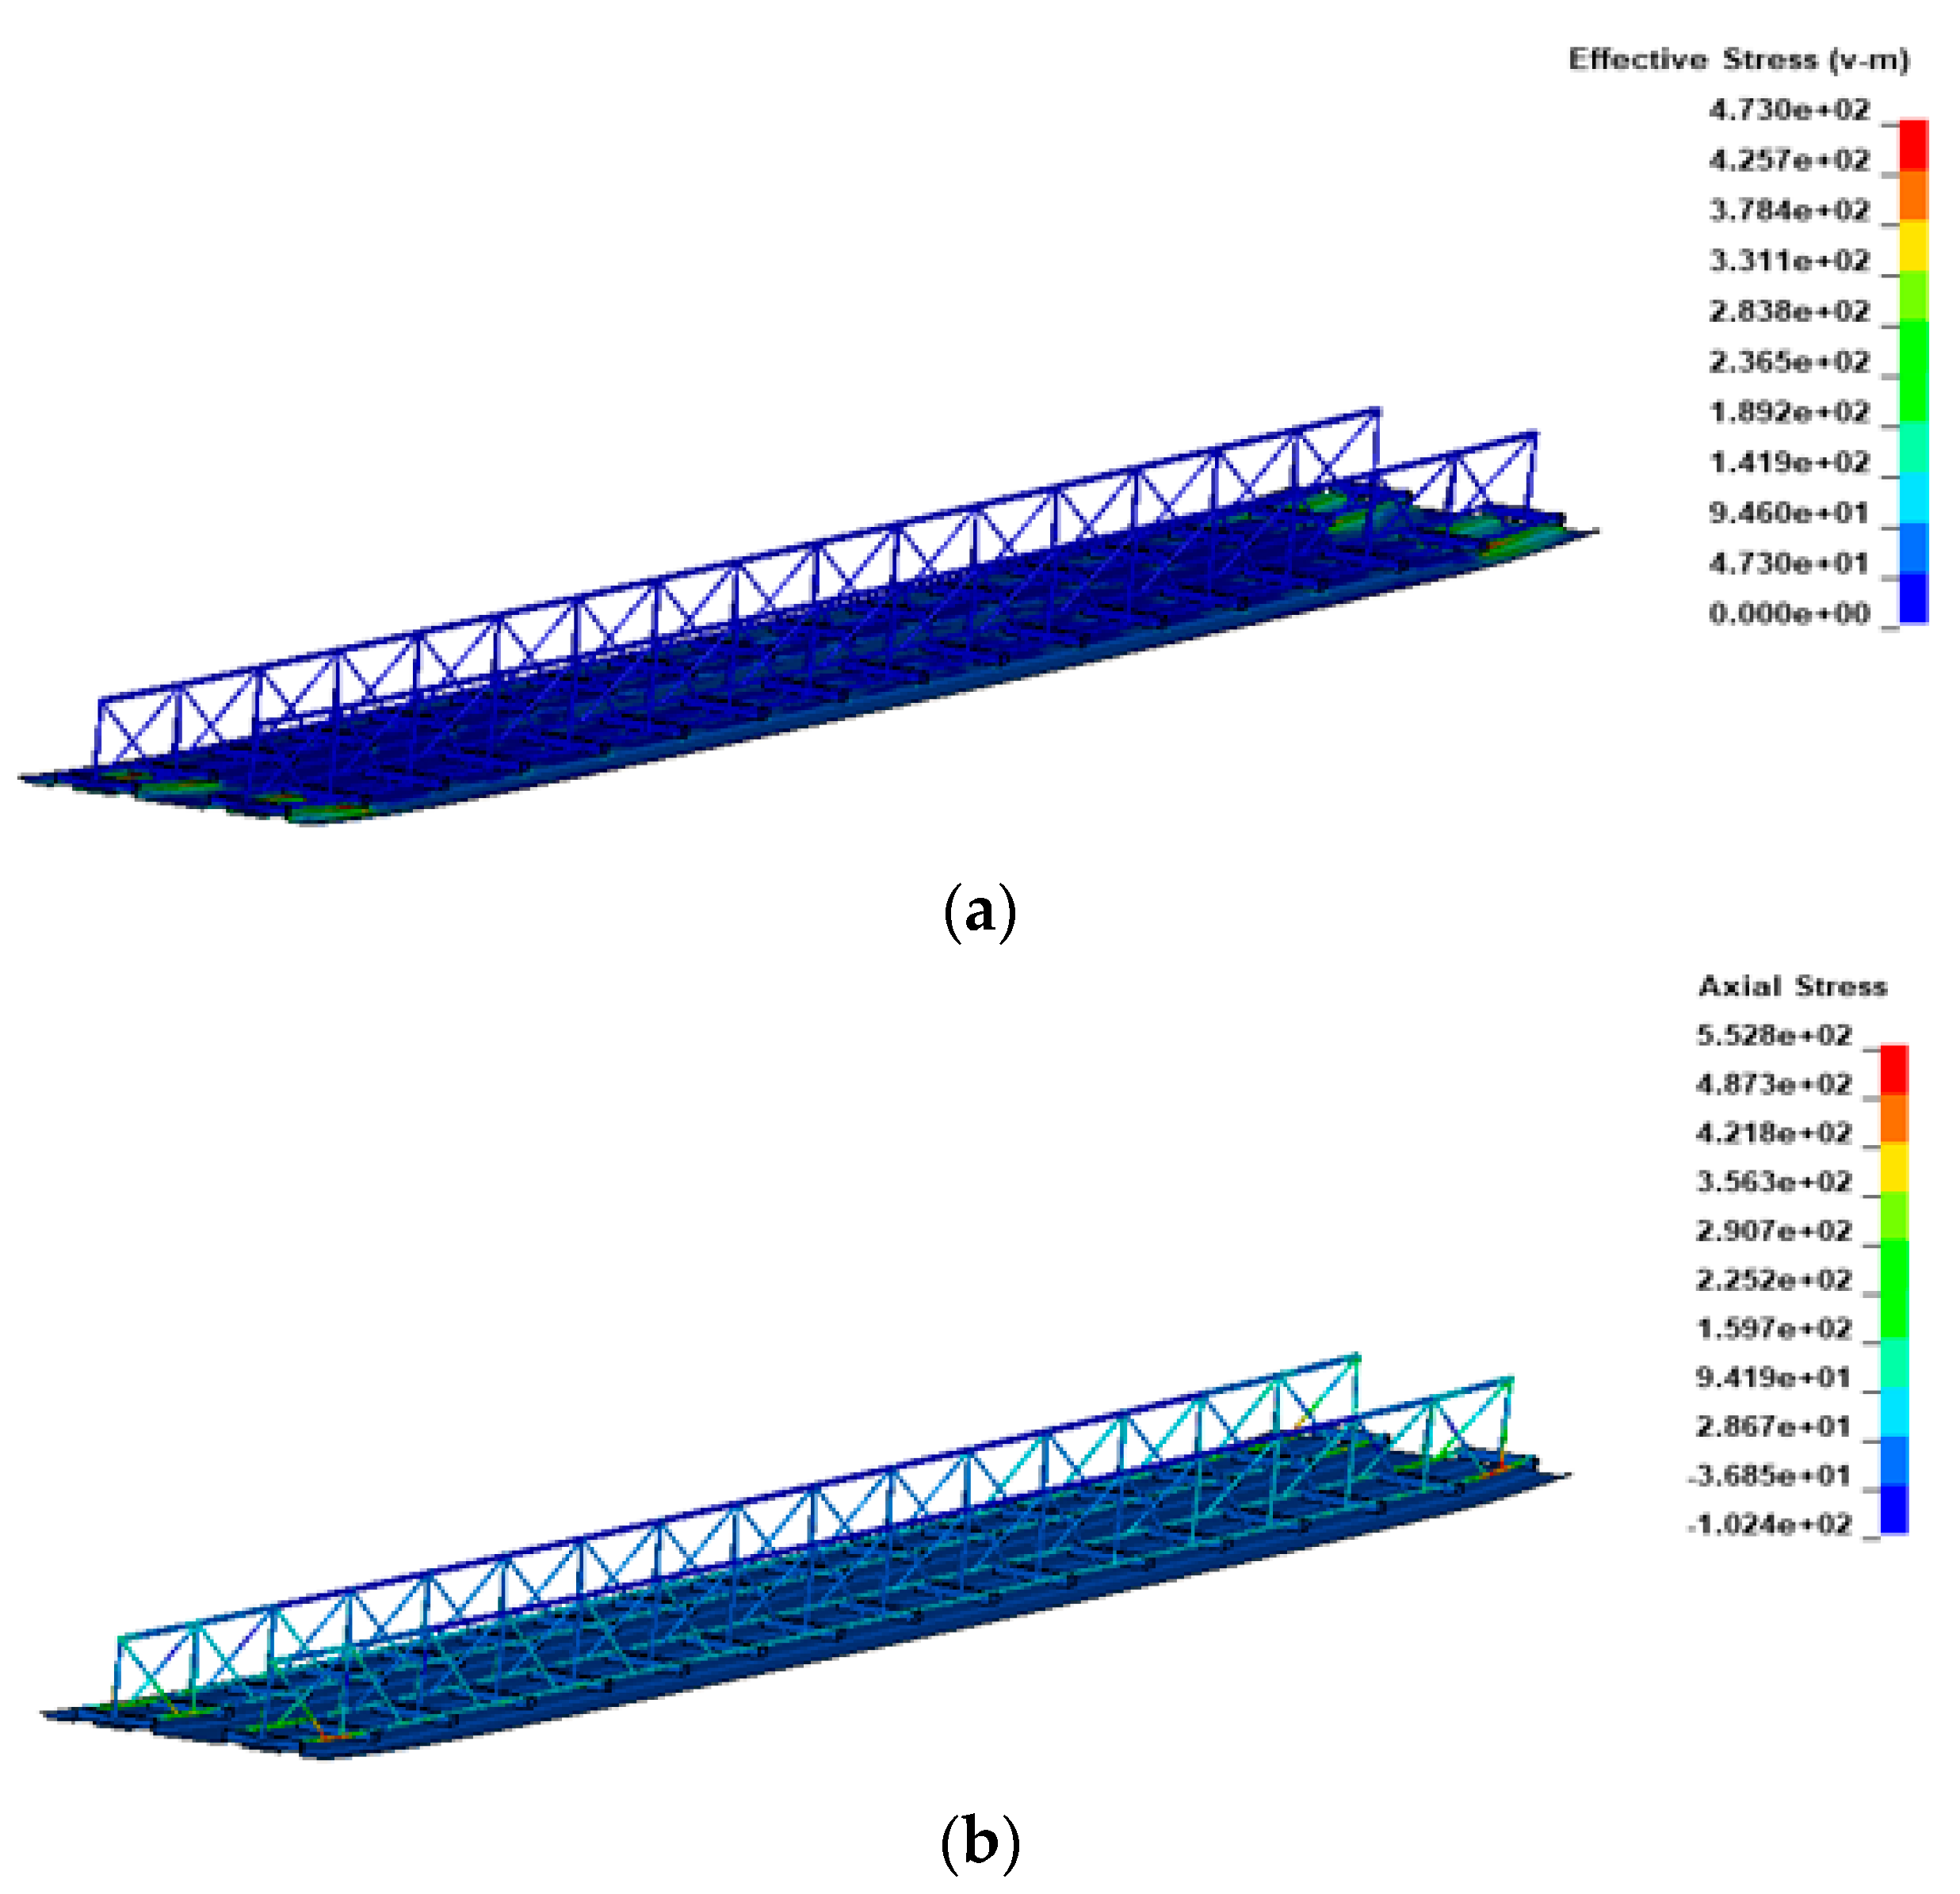
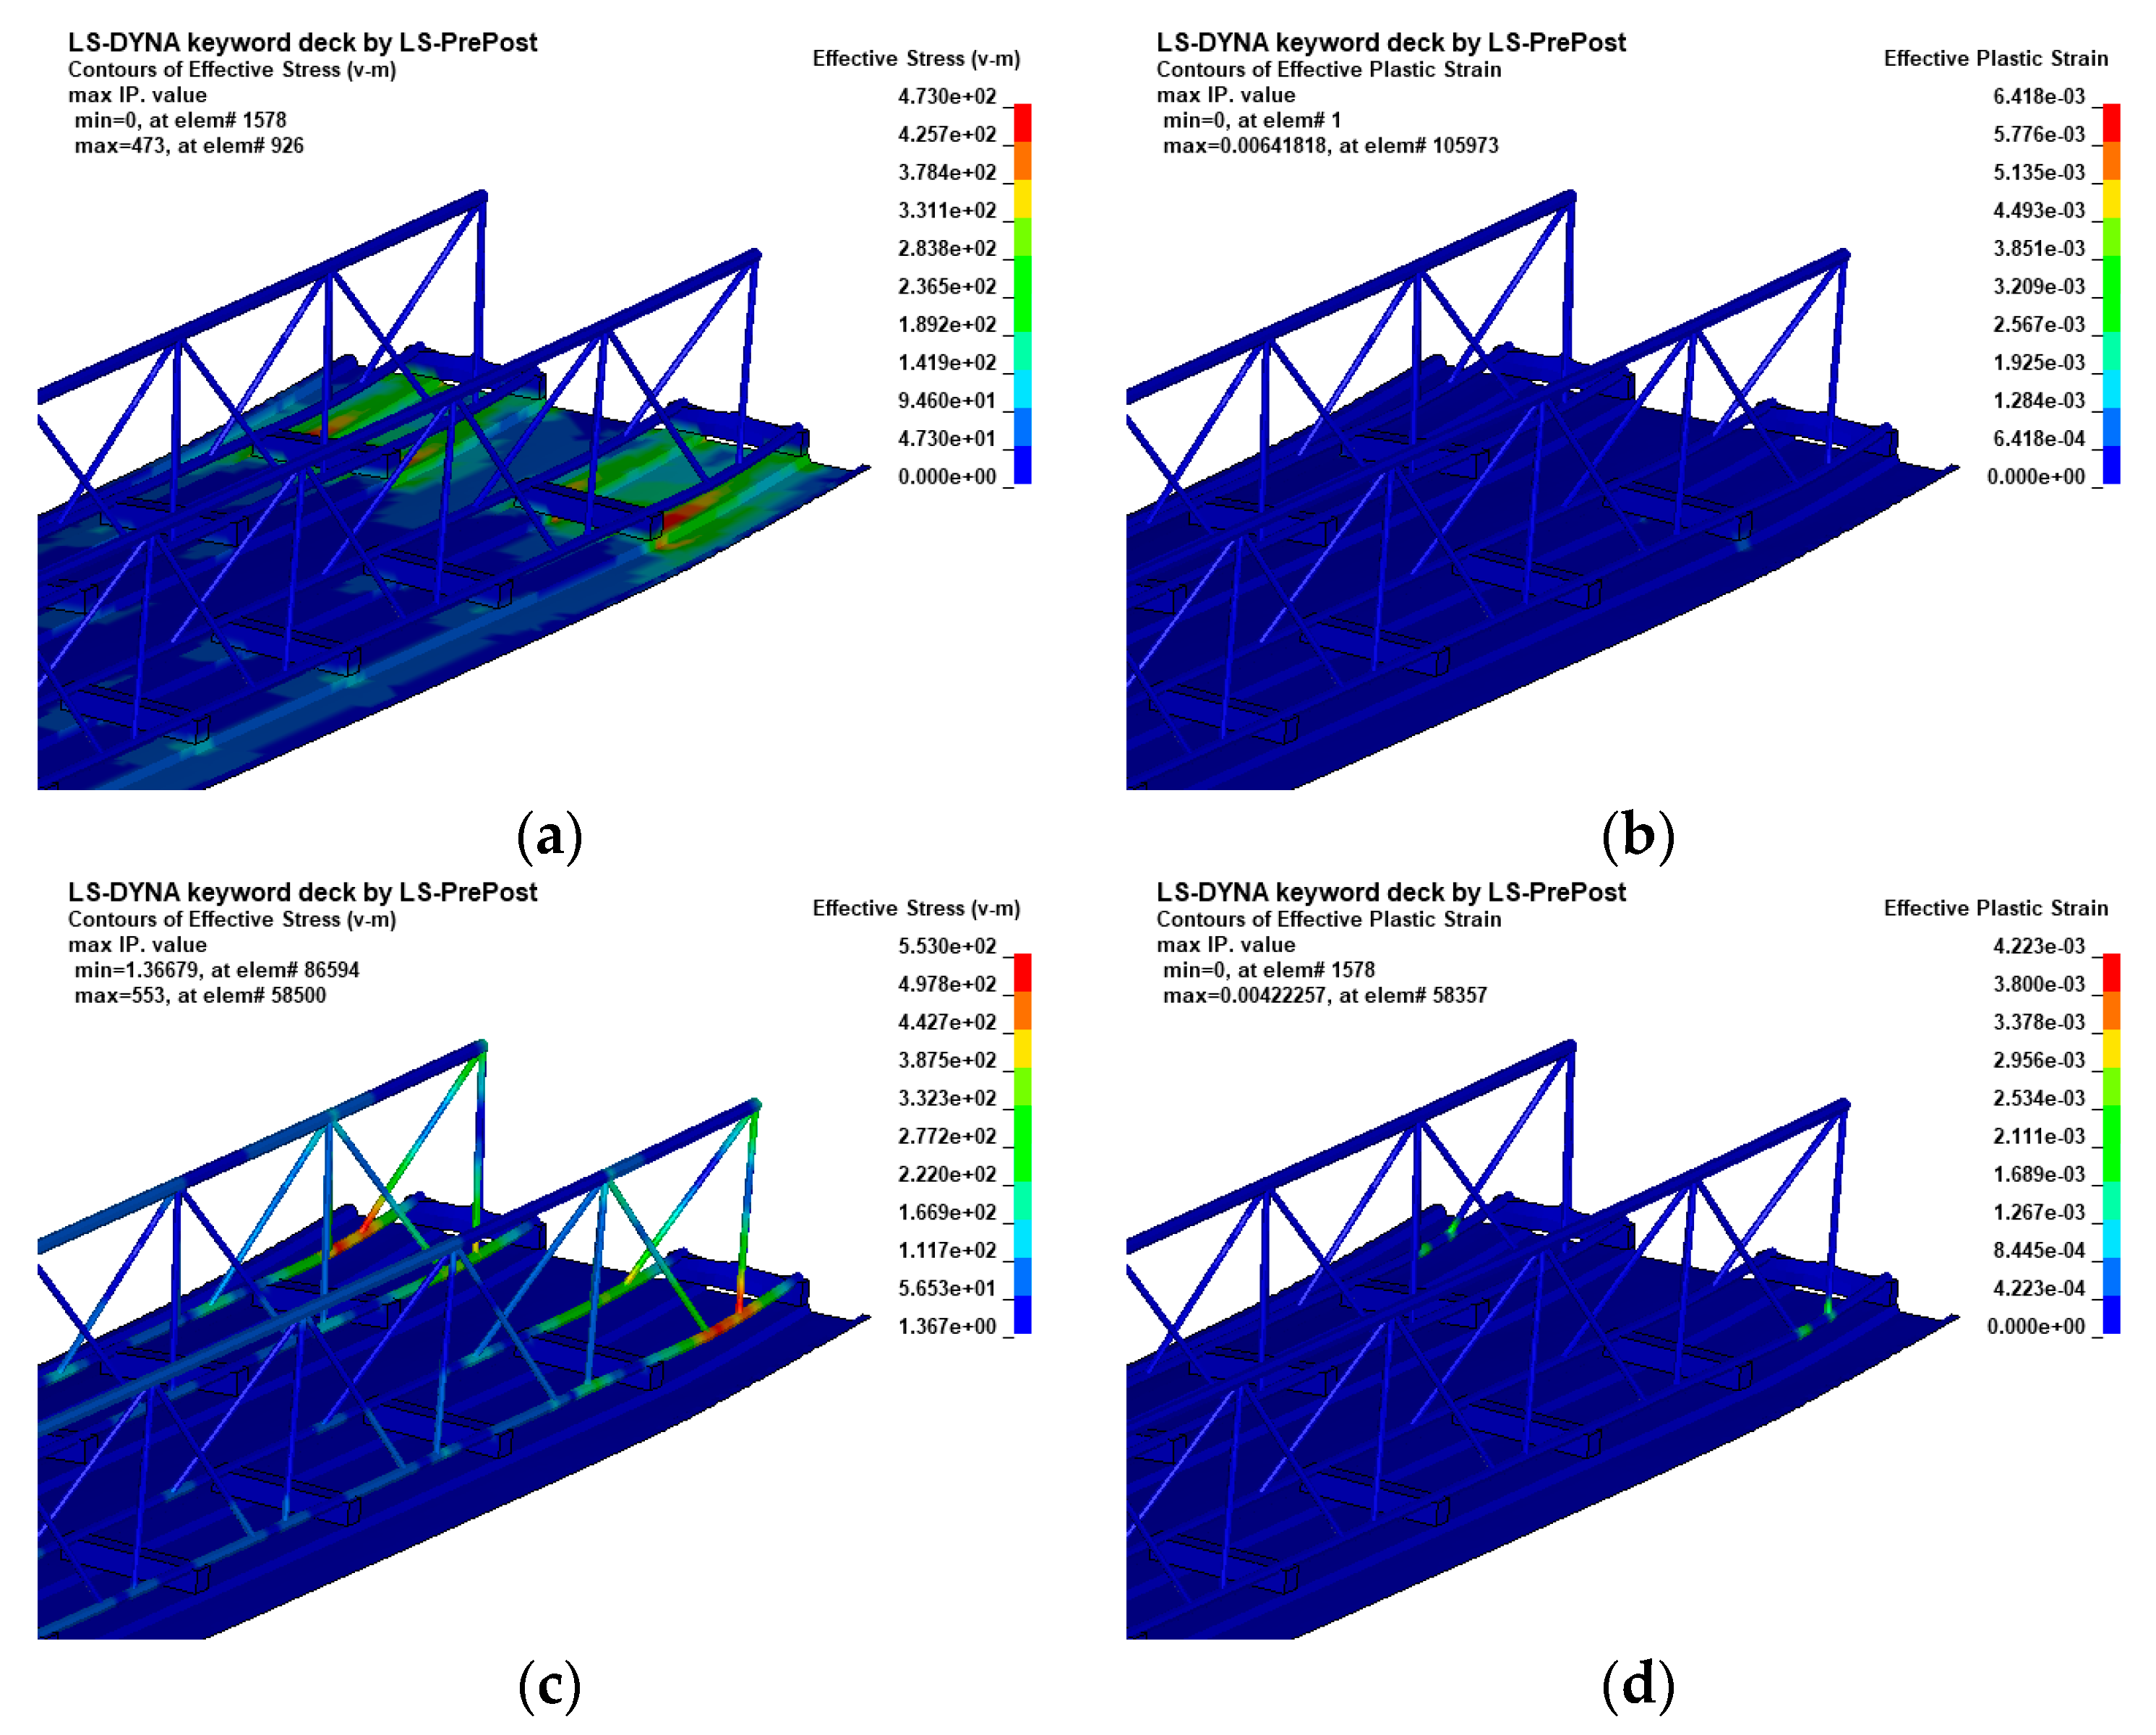
5.3. Simulation Results
5.4. Failure Mode
6. Conclusions
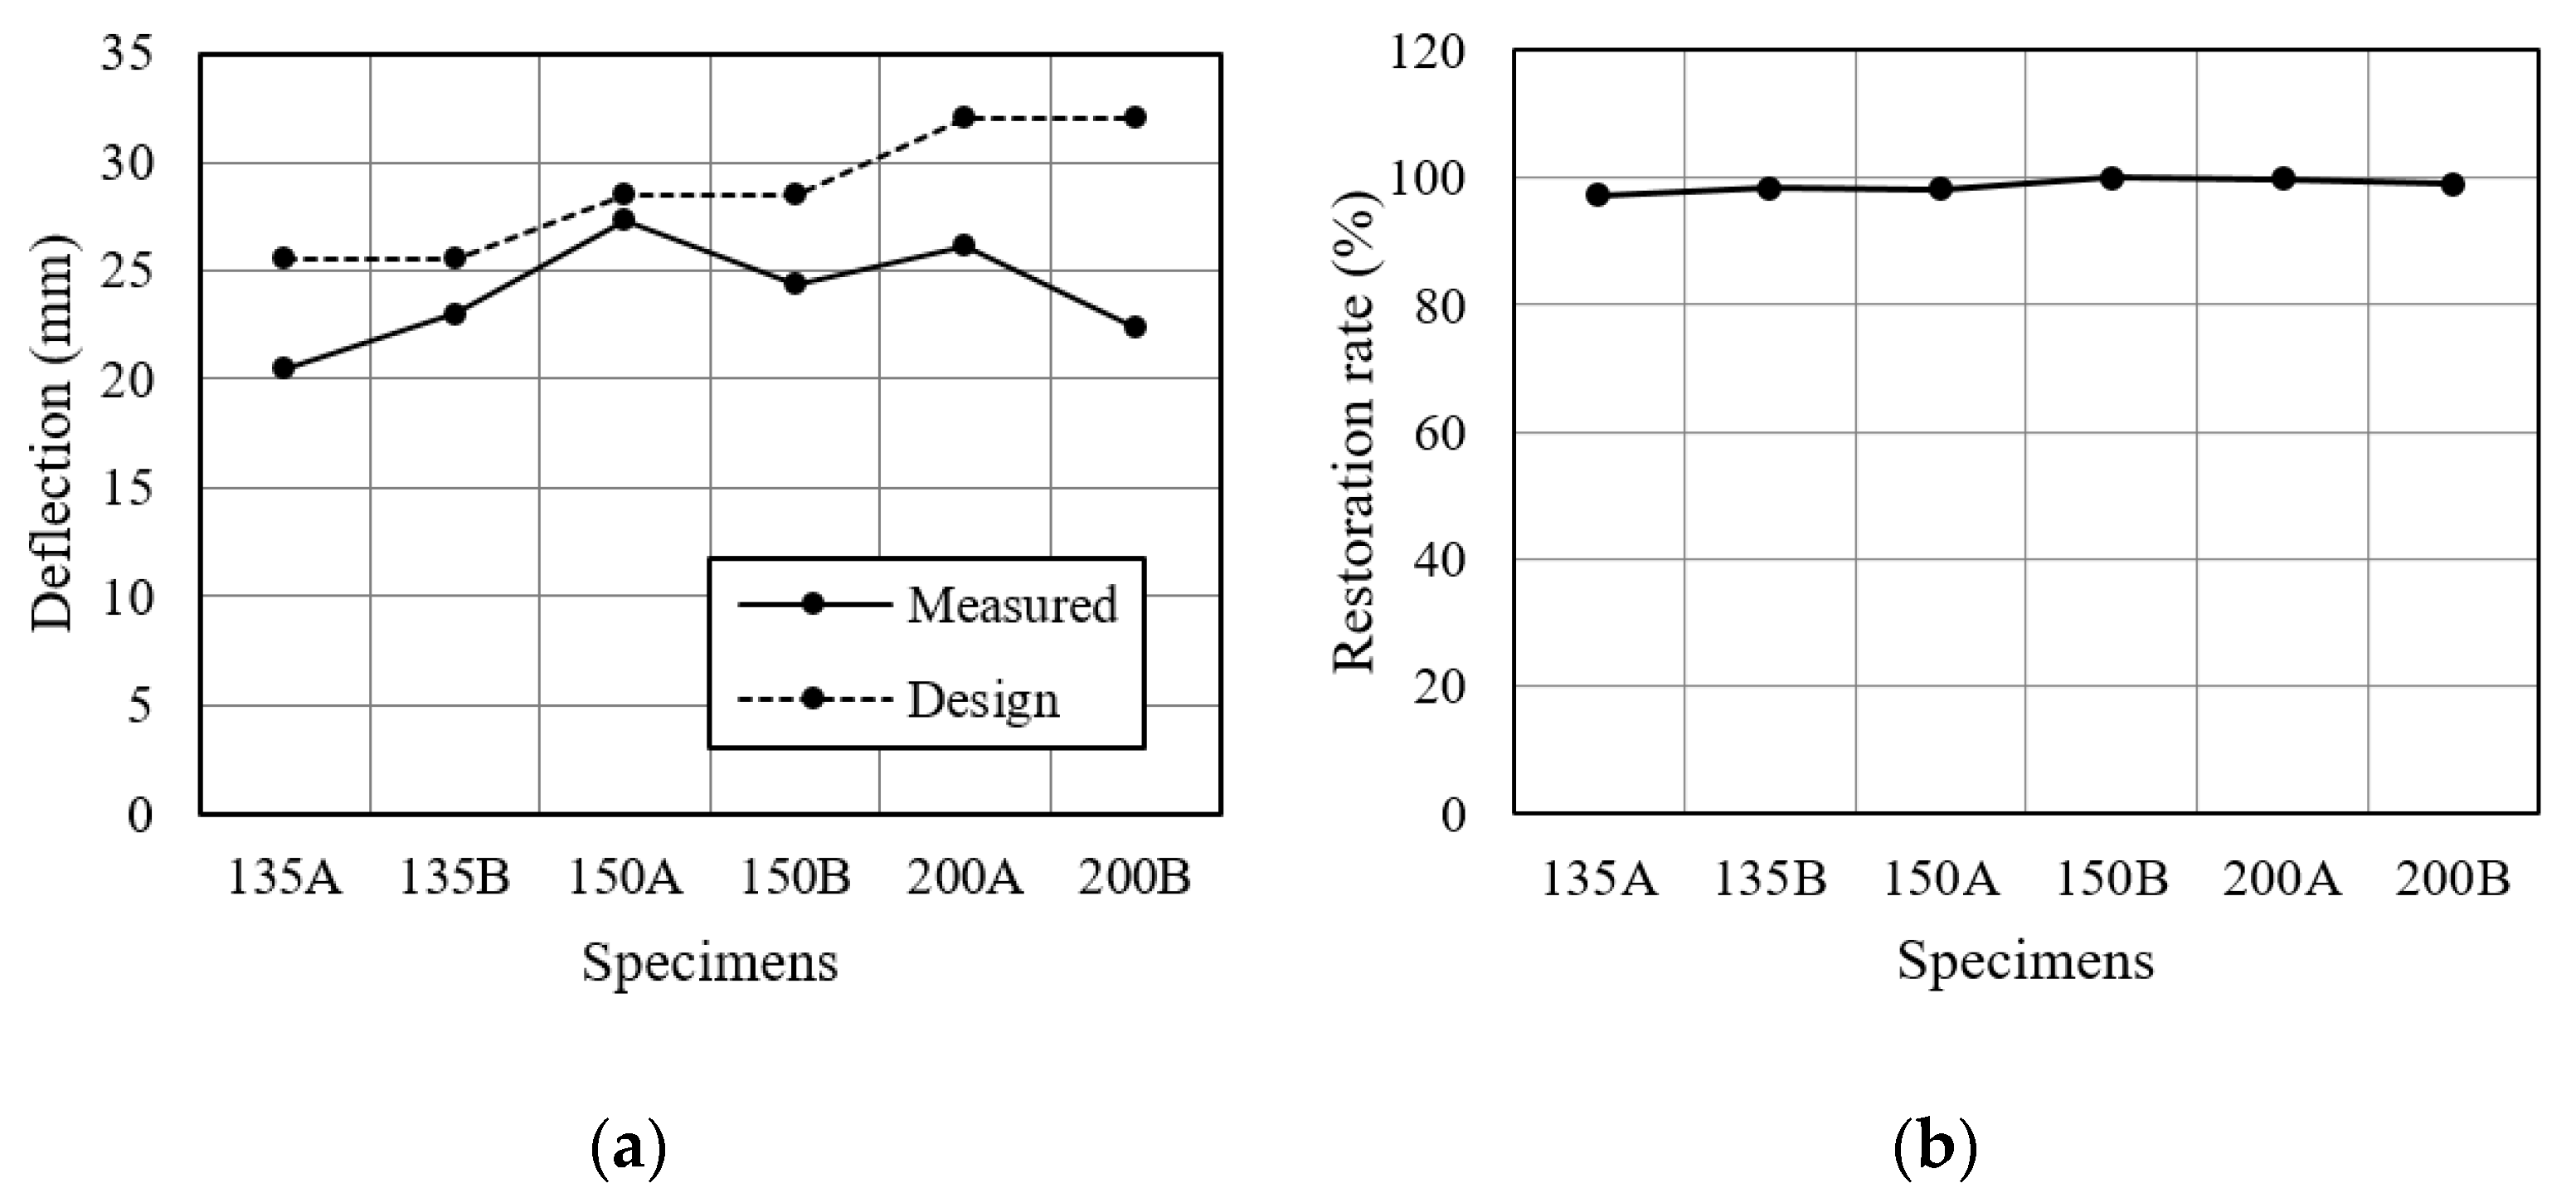
- The structural safety of the proposed truss girder-bolted deck-plate system has been validated through experimental and numerical studies. All test specimens and the relevant numerical models met the provided design deflection criteria for given construction loads.
- The restoration capability has been experimentally validated. Most members of the test specimens remain nearly elastic, noting that the restoration rates were greater than 97% for all specimens.
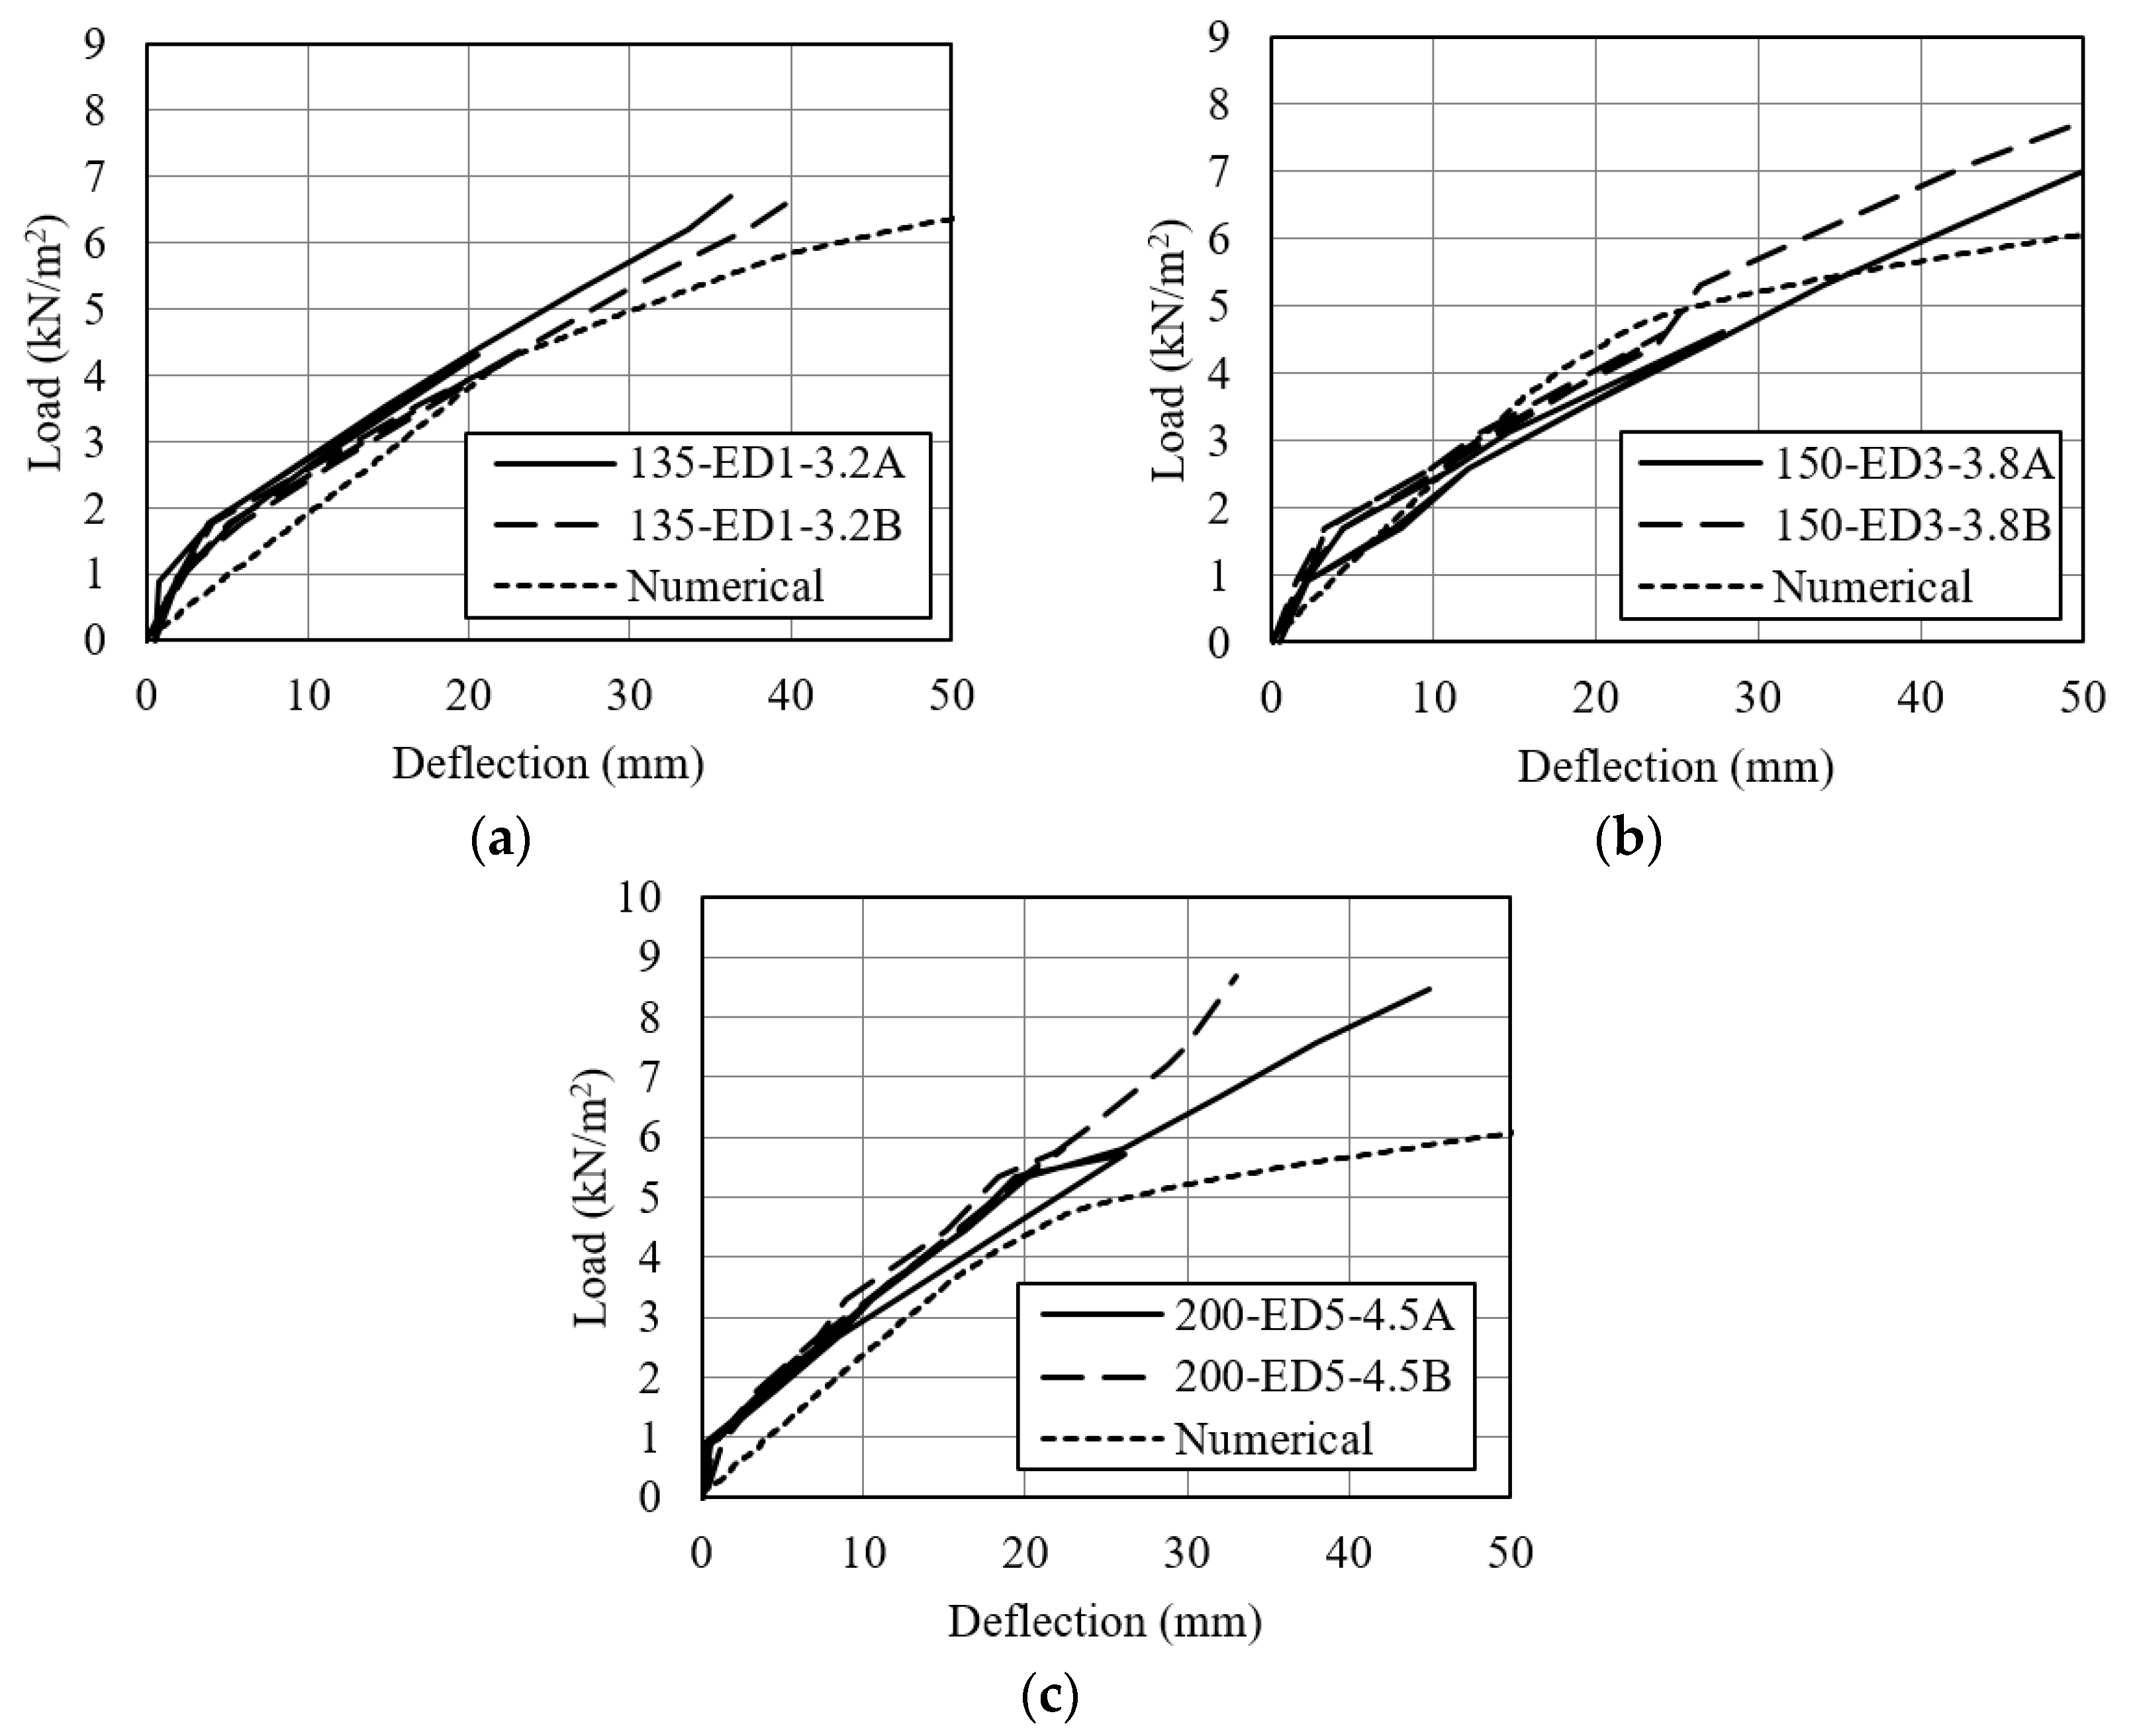
- The numerically-predicted deflections were very similar to the measured values until the specified loads is reached, ensuring the reliability of the test results. Some differences were observed after the specified loads due to the use of the elastic–plastic material models, but this is insignificant because the evaluation of the deflection is aimed at the specified loads.
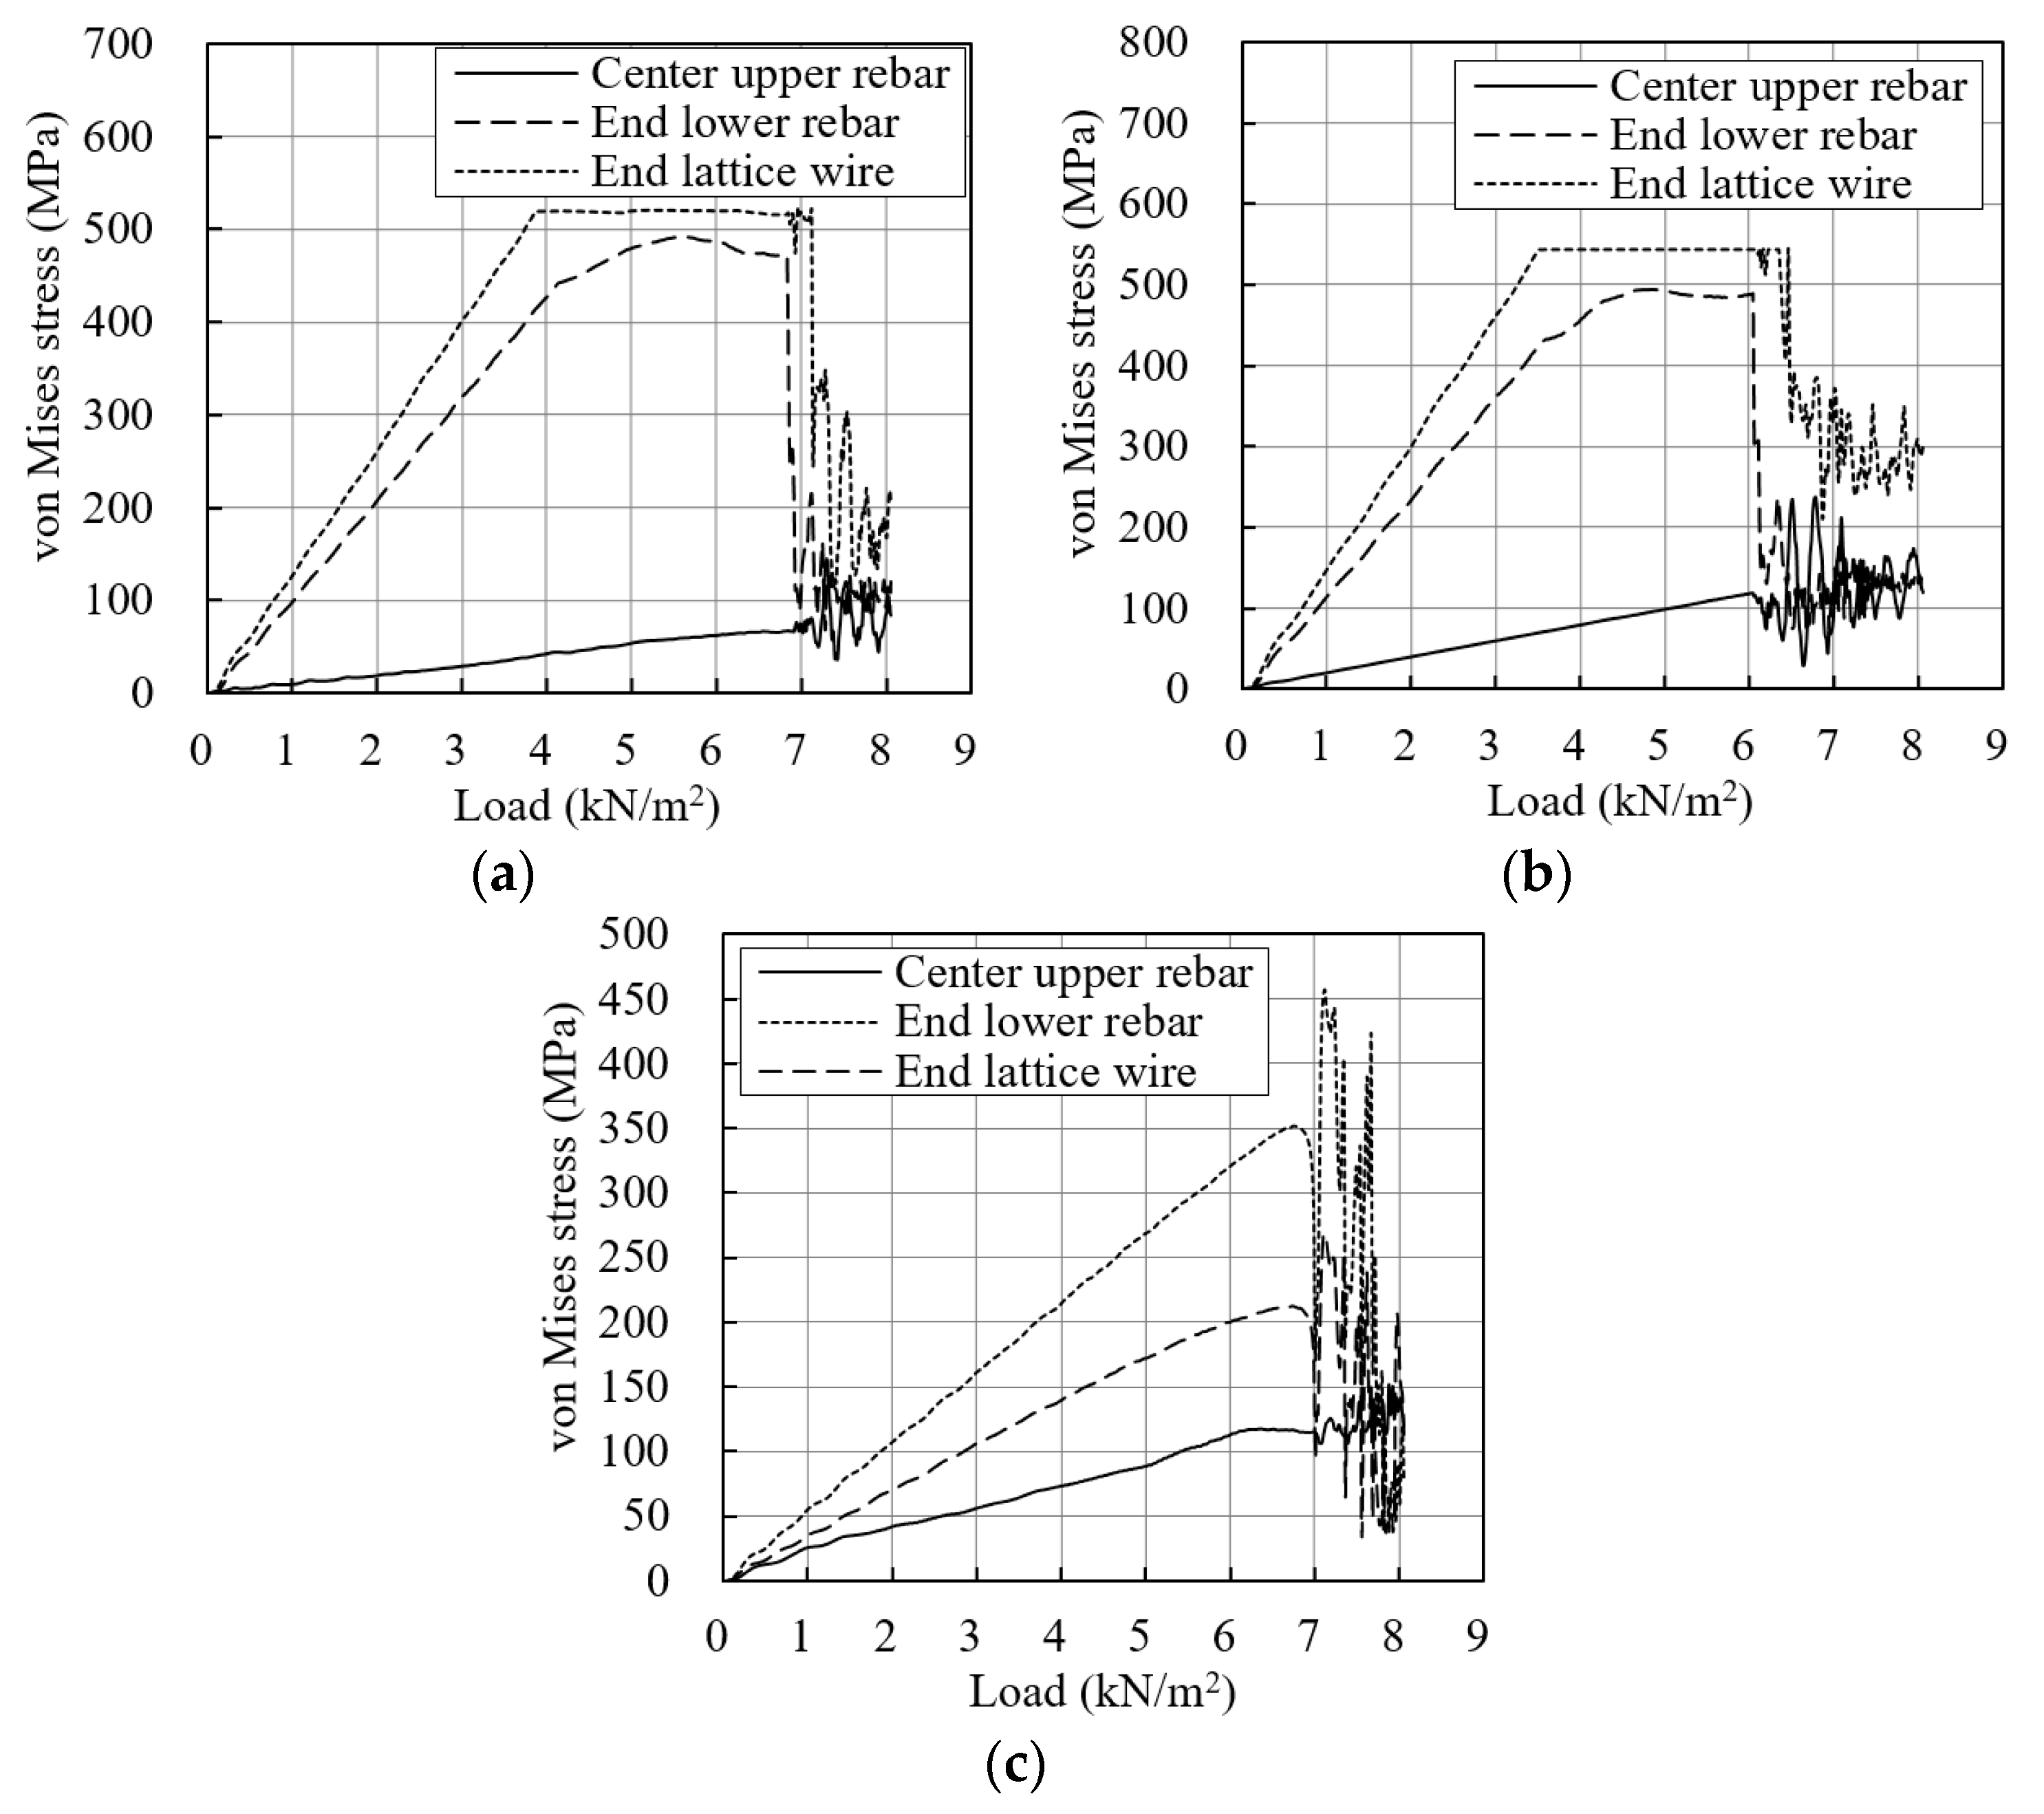
- A few test specimens failed due to the buckling of the center upper rebar, but the relevant numerical results indicate that the specimens can show different failure modes of the buckling of the lower rebar and the lattice steel wire near the end, noting that the test specimens were loaded using the step-by-step loading method conservatively from the center to the ends.
- The test results showed that the welding issues between the deck plate and truss girder can be resolved with the bolted system, but other welding problems in the region of joints between the lower rebar and lattice steel wire can be posed, even though the welding failures occurred after the specified loads. Stress localization was also observed in the numerical simulations in the locations of the welding failures in the tests, which indicates that the details in these areas need to be modified to improve the structural performance of the proposed deck-plate system.
Author Contributions
Funding
Conflicts of Interest
References
- Moon, T.S.; Bae, J.W. An analytical study on the structural behavior of the composite slab with new-shaped deckplate. J. Korean Soc. Steel Constr. 1999, 11, 181–190. [Google Scholar]
- Choi, S.-M.; Tateishi, K.; Uchida, D.; Asano, K.; Kobayashi, K. Fatigue strength of angle shape shear connector used in steel-concrete composite slab. Int. J. Steel Struct. 2008, 8, 199–204. [Google Scholar]
- Kim, Y.-J.; Oh, S.-H.; Yoon, M.-H.; Lee, Y.-H.; Kim, H.; Byon, E. Experimental investigation of deck plate system with non-welding truss type deformed steel wires (TOX deck plate slab). Int. J. Steel Struct. 2009, 9, 315–327. [Google Scholar] [CrossRef]
- Ko, T.-H.; Yoon, J.-H.; Seo, D.-W.; Chang, K.-K. Structural behavior evaluation of deck plate slab with inverted triangle truss type bar. In Proceedings of the Annual Conference of the Architectural Institute of Korea, Seoul, Korea, 23 October 2010. [Google Scholar]
- Kang, M.-J.; Kim, S.-S. Structural Performance Evaluation of Steel Wire-Integrated Deck Plate according to the Construction Load. J. Archit. Inst. Korea 2015, 31, 3–12. [Google Scholar]
- Oh, S.H.; Kim, Y.J.; Yoon, M.H. Test on the structural performance of the TOX deck plate-evaluation of structural safety during construction stage. J. Korean Soc. Steel Constr. 2008, 20, 701–709. [Google Scholar]
- Kim, Y.-J.; Chai, H.-S.; Kim, W.-J. A study of the experimental for the shear bond strength of deck plate composite slabs. J. Archit. Inst. Korea 2005, 25, 237–240. [Google Scholar]
- Lee, S.-K.; Lee, Y.-J. An evaluation of structural safety for steel wire-integrated deck plate system. J. Archit. Inst. Korea 2007, 23, 43–50. [Google Scholar]
- Lee, Y.-J.; Yoon, S.-C. Development of steel wire-integrated deck plate applicable to slab with 180 mm thickness. J. Korean Inst. Struct. Maint. Insp. 2012, 16, 89–98. [Google Scholar]
- Kim, S.-B.; Kang, M.-J.; Hwang, B.-C.; Kim, S.-S. Structural performance evaluation for steel wire-integrated deck plate according to the diameter of the lattice bar. J. Korean Soc. Hazard Miti. 2014, 14, 1–9. [Google Scholar]
- Lee, K.-J.; Kim, W.-Y.; Jung, J.-W.; Kim, E.-K.; Yang, I.-S. Structural performance of RC slab using steel wire integrated deck plate. In Proceedings of the Annual Conference of the Architectural Institute of Korea, Seoul, Korea, 21–23 June 2014. [Google Scholar]
- Lee, Y.-J.; Yi, W.-H. The study of corrosion for steel wire-integrated deck plate. J. Archit. Inst. Korea 2009, 25, 137–144. [Google Scholar]
- Jung, H.-S.; Choi, C.-S.; Choi, Y.-S. A study on the improvement of construction performance for removable form deck plate method. In Proceedings of the Korea Concrete Institute 2017 Fall Conference, Seoul, Korea, 1–3 January 2017. [Google Scholar]
- LSTC. LS-DYNA Keyword User’s Manual; Livermore Software Technology Corporation: Livermore, CA, USA, 2018. [Google Scholar]
- LSTC. LS-DYNA Theory Manual; Livermore Software Technology Corporation: Livermore, CA, USA, 2006. [Google Scholar]
- AIK. Standard and Commentary for Composite Metal Deck Slab System Design; Architectural Institute of Korea: Seoul, Korea, 1998. [Google Scholar]
- ASCE. Standard for the Structural Design-Composite Slabs, ANSI-ASCE3-91; ASCE: Reston, VA, USA, 1992. [Google Scholar]
- KATS. Low Carbon Steel Wires, KS D 3552; Korean Agency for Technology and Standards: Eumseong-gun, Korea, 2014.
- KATS. Hot-Dip Zinc-Coated Steel Sheets and Coils, KS D 3506; Korean Agency for Technology and Standards: Eumseong-gun, Korea, 2016.
- Lee, J.-E. Performance Evaluation of Bolt Joint Type Removable Truss Deck Plate for Field Application. Ph.D. Thesis, Department of Architectural Engineering, Catholic Kwandong University, Gangneung, Korea, 2015. [Google Scholar]
- Erhart, T. Review of solid element formulations in LS-DYNA, LS-DYNA. In Proceedings of the LS-DYNA Developers’ Forum, Stuttgart, Germany, 12 October 2011. [Google Scholar]


| No | Specimen ID | Upper Rebar (mm) | Lower Rebar (mm) | Lattice Steel Wire (mm) | Depth (mm) | Span (mm) |
|---|---|---|---|---|---|---|
| 1 | 135-ED1-3.2A | 10 | 8 | 5 | 135 | 3200 |
| 2 | 135-ED1-3.2B | 10 | 8 | 5 | 135 | 3200 |
| 3 | 150-ED3-3.8A | 13 | 8 | 5 | 150 | 3800 |
| 4 | 150-ED3-3.8B | 13 | 8 | 5 | 150 | 3800 |
| 5 | 200-ED5-4.5A | 13 | 13 | 6 | 200 | 4500 |
| 6 | 200-ED5-4.5B | 13 | 13 | 6 | 200 | 4500 |
| Specimen Type | Clear Span (mm) | Construction Load (kN/m2) | |||
|---|---|---|---|---|---|
| Self-Weight of Deck Plate | Self-Weight of Concrete | Workload | Total | ||
| 135-ED1-3.2 | 3100 | 0.25 | 3.10 | 1 | 4.35 |
| 150-ED3-3.8 | 3700 | 0.25 | 3.45 | 1 | 4.70 |
| 200-ED5-4.5 | 4400 | 0.25 | 4.60 | 1 | 5.85 |
| Coupon | Diameter/Thickness (mm) | Steel Type | Yield Strength (MPa) | Yield Strain (10−6) | Tensile Strength (MPa) | Elongation (%) |
|---|---|---|---|---|---|---|
| Upper/Lower rebar | 13 | SWM-R | 548 | 2330 | 693 | 12.8 |
| Upper rebar | 10 | SWM-R | 628 | 2700 | 713 | 12.0 |
| Lower rebar | 8 | SWM-R | 542 | 2680 | 582 | 13.3 |
| Lattice steel wire | 5 | SWM-P | 532 | 2560 | 582 | 22.7 |
| 6 | SWM-P | 519 | 2560 | 624 | 17.8 | |
| Steel sheet | 0.5 | SGC 570 | 464 | 2320 | 546 | 24.3 |
| Specimen ID | Construction Load (kN/m2) | Measured Deflection (mm) | Design Deflection (mm) | Measured/Design (%) | Residual Deflection (mm) | Restoration Rate (%) | Max Load (kN/m2) | |
|---|---|---|---|---|---|---|---|---|
| Planned | Measured | |||||||
| 135-ED1-3.2A | 4.35 | 4.38 | 20.5 | 25.5 | 80 | 0.57 | 97.2 | 6.84 |
| 135-ED1-3.2B | 4.35 | 4.38 | 23.0 | 25.5 | 90 | 0.40 | 98.3 | 6.84 |
| 150-ED3-3.8A | 4.70 | 4.70 | 27.3 | 28.5 | 96 | 0.52 | 98.1 | 7.57 |
| 150-ED3-3.8B | 4.70 | 4.70 | 24.4 | 28.5 | 86 | 0.01 | 99.9 | 8.59 |
| 200-ED5-4.5A | 5.85 | 5.90 | 26.1 | 32.0 | 82 | 0.07 | 99.7 | 8.64 |
| 200-ED5-4.5A | 5.85 | 5.90 | 22.4 | 32.0 | 70 | 0.23 | 99.0 | 8.86 |
| Specimen ID | Measured Construction Load (kN/m2) | Measured Deflection (mm) | Numerical Deflection (mm) | Design Deflection (mm) |
|---|---|---|---|---|
| 135-T1-3.2A | 4.38 | 20.5 | 22.5 | 25.5 |
| 135-T1-3.2B | 4.38 | 23.0 | 25.5 | |
| 150-T3-3.8A | 4.70 | 27.3 | 23.0 | 28.5 |
| 150-T3-3.8B | 4.70 | 24.4 | 28.5 | |
| 200-T5-4.5A | 5.90 | 26.1 | 22.0 | 32.0 |
| 200-T5-4.5A | 5.90 | 22.4 | 32.0 |
| Specimen ID | Test Specimens | Numerical Models |
|---|---|---|
| 135-ED1-3.2A | Buckling of upper truss near the center | Buckling of lower truss and lattice near the end |
| 135-ED1-3.2B | Buckling of upper truss near the center | |
| 150-ED3-3.8A | Buckling of lattice steel wire near the end | Buckling of lower truss and lattice near the end |
| 150-ED3-3.8B | Buckling of upper truss near the center | |
| 200-ED5-4.5A | Welding failure at joints between the bottom rebar and lattice steel wire | Buckling of lower truss and lattice near the end |
| 200-ED5-4.5A | Welding failure at joints between the bottom rebar and lattice steel wire |
© 2019 by the authors. Licensee MDPI, Basel, Switzerland. This article is an open access article distributed under the terms and conditions of the Creative Commons Attribution (CC BY) license (http://creativecommons.org/licenses/by/4.0/).
Share and Cite
Shin, J.; Lee, J.; Lee, Y.; Kim, B. Experimental and Numerical Investigation on Structural Performance of Steel Deck Plate Bolted with Truss Girder. Appl. Sci. 2019, 9, 3166. https://doi.org/10.3390/app9153166
Shin J, Lee J, Lee Y, Kim B. Experimental and Numerical Investigation on Structural Performance of Steel Deck Plate Bolted with Truss Girder. Applied Sciences. 2019; 9(15):3166. https://doi.org/10.3390/app9153166
Chicago/Turabian StyleShin, Jinwon, Jineung Lee, Yongjae Lee, and Byungyun Kim. 2019. "Experimental and Numerical Investigation on Structural Performance of Steel Deck Plate Bolted with Truss Girder" Applied Sciences 9, no. 15: 3166. https://doi.org/10.3390/app9153166
APA StyleShin, J., Lee, J., Lee, Y., & Kim, B. (2019). Experimental and Numerical Investigation on Structural Performance of Steel Deck Plate Bolted with Truss Girder. Applied Sciences, 9(15), 3166. https://doi.org/10.3390/app9153166