Abstract
Due to the potential of thermal storage being similar to that of the conventional battery, air conditioning (AC) has gained great popularity for its potential to provide ancillary services and emergency reserves. In order to integrate numerous inverter ACs into secondary frequency control, a hierarchical distributed control framework which incorporates a virtual battery model of inverter AC is developed. A comprehensive derivation of a second-order virtual battery model has been strictly posed to formulate the frequency response characteristics of inverter AC. In the hierarchical control scheme, a modified control performance index is utilized to evaluate the available capacity of traditional regulation generators. A coordinated frequency control strategy is derived to exploit the complementary and advantageous characteristics of regulation generators and aggregated AC. A distributed consensus control strategy is developed to guarantee the fair participation of heterogeneous AC in frequency regulation. The finite-time consensus protocol is introduced to ensure the fast convergence of power tracking and the state-of-charge (SOC) consistency of numerous ACs. The effectiveness of the proposed control strategy is validated by a variety of illustrative examples.
1. Introduction
In recent years, frequency fluctuations have become incrementally more severe with the high penetration of renewable energy integrated to the grid. This brings significant challenges to reserve regulation and frequency control [1,2]. Traditionally, frequency deviations are only compensated by the frequency control action of regulating generators, thus wear-and-tear costs of generators are aggravated significantly. With the persistent development of smart grids, the end user loads, which in the past were considered to be inelastic, have considerable potential to participate in future ancillary services. Developments in two-way communication networks and advanced metering infrastructure enabled demand response (DR) to provide reliable contingency reserves relieve the mechanical stress on regulating generators and reduce the operation costs of utilities [3,4].
Among the resources on the demand side, air conditioning (AC) has attracted significant interest. As a considerable portion of building electrical consumption, AC could be shifted by control signals and maintain occupant comfort within a reasonable range. With the continuous improvement of technology, AC compressors have evolved from fixed speed to variable speed, namely to inverter AC. Due to higher energy efficiency than fixed frequency AC, inverter AC has raised a significant share in the flexible loads [5]. However, the existing research focused on the control strategies of fixed frequency AC, which is not suitable for inverter AC.
Compared to conventional generators, the individual AC has a small capacity and is not competent enough to participate in frequency control. This requires the application of aggregation technologies to intensify the collective performance of numerous ACs. Much work has been done to investigate aggregation strategies, which are generally categorized into two exclusive clusters. Derived of equivalent thermal parameters (ETP), one cluster of aggregation methods is to analyze the transition process of the temperature and switching evolution. The on/off states of the AC population are generated to provide an overall quantification of the collective performance of aggregated ACs [6,7]. Liu and Shi proposed a 2-D state bin model and utilized model predictive control to obtain the optimal control actions for AC [8]. Uncertainties regarding customer behaviors are taken into consideration in the state queuing model [9]. Meng et al., developed the modified model embedded in compressor time delays to enhance collective AC performance [10]. Although massive studies on state space models have been carried out, heavy communication requirements between the control center and thermostatic control loads (TCLs) are introduced to ensure the accuracy of the dynamic model. Methods of balancing the number of AC switching states and modeling accuracy are seldom documented in the existing literature. The second cluster of aggregated methods is to characterize the flexibility of ACs as a ‘virtual battery’ [11,12]. Similar to the traditional battery, thermal energy can be stored by the thermodynamic transition process in a building. A leaky storage model is proposed to model the flexibility of heterogeneous ACs [13]. The work of Hao et al. presents a succinct model of stochastic dissipation storage and has established the direct load control framework for an ancillary service. Based on [14], Zhao et al. developed a geometric method to characterize admissible power profiles of individual ACs [15]. A thermal battery model of the AC system and the related dispatch model is proposed [16]. The comparison between the proposed thermal battery model and the conventional battery model is presented in detail. Nevertheless, the above studies focus on the application of the virtual battery model on dispatch optimizations, which is not suitable for real-time frequency control. The dynamic characteristic of energy storage modeling needs further investigation.
In terms of control methods, there are three main ways for aggregated flexible resources to participate in frequency regulation. As a main category of control methods, the centralized control architectures of flexible loads are developed for frequency regulation [17]. A centralized control framework embedded with a master–slave protocol is proposed for compensating frequency deviation [18]. A priority-stacks centralized control scheme is proposed for the selection of on/off state [19]. Nevertheless, under the condition that a large number of flexible loads are integrated in the coordinated control architecture, the centralized control is deprived of handling the computational expenses and the protection of consumer privacy.
Unlike the centralized control strategy, decentralized control strategies depend on instantaneous information metered by local measurement unit instead of explicit communications [20]. A decentralized control strategy is proposed to optimize the charging rates of electric vehicles [21]. The flexible loads are aggregated close to a regulation generator through a decentralized frequency control scheme [22]. Although the communication network is simplified by the local measurement, the decentralized approaches fail to handle system operational constraints in the local decision process.
In order to overcome the drawbacks of centralized controls and decentralized control methods, distributed control schemes are established as alternative methods. In this control scheme, all decisions of the individual TCL are made locally based on communication with its neighbor and the agents of aggregated loads refine the control decisions iteratively by exchanging the control decisions with their neighbor agents. That simplifies the communication network and is definitely appropriate for coordinating distributed resources with participation in the frequency regulation [23]. However, this control strategy requires the power tracking and energy balancing for fair utilization of available resources. The first application of the control algorithm is distribution networks voltage control incorporated into large-scale energy storage systems and photovoltaic systems [24,25]. Hu et al., developed the distributed pinning control framework embedded with a leader-following communication protocol [26]. A compound distributed control strategy by a combination of model predictive control and consensus control strategy is designed [27]. In order to improve the convergence of the frequency control method, the finite-time consensus protocol has been coupled with the distributed control strategy [28]. Due to a lack of dynamic frequency behaviors in inverter ACs, the finite-time consensus approach has rarely been utilized to control both the power outputs and energy states for aggregated ACs in current studies.
Compared with previous research, the main contributions of this paper are as follows:
- (1)
- A comprehensive derivation of the virtual battery model of inverter ACs is developed based on the ETP model, which contributes to the practical application of inverter ACs for ancillary services. To the authors’ knowledge, this is the first published model mentioning the dynamic characteristic of aggregated inverter ACs for frequency regulation.
- (2)
- A distributed control framework is established to integrate the aggregated ACs into the conventional control. A well-designed control strategy is proposed on the basis of an adjustable control error based on unit capacity (UPCE), which significantly improves the control performance with the participation of heterogeneous ACs.
- (3)
- A distributed pinning control algorithm is developed to coordinate the numerous ACs. The desired dynamic performance, which refers to the convergence of power tracking and state-of-charge (SOC) balancing of inverter ACs, is ensured by the finite-time consensus protocol.
2. Virtual Battery Model of Individual Inverter AC
2.1. Equivalent SOC of Inverter AC
As a widely accepted thermodynamic model, the ETP model is employed to elaborate on the thermodynamic transition process and the dynamic characteristic of an AC system in a building. The fundamental mathematical model of ETP is shown in Equation (1):
where, is equivalent thermal capacity, is indoor temperature at tth period, is outdoor temperature, is equivalent thermal resistance, is heat power of equipment, is the cooling power of inverter AC at tth period.
The AC system serves as virtual energy storage, wherein the energy is stored in the form of thermal energy. Taking the consumers’ comfort into consideration, the indoor temperature is controlled within a reasonable range . It is assumed that is the benchmark of indoor temperature and the maximum of stored energy can be obtained under the minimum of the indoor temperature. Thus, the capacity of the stored energy is formulated as follows:
where TE denotes the capacity of the stored energy.
Similarly, when the indoor temperature is , the current energy state can be calculated as follows:
where refers to current energy state at tth period.
Similar to the soc of a conventional lithium-ion battery, the soc of inverter ACs is described as follows:
where is equivalent to the soc of inverter AC at tth period.
When indoor temperature is initialized as , the initial state of soc can be formulated as follows:
2.2. Virtual Battery Model of Inverter AC
In the inverter AC, the power consumption of the compressor operation accounts for the majority of power consumption. The relationship between the electric power and the frequency of the compressor can be simplified to a linear formulation [16]:
where is electric power of inverter AC at tth period, denotes frequency of the compressors at tth period, refer to constant coefficients of the inverter AC.
In a similar form of , the cool power of inverter AC system can be formulated as follows:
where refer to constant coefficients of the inverter AC.
Considering (6) and (7), the linear relationship between and can be presented as:
Considering (7), at the initial temperature with no external control signals, the baseline of electric power is represented as follows:
where refers to baseline of cool power.
Substituting (8) and (9), the benchmark of electric power can be depicted as:
where refers to the baseline of electric power.
Considering the control signals from the control center, the power deviation of electric power is considered as the charge/discharge power [13], which is given as follows:
where is charge/discharge power at tth period.
Considering (8) and (10), can be reformulated as:
Substituting (4), (5) and (12) into (1), the dynamic behaviors related to SOC can be calculated as:
Similarity in the form of (1) and (13) provides an intuitionistic form to describe the update process of SOC. The dynamic behavior of individual ACs is developed by Equation (13) and the related state-space model can be established for real-time frequency control. Moreover, the discrete solution of formulation (13) can be utilized for dispatch optimization. Proof can be given as follows.
By solving (1), is calculated as:
In the same manner, the discretization form of virtual SOC of individual AC can be formulated, the validity of which the formulation can be verified by another derivation method proposed in [16]:
where refers to auxiliary variables in the discrete solution.
3. Hierarchical Frequency Control Scheme
In a realistic power grid, individual AC has a small capacity, which is inadequate to participate in the secondary frequency control of an interconnected system. To circumvent this problem, the coordinated control strategy is proposed in this paper to contribute to the regulation flexibility of distributed AC systems.
3.1. Overview of Hierarchical Control Scheme
The block diagram of hierarchical coordinated control framework is shown as Figure 1. In this paper, the inverter ACs are integrated into traditional automatic generation control (AGC), whereby both inverter AC and regulation generators participate in secondary frequency control and other regulation resources are assumed to have no available capacity.
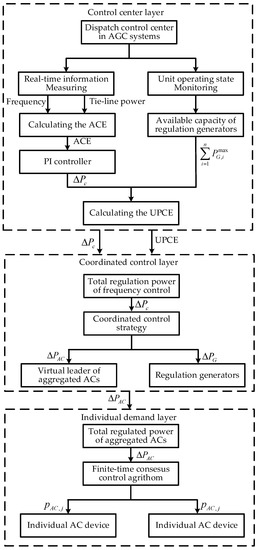
Figure 1.
Hierarchical frequency control scheme. AGC—automatic generation control; ACE—area control error; PI—proportional integral; UPCE—an adjustable control error based on unit capacity; AC—air conditioning.
The coordinated control scheme is stratified into three control layers: the control center layer, the coordinated control layer and individual demand layer. The operating states of the large-scale interconnected power grid are monitored by the control center in real time, especially the frequency and tie-line power. Area control error (ACE) can be calculated as the core indexes for the evaluation of system security. Based on ACE, the total regulation power can be obtained through the PI controller. Taking the system operating states and available generator capacity into consideration, UPCE is calculated to evaluate the available ability of traditional regulation generators. Both UPCE and the total regulation power are delivered to the next level. The coordinated control layer mainly contains two categories of dispatchable units: regulation generators and the aggregated agents of numerous ACs. According to the proposed coordinated control strategy, the control signals from the upper level are allocated to dispatchable units. Due to the relatively small capacity of individual AC devices, the virtual leaders are employed to receive allocated control signals and send the control signal to the individual ACs. The communication network including the numerous ACs is taken into consideration in the individual demand layer. The distributed pinning consensus control strategy is conducted for fair participation of heterogeneous ACs. Compared with the commonly utilized consensus approach, the finite-time control protocol is appended to significantly improve the convergence of the proposed distributed pinning control strategy [29].
Compared with existing studies, there are two highlights of this paper: (i) an adjustable control performance index and the related coordinated control strategy are developed to incorporate multiple dispatchable units; (ii) a distributed pinning finite-time consensus control algorithm is introduced to control a large population of individual ACs. The detailed exposition is implemented in the following subsections.
3.2. Coordinated Control Strategy
Traditionally, the power balance of a power system is maintained by AGC in real-time. The available reserve of regulation generators account for a large proportion of the available capacity. The positive deviation from the frequency benchmark incurs the reduction of the power output of generators. Otherwise the negative deviation from the frequency benchmark incurs the increase of power output. Considering the participation of flexible load in supplementing frequency, the allocation methods of control signals is the key of the coordination control scheme. Based on a conventional ACE calculated by system frequency deviation and tie-line power, the widely utilized approach for frequency allocation is a distribution factor predefined by the operator. The traditional allocation methods are incapable of handling the inadequacy of regulation reserve capacities and the deterioration of frequency control performance. A modified control strategy is partitioned into multiple control zones based on absolute value of ACE, which overcomes the deficiency of traditional distribution factors in a certain sense but the distribution factor in the same control area remains constant. That requires an adjustable frequency control performance and the corresponding allocation strategy.
In the tie-line bias control, ACE can be calculated as follows:
where refers to frequency bias factor, denotes frequency deviation at tth period, refers to tie-line power fluctuation at tth period.
As the common frequency control strategy, the PI control method is employed to mitigate the frequency deviation. The total regulation power of secondary frequency control can be obtained as follows:
where is total regulation power at tth period, , denotes proportional gain and integral gain of PI Controller, respectively.
Considering the participation of demand-side resources, the traditional allocation method of fixed distribution factor can be modelled as follows:
where refers to regulation power of generators at tth period, is regulation power of inverter ACs at tth period, denotes allocation factor of generators and ACs.
Taking the regulation capacity of generators into consideration, UPCE can define the deviation between the absolute value of the allocated regulated power and total available reserve capacity of generators instead of the ACE:
where is maximum power of the ith generator.
The UPCE focuses on the evaluation of generator reserve adequacy instead of frequency deviation and tie-line power of the system, which represents the operation characteristics of power system more accurately. Derived from the mechanism of the divisional control, coordinated control methods are categorized into three control levels to cover certain rare albeit high-risk scenarios. Given refers to the threshold value of ACE, the dynamic allocation method based on UPCE is formulated as per Figure 2.
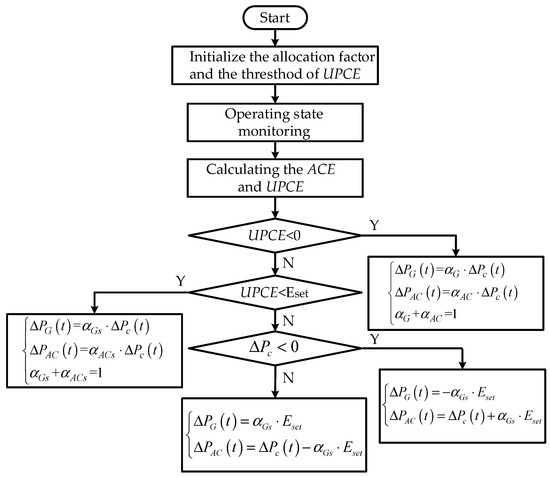
Figure 2.
The dynamic allocation method based on UPCE.
When , the total available reserve capacity of generators is adequate to compensate the frequency fluctuations and the allocation factor is predefined as the traditional allocation methods, which are formulated as the Equation (20):
When , the total available reserve capacity of generators is stripped of compensating the frequency deviation with the potential risk of capacity deficiency. That requires that the regulation generators decrease the allocation factor of frequency regulation. The allocation factor of regulation generators can be obtained as follows:
After determining the allocation factor of regulation generators, the allocation strategy can be formulated as follows:
When , the frequency deviation becomes more severe and the available capacities deficiency of generators is increasingly stressed in some extreme scenarios. Nevertheless, the adjustment of the allocation factor is not an economically efficient way to eliminate the high-frequency component of frequency fluctuation. The threshold crossing over is completely mitigated by the numerous ACs. Given the definition that , total available reserve capacity of generators is adequate, and the allocation factor is predefined by the traditional allocation methods.
3.3. Finite-Time Consensus Control Algorithom
Considering the communication between the coordinated control layer and individual demand layer, the communication network of numerous ACs can be depicted as a directed graph , which contains a sequence of nodes and a sequence of edges . In the directed graph, communication links are unidirectional, which means . Thus, an adjacency matrix can be obtained as follows:
where denotes the adjacent state of the non-root node.
Note that in the hierarchical control framework, the control signals are transmitted from the virtual leader of numerous ACs to individual ACs, whereby the virtual pinner serves as the root node in the communication. Thus, the matrix can be calculated as follows:
where denote the adjacent state of the root node.
Based on the mathematical property of the adjacency matrix [16], the convergence of the communication graph can be ensured by the property that there exists a root node in the communication graph and all the eigenvalues of the matrix have the positive real parts.
In the individual demand layer, a distributed pinning consensus algorithm is proposed to control each individual AC for fair participation in the secondary frequency control. That requires the power output of all individual ACs to be normalized and the power rating of the AC system to be introduced as follows:
where is the maximum power of the jth inverter AC, refers to power state of the jth AC at tth period.
According to the proposed virtual battery model in section II, the dynamic characteristics of the AC system can be established. In comparison with the first-order power equation in [26], the second-order different equation is proposed to describe the state of charge of AC system. Thus, the SOC of AC system can be formulated as follow:
The corresponding the energy state can be set equal to the SOC state and the dynamic characteristic of individual AC can be reformulated as follows:
where denotes energy state of the jth AC at tth period, is control signal of the jth AC.
Meanwhile, the reference values of the power state and the energy state can be updated by the distributed pinner in real-time, which serves as the virtual leader of the communication graph:
In comparison with conventional consensus algorithms, the finite-time approach is developed to ensure the convergence of the energy state and the power tracking in the individual demand layer:
where denote auxiliary variables in the consensus protocol.
4. Simulation Tests
A variety of scenarios are generated to verify the effectiveness of the proposed coordinated control framework. The proposed hierarchical frequency control scheme is simulated in Matlab/Simulink. To validate the superiority of the proposed control strategy, the system contingency condition and wind fluctuations have been taken into consideration. The simulation has been first utilized in single-area control system, and then extended to a two-area interconnected system. Specifically, the frequency stability of a single-area control system under system contingency is illustrated in Case 1. Case 2 illustrates the frequency performance of single control area under the condition of wind fluctuations. Case 3 demonstrates the effectiveness of the proposed allocation strategy compared with the widely accepted allocation strategy. In Case 4, the improved control performance is depicted in a two-area interconnected power system. The single-area system under consideration is a per-unit system with Sbase = 1000 MVA. The structure of single-area system is shown as Figure 3. The parameters of the two-area system are shown in Table 1. The parameters of inverter ACs are shown in Table 2. The total capacity of the aggregated ACs in Area 1 is 0.04 pu, and the capacity of individual ACs is respectively [0.0064, 0.006, 0.0056, 0.0052, 0.0048, 0.0044, 0.004, 0.0036] MWh. The AGC participation factors of ACs and generators and . The gain parameter of finite-time consensus control is set to be 0.2, 0.33, and 0.6, respectively. Note that all the simulation cases are conducted under the condition that the baseline power of units and ACs in the real-time schedule are neglected and the focus of numerous cases is the regulation of power in the frequency control.
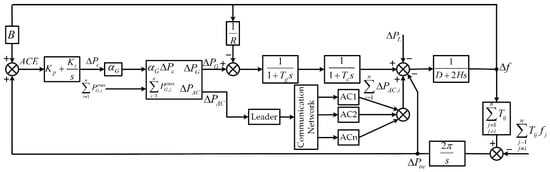
Figure 3.
The structure of a single-area system.

Table 1.
The parameters of a two-area power system.
Table 2.
The parameters of the inverter ACs.
4.1. System Contingency in Single Control Area
In this subsection, the dynamic frequency performance of the proposed control strategy is investigated under the condition of the step disturbance in a single-area power system. The total capacity of regulation generators in Area 1 is 0.21 p.u. The initial SOCs of all the individual ACs is respectively set as [0.46,0.47,0.48,0.49,0.51,0.52,0.53,0.54]. A step disturbance of a load with 0.21 p.u. at 810s is predefined to emulate the system contingency. A comparison of three control strategies is present to clarify the superiority of the proposed control strategy. For the sake of clarity, the frequency control strategies for comparison are numbered as follows:
- Control strategy 1: Conventional secondary frequency control without ACs.
- Control strategy 2: Secondary frequency control considering generators and ACs with a fixed distribution factor.
- The proposed coordinated control strategy
The system frequency responses under control strategy 1, control strategy 2 and the proposed control strategy are shown in Figure 4. Upon the occurrence of system contingency at 810s, there is an apparent tendency of the system frequency to decrease. Due to the inadequate capacity of the regulation generators, the control strategy without ACs has the inability to handle the frequency imbalance caused by step disturbance. Considering numerous ACs supplement the frequency control, frequency stability can be ensured by control strategy 2 and the proposed control strategy. In comparison with control strategy 2, it is observed that the frequency nadir is within the reasonable range (±0.2Hz) in the proposed control strategy.
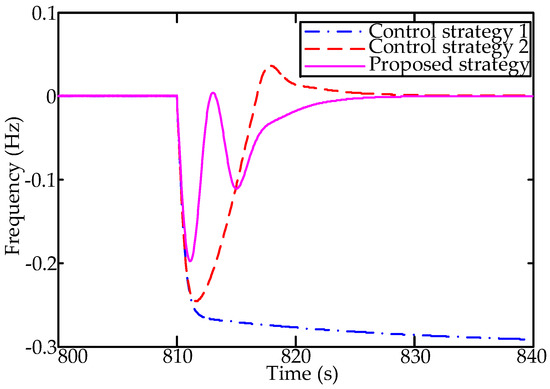
Figure 4.
The frequency response under different control schemes.
The power output of regulation generators and aggregated ACs under three control strategies are respectively shown in Figure 5 and Figure 6. Under different control strategies, the available regulation capacities of generators are limited in various levels during the time integral [810s-820s]. Among three control strategies, the deficiency of adjustable capacity in control strategy 1 is relatively severe. Comparatively, the capacity deficiency in proposed control strategy is relatively negligible with the participation of individual ACs. Correspondingly, it is observed from Figure 6 that among three control strategies, a sufficient contingency reserve is provided in the proposed control strategy during the transient disturbance. Recall that the frequency performance in the proposed control strategy outperforms the other control strategies as shown in Figure 4. This is mainly attributed to the fact that a hierarchical frequency control scheme is utilized to maximize the available capacity of heterogeneous ACs and relieve the regulation stress of generators.
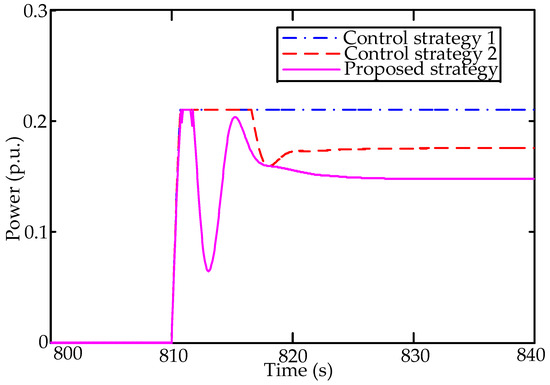
Figure 5.
The power output of regulation generators under different control schemes.
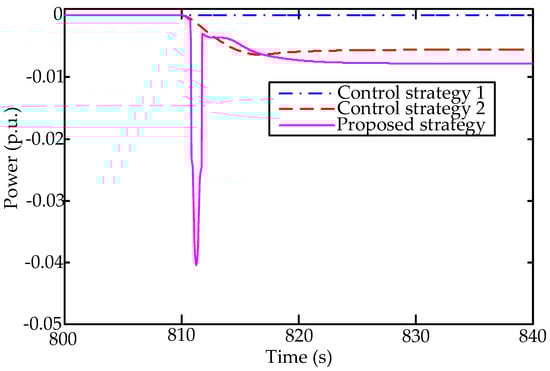
Figure 6.
The power output of aggregated ACs under different control schemes.
The simulation results of Case 1 are shown as Table 3. Compared to the control strategy 1 and control strategy 2, the maximum of the frequency deviation in the proposed strategy is scaled down effectively. From the viewpoint of the energy efficiency, the energy saving in the proposed control strategy is 17.6% compared to the control strategy 1. In comparison with control strategy 2, the enhancement in the energy efficiency is 4.4% in the proposed strategy.
Table 3.
Simulation results of Case 1.
To illustrate the consensus state of heterogeneous ACs, the power state and energy state of all the individual ACs under three control strategies are respectively shown in Figure 7 and Figure 8. Due to the inequality of the energy state, it is clear seen from Figure 7 that each virtual battery of individual AC charges or discharges to achieve the consensus state of AC systems. As a result, the consistency of energy state and power tracking are accomplished in finite-time. After the occurrence of system contingency, all the individual ACs attempt to supply the power deficiency by discharging. Consequently, the virtual SOC of AC systems continues to decrease, which contributes to the recovery of system frequency. With the finite-time consensus control algorithm, the new convergence of both power state and energy state is fulfilled within 15 s.
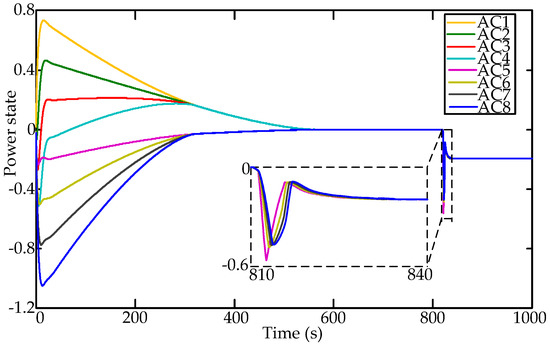
Figure 7.
The power states of all individual ACs.
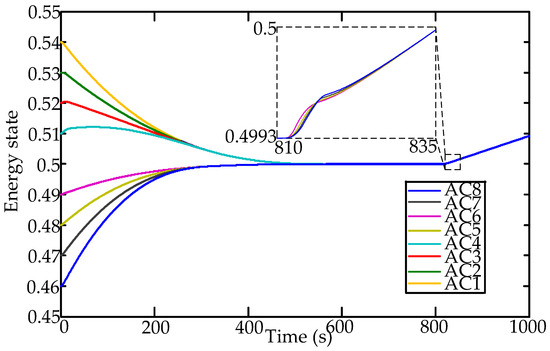
Figure 8.
The energy states of all individual ACs.
4.2. Effectiveness of the Proposed Allocation Strategy
To further investigate UPCE and the dynamic allocation method in the proposed control scheme, three allocation strategies are presented to demonstrate the performance of frequency regulation. For the sake of clarity, the allocation strategies for comparison in Case 2 are numbered as control strategy 3 and control strategy 4.
- Control strategy 3: The piecewise allocation method proposed in [4] is utilized based on ACE and the distribution factor is fixed in the same control area.
- Control strategy 4: The hybrid allocation method proposed in [28] is introduced. The distribution factor of generators is fixed as the traditional allocation strategy. The frequency control signal of AC system contains two parts: 1) the distribution factor of individual ACs in the control strategy 2; 2) the out-of-limit over maximum capacities of generators.
- The proposed coordinated control strategy
The system frequency responses under control strategy 3, control strategy 4 and the proposed control strategy are shown in Figure 9. As Figure 9 illustrates, the frequency nadir and the frequency recovery are inferior to the last two control strategies. That is mainly attributed to the fact that control strategy 3 depends on the absolute value of ACE instead of UPCE.
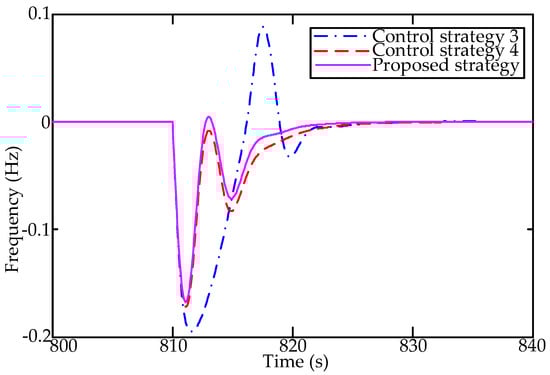
Figure 9.
The frequency response under different allocation strategies.
The total power output of regulation generators and aggregated ACs under three control strategies are respectively shown in Figure 10 and Figure 11. The power output of generators reaches the maximum of available capacity of generators during the time interval [811s–817s], which is prominently longer than the last two control strategies. The sharp increase in AC systems for frequency deviation is obviously hysteretic. In comparison with the proposed control scheme, control strategy 4 has a larger frequency nadir and slower frequency recover speed. The reason behind this is that individual ACs play an important role only under the condition that the allocation power exceeds the limits of regulation generators. In the proposed control scheme embedded with an UPCE and associated allocation factors, the maximum of frequency deviation is within the reasonable range and the frequency fluctuation is mitigated within seconds.
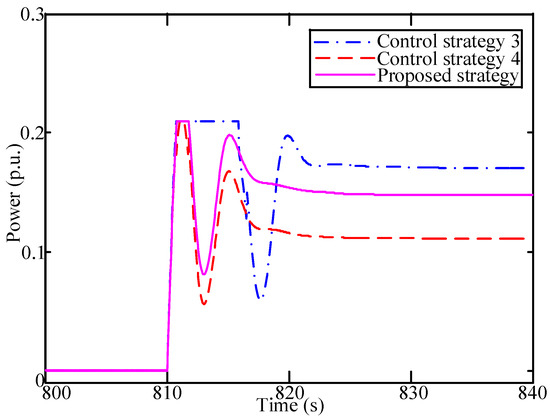
Figure 10.
The power output of regulation generators under different allocation strategies.
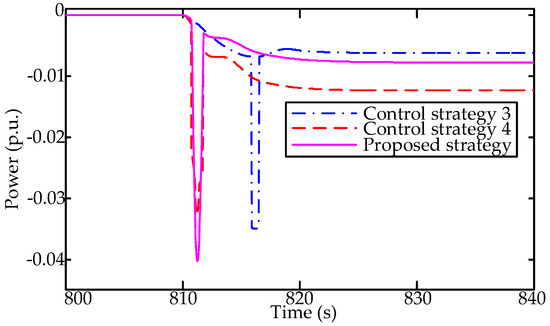
Figure 11.
The power output of individual ACs under different allocation strategies.
4.3. Persistent Fluctuation of Wind in Single Control Area
In this subsection, a wind fluctuation study is conducted to further investigate the dynamic control performance of the proposed coordinated control framework. The same single area system is taken into consideration as in test Case 1. The 10-min wind variation profiles used in this case are shown in Figure 12. The wind power data with 1-s resolution is measured on June 2012 by EPRI [30]. Control strategy 3 and 4 in Case 2 are conducted for comparison.
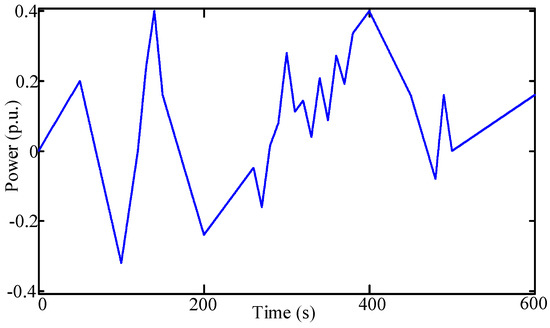
Figure 12.
Ten-minutes wind variation profiles.
The system frequency responses under control strategy 3, control strategy 4 and the proposed control strategy are shown in Figure 13. As the Figure 13 shows, there is a fierce fluctuation of wind power within 10 min. As a result, there is a persistent fluctuation of system frequency. That requires the participation of aggregated ACs in the frequency regulation. Compared with other control strategies, it can be observed that frequency imbalances are eliminated much more effectively, and the frequency nadir can be maintained within the allowable range (±0.2Hz) with the proposed method.
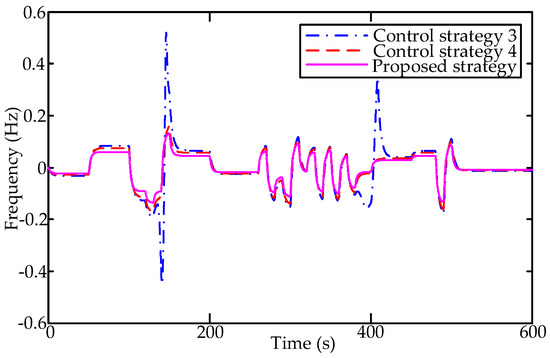
Figure 13.
The frequency response under different control schemes.
The total power output of regulation generators and aggregated ACs under three control strategies are respectively shown in Figure 14 and Figure 15. Under the condition that the fluctuation of wind power is relatively small, the frequency deviation can be compensated by dispatchable resources under three control strategies. Among three control strategies, the proposed control strategy has better control performance. When the power imbalance of wind power is significant, it is observed that regulation generators reach the maximum of available capacity in control strategy 3. Similar to control strategy 3, control strategy 4 relies heavily on the regulation capacity of conventional generators and does not take full advantage of adjustable capacity of heterogeneous ACs. Different from other control strategies, the regulation potential of inverter ACs is fully realized through UPCE in the proposed control framework. The available capacities in the proposed control strategy are competent enough to eliminate frequency deviation.
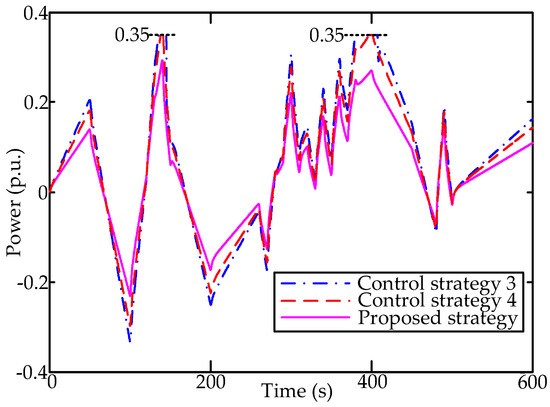
Figure 14.
The power output of regulation generators under different control schemes.
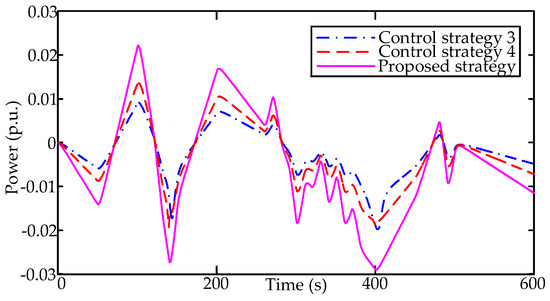
Figure 15.
The power output of individual ACs under different control schemes.
The power state and energy state of all the individual ACs under the condition of wind fluctuations are respectively shown in Figure 16 and Figure 17. Due to the fierce fluctuations of wind power, it is observed from Figure 16 that each virtual battery of individual AC charges or discharges more frequently to response the frequency deviation in real-time. Meanwhile, the power outputs of all the individual ACs are in proportion to the associated capacities for fair participation. As Figure 17 shows, the SOCs of all the individual ACs remain consistent during the fluctuation of wind power.
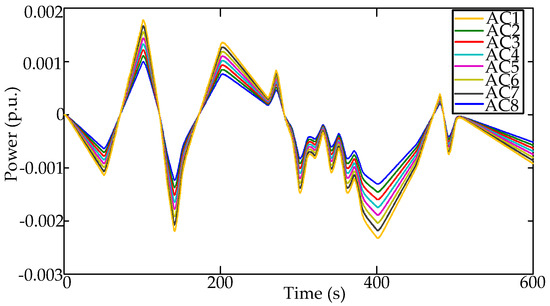
Figure 16.
The power states of all the individual ACs.
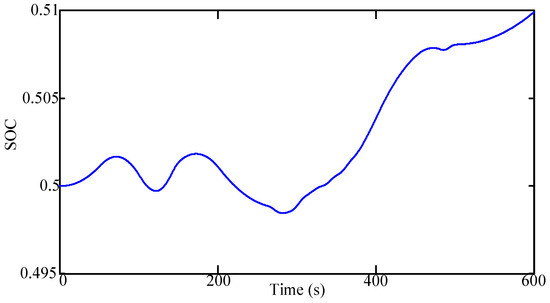
Figure 17.
The energy states of all the individual ACs.
4.4. System Contingency in Two-Area Control Areas
To further investigate the control performance of the proposed method, the simulation of the distributed pinner control scheme is extended to the two-area interconnected power system in Case 4. It is assumed that the available capacity of aggregated ACs is 0.04 p.u. in Area 1 and there are no inverter ACs in Area 2. There is a step disturbance of 6.4 MW at 0 s in area 1. Control strategy 1 and Control strategy 2 are utilized for the comparison. Other parameters of simulation texts are the same as in Case 1.
The frequency responses in Area 1 and Area 2 are illustrated as Figure 18 and Figure 19, respectively. As Figure 18 shows, the sudden step disturbance will have a substantial impact not only on the local control area, but also on the interconnected control area. Without the participation of the AC systems, there is no sufficient available capacity to compensate the step disturbance in control strategy 1. In control strategy 2, there still exists the frequency fluctuation in small increments during the period [90,95]. Comparatively, the frequency stabilities of each area can be achieved in the proposed control scheme.
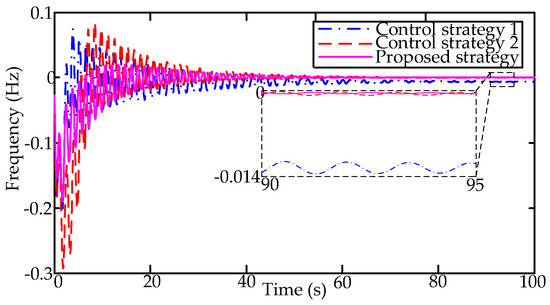
Figure 18.
The frequency response in Area 1.
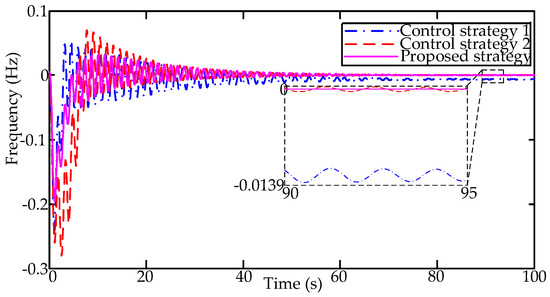
Figure 19.
The frequency response in Area 2.
Figure 20 illustrates the tie-line power between Area 1 and Area 2. As shown in Figure 20, the fluctuation of tie-line power is derived of being eliminated and back to zero, which has the same tendency as the frequency. Compared with control strategy 2, the tie-line power between two control areas can be improved with finite-time consensus-based ACs.
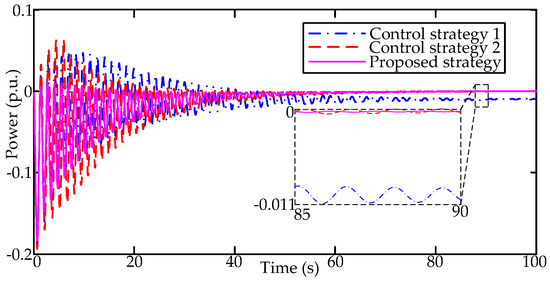
Figure 20.
The tie-line power between Area 1 and Area 2.
5. Conclusions
A hierarchical distributed control scheme integrated with inverter ACs and conventional generators is established. Adjustable control performance indices, namely UPCE and the associated coordinated control strategies, are developed to refine frequency control performance. In order to achieve the consensus of power tracking and SOC balancing, the distributed pinning control algorithm coupled with a finite-time consensus protocol has been proposed to aggregate numerous inverter ACs in the same control area.
The simulation results of numerous examples have demonstrated that the frequency response of the power system can be improved by the proposed coordinated control scheme. The proposed distributed control framework is effective for both power system contingency and wind fluctuations. Meanwhile, the tracking of frequency control signals and the SOC consistency of individual ACs can be achieved in finite-time. Different allocation strategies are introduced for comparison to verify the effectiveness and necessity of the proposed coordinated control method. It is validated by the simulation results that the proposed distributed pinning control framework is an effective way to incorporate widespread inverter ACs for secondary frequency control of a power system.
Future focus will be on the hierarchical control strategies incorporated into more dispatchable resources. Novel allocation strategies and the uncertainties of frequency regulation will be explored.
Author Contributions
J.Y. proposed the research topic, designed the research, carried out data analysis and prepared the manuscript. D.Z. polished the manuscript and corrected spelling and grammar mistakes.
Funding
This research received no external funding.
Acknowledgments
This work is supported by National Key R&D Program of China (2017YFB0902600), State Grid Corporation of China Project (SGJS0000DKJS1700840) and the Fundamental Research Funds for the Central Universities (2019QN121).
Conflicts of Interest
The authors declare no conflict of interest.
Abbreviations
The following abbreviations are used in this manuscript:
| AC | Air conditioning |
| SOC | State-of-charge |
| DR | Demand response |
| TCL | Thermostatic control load |
| ETP | Equivalent thermal parameters |
| UPCE | An adjustable control error based on unit capacity |
| AGC | Automatic generation control |
| ACE | Area control error |
Nomenclature
| equivalent thermal capacity | |
| indoor temperature at tth period | |
| outdoor temperature | |
| equivalent thermal resistance | |
| heat power of equipment | |
| cooling power of inverter AC at tth period | |
| The maximum of the users’ comfort temperature | |
| The minimum of the users’ comfort temperature | |
| Capacity of the stored energy | |
| Current energy state at tth period | |
| Equivalent SOC of inverter AC at tth period | |
| Electric power of inverter AC at tth period | |
| Frequency of the compressors at tth period | |
| Constant coefficients of the inverter AC | |
| , | Baseline of electric power and cool power |
| Charge/discharge power at tth period | |
| Auxiliary variables in the discrete solution | |
| Frequency deviation at tth period | |
| Tie-line power fluctuation at tth period | |
| Total regulation power at tth period | |
| Proportional and intergral gains of PI Controller | |
| Regulation power of generators at tth period | |
| Regulation power of inverter ACs at tth period | |
| Allocation factor of generators and ACs | |
| Maximum power of the ith generator | |
| Threshold value of ACE | |
| Adjacency matrix of non-root node | |
| Adjacency matrix of root node | |
| Maximum power of the jh inverter AC | |
| Adjacent state of non-root node and root node | |
| Power state of the jth AC at jth period | |
| Energy state of the jth AC at jth period | |
| Control signal of the jth AC | |
| Auxiliary variables in the consensus protocol | |
| Frequency bias factor | |
| Load damping coefficient | |
| System inertia | |
| Speed droop | |
| Governor and turbine time constants | |
| Synchronous torque coefficient |
Appendix A
The disturbance input of case 1 and case 2 is as Figure A1:

Figure A1.
The disturbance input of Area 1.
References
- Bevrani, H.; Ghosh, A.; Ledwich, G. Renewable energy sources and frequency regulation: Survey and new perspectives. IET Renew. Power Gener. 2010, 4, 438–457. [Google Scholar] [CrossRef]
- Bouzid, A.M.; Guerrero, J.M.; Cheriti, A.; Bouhamida, M.; Sicard, P.; Benghanem, M. A survey on control of electric power distributed generation systems for microgrid applications. Renew. Sustain. Energy Rev. 2015, 44, 751–766. [Google Scholar] [CrossRef]
- Wu, H.; Shahidehpour, M.; Alabdulwahab, A.; Abusorrah, A. Thermal generation flexibility with ramping costs and hourly demand response in stochastic security-constrained scheduling of variable energy sources. IEEE Trans. Power Syst. 2015, 30, 2955–2964. [Google Scholar] [CrossRef]
- Zhong, J.; He, L.; Li, C.; Zhong, J.; He, L.; Li, C.B.; Cao, Y.J.; Wang, J.H.; Fang, B.L.; Zeng, L.; et al. Coordinated control for large-scale EV charging facilities and energy storage devices participating in frequency regulation. Appl. Energy 2014, 123, 253–262. [Google Scholar] [CrossRef]
- Shah, N.; Waide, P.; Phadkey, A.A. Cooling the Planet: Opportunities for Deployment of Superefficient Room Air Conditioners; Lawrence Berkeley National Laboratory: Berkeley, CA, USA, 2013.
- Zhang, W.; Lian, J.; Chang, C.Y.; Kalsi, K. Aggregated Modeling and Control of Air Conditioning Loads for Demand Response. IEEE Trans. Power Syst. 2013, 28, 4655–4664. [Google Scholar] [CrossRef]
- Mathieu, J.L.; Koch, S.; Callaway, D.S. State Estimation and Control of Electric Loads to Manage Real-Time Energy Imbalance. IEEE Trans. Power Syst. 2013, 28, 430–440. [Google Scholar] [CrossRef]
- Liu, M.; Shi, Y. Model Predictive Control of Aggregated Heterogeneous Second-Order Thermostatically Controlled Loads for Ancillary Services. IEEE Trans. Power Syst. 2016, 31, 1963–1971. [Google Scholar] [CrossRef]
- Lu, N.; Chassin, D.P.; Widergren, S.E. Modeling Uncertainties in Aggregated Thermostatically Controlled Loads Using a State Queueing Model. IEEE Trans. Power Syst. 2005, 20, 725–733. [Google Scholar] [CrossRef]
- Meng, S.; Ciwei, G.; Mohammad, S.; Li, Z.L. State Space Modeling and Control of Aggregated TCLs for Regulation Services in Power Grids. IEEE Trans. Smart Grid 2018, 10, 4095–4106. [Google Scholar]
- Sanandaji, B.M.; Vincent, T.L.; Poolla, K. Ramping Rate Flexibility of Residential HVAC Loads. IEEE Trans. Sustain. Energy 2017, 7, 865–874. [Google Scholar] [CrossRef]
- Mathieu, J.L.; Kamgarpour, M.; Lygeros, J.; Andersson, G.; Callaway, D.S. Arbitraging intraday wholesale energy market prices with aggregations of thermostatic loads. IEEE Trans. Power Syst. 2015, 30, 763–772. [Google Scholar] [CrossRef]
- Trovato, V.; Tindemans, S.H.; Strbac, G. Leaky storage model for optimal multi-service allocation of thermostatic loads. IET Gener. Trans. Distrib. 2015, 10, 585–593. [Google Scholar] [CrossRef]
- Hao, H.; Sanandaji, B.M.; Poolla, K.; Vincent, T.L. Aggregate Flexibility of Thermostatically Controlled Loads. IEEE Trans. Power Syst. 2015, 30, 189–198. [Google Scholar] [CrossRef]
- Zhao, L.; Zhang, W.; Hao, H.; Kalsi, K. A Geometric Approach to Aggregate Flexibility Modeling of Thermostatically Controlled Loads. IEEE Trans. Power Syst. 2017, 32, 4721–4731. [Google Scholar] [CrossRef]
- Song, M.; Gao, C.; Yan, H.; Yang, J. Thermal Battery Modeling of Inverter Air Conditioning for demand response. IEEE Trans. Smart Grid 2017, 9, 5522–5534. [Google Scholar] [CrossRef]
- Chen, C.; Wang, J.; Heo, Y.; Kishore, S. MPC-Based Appliance Scheduling for Residential Building Energy Management Controller. IEEE Trans. Smart Grid 2013, 4, 1401–1410. [Google Scholar] [CrossRef]
- Lee, S.J.; Kim, J.H.; Kim, C.H.; Kim, S.K. Coordinated Control Algorithm for Distributed Battery Energy Storage Systems for Mitigating Voltage and Frequency Deviations. IEEE Trans. Smart Grid 2015, 7, 1713–1722. [Google Scholar] [CrossRef]
- Hao, H.; Sanandaji, B.M.; Poolla, K.; Vincent, T.L. A generalized battery model of a collection of Thermostatically Controlled Loads for providing ancillary service. In Proceedings of the IEEE 51th Annual Allerton Conference on Communication, Control, and Computing (Allerton), Monticello, IL, USA, 2 October 2013. [Google Scholar]
- Short, J.A.; Infield, D.G.; Freris, L.L. Stabilization of Grid Frequency Through Dynamic Demand Control. IEEE Trans. Power Syst. 2007, 22, 1284–1293. [Google Scholar] [CrossRef]
- Richardson, P.; Flynn, D.; Keane, A. Local Versus Centralized Charging Strategies for Electric Vehicles in Low Voltage Distribution Systems. IEEE Trans. Smart Grid 2012, 3, 1020–1028. [Google Scholar] [CrossRef]
- Molina-Garci, A.A.; Bouffard, F.; Kirschen, D.S. Decentralized Demand-Side Contribution to Primary Frequency Control. IEEE Trans. Power Syst. 2011, 26, 411–419. [Google Scholar] [CrossRef]
- Zuo, S.; Davoudi, A.; Song, Y.; Lewis, F.L. Distributed Finite-time Voltage and Frequency Restoration in Islanded AC Microgrids. IEEE Trans. Ind. Electron. 2016, 63, 5988–5997. [Google Scholar] [CrossRef]
- Xin, H.; Qu, Z.; Seuss, J.; Maknouninejad, A. A Self-Organizing Strategy for Power Flow Control of Photovoltaic Generators in a Distribution Network. IEEE Trans. Power Syst. 2011, 26, 1462–1473. [Google Scholar] [CrossRef]
- Mokhtari, G.; Ghosh, A.; Nourbakhsh, G.; Ledwich, G. Smart Robust Resources Control in LV Network to Deal with Voltage Rise Issue. IEEE Trans. Sustain. Energy 2013, 4, 1043–1050. [Google Scholar] [CrossRef]
- Hu, J.; Cao, J.; Guerrero, J.M.; Yong, T.Y. Improving Frequency Stability Based on Distributed Control of Multiple Load Aggregators. IEEE Trans. Smart Grid 2015, 8, 1553–1567. [Google Scholar] [CrossRef]
- Wen, G.H.; Hu, G.Q.; Hu, J.Q.; Shi, X.L. Frequency regulation of source-grid-load systems: A compound control strategy. IEEE Trans. Ind. Inform. 2016, 12, 69–78. [Google Scholar]
- Wang, Y.; Xu, Y.; Tang, Y.; Liao, K.; Mazheruddin, H.; Efren, G.S.; Graeme, B. Aggregated Energy Storage for Power System Frequency Control: A Finite-Time Consensus Approach. IEEE Trans. Smart Grid 2018, 10, 3675–3686. [Google Scholar] [CrossRef]
- Zhou, Y.J.; Jiang, G.P.; Xu, F.Y.; Chen, Q.Y. Second-order multi-agent systems via pinning control. IEEE Access. 2018, 6, 45617–45624. [Google Scholar] [CrossRef]
- Wang, Y.; Zhao, S.Q.; Zhou, Z.; Botterud, A.; Xu, Y.; Chen, R.Z. Risk adjustable day-ahead unit commitment with wind power based on chance constrained goal programming. IEEE Trans. Sustain. Energy 2017, 8, 530–541. [Google Scholar] [CrossRef]
© 2019 by the authors. Licensee MDPI, Basel, Switzerland. This article is an open access article distributed under the terms and conditions of the Creative Commons Attribution (CC BY) license (http://creativecommons.org/licenses/by/4.0/).