Article

Mechanisms of Control Authority by Nanosecond Pulsed Dielectric Barrier Discharge Actuators on Flow Separation

SCI-STI-PO, EPFL, Station 9, Ecole Polytechnique Fédérale de Lausanne (EPFL), CH-1015 Lausanne, Switzerland
*
Author to whom correspondence should be addressed.
Appl. Sci. 2019, 9(15), 2989; https://doi.org/10.3390/app9152989
Submission received: 4 June 2019 / Revised: 12 July 2019 / Accepted: 19 July 2019 / Published: 25 July 2019
(This article belongs to the Special Issue Active Flow Control Technologies for Energy and Propulsive Systems)

Abstract

:
The mechanisms that should be considered for separation flow control applications of nanosecond pulsed dielectric barrier discharge (DBD) actuators were investigated on a NACA 0015 profile for velocities of 10 m / s ( R e = 100,000 ) and 20 m / s ( R e = 200,000 ) in ambient wind tunnel conditions. Near and post-stall angles of attack were considered ( 16 and 24 ). The dominant frequencies existing in the flow were measured. Moderate voltage levels were applied (4 and 7 kV ) and the actuator was operated at these identified dominant frequencies and compared with known effective frequencies from literature. In all cases, influences by the actuator on the flow structures were observed and the operation of the actuator at the dominant flow frequencies of a stalled airfoil was shown to give control authority.

1. Introduction

The ability to manipulate a flow field with the objective to improve the efficiency and performance of airfoils is of great technological importance. Efficient flow control devices can be used to modify the laminar-turbulent transition inside the boundary layer, to prevent flow separation, to reduce drag and enhance airfoil lift. They may also be used to stabilise and mix airflow in order to reduce unsteadiness, which generates unwanted vibrations, noise and energy losses [1,2,3].
Both active and passive flow control devices can be used to control the flow over an airfoil. Passive techniques for flow control modify a flow without any external energy expenditure, such as geometric shaping to manipulate the pressure gradient, the use of fixed mechanical vortex generators for separation control or segmented leading edge slats. Although these devices are efficient in augmenting the lift, they create significant increases in mechanical complexity, manufacturing cost, weight and can induce a parasitic drag [4,5].
There are several mechanisms by which active flow control techniques act; they include specifically aligned vortex generation or wall jets, and the introduction of additional momentum or energy into the flow. A localised periodic excitation close to potential separation locations can be used to impart global changes to separated flow fields, typically by flow perturbation. These perturbations can be achieved by various methods, most often by means of piezoelectric, electromagnetic and electrostatic devices, which are operated by an electromechanical driver. Compared to passive control techniques, these devices offer a significant reduction in weight, mechanical complexity and parasitic drag; however they possess limited bandwidth and are subject to mechanical failure as the driver is operated at resonance in order to meet the amplitude requirements necessary at those flight speeds [6,7,8].
In the course of the past decade, the use of plasma actuators for active flow control has been implemented by many researchers and has become one of the most booming realms of aerodynamics [9,10,11]. Dielectric barrier discharge (DBD) actuators are composed of at least two electrodes separated by a dielectric material between which a high voltage is applied, creating a plasma sheet [11,12,13]. Various electrode geometries are possible, and different signals can be used to excite the actuator. Flow control with plasma is appealing as the actuators used are entirely surface mounted, lack any mechanical parts and possess high bandwidth while requiring relatively low power to be actuated [9,14]. The response time is very short, enabling real-time flow control. The effectiveness of DBD actuators has been proven for velocities up to M a = 0.75 , with different geometries or actuation signals showing superiority in different flow regimes [15,16,17,18]. Two types of plasma generation are typically used for DBD actuators: A/C power supplies, providing a sinusoidal signal to the electrode setups, for which the dominant effects are the presence of a low-speed ionic wind by the plasma in the near-wall region, with injection of momentum in the boundary layer such as a wall–jet boundary; and secondly, nano-second pulsed power signals, that generate a localised injection of energy, a small vortex generation and a pulsing micro-shock wave [9,11].
Typically, the actuation frequencies are expressed in terms of reduced frequency F c + based on chord length and freestream velocity. A preference for low frequency actuation is generally seen, with maximum flow attachment obtained in the range of F c + = 1 to 2 for a NACA 0015 airfoil [8,19]. As the value of F c + is increased, the influence of the plasma on the flow attachment weakens. Two mechanisms of flow separation control have been reported as being effective in NS-DBD actuators. The first mechanism operates at high frequency, and is connected to the instability of the boundary layer and its turbulisation. The second mechanism corresponds to the instability of the separation shear layer and the effect on its shedding structures and operates at lower frequencies. The excitation of these structures induces efficient entrainment of the flow and induces the most effective flow attachment. If the discharge power is not sufficiently large to effectively excite the shear layer, only the first mechanism remains [15,17,19,20,21,22]. These shedding structures have been observed also in PIV measurements for relatively low-speed flow (up to 60 m/s) in a study by Little et al. [19]. However, other frequencies of actuation are thought to give significant control authority. Since the mechanism of control is the excitation of some inherent flow instabilities present in the flow field, to manipulate the vortex structures of interest, the frequency of actuation needs to correspond to the frequencies of these instabilities [23].
This paper details the investigation of the mechanisms that allow for control authority for an asymmetric nanosecond pulsed dielectric barrier discharge (NS-DBD) actuator on the aerodynamic characteristics of a NACA 0015 airfoil profile. Experiments were performed in a low-speed wind tunnel at freestream flow speeds of 10 and 20 m / s at angles of attack of 16 and 24 at ambient atmospheric conditions, (corresponding to Reynolds numbers of 100,000 and 200,000 respectively for which extensive separation is expected, [24]). In addition, pressure taps along the profile chord located at mid-span on both the suction and pressure sides of the airfoil were used to determine the effectiveness of the actuator at various frequencies. Hot wire anemometry was performed with the aim of identifying dominant frequencies in the flow field over the stalled profile. Furthermore, PIV measurements were taken to identify how different actuation frequencies affect the existing structures in the flow field.

2. Experimental Setup
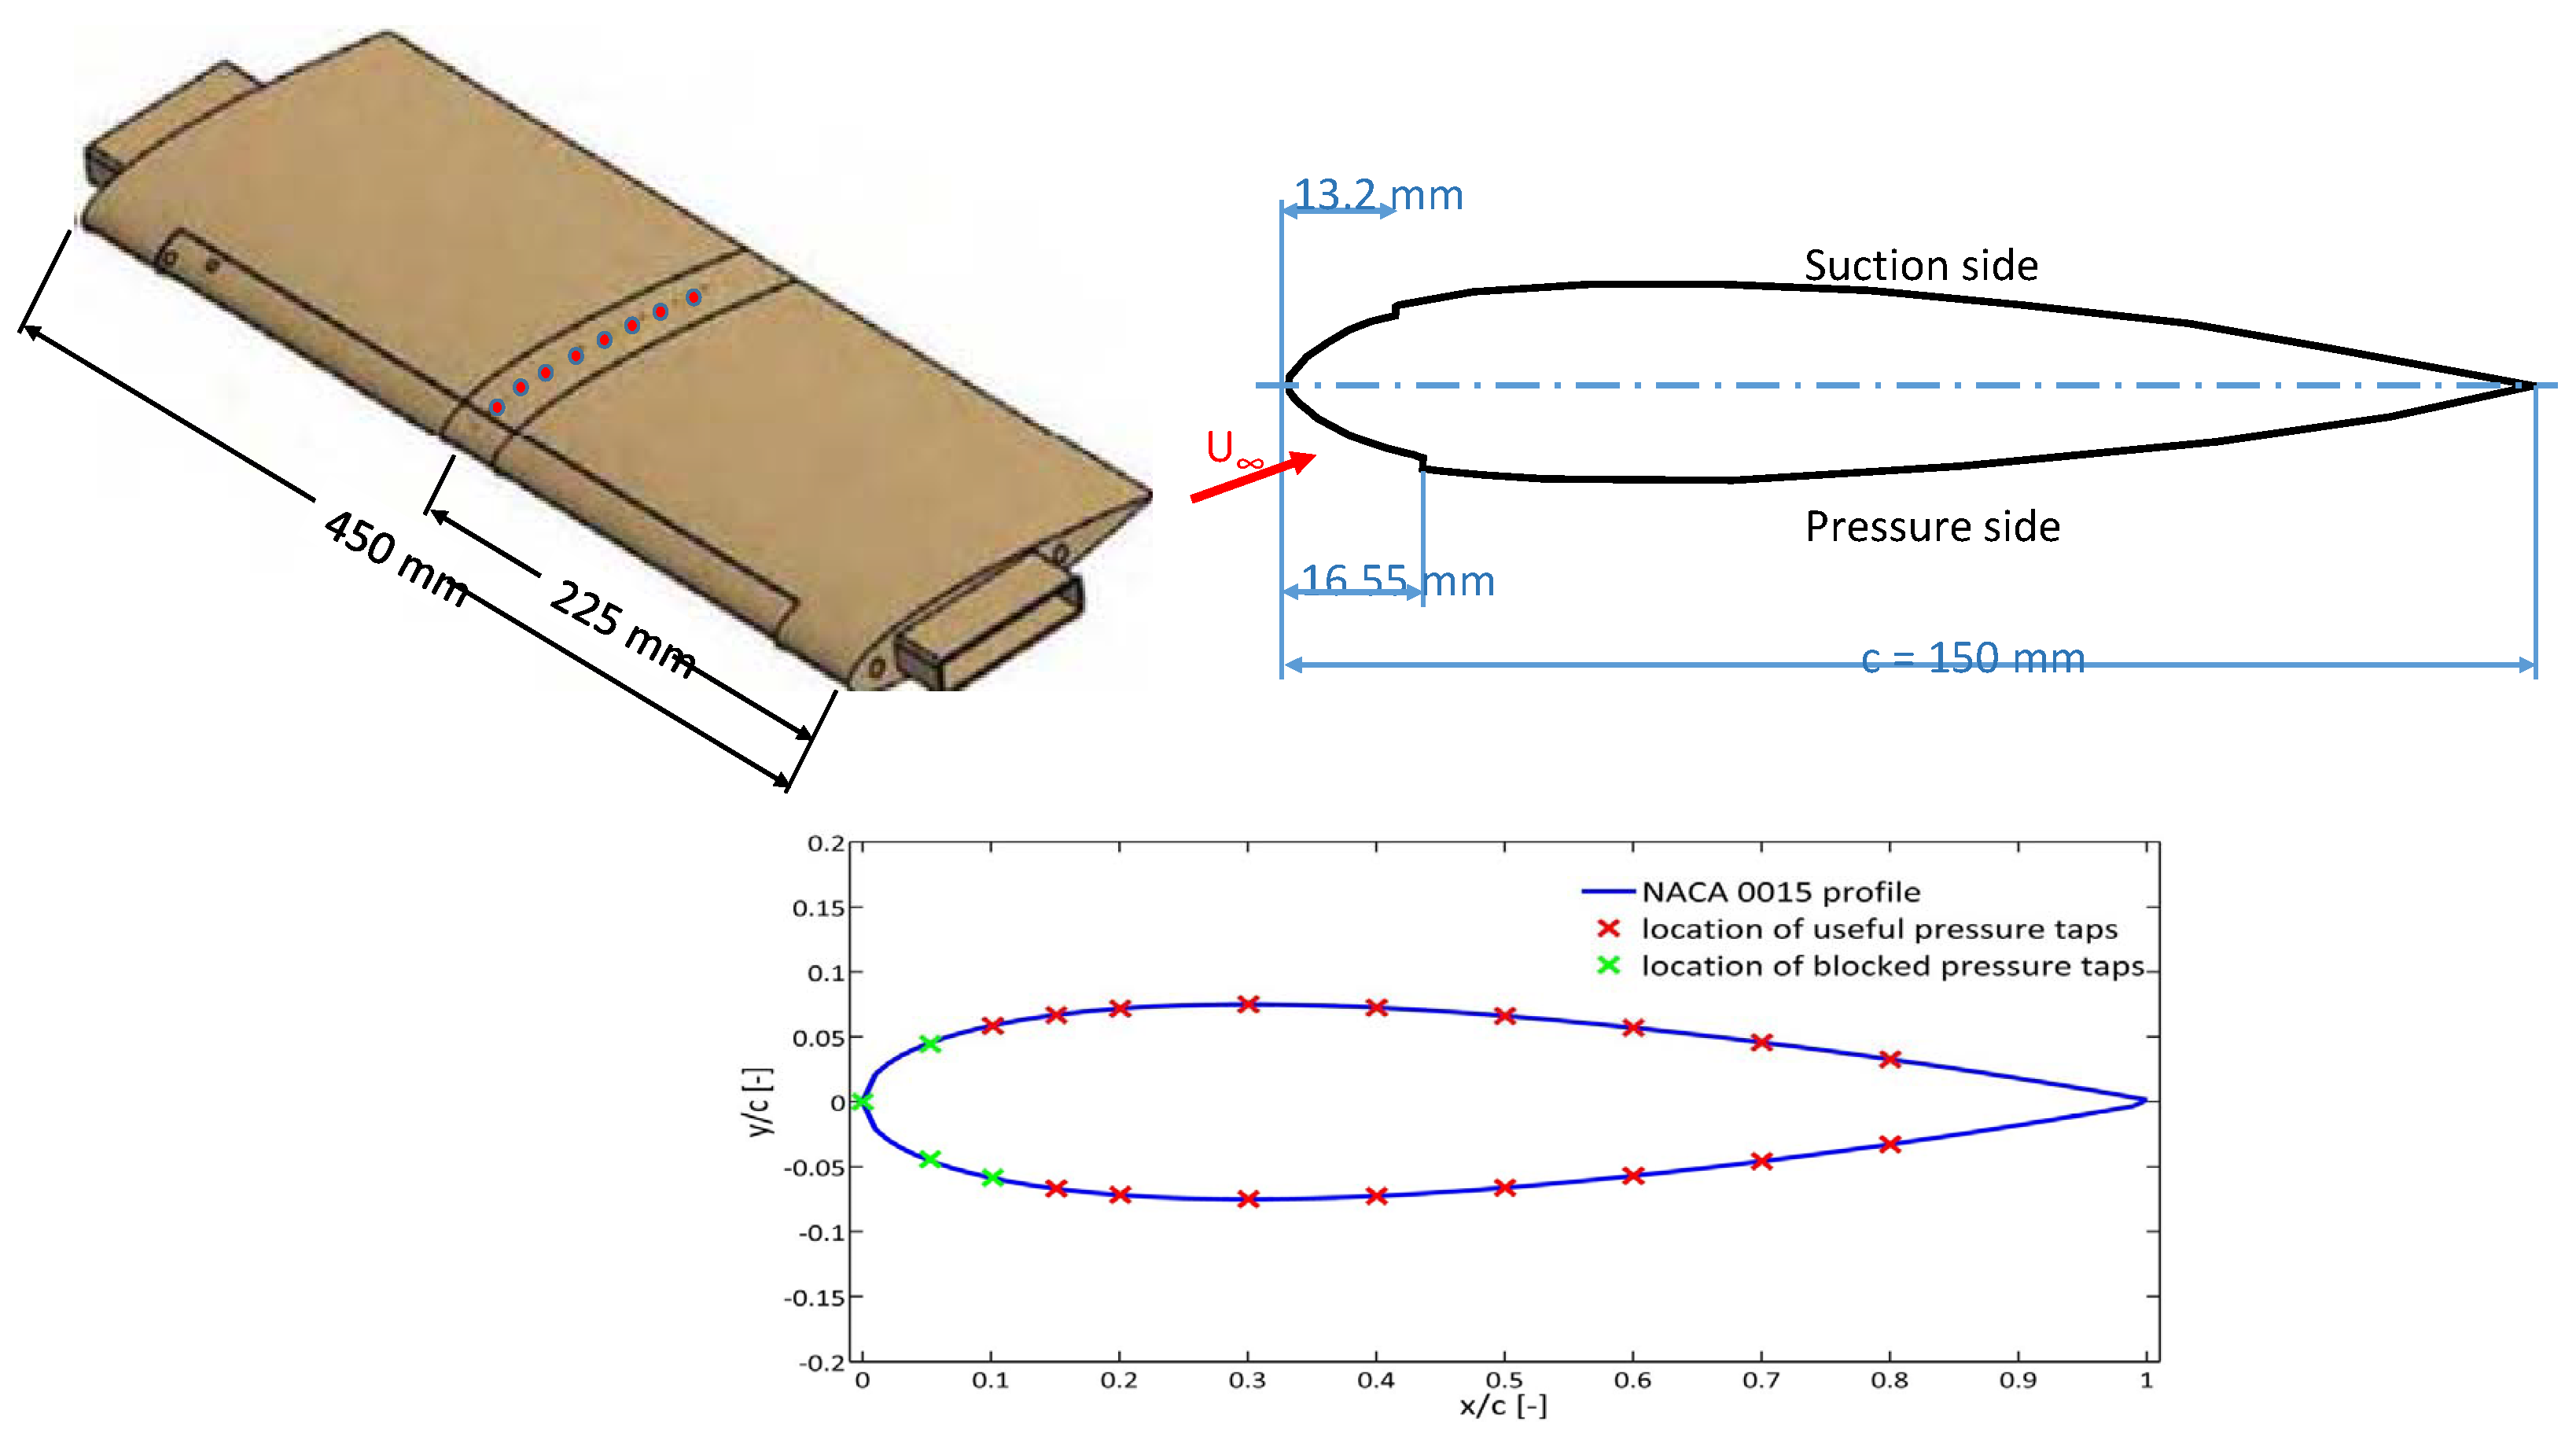
2.1. Model

The model used throughout the experiments is a NACA 0015 profile, with a chord length of 150 mm and a span of 450 mm . This span is designed to be exactly that of the wind tunnel test section’s width for optimal fixing at prescribed angles of attack. It incorporates a recess 0.8 mm deep around the leading edge, stretching from x / c = 0.09 on the suction side to x / c = 0.11 on the pressure side. Its length along the span of the model is 360 mm . This recess allowed for flush actuator integration in order to minimise surface discontinuities during the plasma experiments. Twenty-one pressure taps were incorporated into the model at the locations shown in Figure 1. Only sixteen of these could be used as four of the taps were located within the recessed area that was covered during the experiments on the model by the actuator upper electrode, while another pressure tap just upstream of the trailing edge of the airfoil could not be used due to the data acquisition system. The model has a span corresponding to the test-section width, which enables the model to be fixed at the correct angles of attack using two different sets of test-section windows with fixed cut-outs at 16 and 24 . The indentation for holding within the cut out slots are shown at the top left of Figure 1. The accuracy of the setting of the angles of attack was assured by the precise manufacturing and can be considered to be less than ± 0.05 . Another set of wind tunnel side windows incorporated a circular inside disc for varying the angle of attack, in which the inserts could be fixed; this is not optimal for high fidelity PIV measurements but provide a first quicker approach for changing the angle of attack for pressure tap measurements. In this case, the angle of attack is measured by means of a Bevel Box remote angle sensor with a resolution of 0.1 .
The airfoil model is made of three parts, two parts containing the side-wall inserts and a third centrally mounted part that contains the pressure tap tubing (see top left of Figure 1). Two Scanivalve DSA3217 pressure sensors were used to measure the static pressure from the seventeen operational pressure taps along the model chord. The pressure was sampled at a frequency of 20 Hz and averaged over a sample of 100 measurements.

2.2. Wind Tunnel

The experiments were conducted in an open-loop wind tunnel consisting of a modified radial blower driven by a frequency converter controlled 5.5 kW asynchronous motor and connected to an asymmetric wide angle diffuser via a vibration absorber. The air is aspirated in from the laboratory into the tunnel through a dust filter, located in front of the radial blower intake, before eventually being returned to the room via a diffuser. Five screens in the wide angle diffuser prevent flow separation. In the settling chamber, a honeycomb, dust filter and final screen are installed to smooth out flow inhomogeneities. The modular test section has a cross-section of 450 mm width and 300 mm height; the length of the test section is relatively long and can be varied and also it is designed to minimise back-flow and end effects; however, for the presented tests here, it can be considered to be 2500 mm .
A thermocouple and pitot-static tube are located upstream of the model. To determine the freestream velocity, the static and total pressures of the freestream flow were measured via the pitot-tube by two Druck LPM 5480 pressure sensors sampled at a frequency of 50 Hz connected to a Tektronix TDS210 two-channel digital oscilloscope.
The static and total pressures of the freestream flow were measured from the pitot-tube by two Druck LPM 5480 pressure sensors sampled at a frequency of 50 Hz taking a sampling size of 150 measurements.

2.3. DBD Actuator Construction
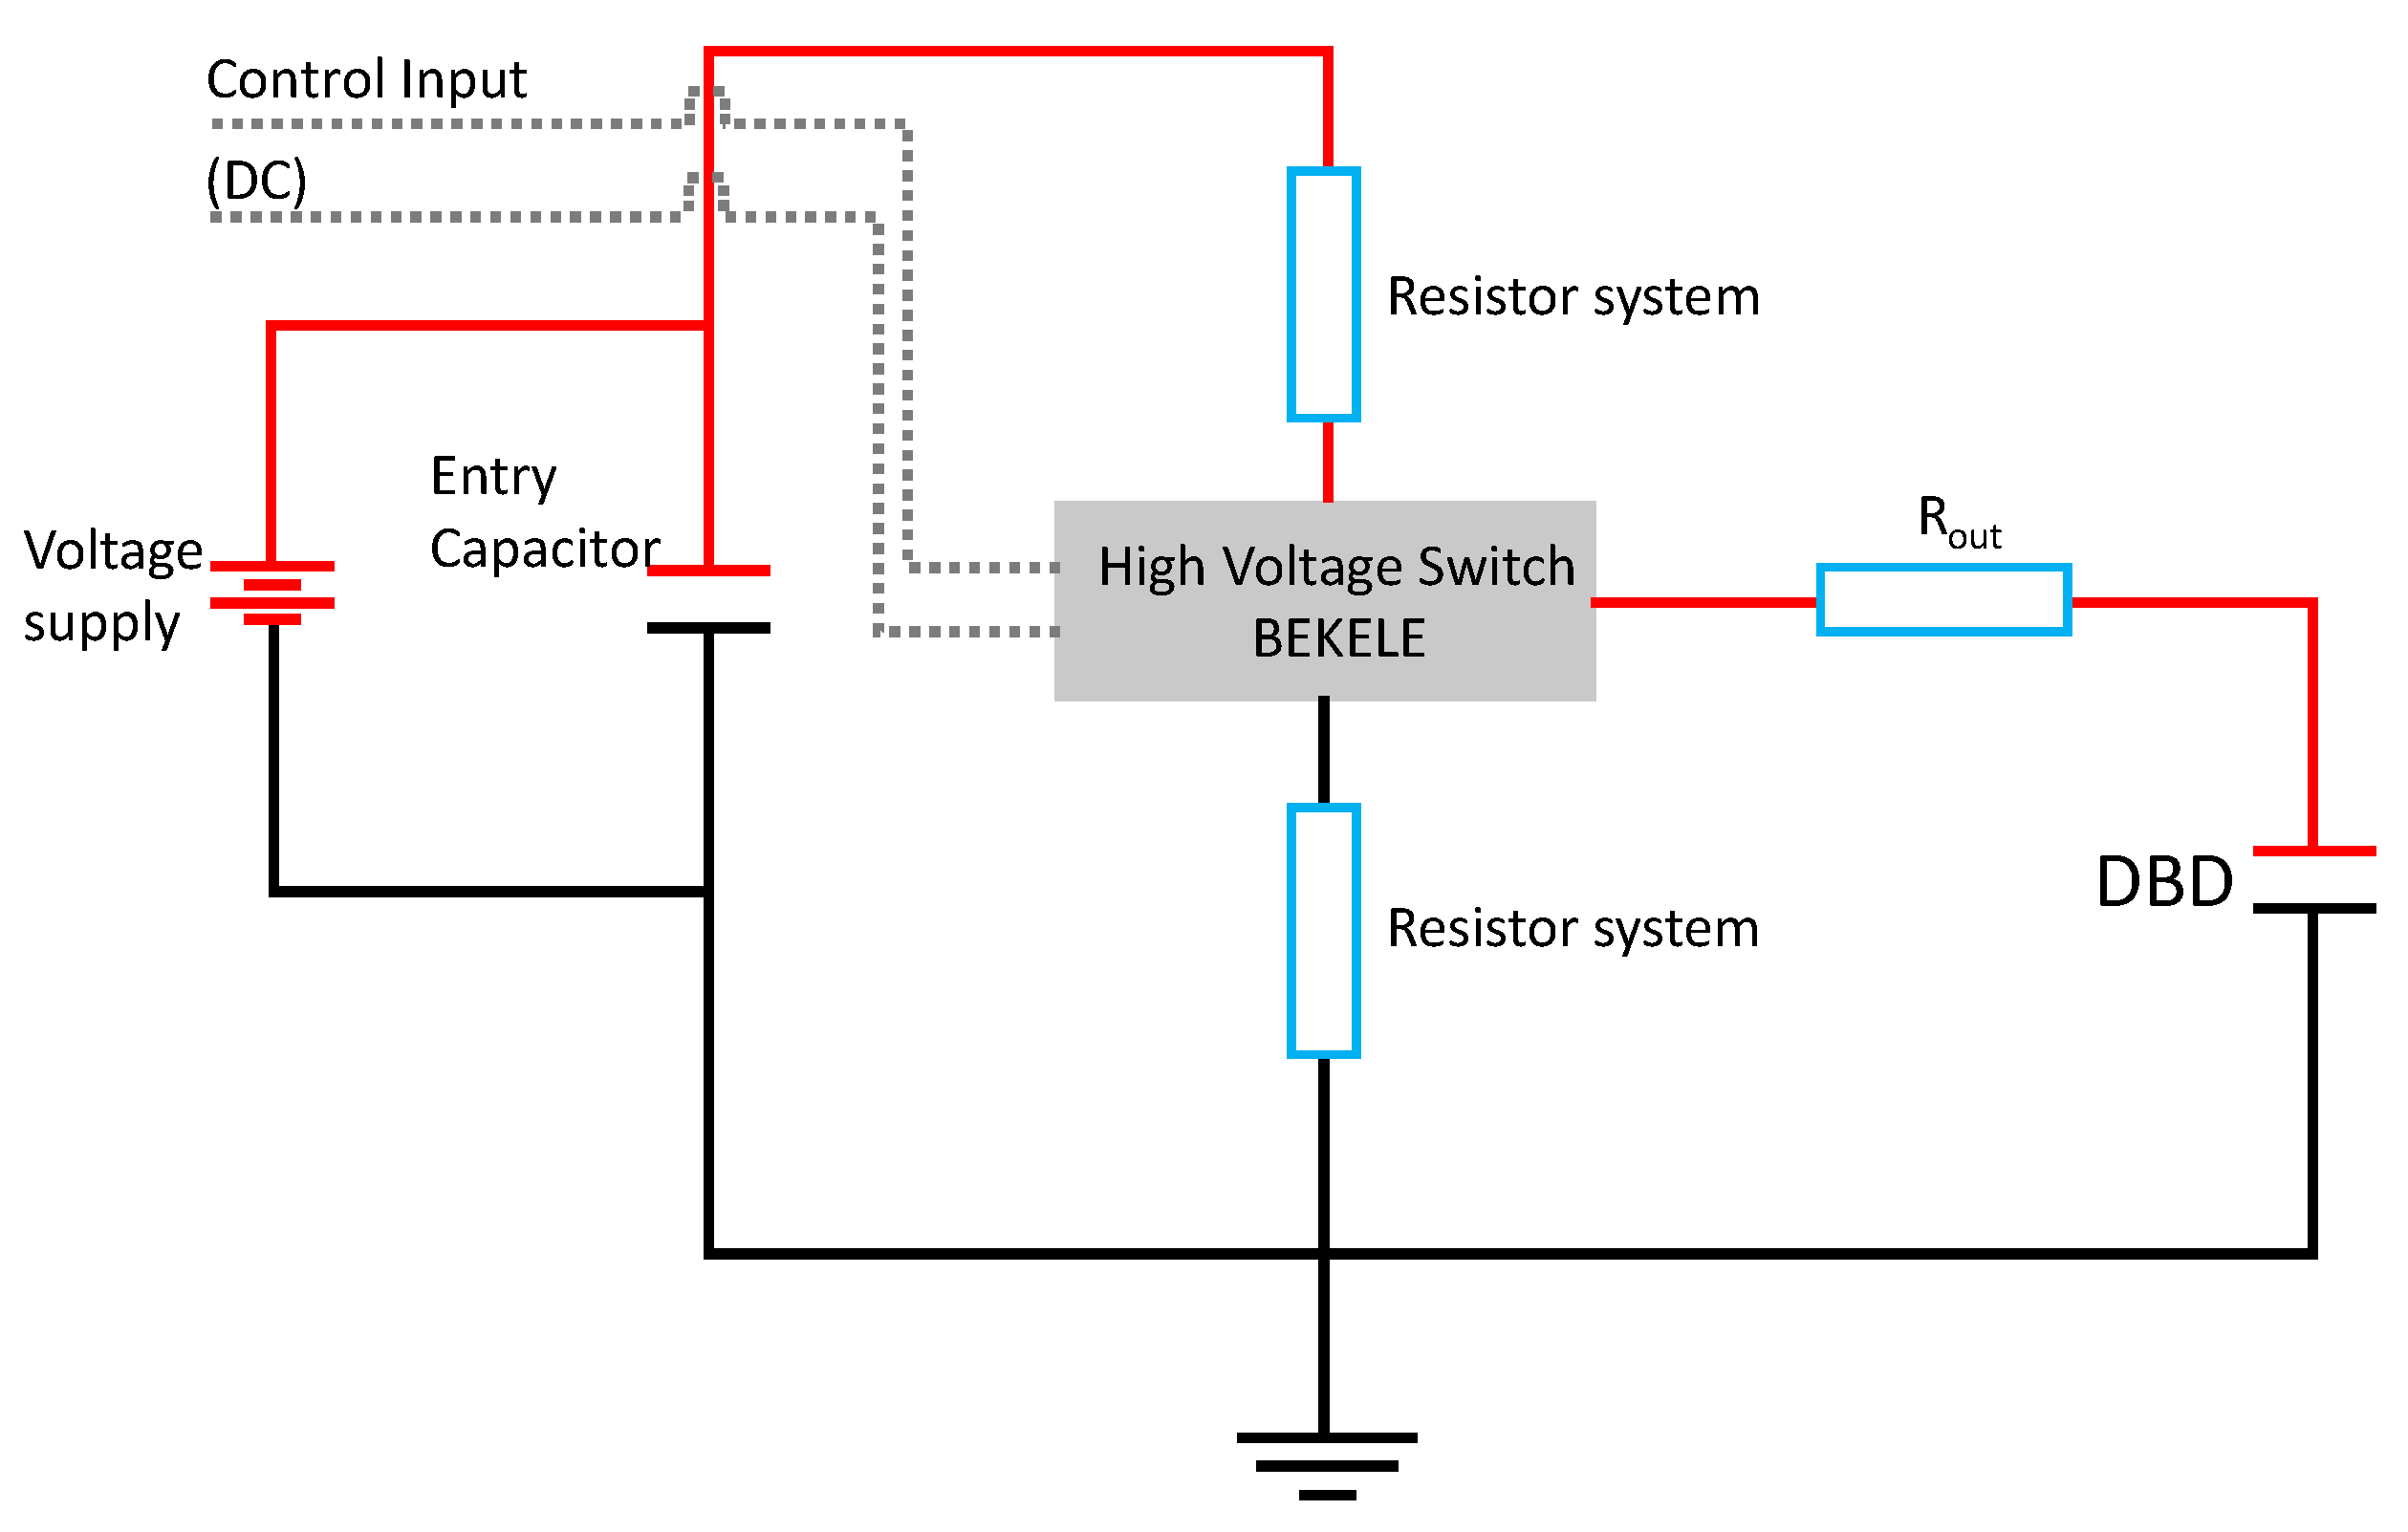
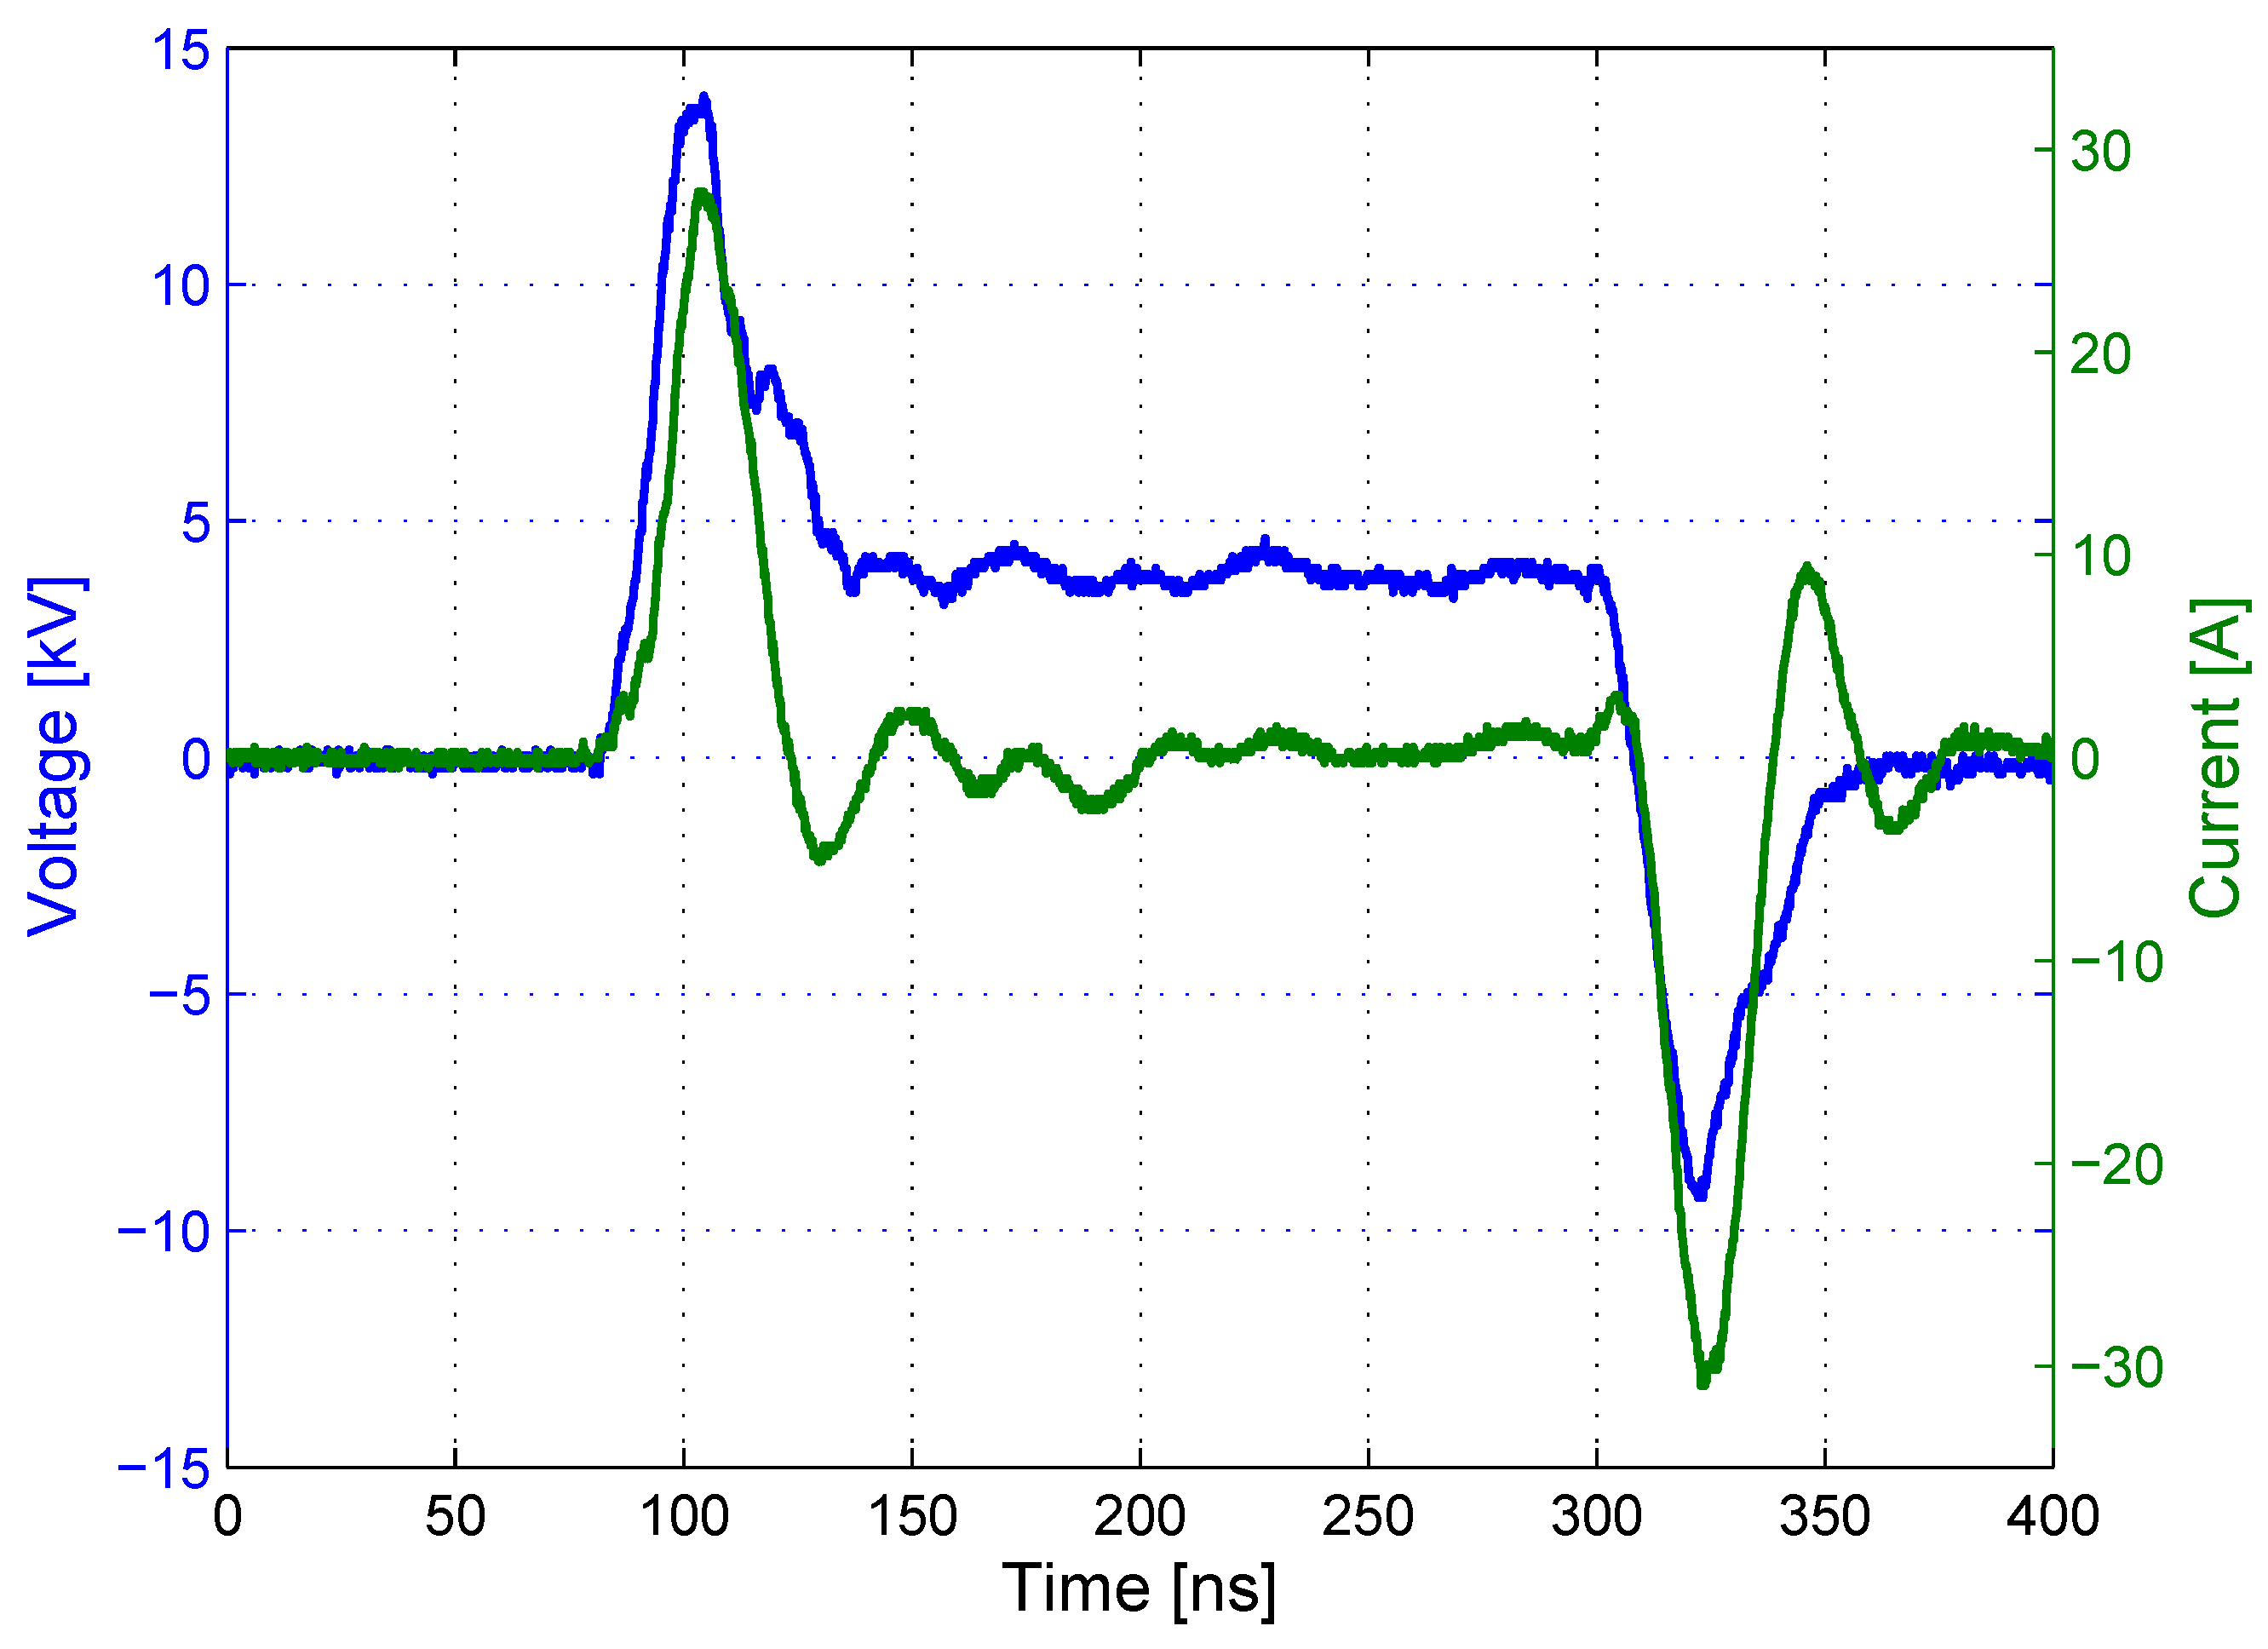
The DBD actuator is composed of two copper electrodes separated by a dielectric layer and arranged in an asymmetric manner, as shown in Figure 2. There is a slight overlap between the upper and lower electrodes in order to encourage uniform plasma generation [10]. The encapsulated electrode has a width of 10 mm while the exposed electrode is 4 mm wide. The length of the actuator over the model span, which corresponds to the length of the exposed electrode, is 300 mm . The dielectric barrier is composed of four layers of Kapton tape. Each layer has a thickness of 70 μ m , i.e., 25 μ m Kapton with a 45 μ m adhesive layer. The plasma forms in the upstream direction over the encapsulated electrode, as shown in Figure 2. Thus, the first disturbance encountered by the flow is the plasma itself. The upstream edge of the exposed electrode was located at a distance of 4.5 mm along the chord from the leading edge of the model (at x / c = 0.03 ). As the occurrence of plasma on an airfoil surface induces only a relatively small effect on the airflow, it is clear that, to gain any significant advantage from its use, considerable leverage should be provided by the flow sensitivity. Many experimental studies [15,20,21,22] have been performed with the aim of determining the optimal location of a NS-DBD actuator on such a profile. These studies have consistently shown that the maximum effect is achieved when the electrodes are positioned such that the discharge zone is located just upstream of the separation point.

2.4. Power Supply

The core of the power supply used in the experiments is a Behlke HTS111-06-GSM fast high-voltage transistor switch, composed of two identical MOSFET switching paths forming a so-called push–pull circuit. The basic circuit of the power supply is given in Figure 3. A 5 V DC power supply and a function generator are needed to drive the switch and control the output, the latter serving as a trigger signal. A DC voltage supply provides a constant voltage of up to 10 kV , which charges the entry capacitor with a capacitance of 7000 pF . Once the switch opens the DBD actuator sub-circuit, the voltage is primarily provided by the capacitor. Therefore, the DC power supply can operate with a low output current. The current required to charge the capacitor depends on the repetition rate of the output voltage pulse.
The actuator was operated by means of nanosecond pulses (NS-P) generated by a Rhode and Schwarz function generator. The operating regime used was periodic (NS-P), with a constant frequency of pulses fed into the discharge gap at peak voltages between 3 and 10 KV. For the present study, peak voltages of either 4 or 7 kV were selected. Typical waveforms for voltage and current used during the experiments are shown in Figure 4.
A recurrent question relates the power consumed to create such plasmas in such nanosecond-pulsed DBD actuators and whether the energy balance is favourable to their developments: the averaged power consumption at a pulsing frequency of 1 kHz for the signals represented in Figure 4 can be estimated to be only 4.6 W due to the low duty cycle of ns-pulse (NS-P) power supplies. Using a precise estimation as reported by Thesis of Geuns [25,26], and recently published in a very complete analysis of typical DBD power consumptions by Ashpis et al. [27], this estimation is confirmed for a peak voltage pulse of 4 kV ; in addition, for a peak voltage of 7 kV , we obtain a global maximal power consumption of 6–10 watts over the duty cycle.
The installation of the DBD actuator within the Wind tunnel model is isolated from the wind tunnel and all the acquisition systems by appropriate grounding and capacitance shielding. Indeed, the levels of electromagnetic interference effects that could occur during the fast rise of the ns-pulse must have no interaction with any electronic equipment, as this would lead to their damage/destruction.

2.5. Test Conditions

In the baseline experiments, where measurements were performed on the smooth profile, two values of freestream velocity produced by the wind tunnel were investigated: 10 m / s and 20 m / s , corresponding to Reynolds numbers relative to the chord length of 100,000 and 200,000, respectively. The angles of attack investigated were 16 and 24 .
At a R e = 100,000 and α = 16 , the frequencies tested were f = 35.0 , 44.2 , 66.6 , 133.3 , 199.9 , 266.6 , 500.0 , 666.6 and 1058.0 Hz , which correspond to the values of reduced frequency of F c + = 1 , 2, 3, 4 and 10. At the same R e and α = 24 , the frequencies tested were f = 34.0 , 66.6 , 133.3 , 199.9 , 266.6 , 400.0 and 700.0 Hz with values of reduced frequency of F c + = 1 , 2, 3 and 4 .
At a R e = 200,000 and α = 16 , the frequencies tested were f = 33.6 , 41.0 , 133.3 , 174.4 , 266.6 and 533.3 , which give the values of reduced frequency of F c + = 1 , 2, 4. At the same R e and α = 24 , the frequencies tested were f = 69.0 , 133.3 , 266.6 , 400.0 , 470.0 , 533.3 and 1333.3 Hz and included the values of reduced frequency of F c + = 1 , 2, 3, 4 and 10 .
The choice for the frequencies was made by examining the power spectra of the velocity field, without plasma actuation, obtained by using Hot Wire Anemometry and taking values of reduced frequency that were known to be effective. Further details of this procedure follow in the next section.

3. Experimental Techniques

3.1. Pressure Measurements

Two Scanivalve DSA3217 pressure sensors were used to obtain static pressure measurements from the sixteen pressure taps located on the surface of the airfoil (see Section 2.1). Overall, 100 data points were taken at a frequency of 20 Hz .

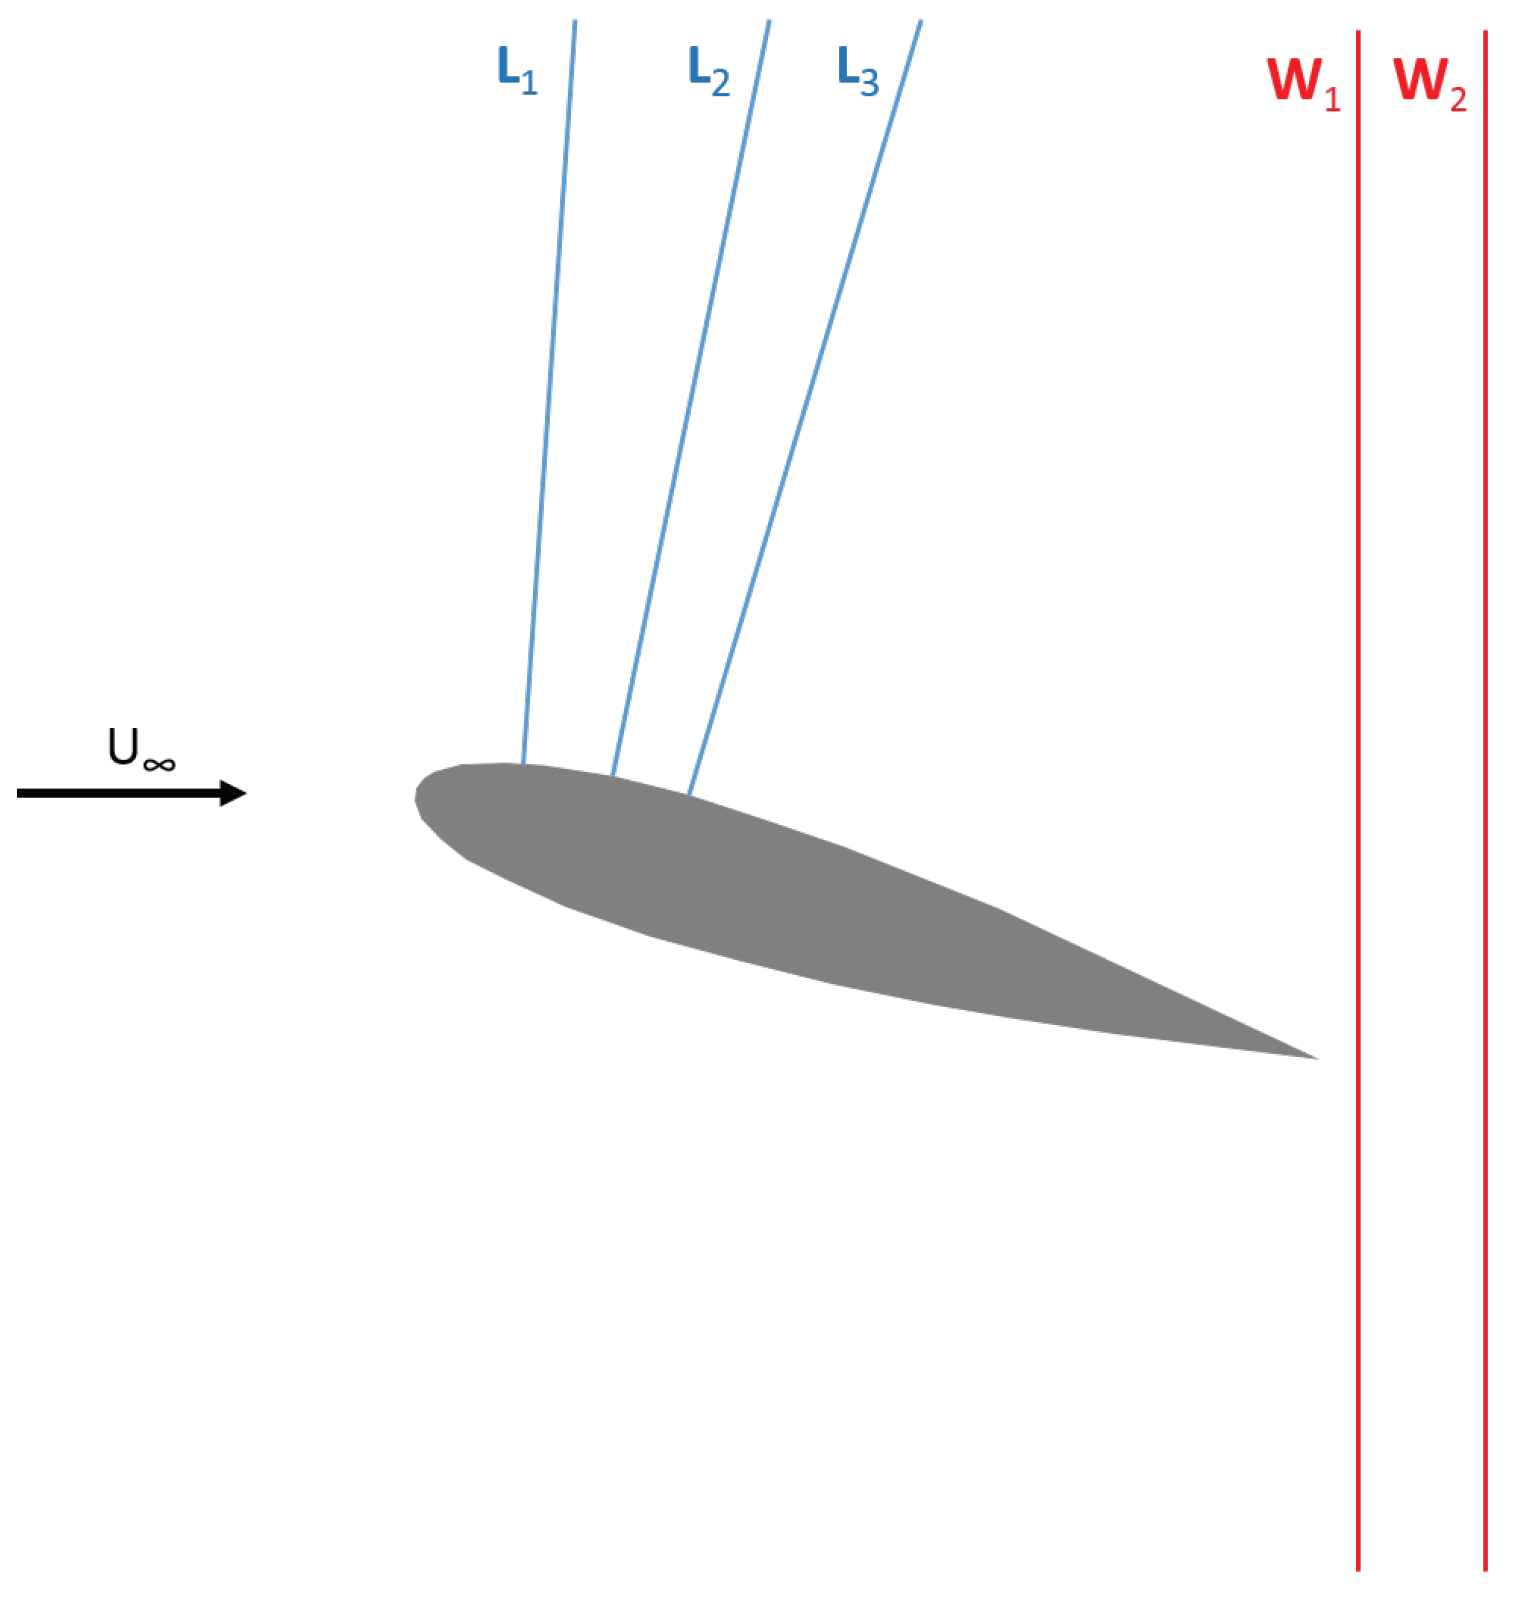
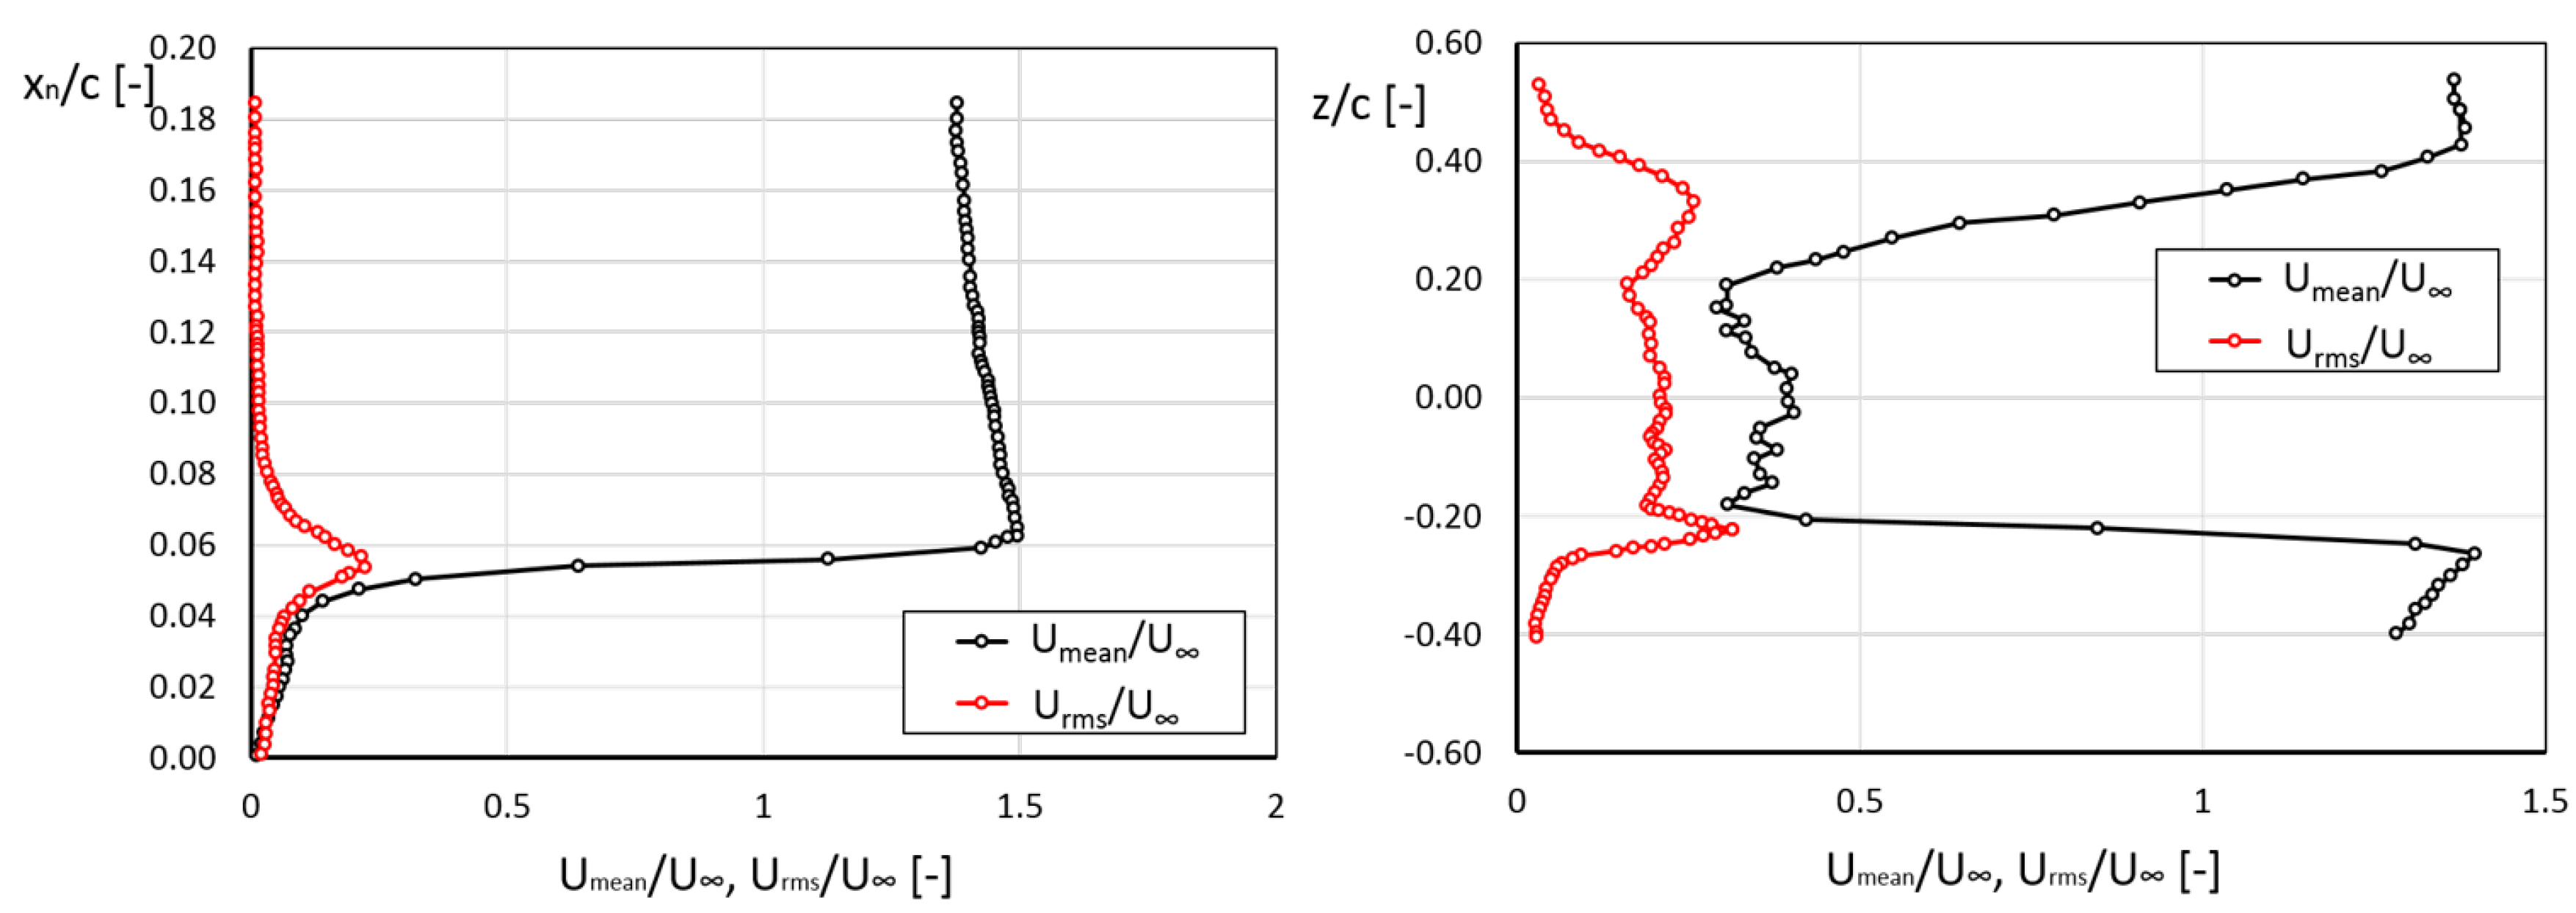
3.2. Hot Wire Anemometry

To obtain the power spectra that would reveal the most dominant frequencies in the flow, Hot Wire Anemometry (HWA) was applied. The system consisted of a Dantec Dynamics MiniCTA 5442 bridge with a National Instruments NI USB-9162 data acquisition system. The resultant of the streamwise and vertical velocity components was measured using a single-sensor 55P15 boundary layer probe which allowed to obtain measurements very close to the surface of the airfoil. A traversing system, using the coordinate system shown in Figure 5, was used to position the probe at the desired point of measurement. The lines of measurement on the airfoil were placed perpendicular to the surface of the airfoil at x / c = 0.1 , 0.2 and 0.3 , denoted by L 1 , L 2 and L 3 , respectively. Two measurement lines in the wake were also considered, placed perpendicularly to the freestream flow and denoted by W 1 and W 2 . The position of W 1 was x / c = 0.033 and W 2 at x / c = 0.1 , both measured from the trailing edge of the airfoil downstream. The positions of the measurement lines are shown in Figure 5.
The data were acquired at a frequency of 8 kHz for a total test time of 5 s , which results in 40,000 data samples at each point along the measurement lines. The choice of frequency was such that the Nyquist criterion was satisfied [28]. For the measurement lines L 1 , L 2 and L 3 , 40–70 points were examined at Δ z = 0.5 mm . Likewise, for the measurement lines W 1 and W 2 , 39–65 points were examined at Δ z = 2.9 mm .

3.3. Particle Image Velocimetry

The PIV measurements were done using a LaVision PIV system. Illumination was handled by a Quantel Evergreen 200 double-pulse Nd:YAG laser, which offers a 200 mJ light pulse at a wavelength of 532 nm . The lens was adjusted such that the light sheet formed was parallel with the freestream flow and covered the entire chord of the airfoil, with a thickness of 1.2 mm . The images were acquired using a LaVision Imager SX 4M camera, equipped with a Nikon lens with a focal length of 28 mm . The time separation was set to 20 μ s for both velocities tested. Finally, the flow was seeded using non-toxic DEHS (Di-2-Ethylhexyl-Sebacat) using an aerosol generator to produce particles with an average diameter of 1.6 μ m . The choice of the chemical composition of the seeding droplets in presence of a discharge plasma requires a careful choice to avoid charging of the aerosol, in which case the images would be biased. Several products were pre-tested and evaluated for their respective charging, DEHS providing an optimal solution.
To obtain a more accurate picture of the flow field structures caused by the actuation, phase-locked PIV measurements were performed. The timing was handled by a LaVision Programmable Timing Unit, which received its triggering signal by the same function generator used for the DBD actuator. Since the maximum trigger rate of the laser system was limited to 15 Hz , it was not possible to capture an image-pair at every actuation of the DBD. Therefore, an image-pair was acquired after a certain number of DBD actuations, depending on the frequency of actuation of the test case in question. Overall, 500 image-pairs were utilised to provide instantaneous velocity fields as well as time-averaged quantities. After the image acquisition, each image pair was processed using DaVis 8.2.0 with a decreasing window size (64 × 64–32 × 32) multi-pass processing with a 50% overlap for the 64 × 64 window size and 75% overlap for 32 × 32.

4. Results

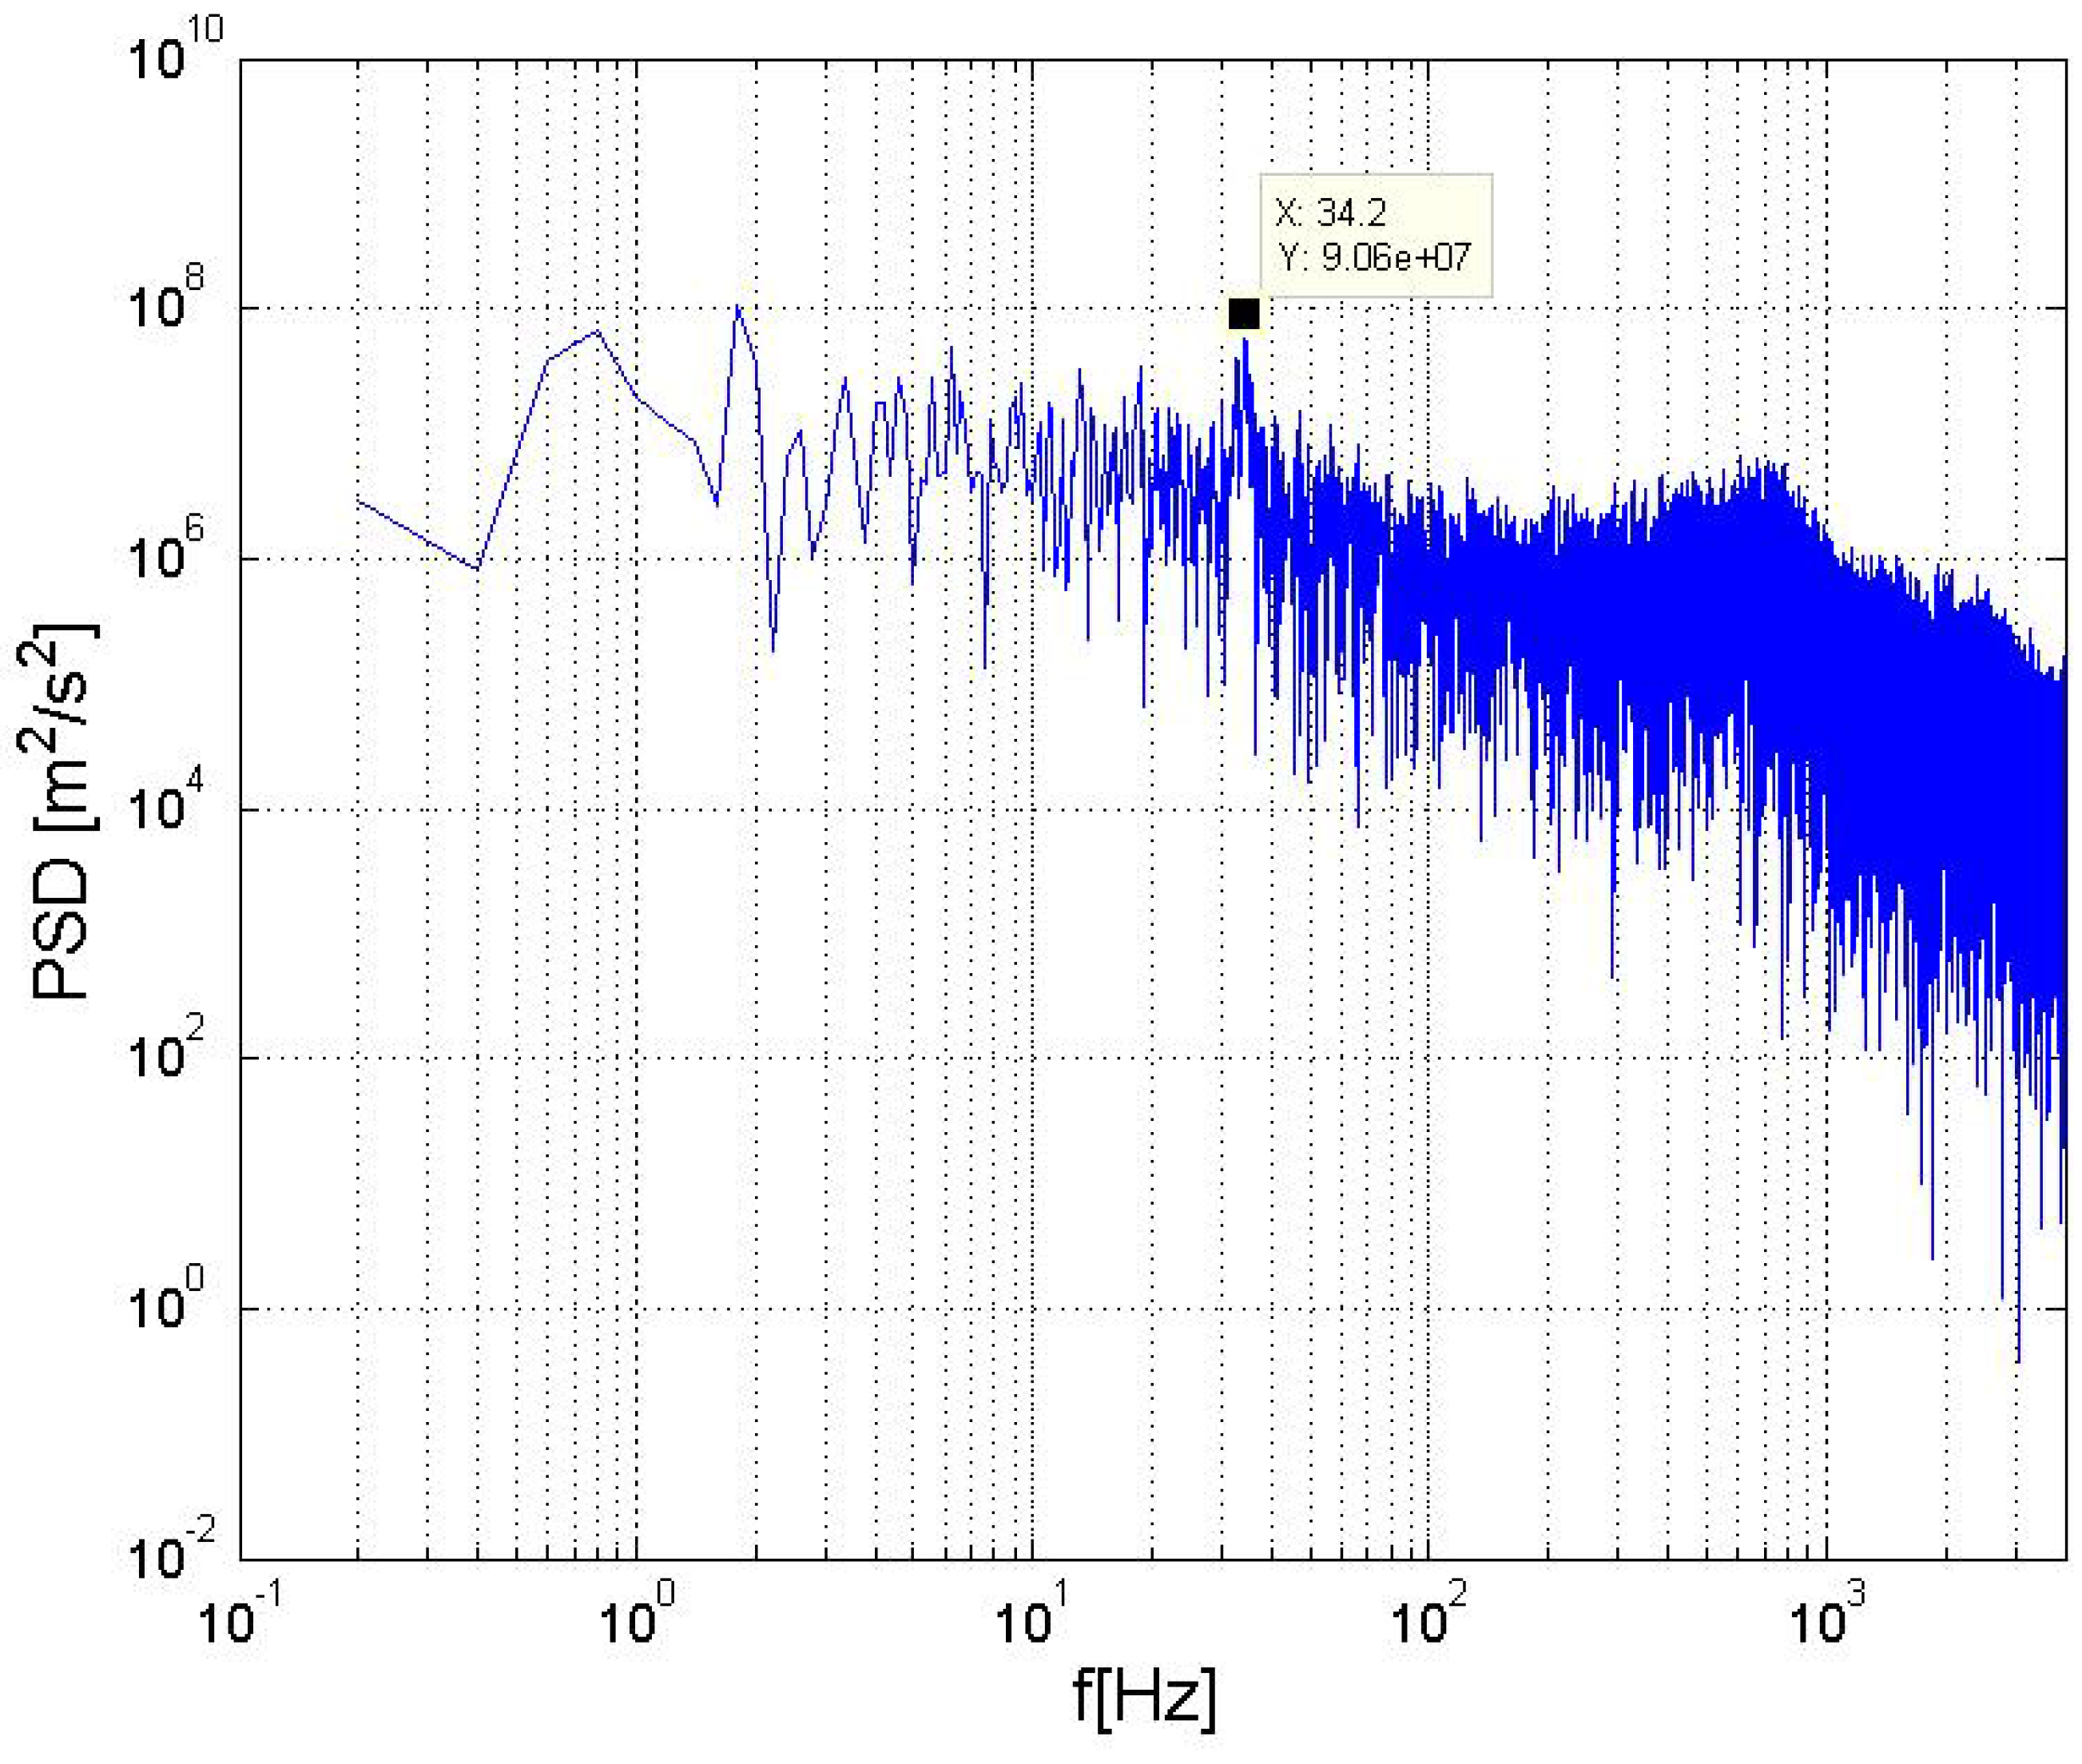
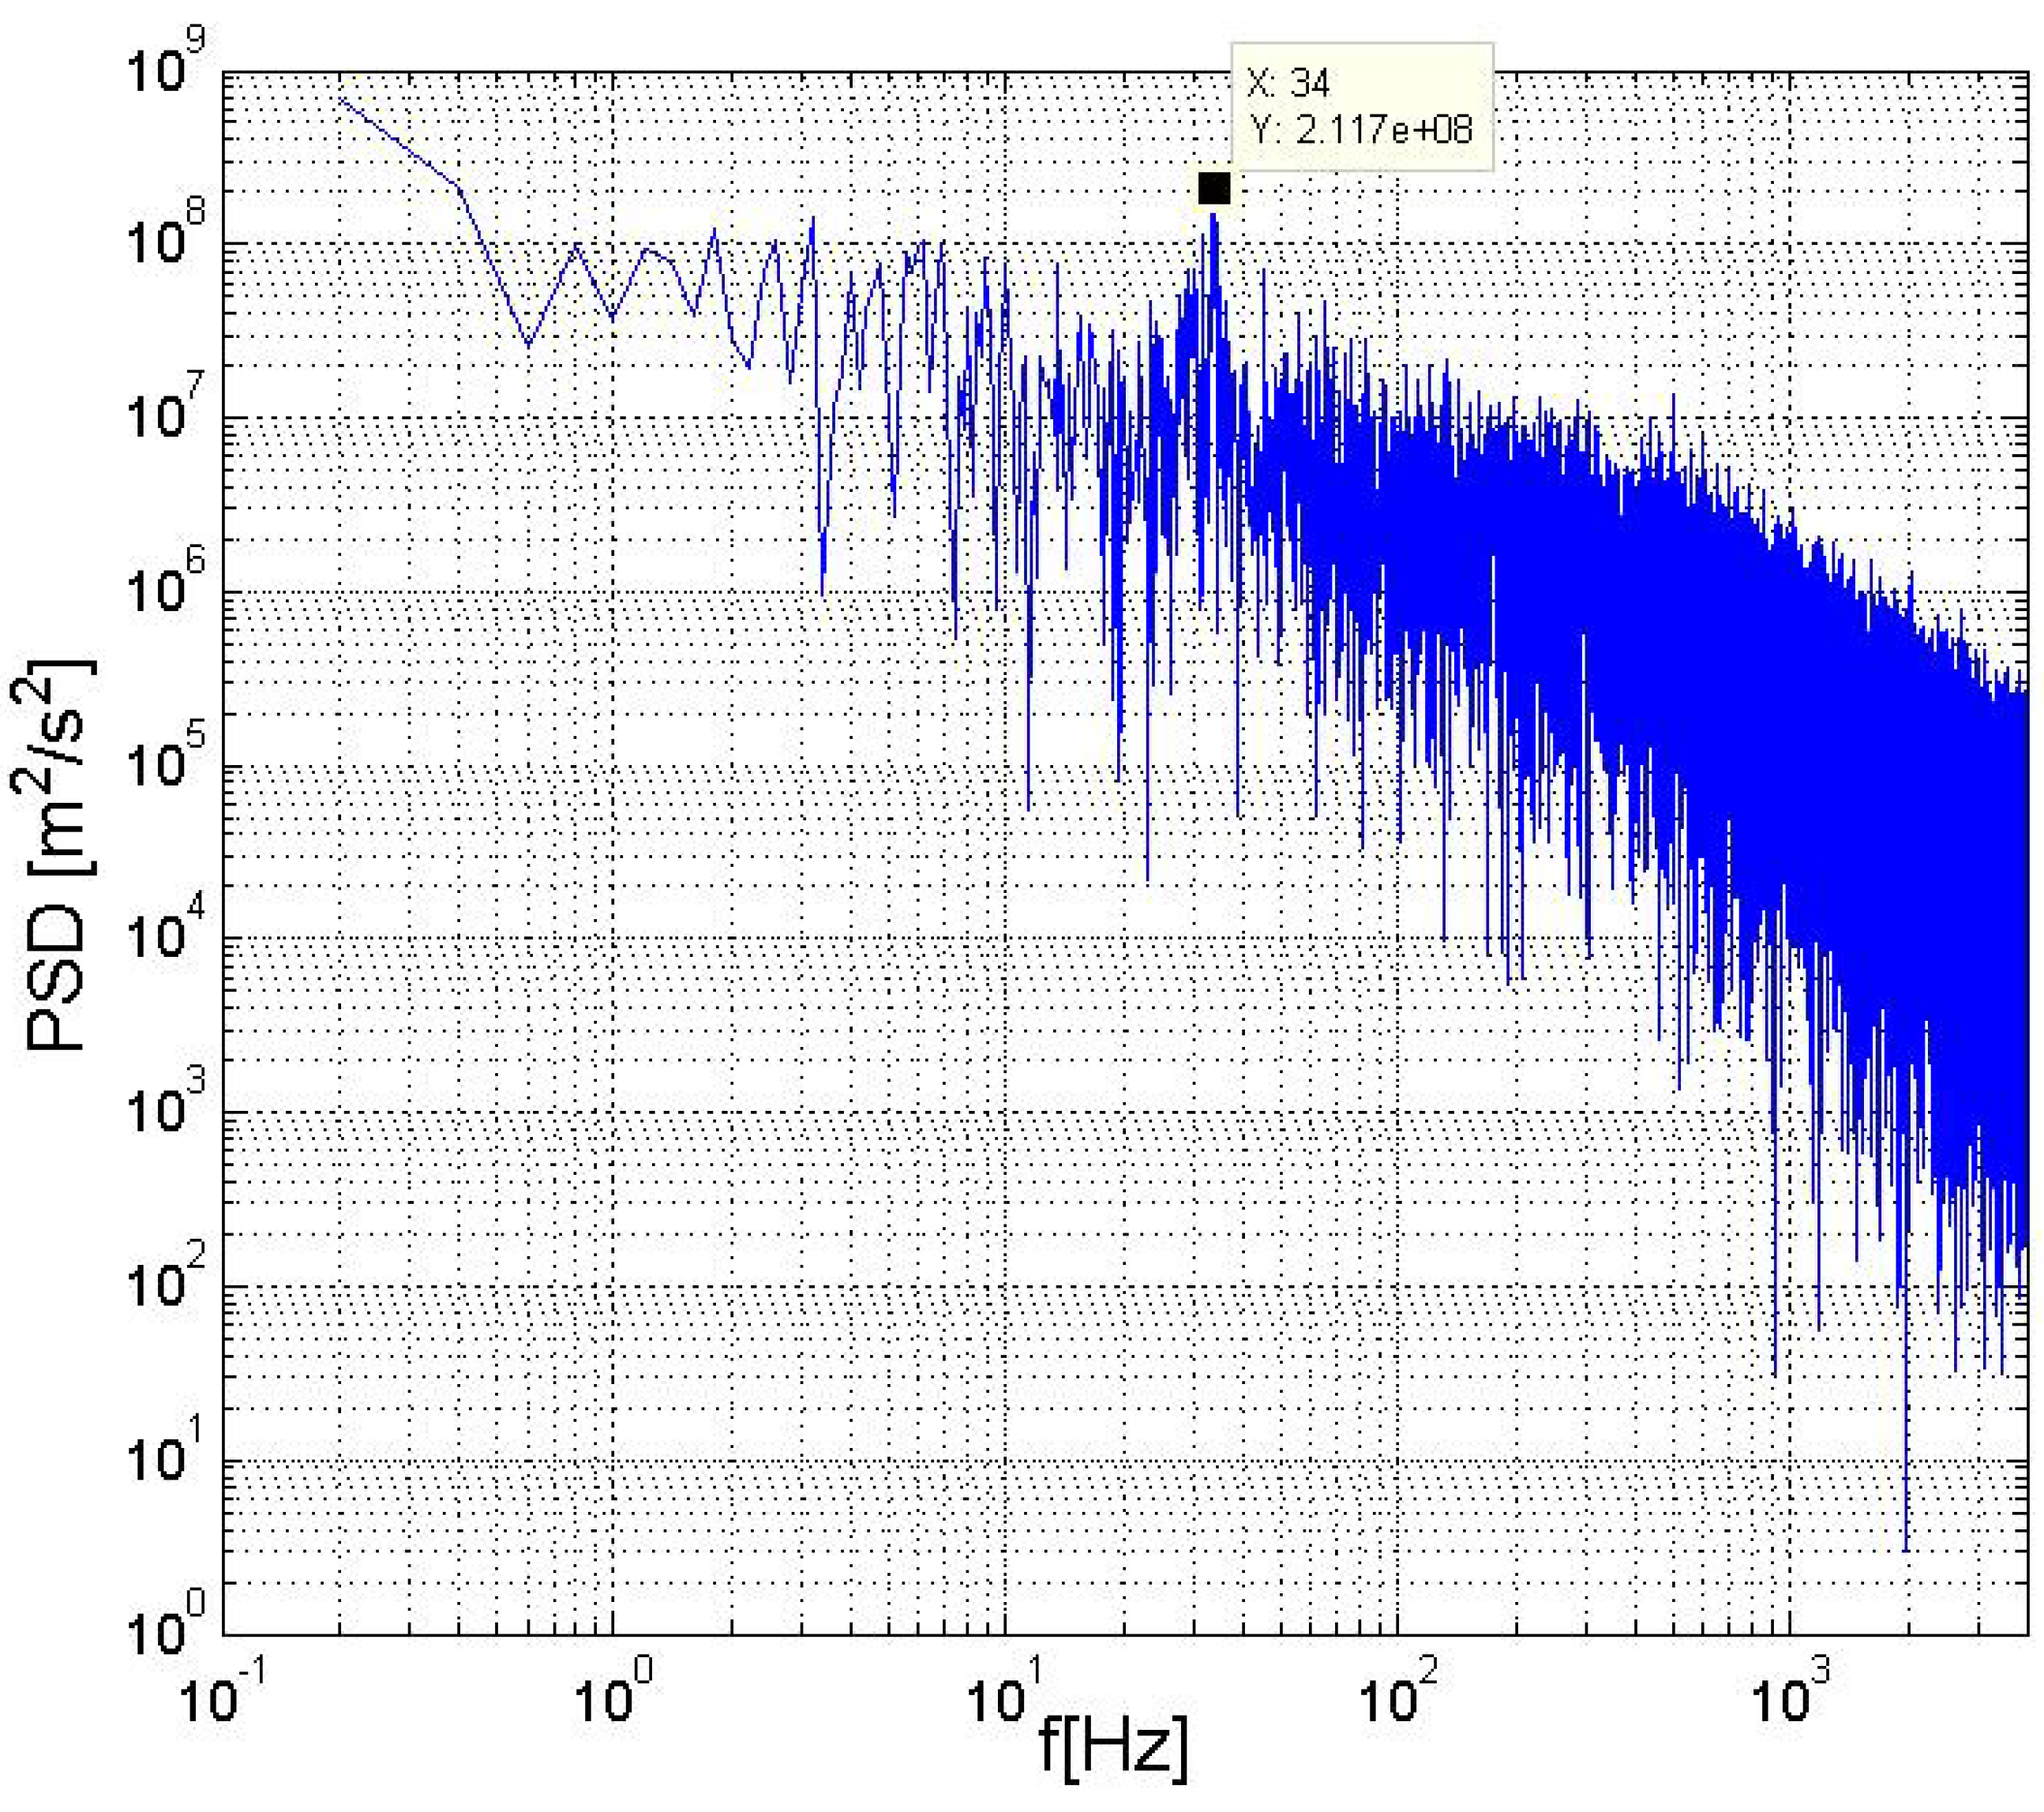
4.1. Spectral Analysis without Actuation

To identify the dominant frequencies present in the flow field, hot wire measurements were done along measurement lines (see Figure 5). For consistency, the points where the Power Spectral Density (PSD) was calculated were those where the peak RMS velocity was located, as shown in Figure 6.
It was found that along the measurement lines of L 1 , L 2 and L 3 the frequencies representing the shear layer and the wake vortex were present. The high shear layer characteristic frequencies are seen in the bulk of the PSD, whereas the low wake vortex characteristic frequencies are obvious as a peak. When comparing the shear layer frequencies along L 1 , L 2 and L 3 , it was observed that there was a reduction in the frequency of the bulk, which represents the characteristic frequency of the shear layer when moving downstream. The same wake vortex frequencies were also observed on W 1 and W 2 . Based on the observed power spectra generated, the frequencies at which the actuation would be performed were finalised. Examples of the power spectra can be seen in Figure 7 and Figure 8.
According to the obtained power spectra, the most dominant and characteristic frequencies of the flow without plasma actuation were determined. The results of this analysis at a R e = 100,000 and α = 16 indicated that the most dominant characteristic frequencies of the wake are f = 35.0 Hz and 44.2 Hz , whereas for the shear layer the most dominant frequencies are 500 and 1058 Hz . At the same R e and α = 24 , the characteristic frequencies detected are f = 34 , 203, 400 and 700 Hz .
At a R e = 200,000 and α = 16 , the dominant frequencies detected in the power spectra were found to be f = 33.6 , 41.0 , and 174.4 Hz . At the same R e and α = 24 , the dominant values of frequencies were found to be f = 69.0 , 266.6 , 470.0 and 1333.3 Hz . In all cases, the most dominant characteristic frequencies detected were applied as the actuation frequency of the DBD actuator to determine the degree of control authority they possess in re-attaching separated flows at the respective angles of attack at which they were detected.

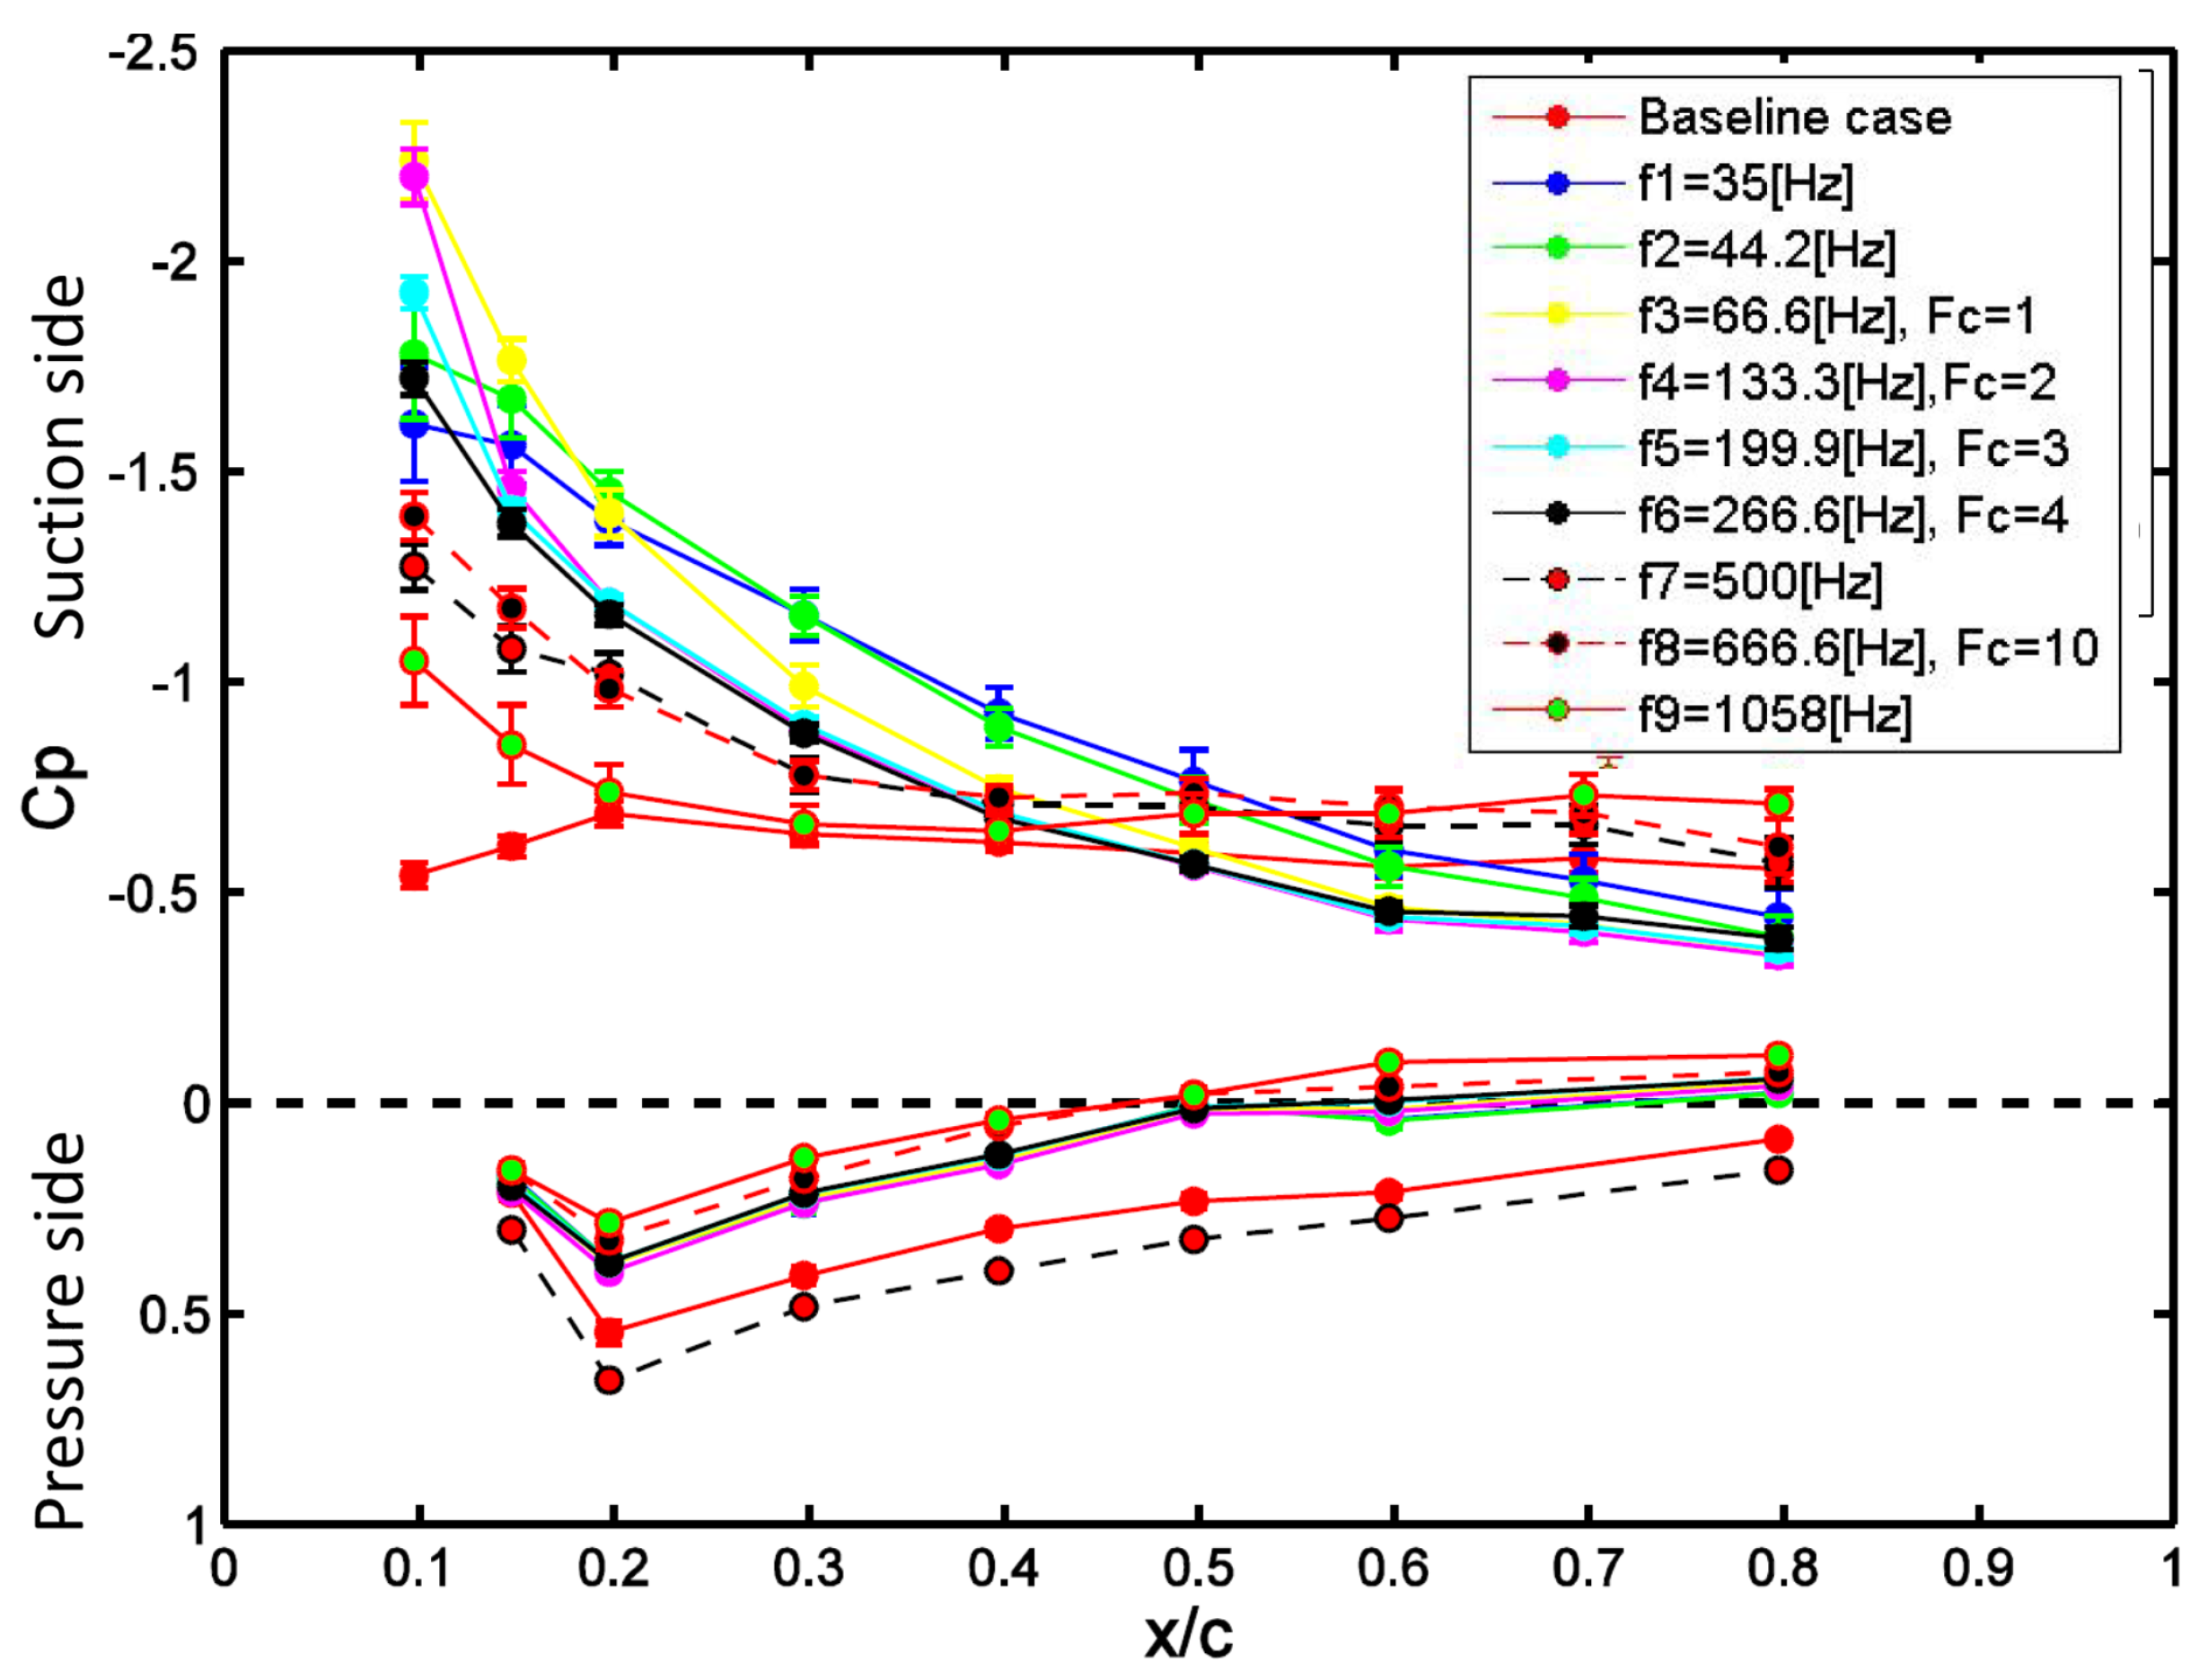
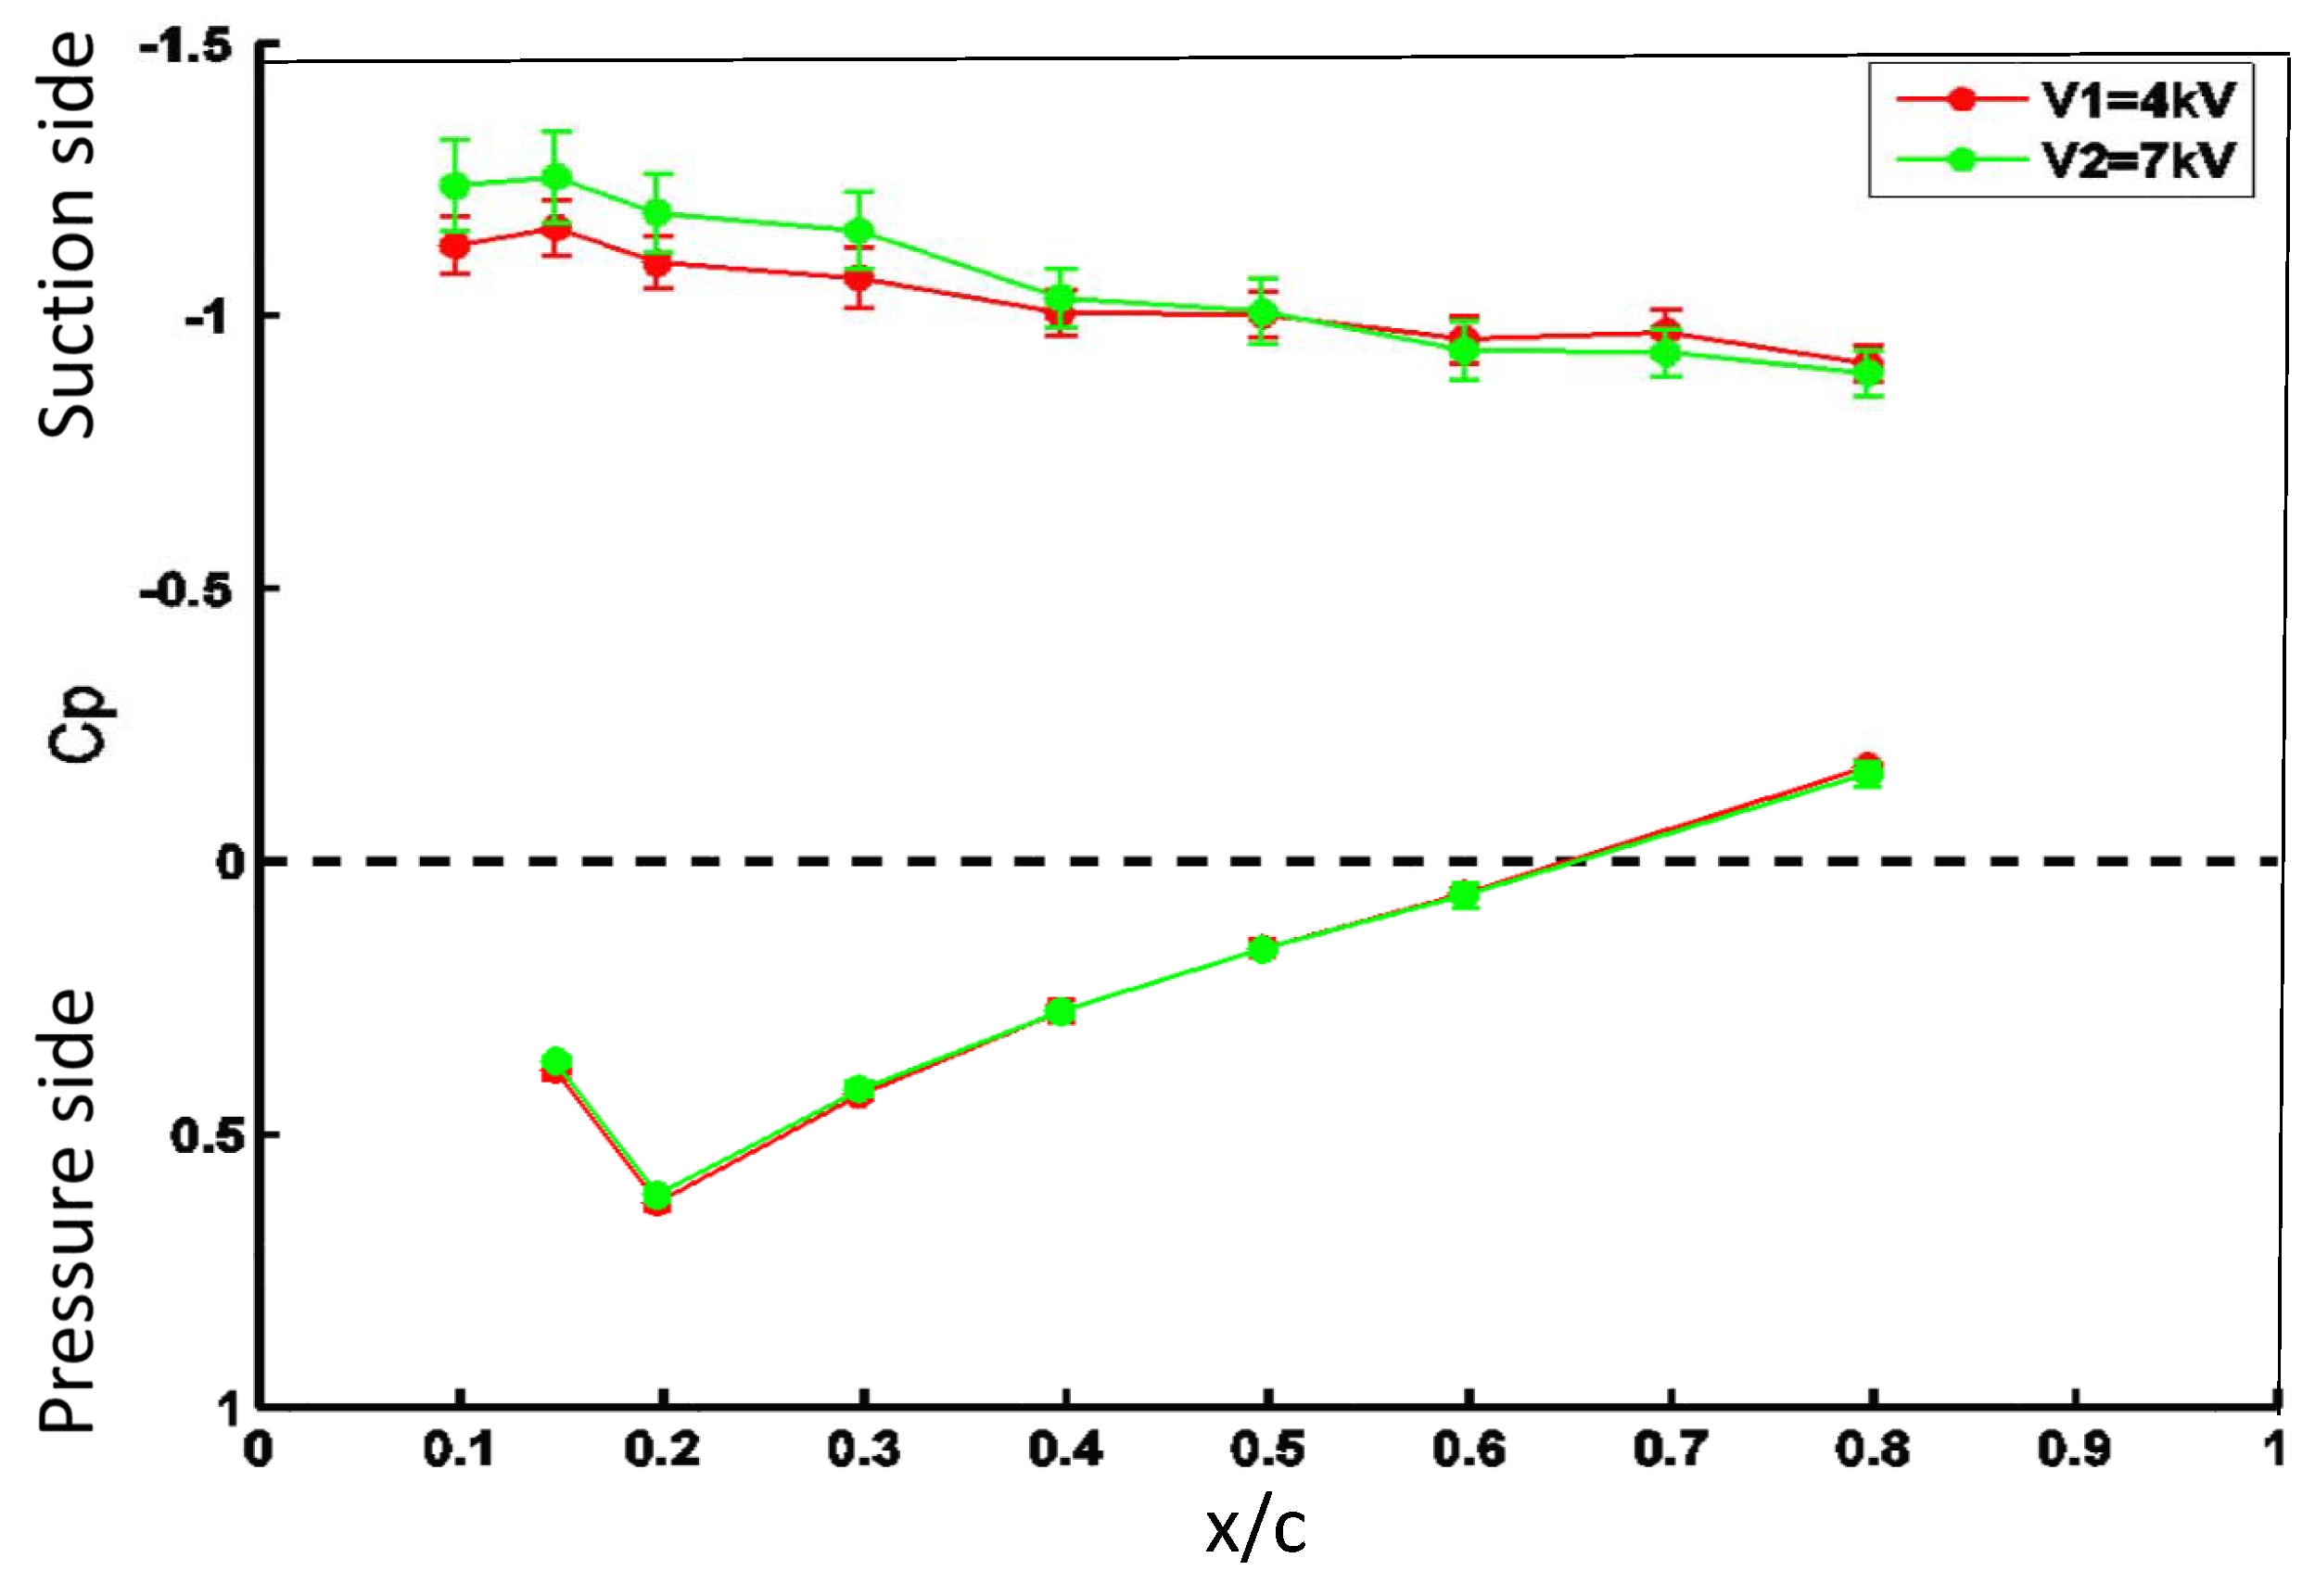
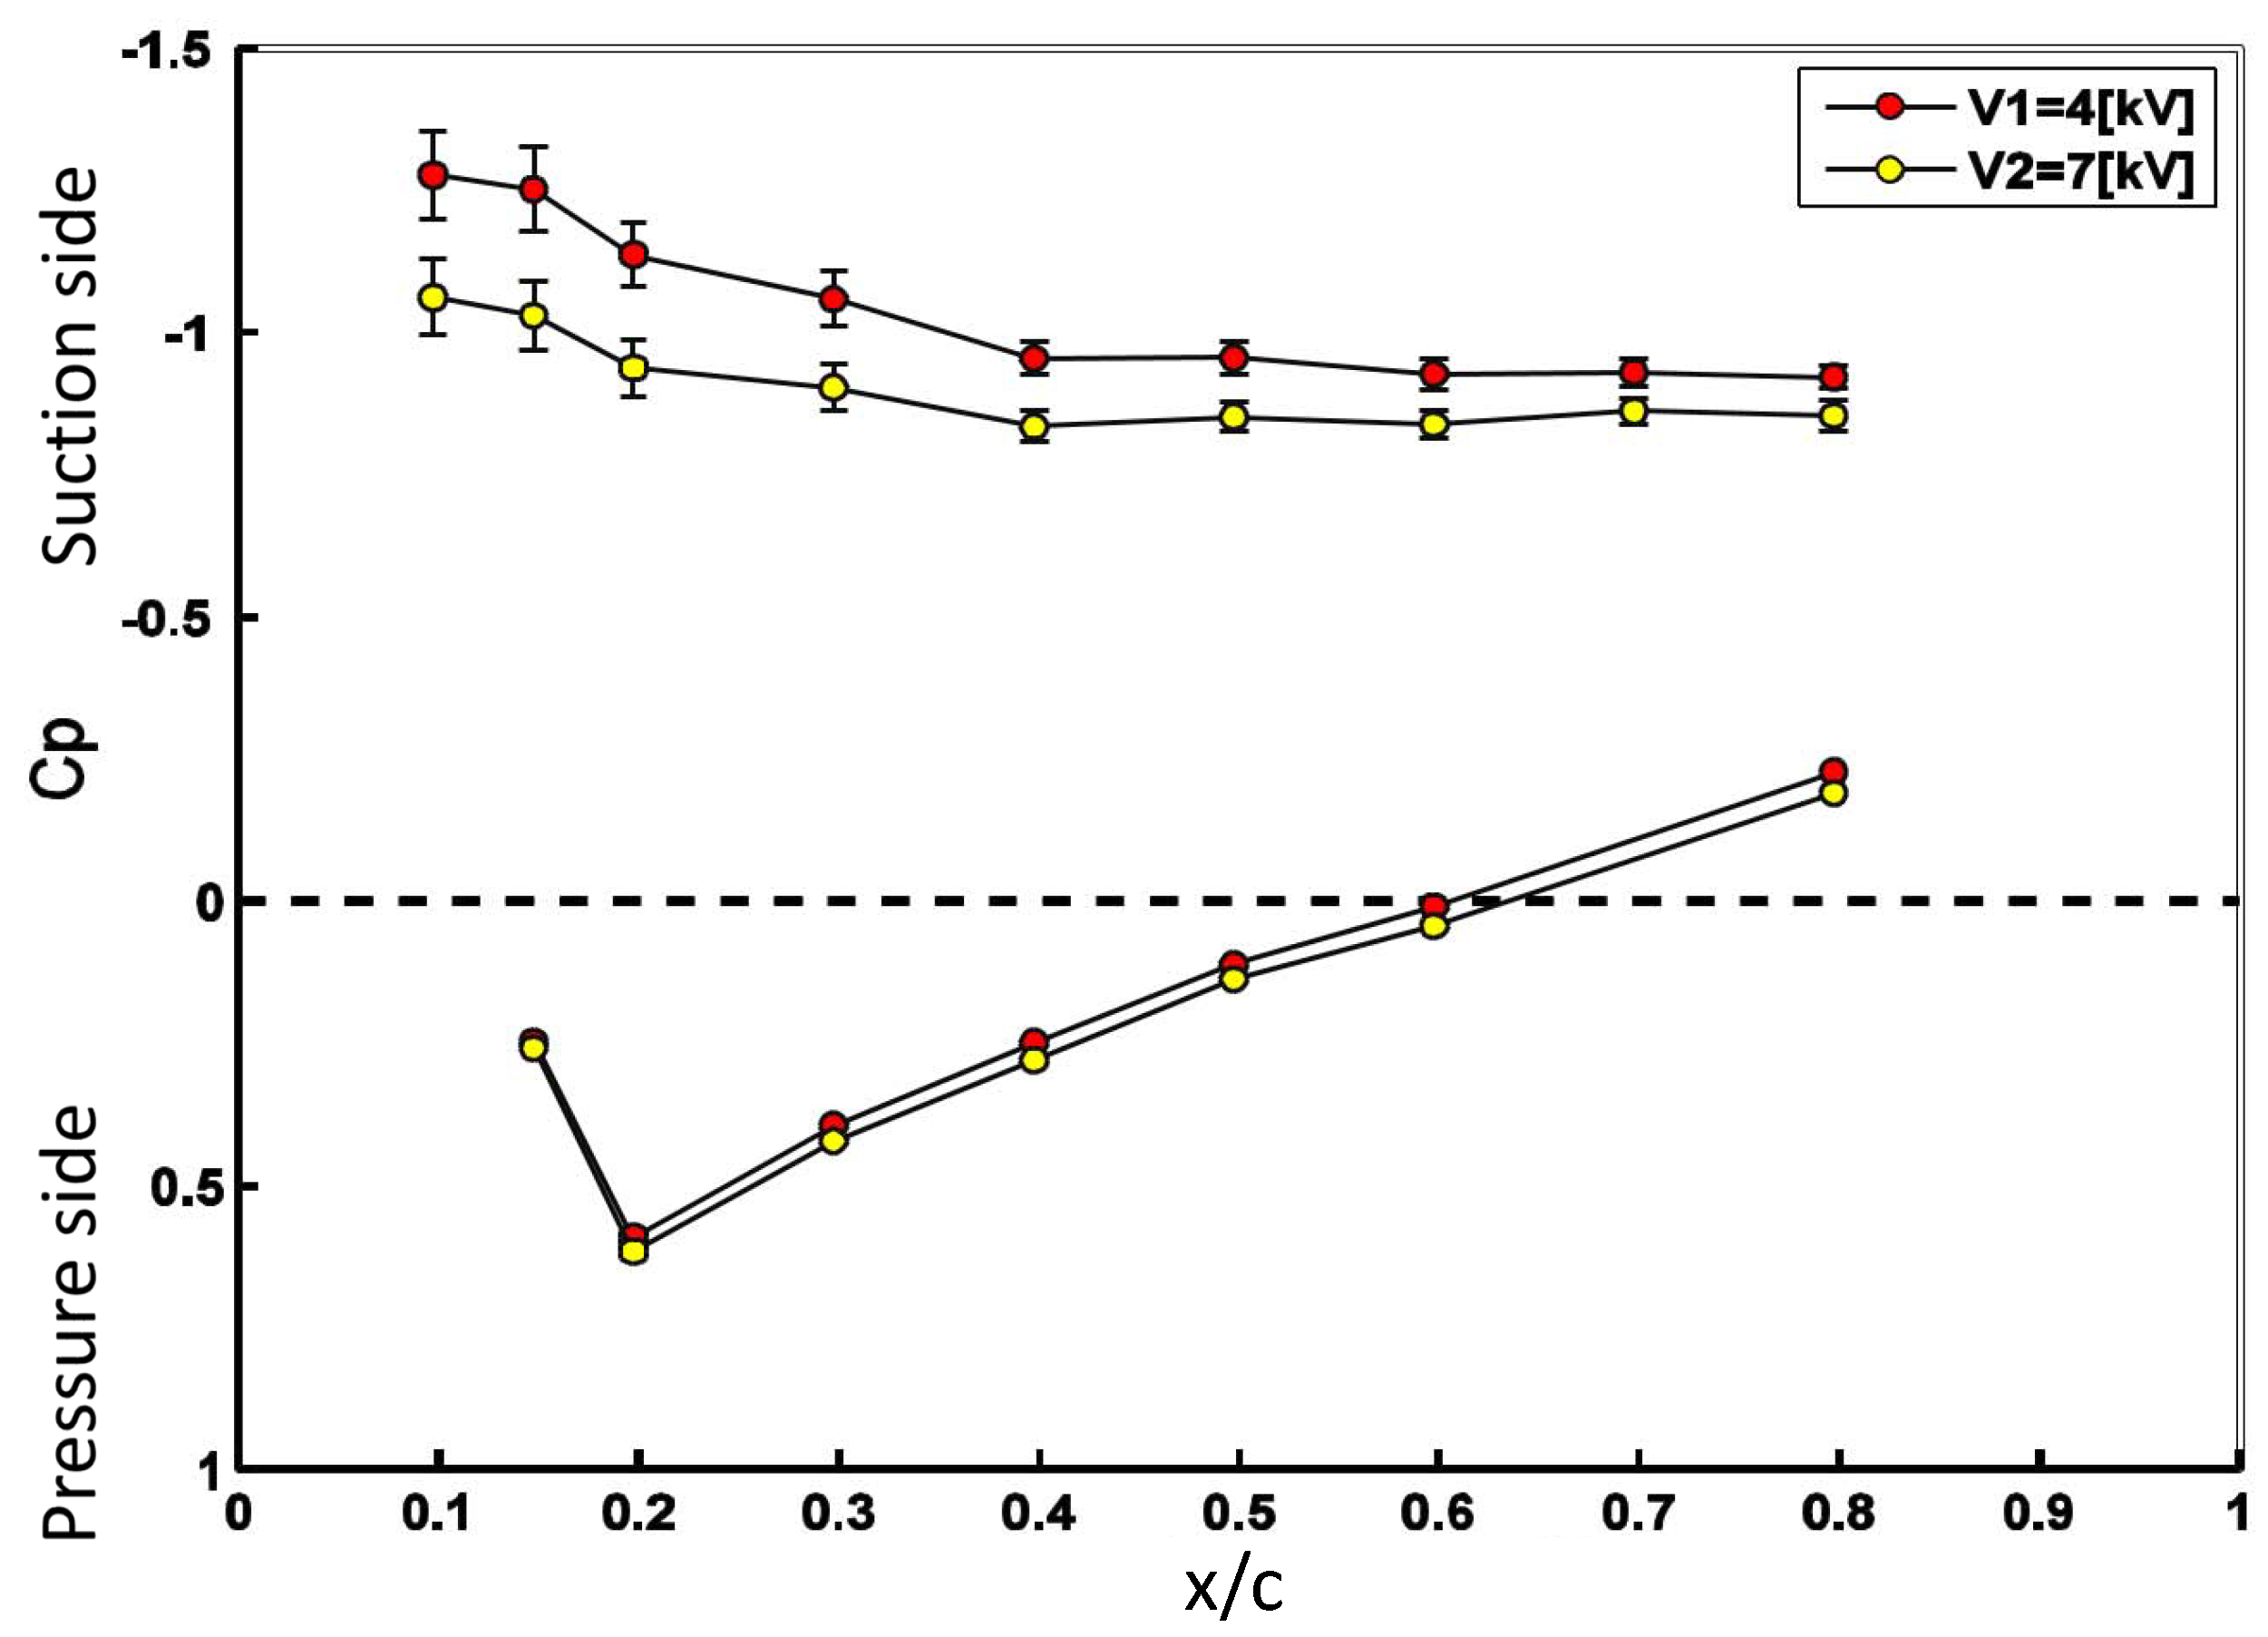
4.2. Pressure Measurements with DBD Actuation

To test the effectiveness of the dominant characteristic flow frequencies when used as an actuation frequency, the first criterion used was the pressure distribution along the airfoil. This would indicate which frequencies are most adept at re-attaching the separated flow.

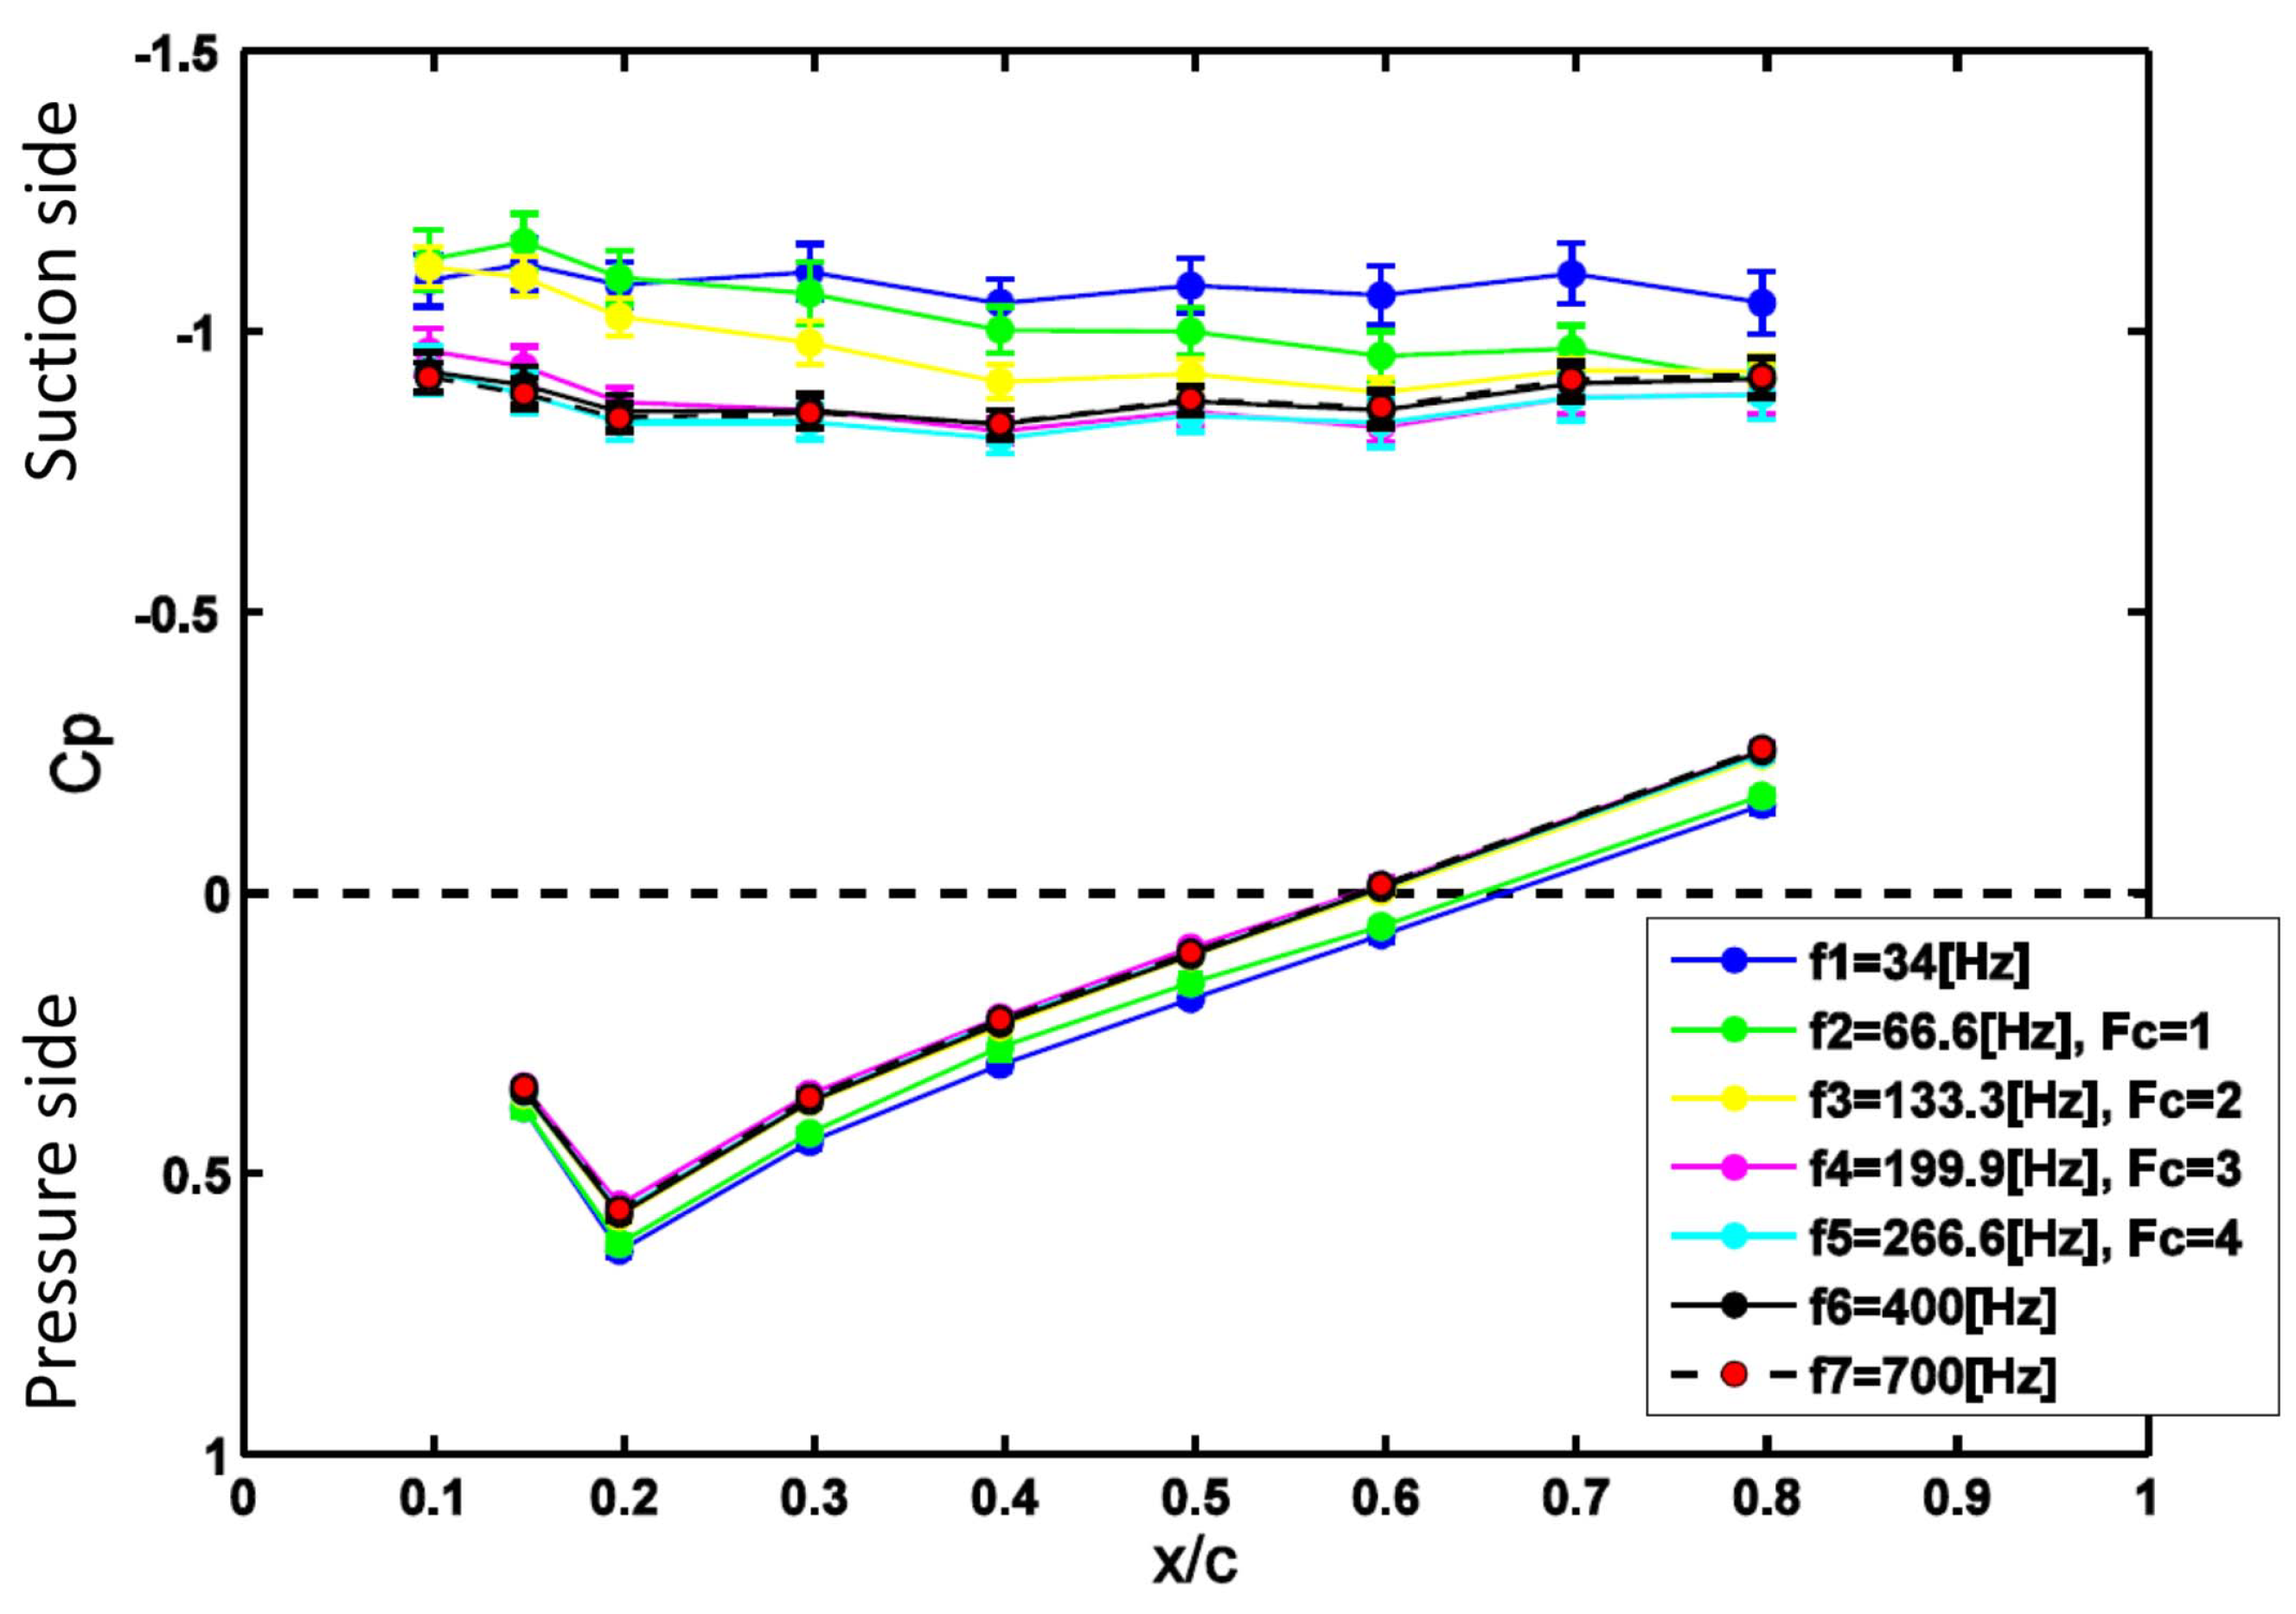
4.2.1. Early Post-Stall α = 16

This case was tested for R e = 100,000 and R e = 200,000 at all the dominant characteristic frequencies detected from the power spectra, as well as values of reduced frequency F c + = 1 , 2, 3, 4 and F c + = 10 in the case of R e = 100,000 and F c + = 1 , 2 and F c + = 4 in the case of R e = 200,000 . The resulting pressure distributions can be seen in Figure 9 and Figure 10.
In the case of R e = 100,000 , the actuation frequencies that produced the highest peak on the suction side of the airfoil were F c + = 1 and 2, as is well established in the literature. The actuation frequencies of f = 35.0 and 44.2 Hz , which were obtained from the power spectra, also showed promising control authority, whereas the higher actuation frequencies showed less performance. Furthermore, it was observed that, when the DBD was actuated at f = 35.0 and 44.2 Hz , the area below the curve increased, although no conclusions can be made since lift measurements were not obtained. Note that the phenomenon of re-attachment was unstable, as shown by the error bars on the graph.
Surprisingly, at R e = 200,000 , the highest suction peak was produced when the DBD was actuated at the characteristic frequencies of the wake and in particular f = 41.0 Hz . As before, it was observed that the area below the curve was larger when the DBD was actuated at the dominant frequencies of the wake, compared to actuation frequencies of F c + = 1 and 2. However, the fluctuations of the pressure readings were higher in the case of f = 33.6 and 41.0 Hz .

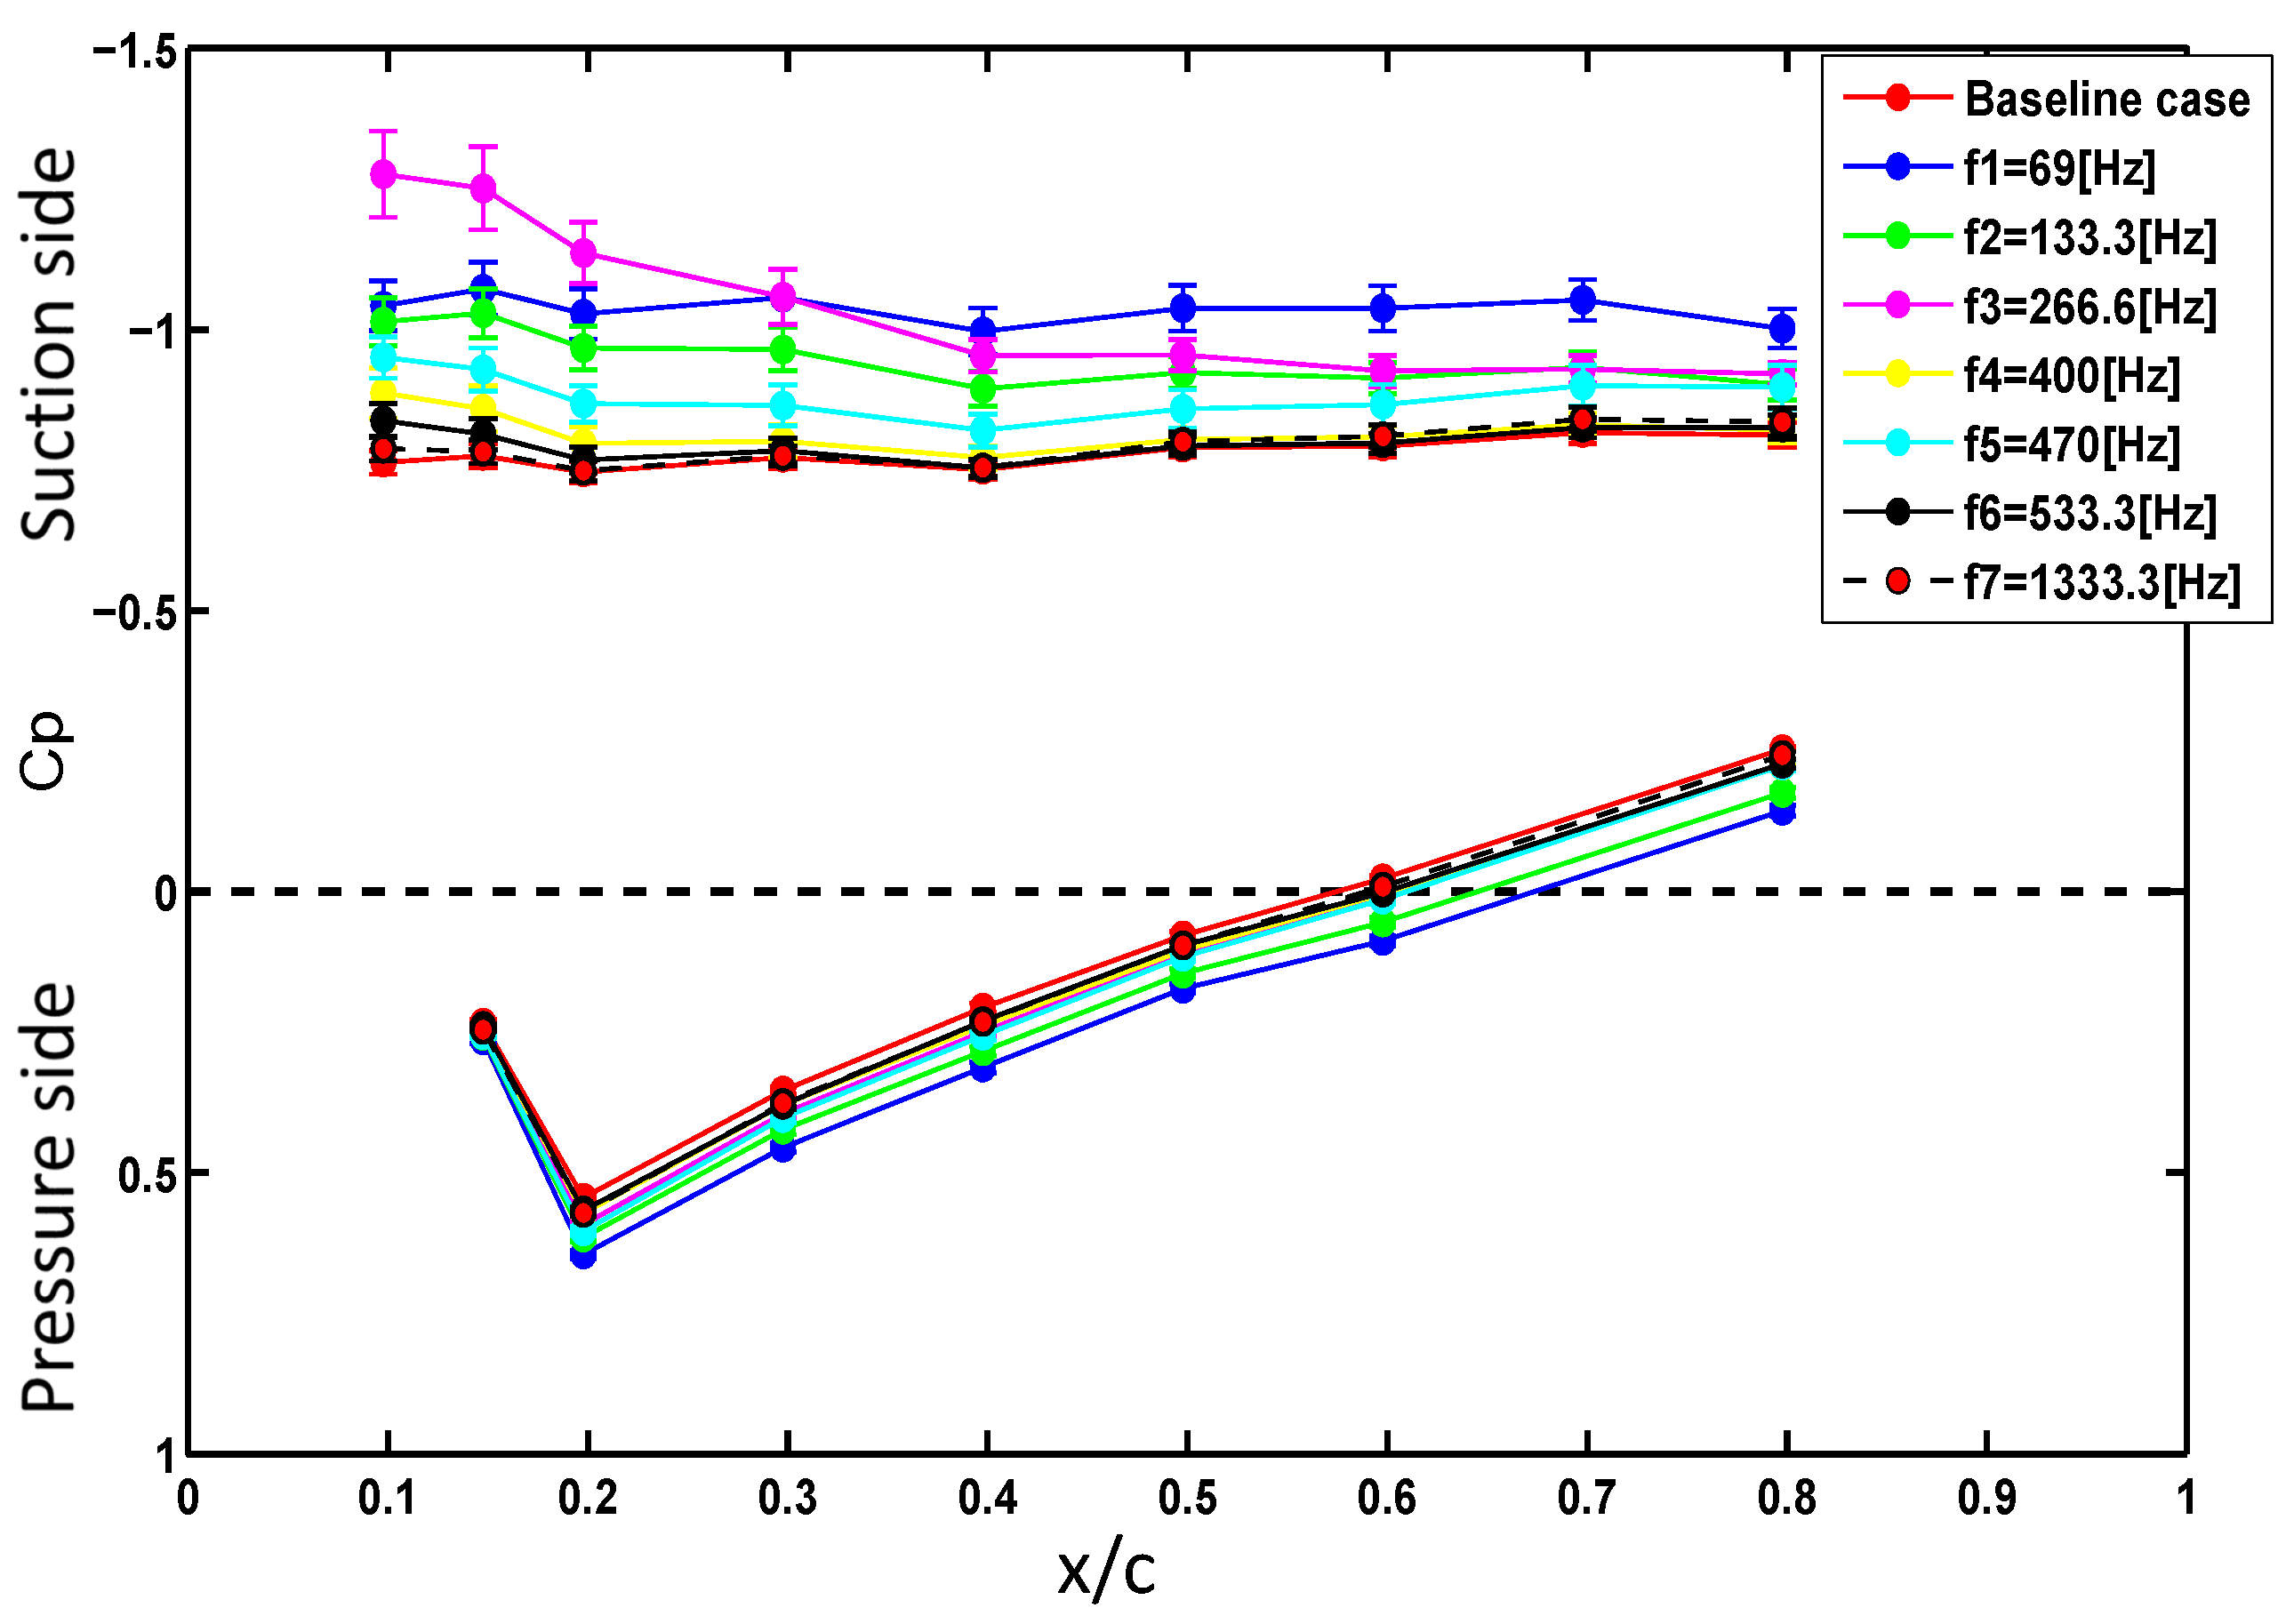
4.2.2. Late Post-Stall α = 24

Again, this case was tested at same two Reynolds numbers as before. In the case of R e = 100,000 , besides the characteristic flow frequencies obtained from the power spectra, values of F c + = 1 , 2, 3 and 4 were tested. Similarly, in the case of R e = 200,000 , tested frequencies also included values of F c + = 1 , 2, 3, 4 and 10. The resulting C p distributions are shown in Figure 11 and Figure 12.
In both cases, the DBD actuator showed no significant control authority in re-attaching the separated flow, except in the case of R e = 200,000 and an actuation frequency of f = 266.6 Hz , which corresponds to F c + = 2 . The only phenomenon observed was the increase of the C p value on the suction side of the airfoil, which became more obvious in the case when the DBD was actuated at the lowest values of the characteristic flow frequencies obtained from the power spectra.

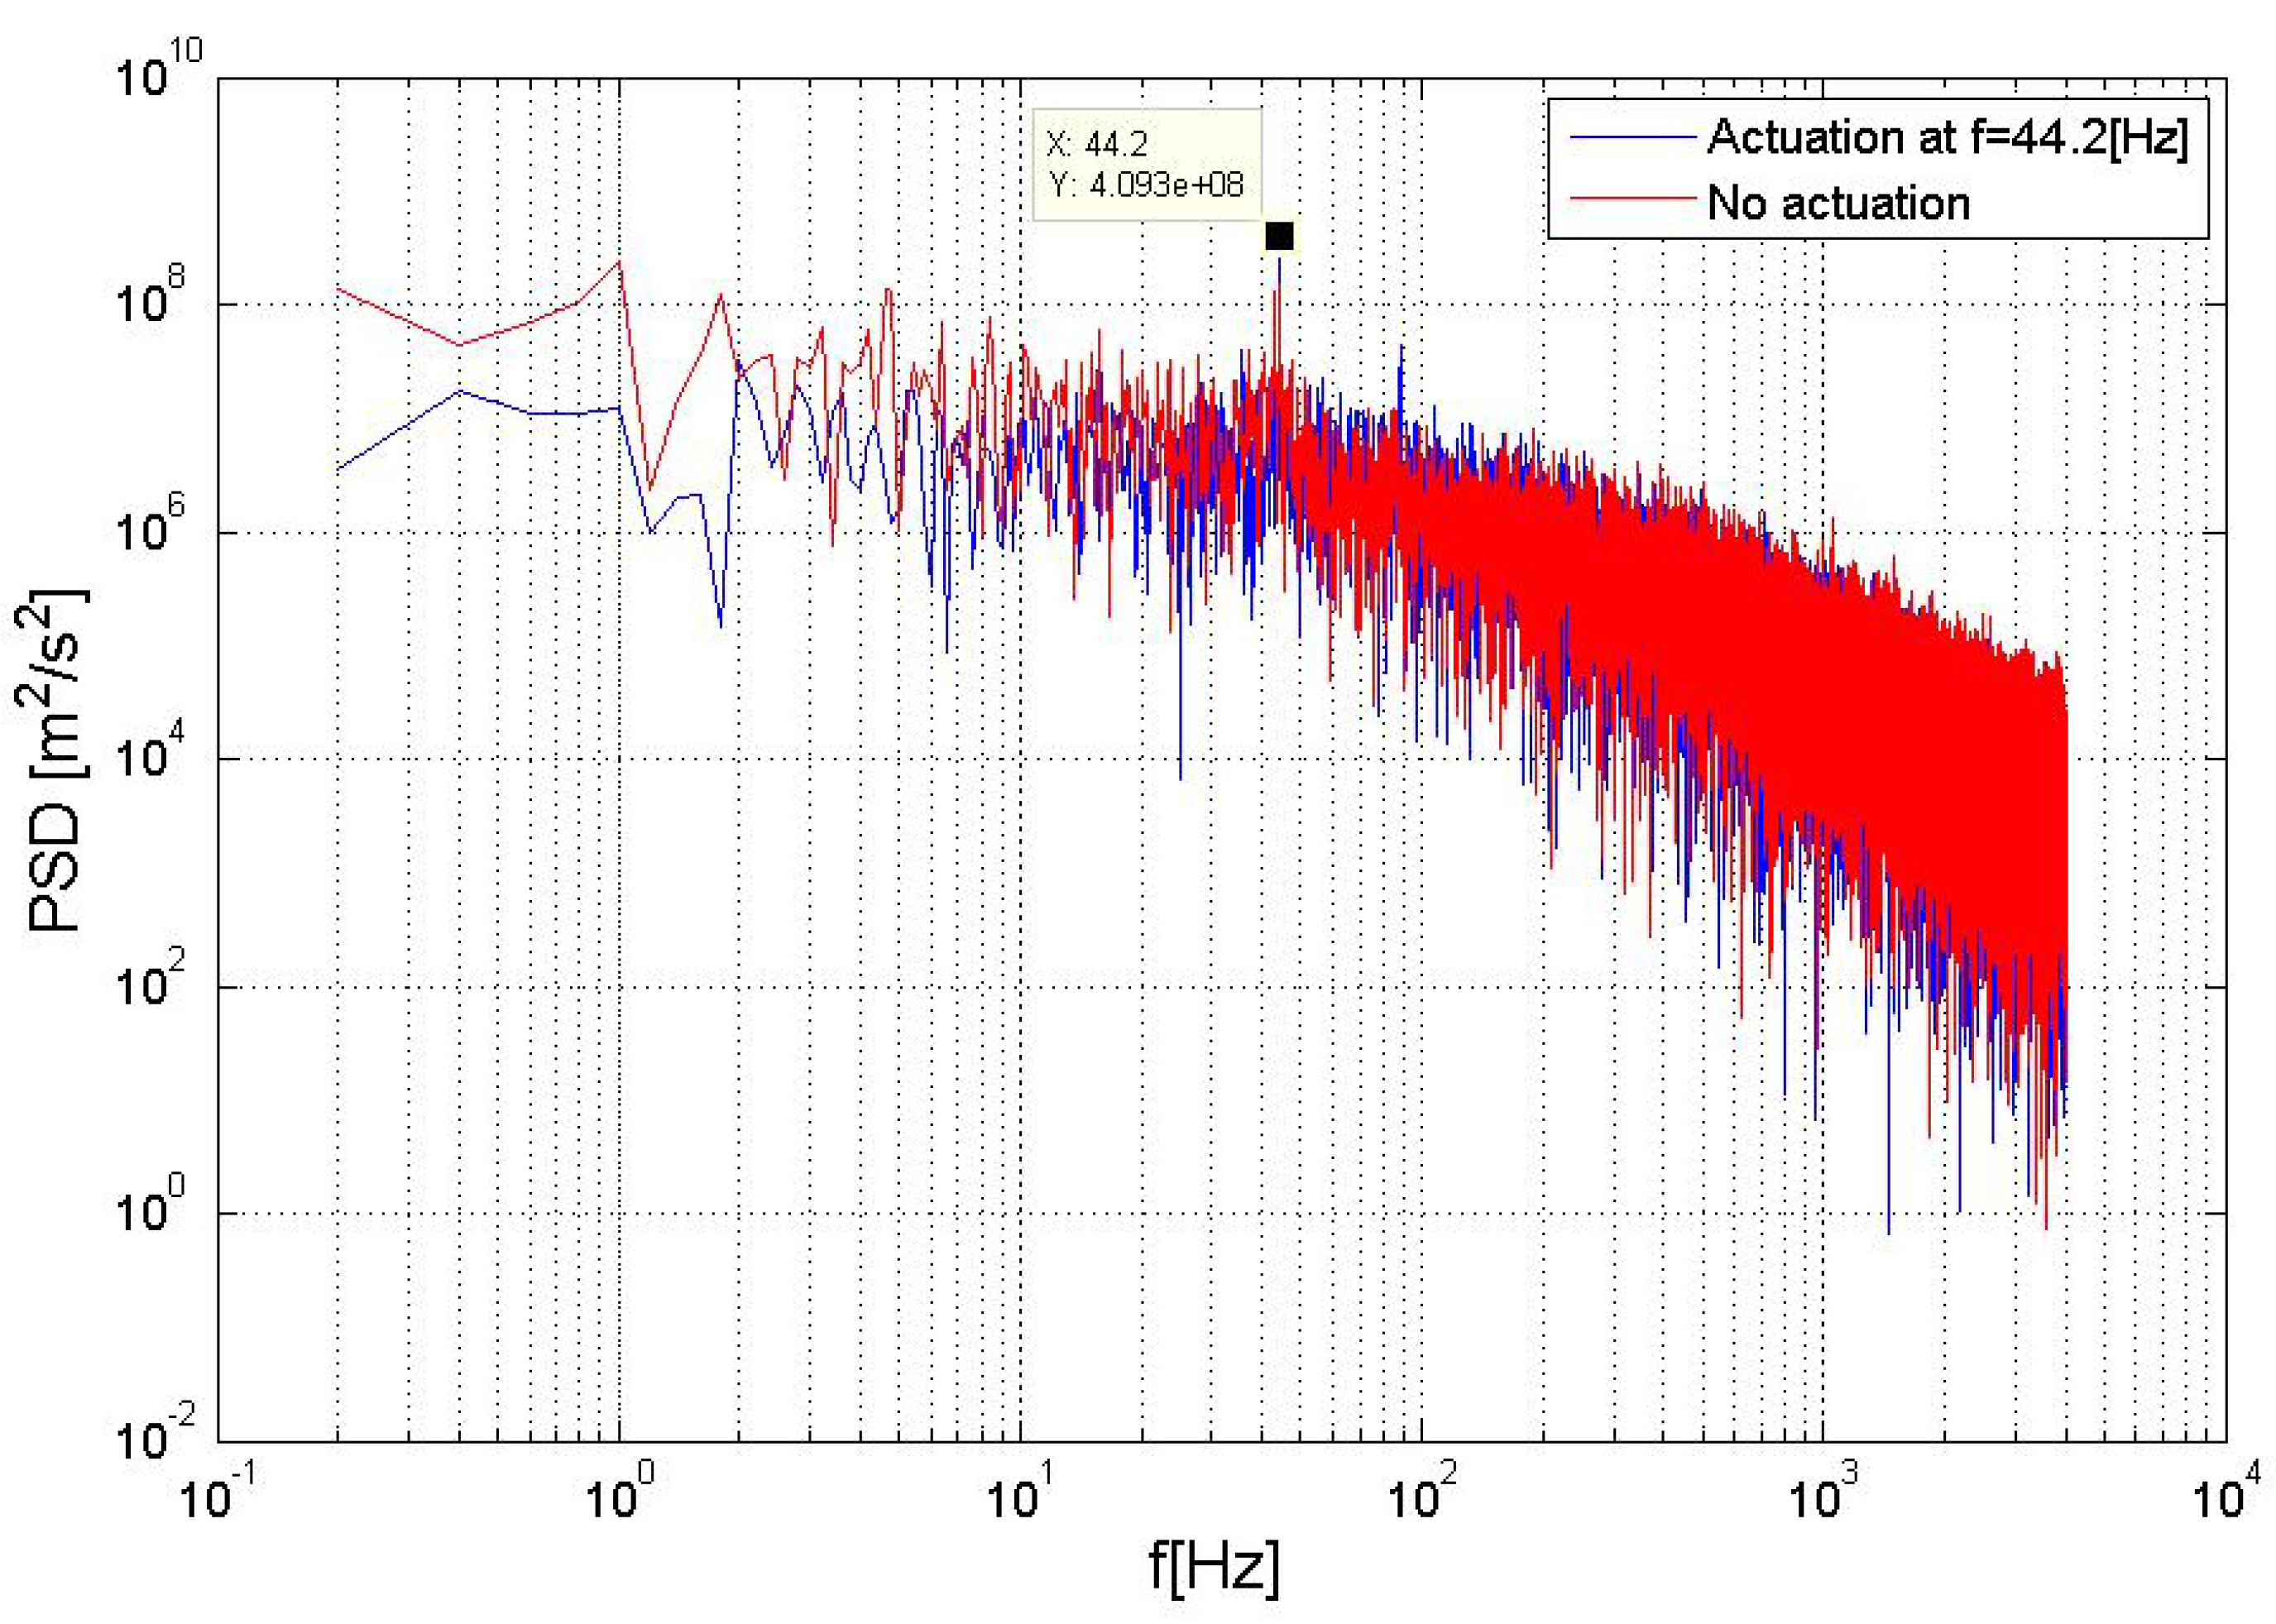
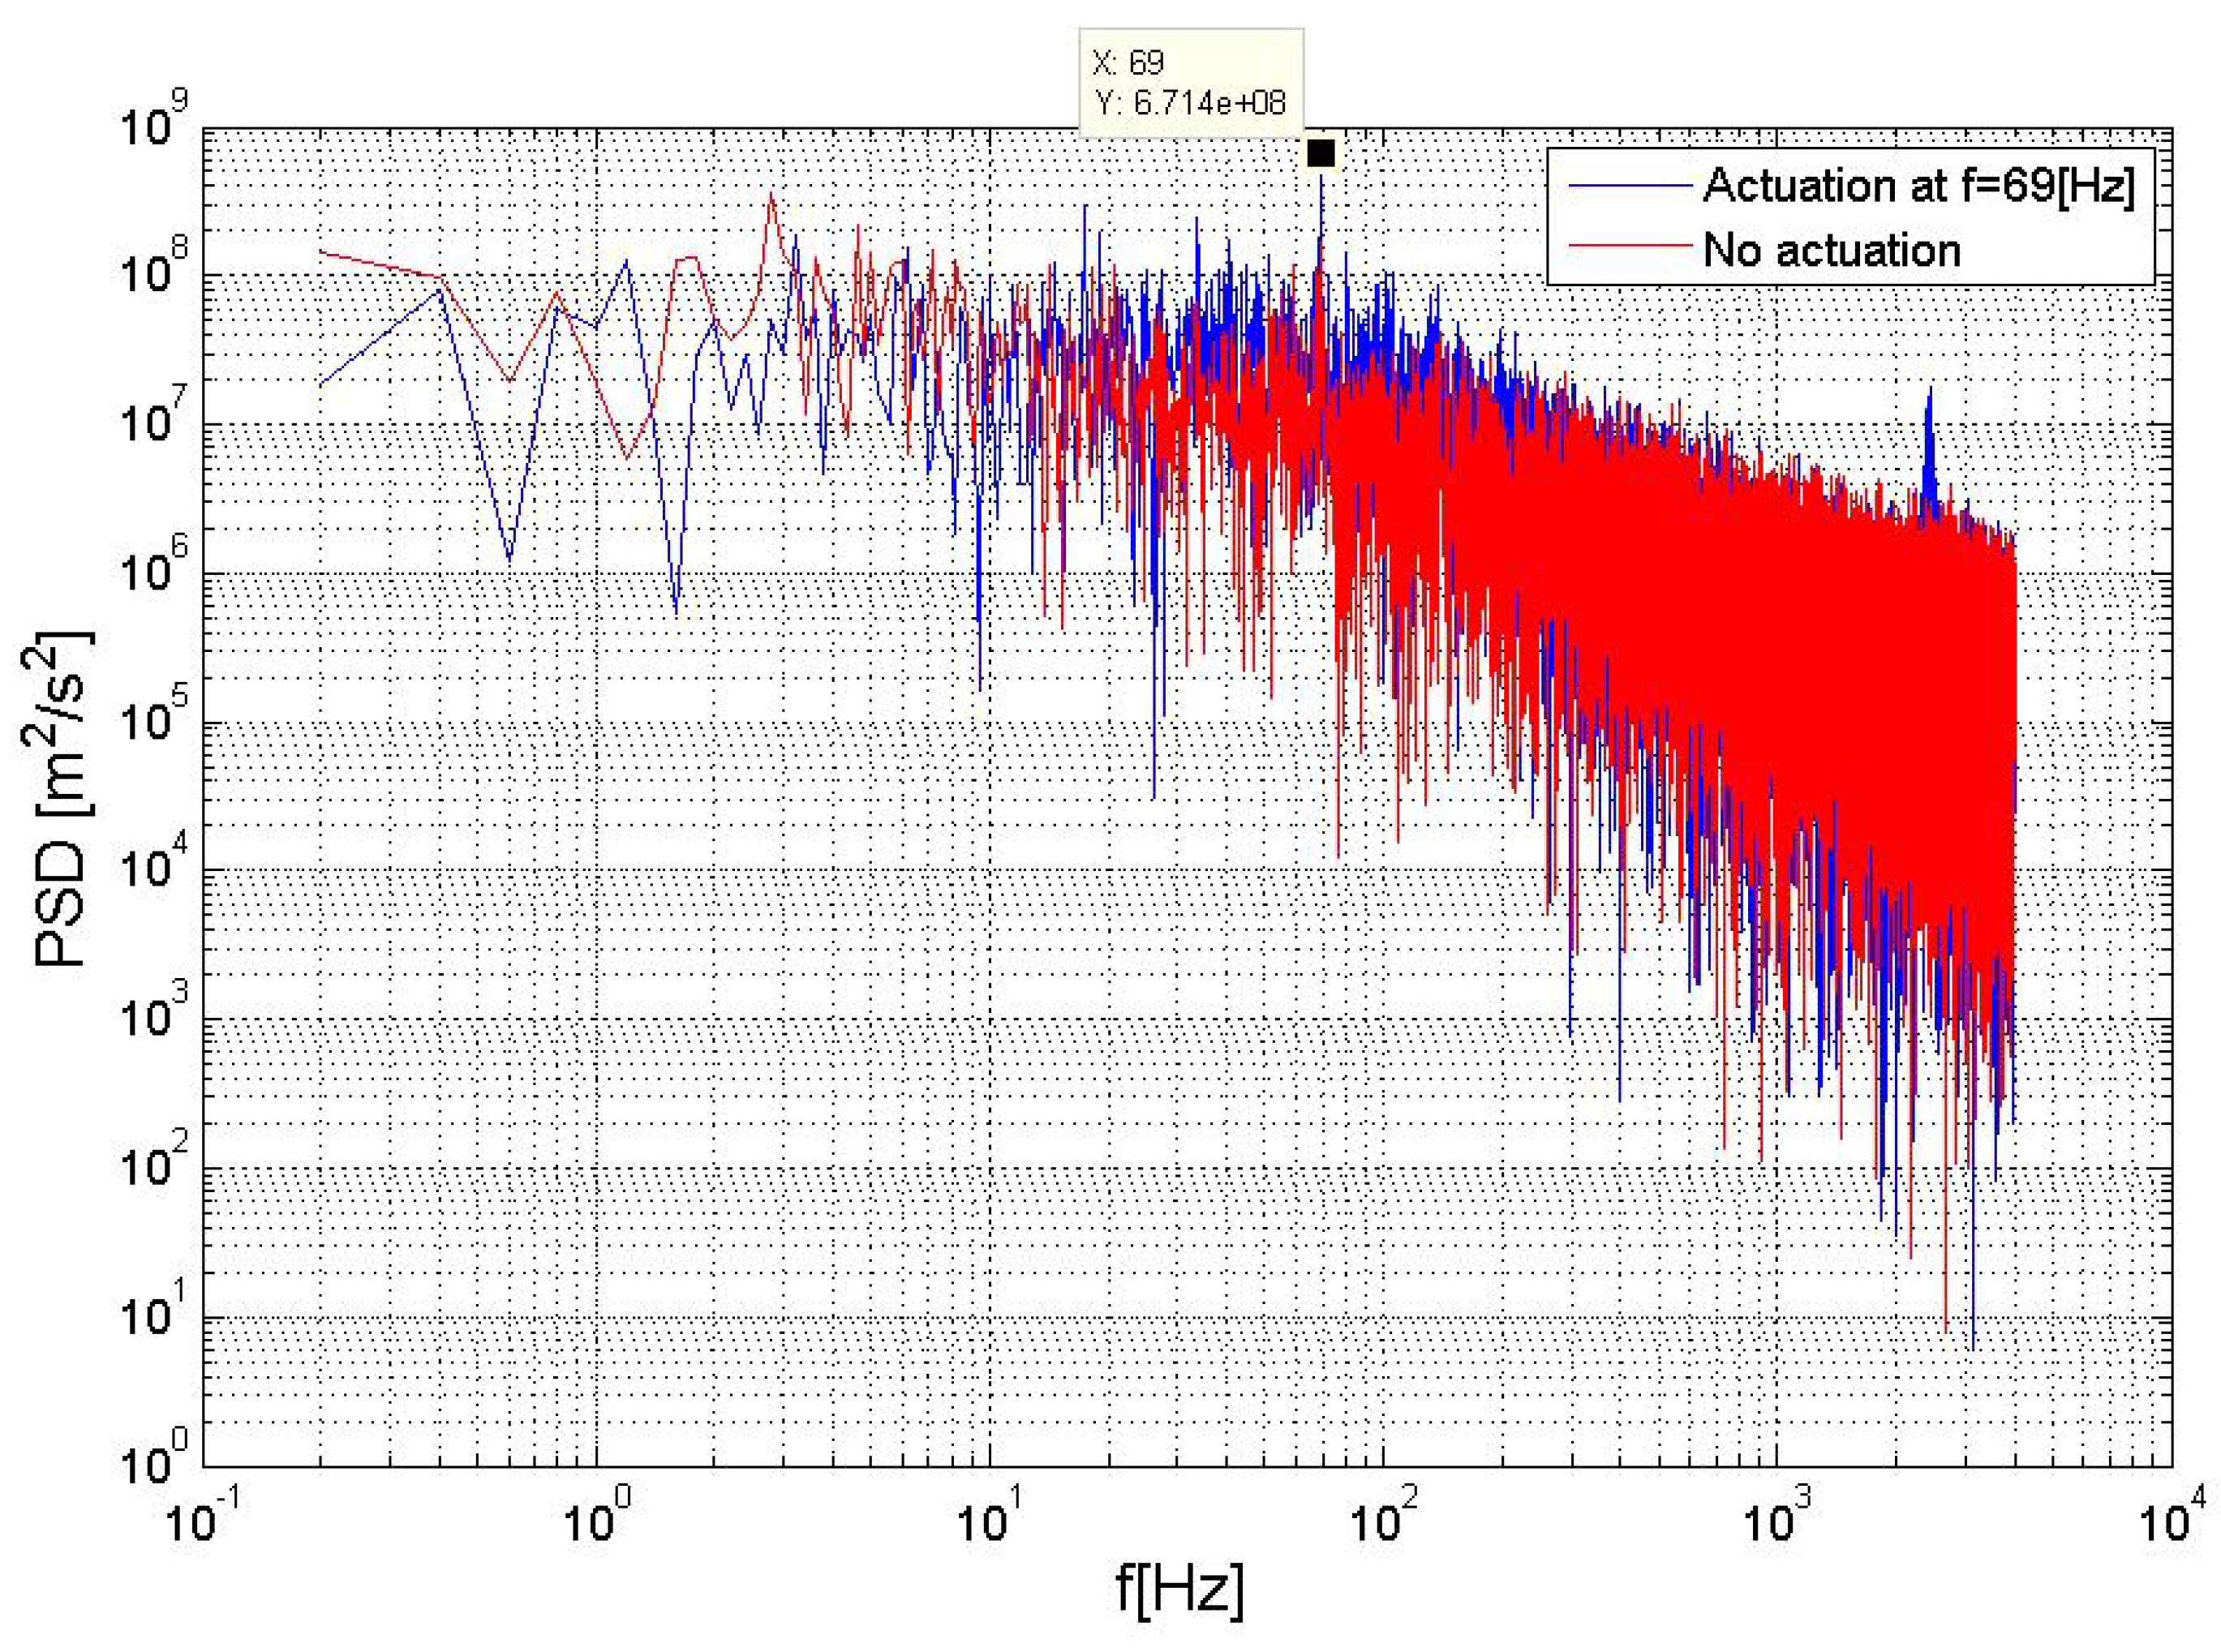
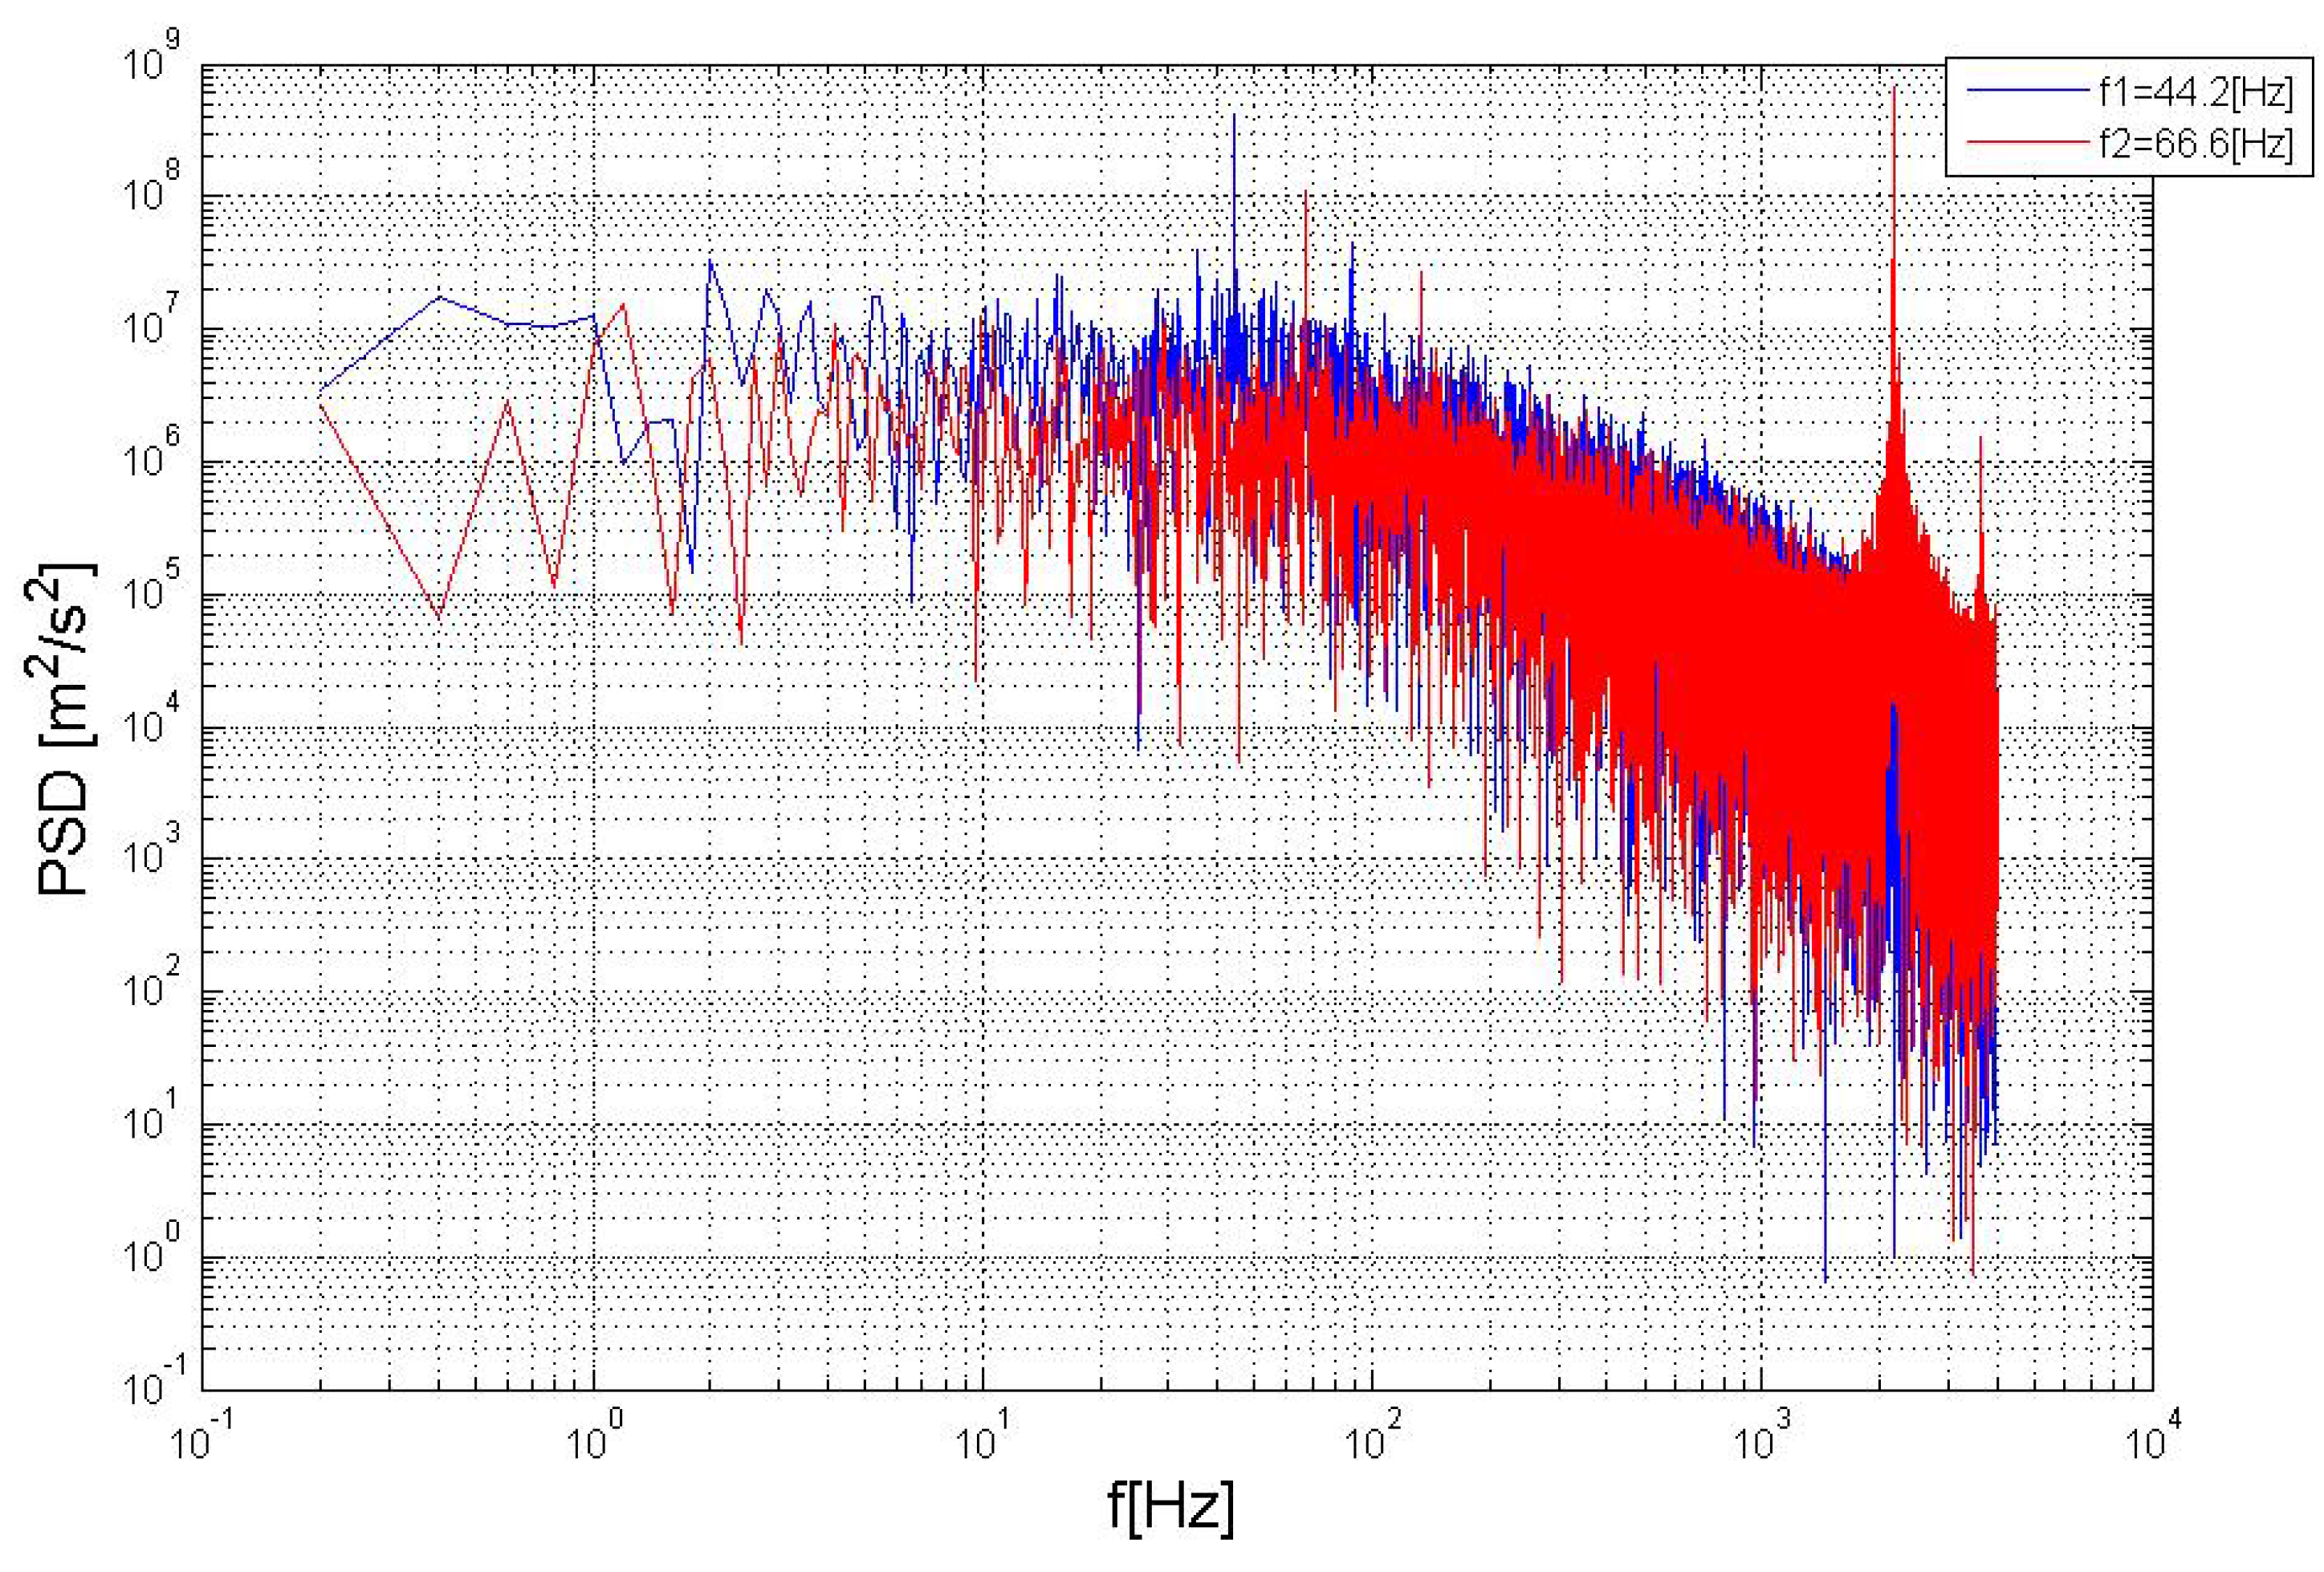
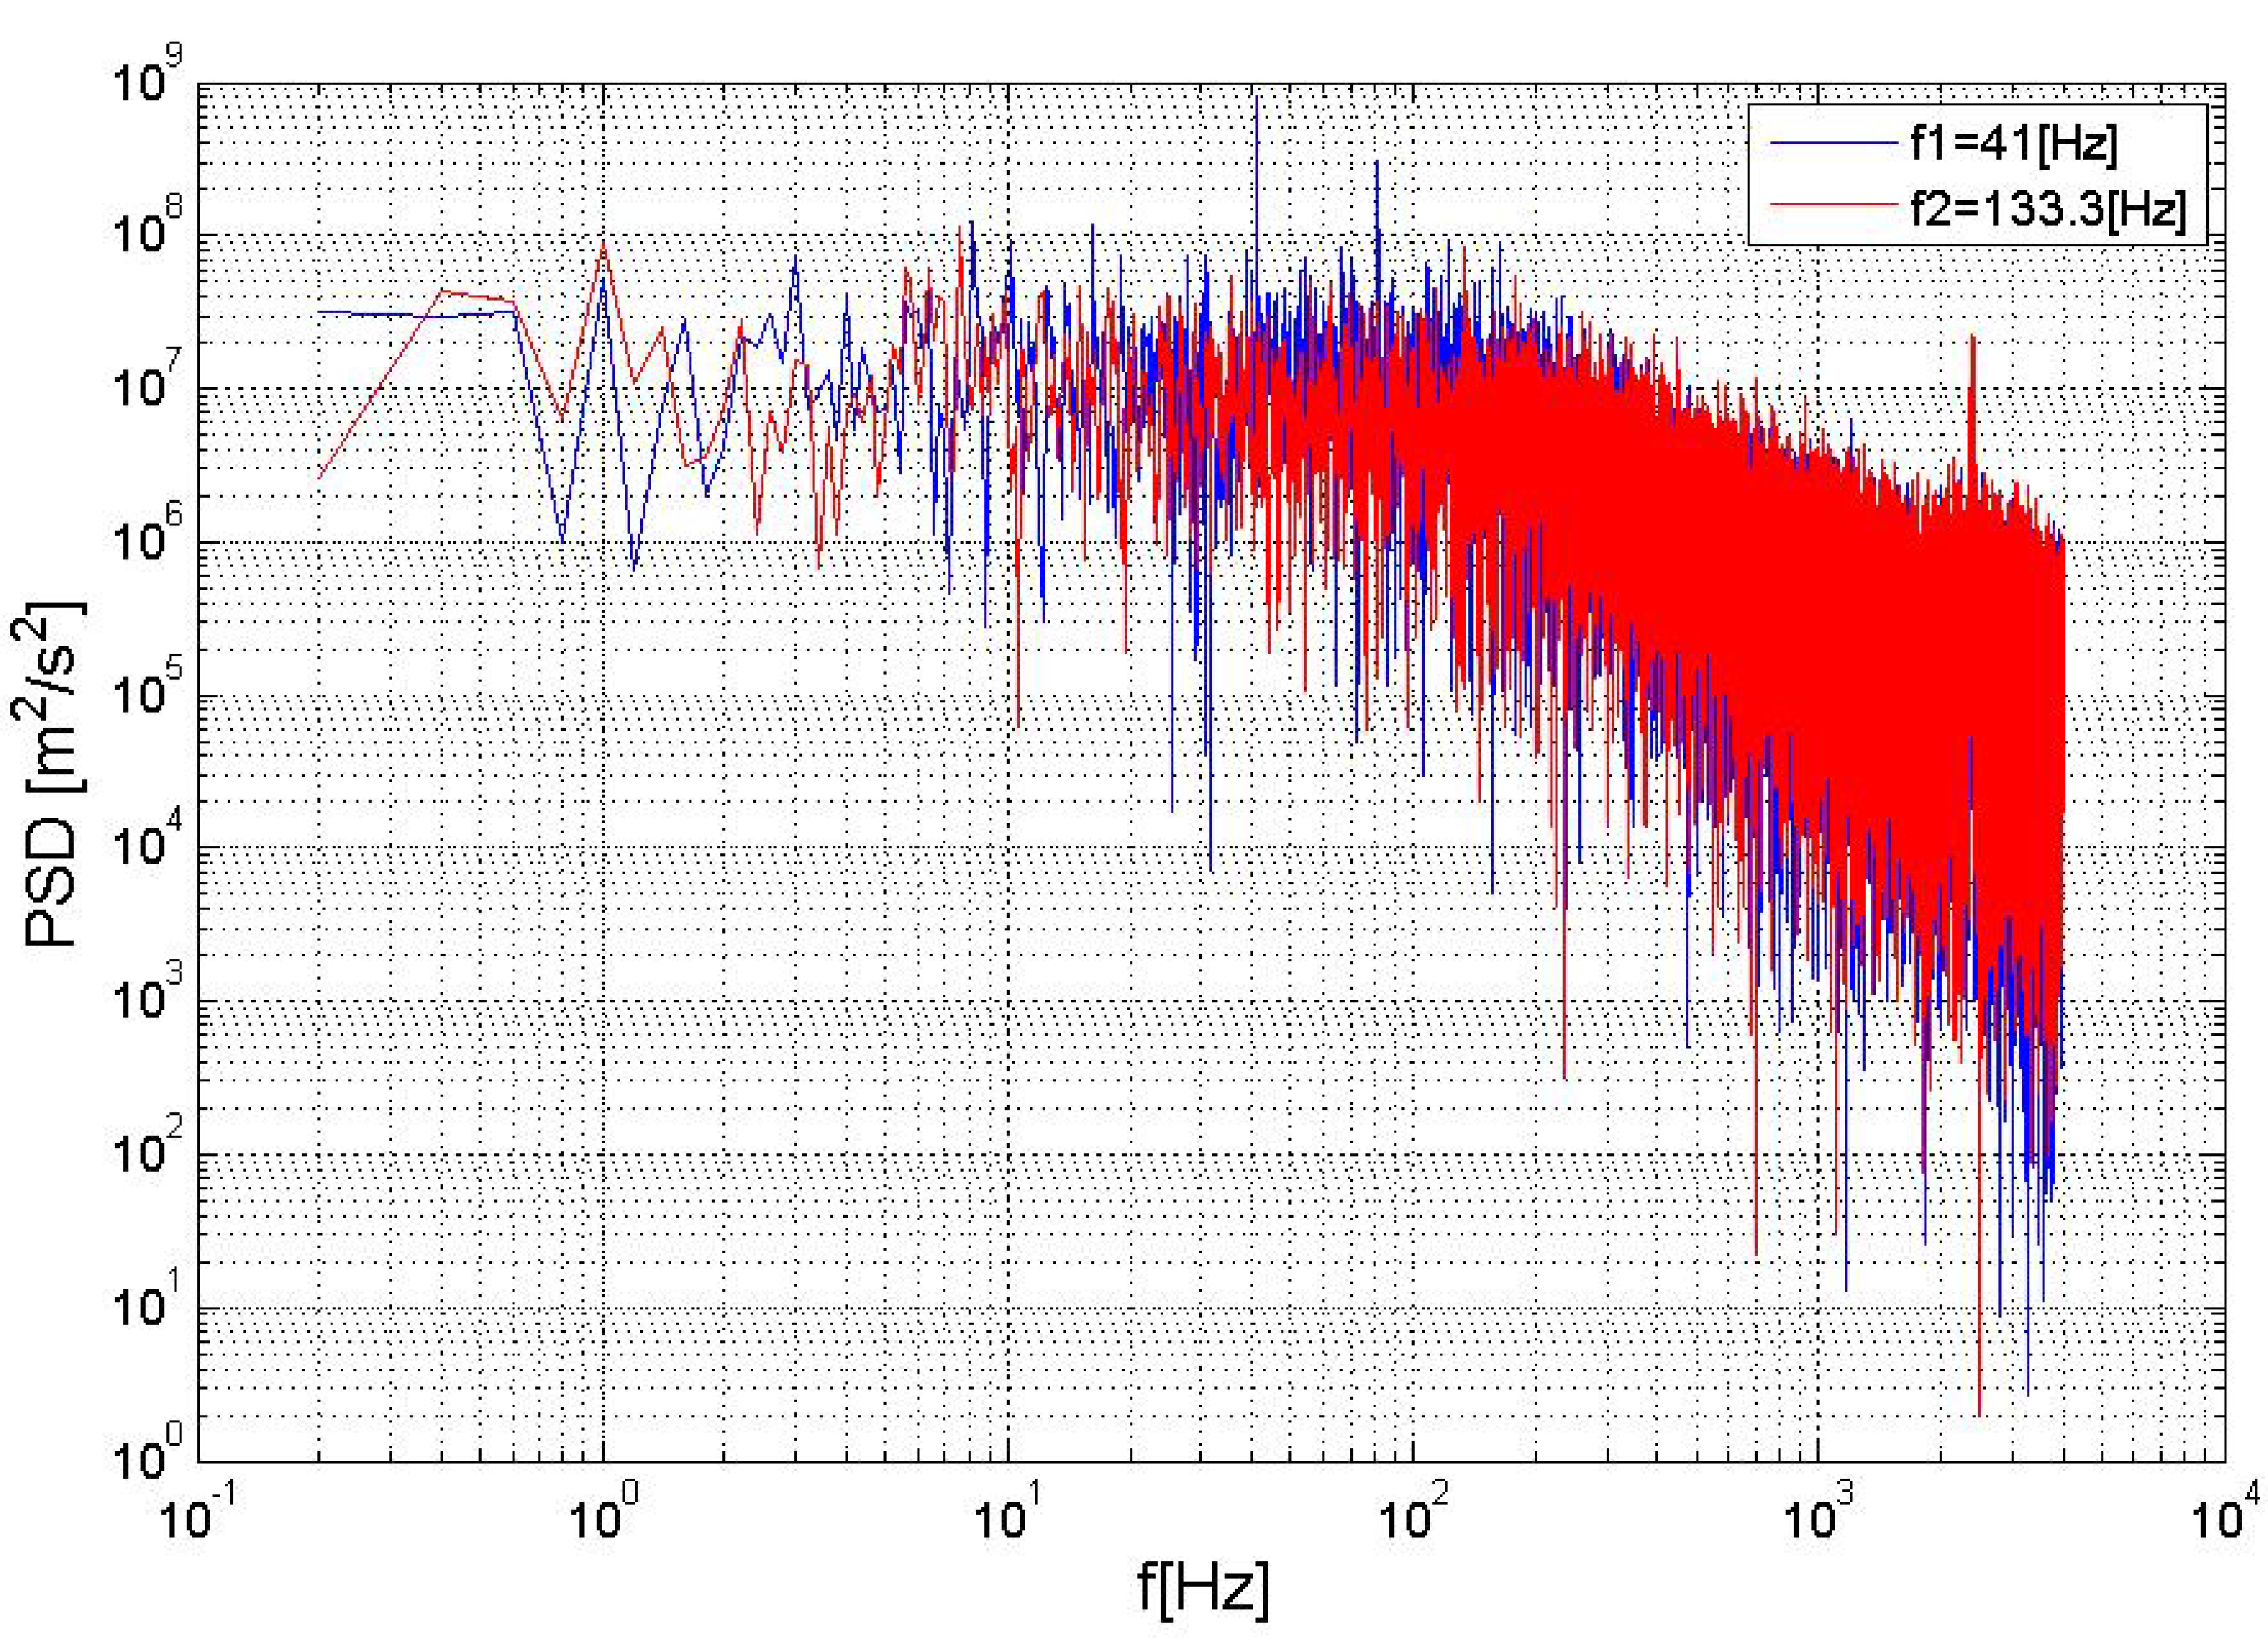
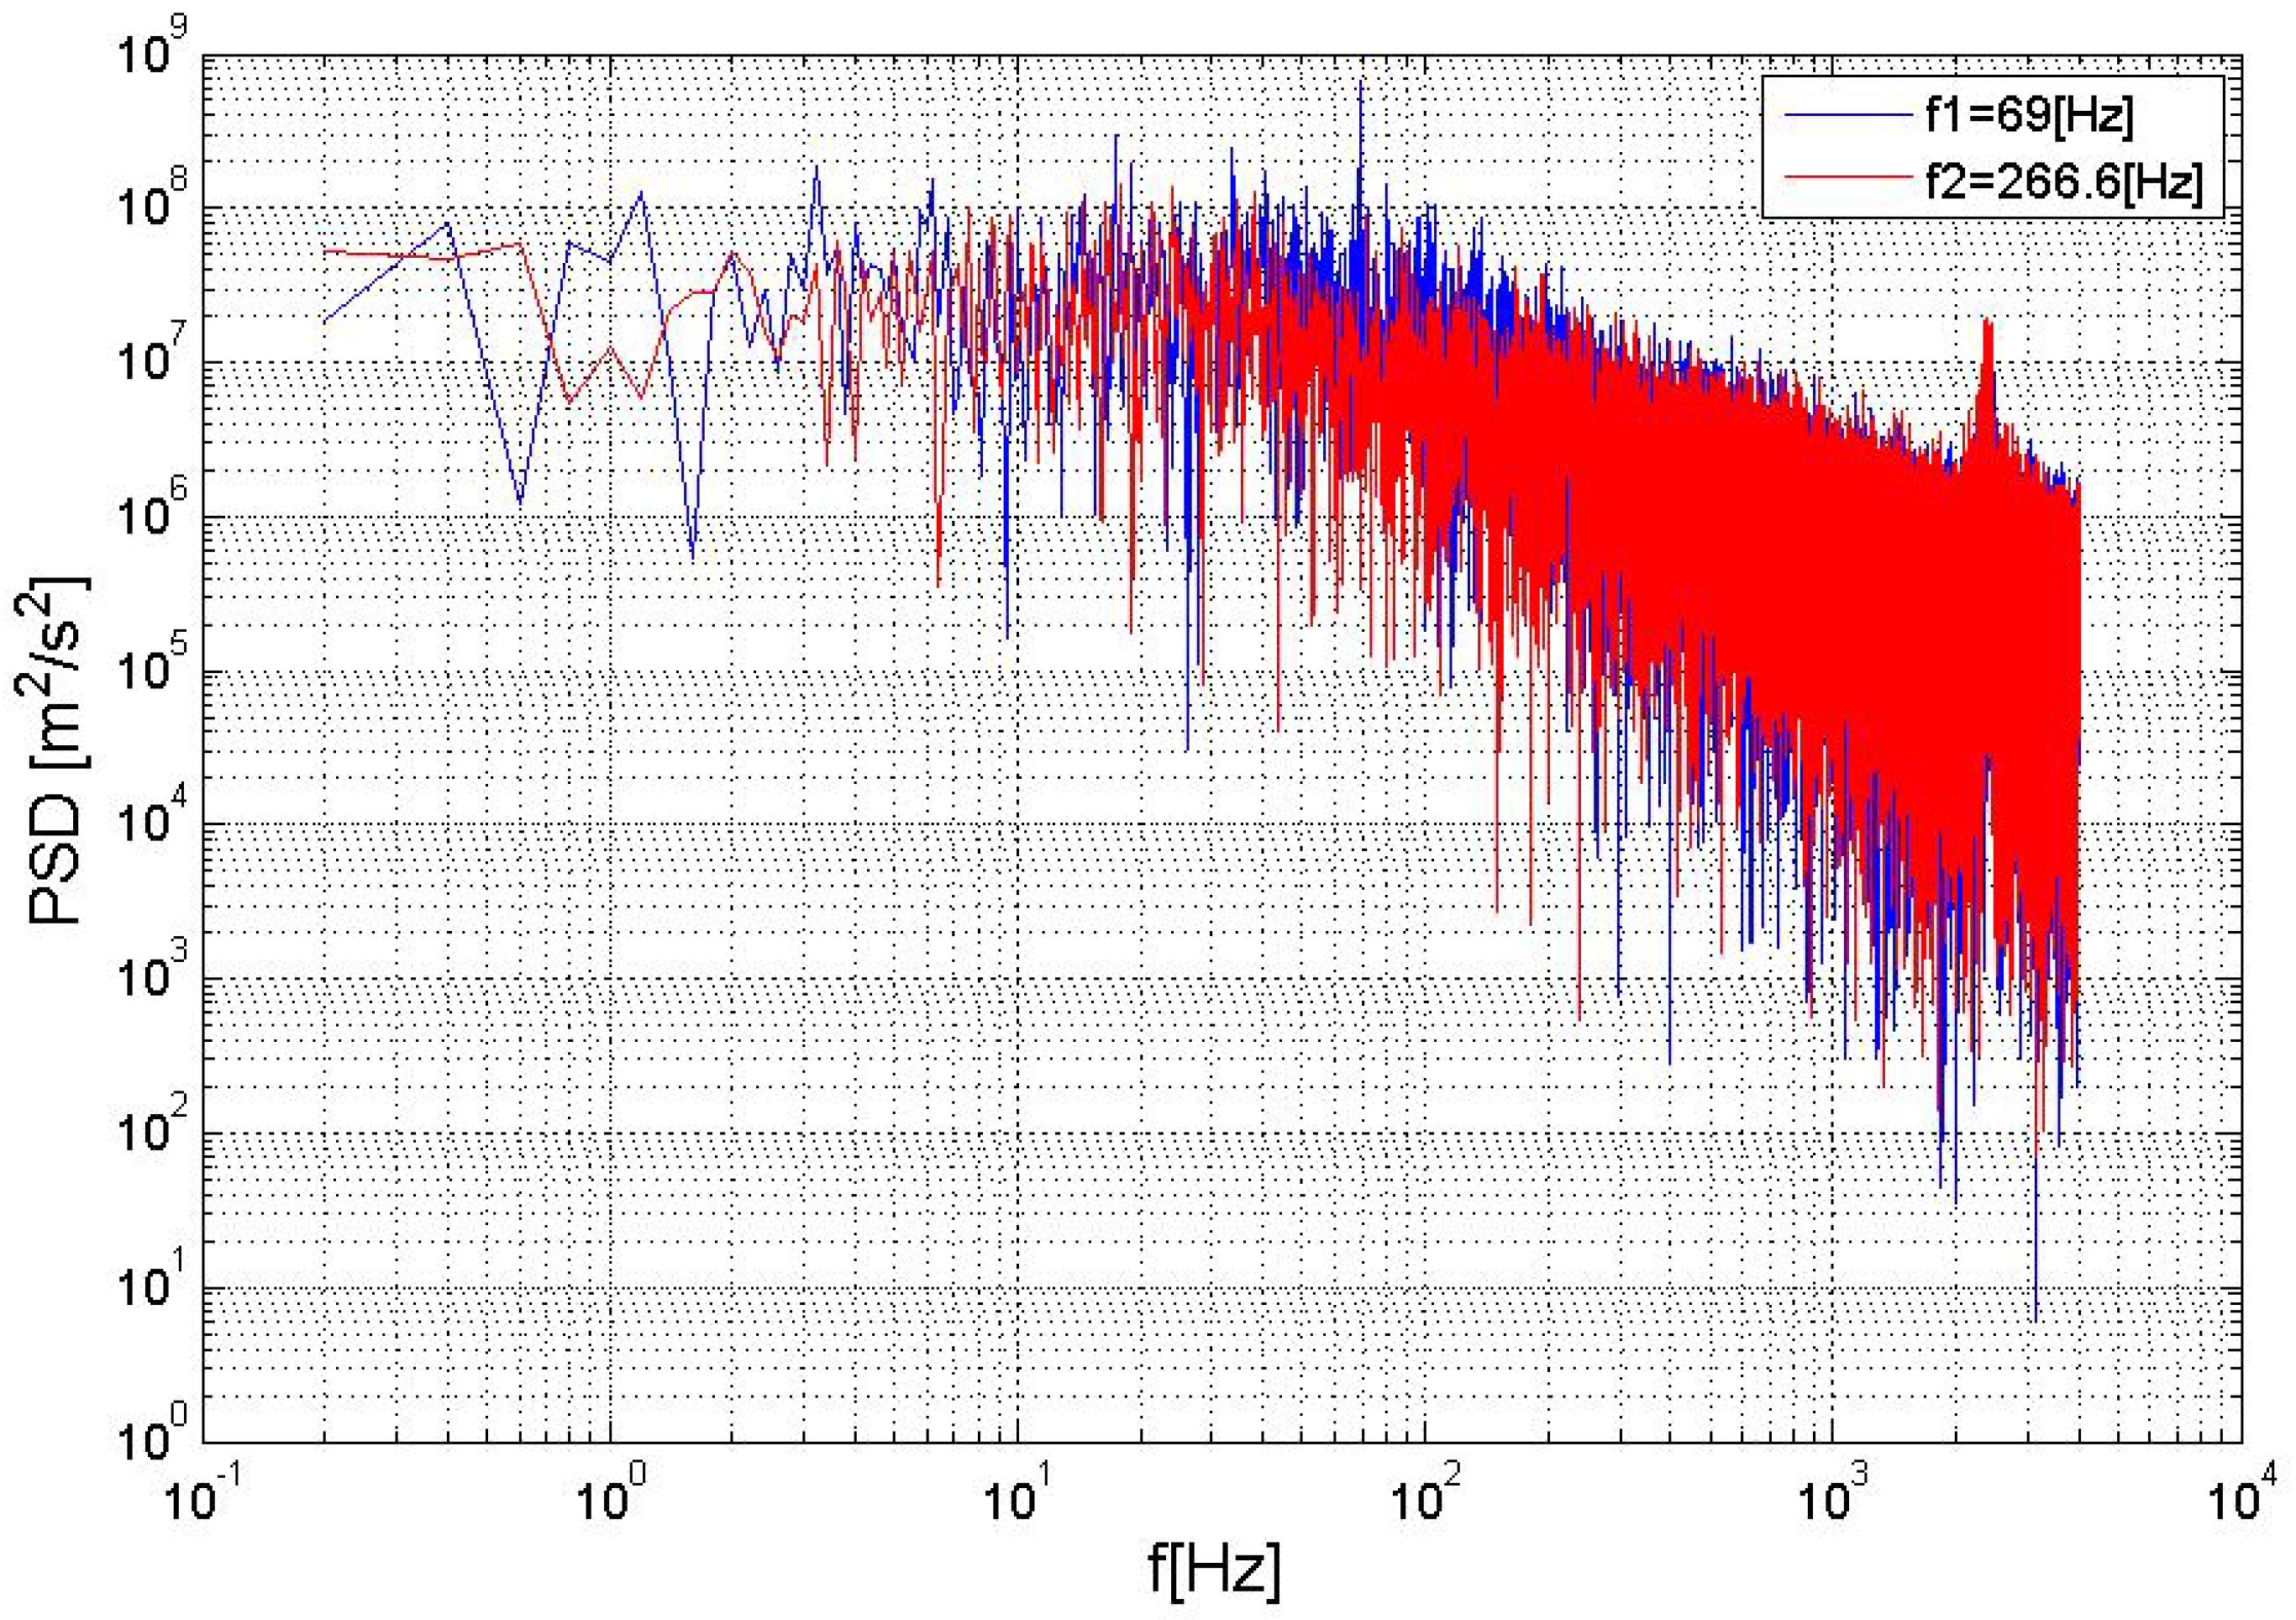
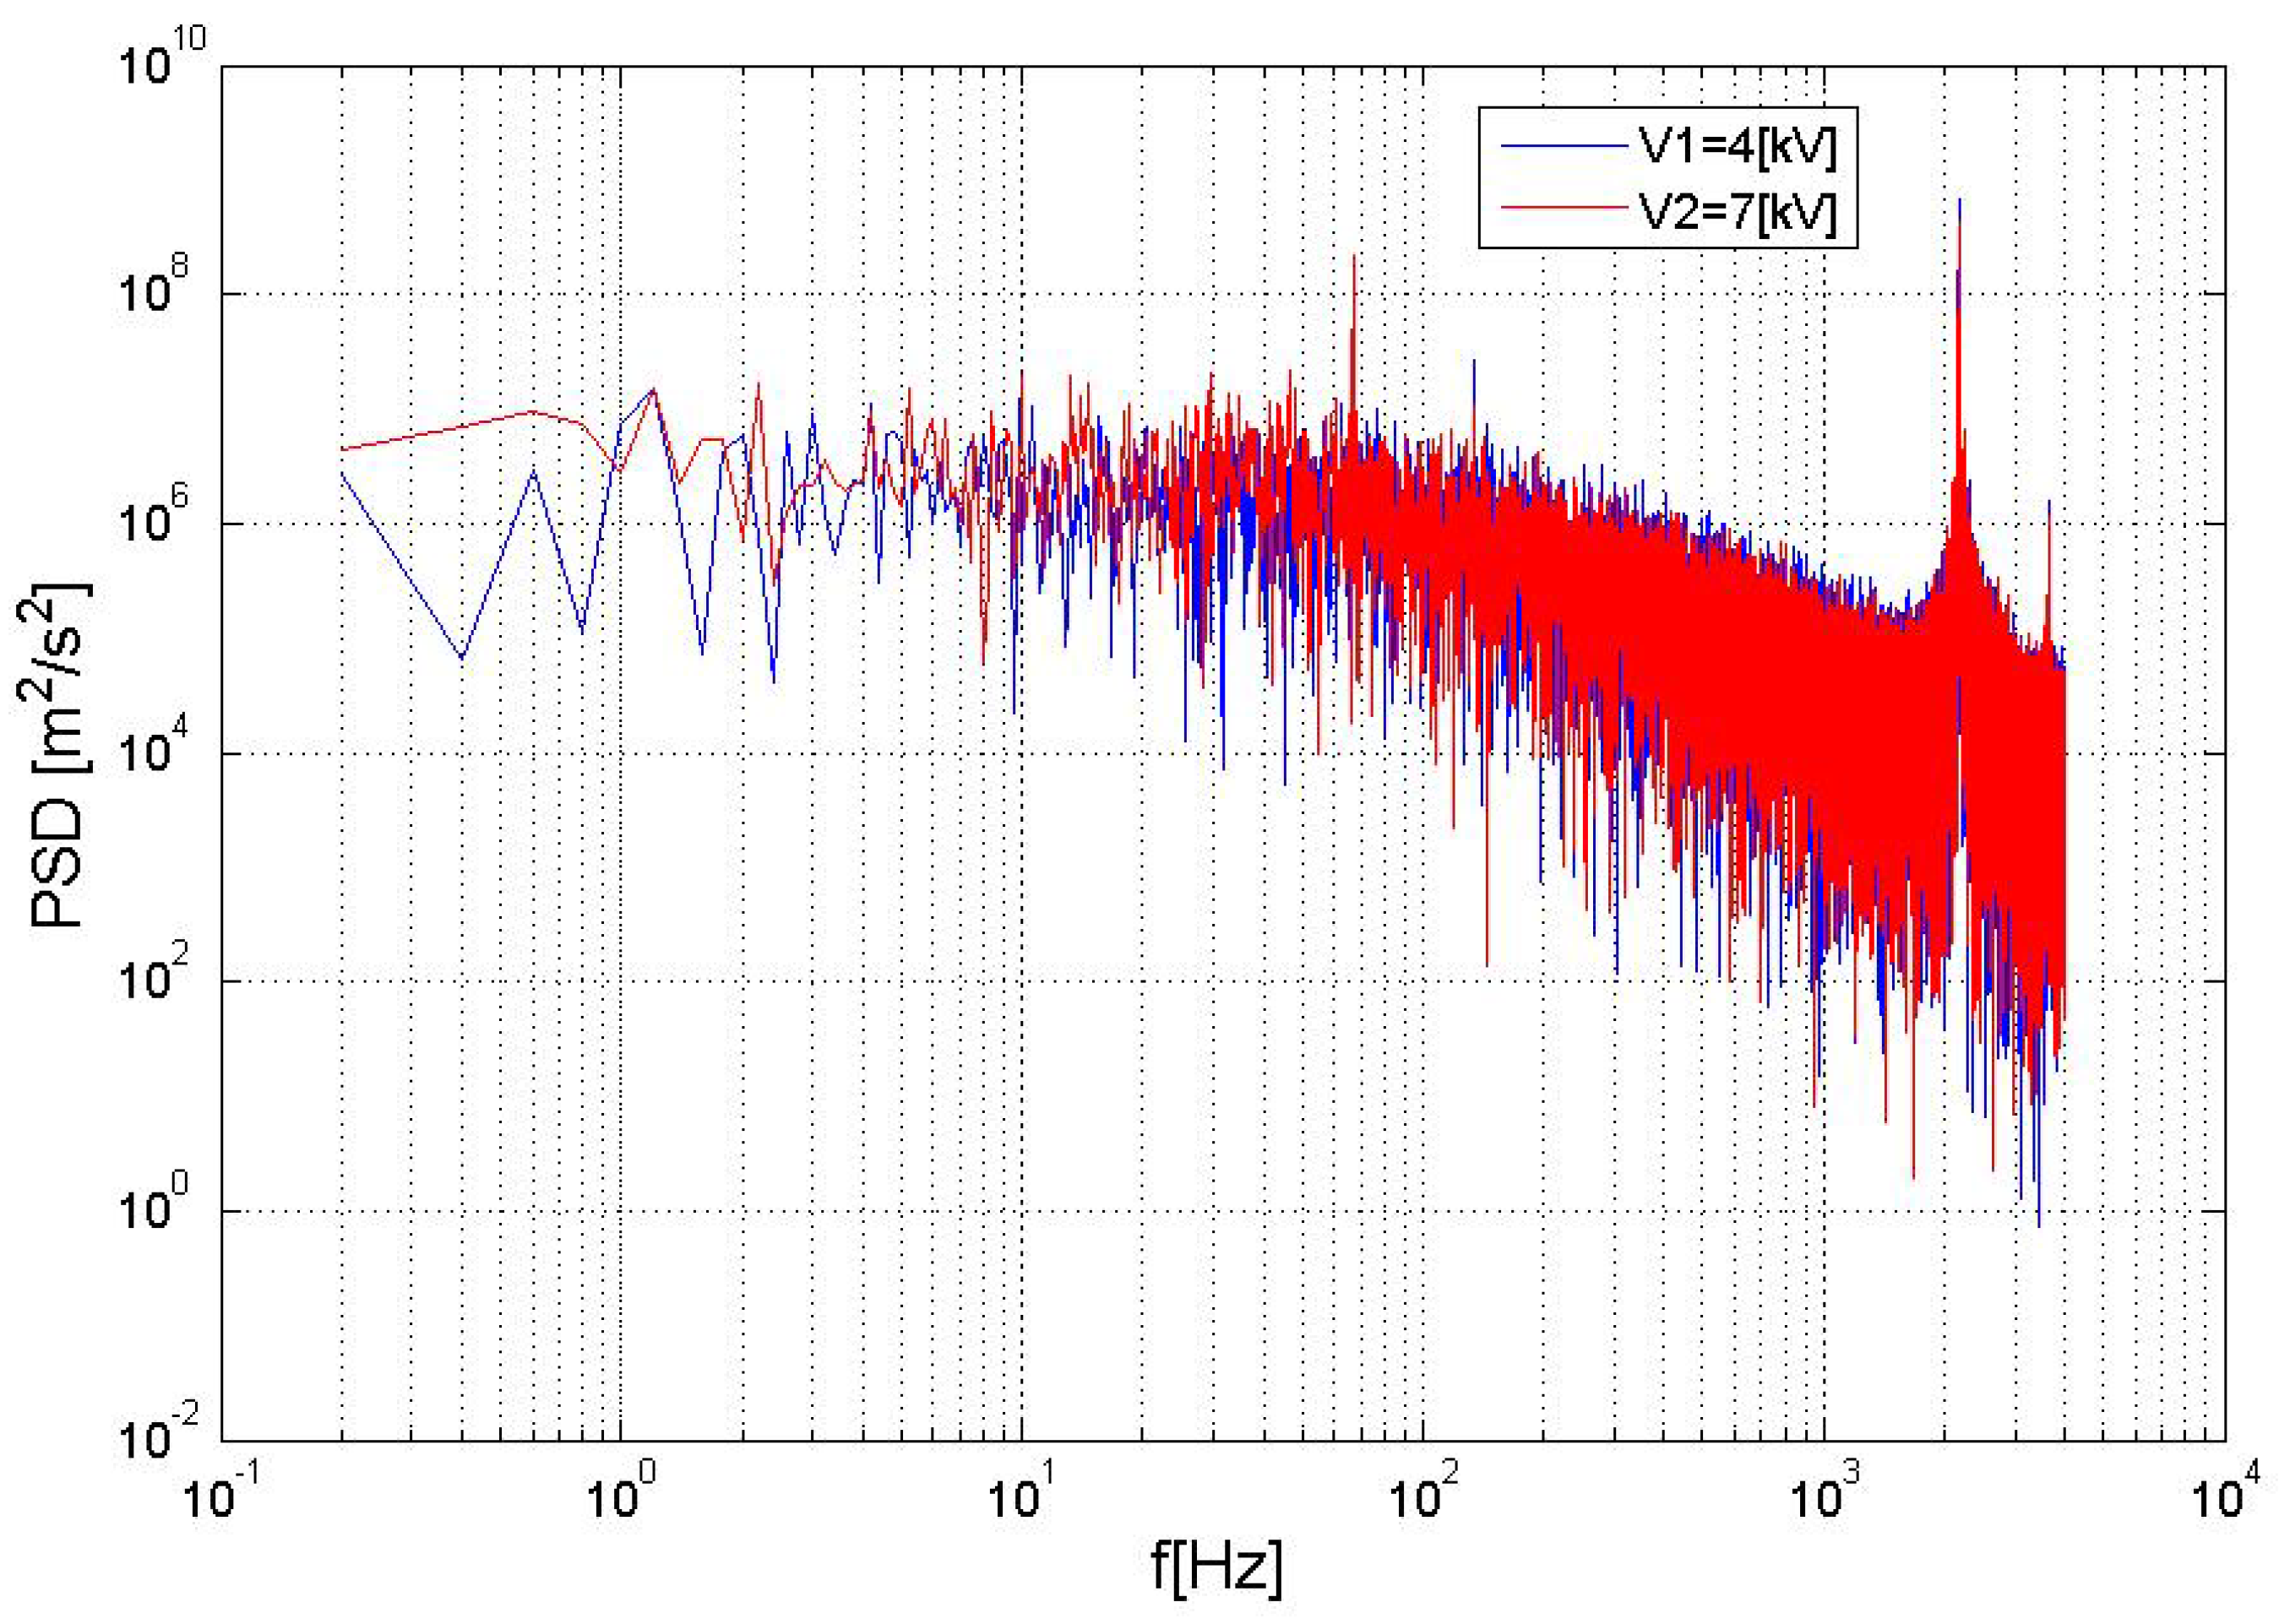
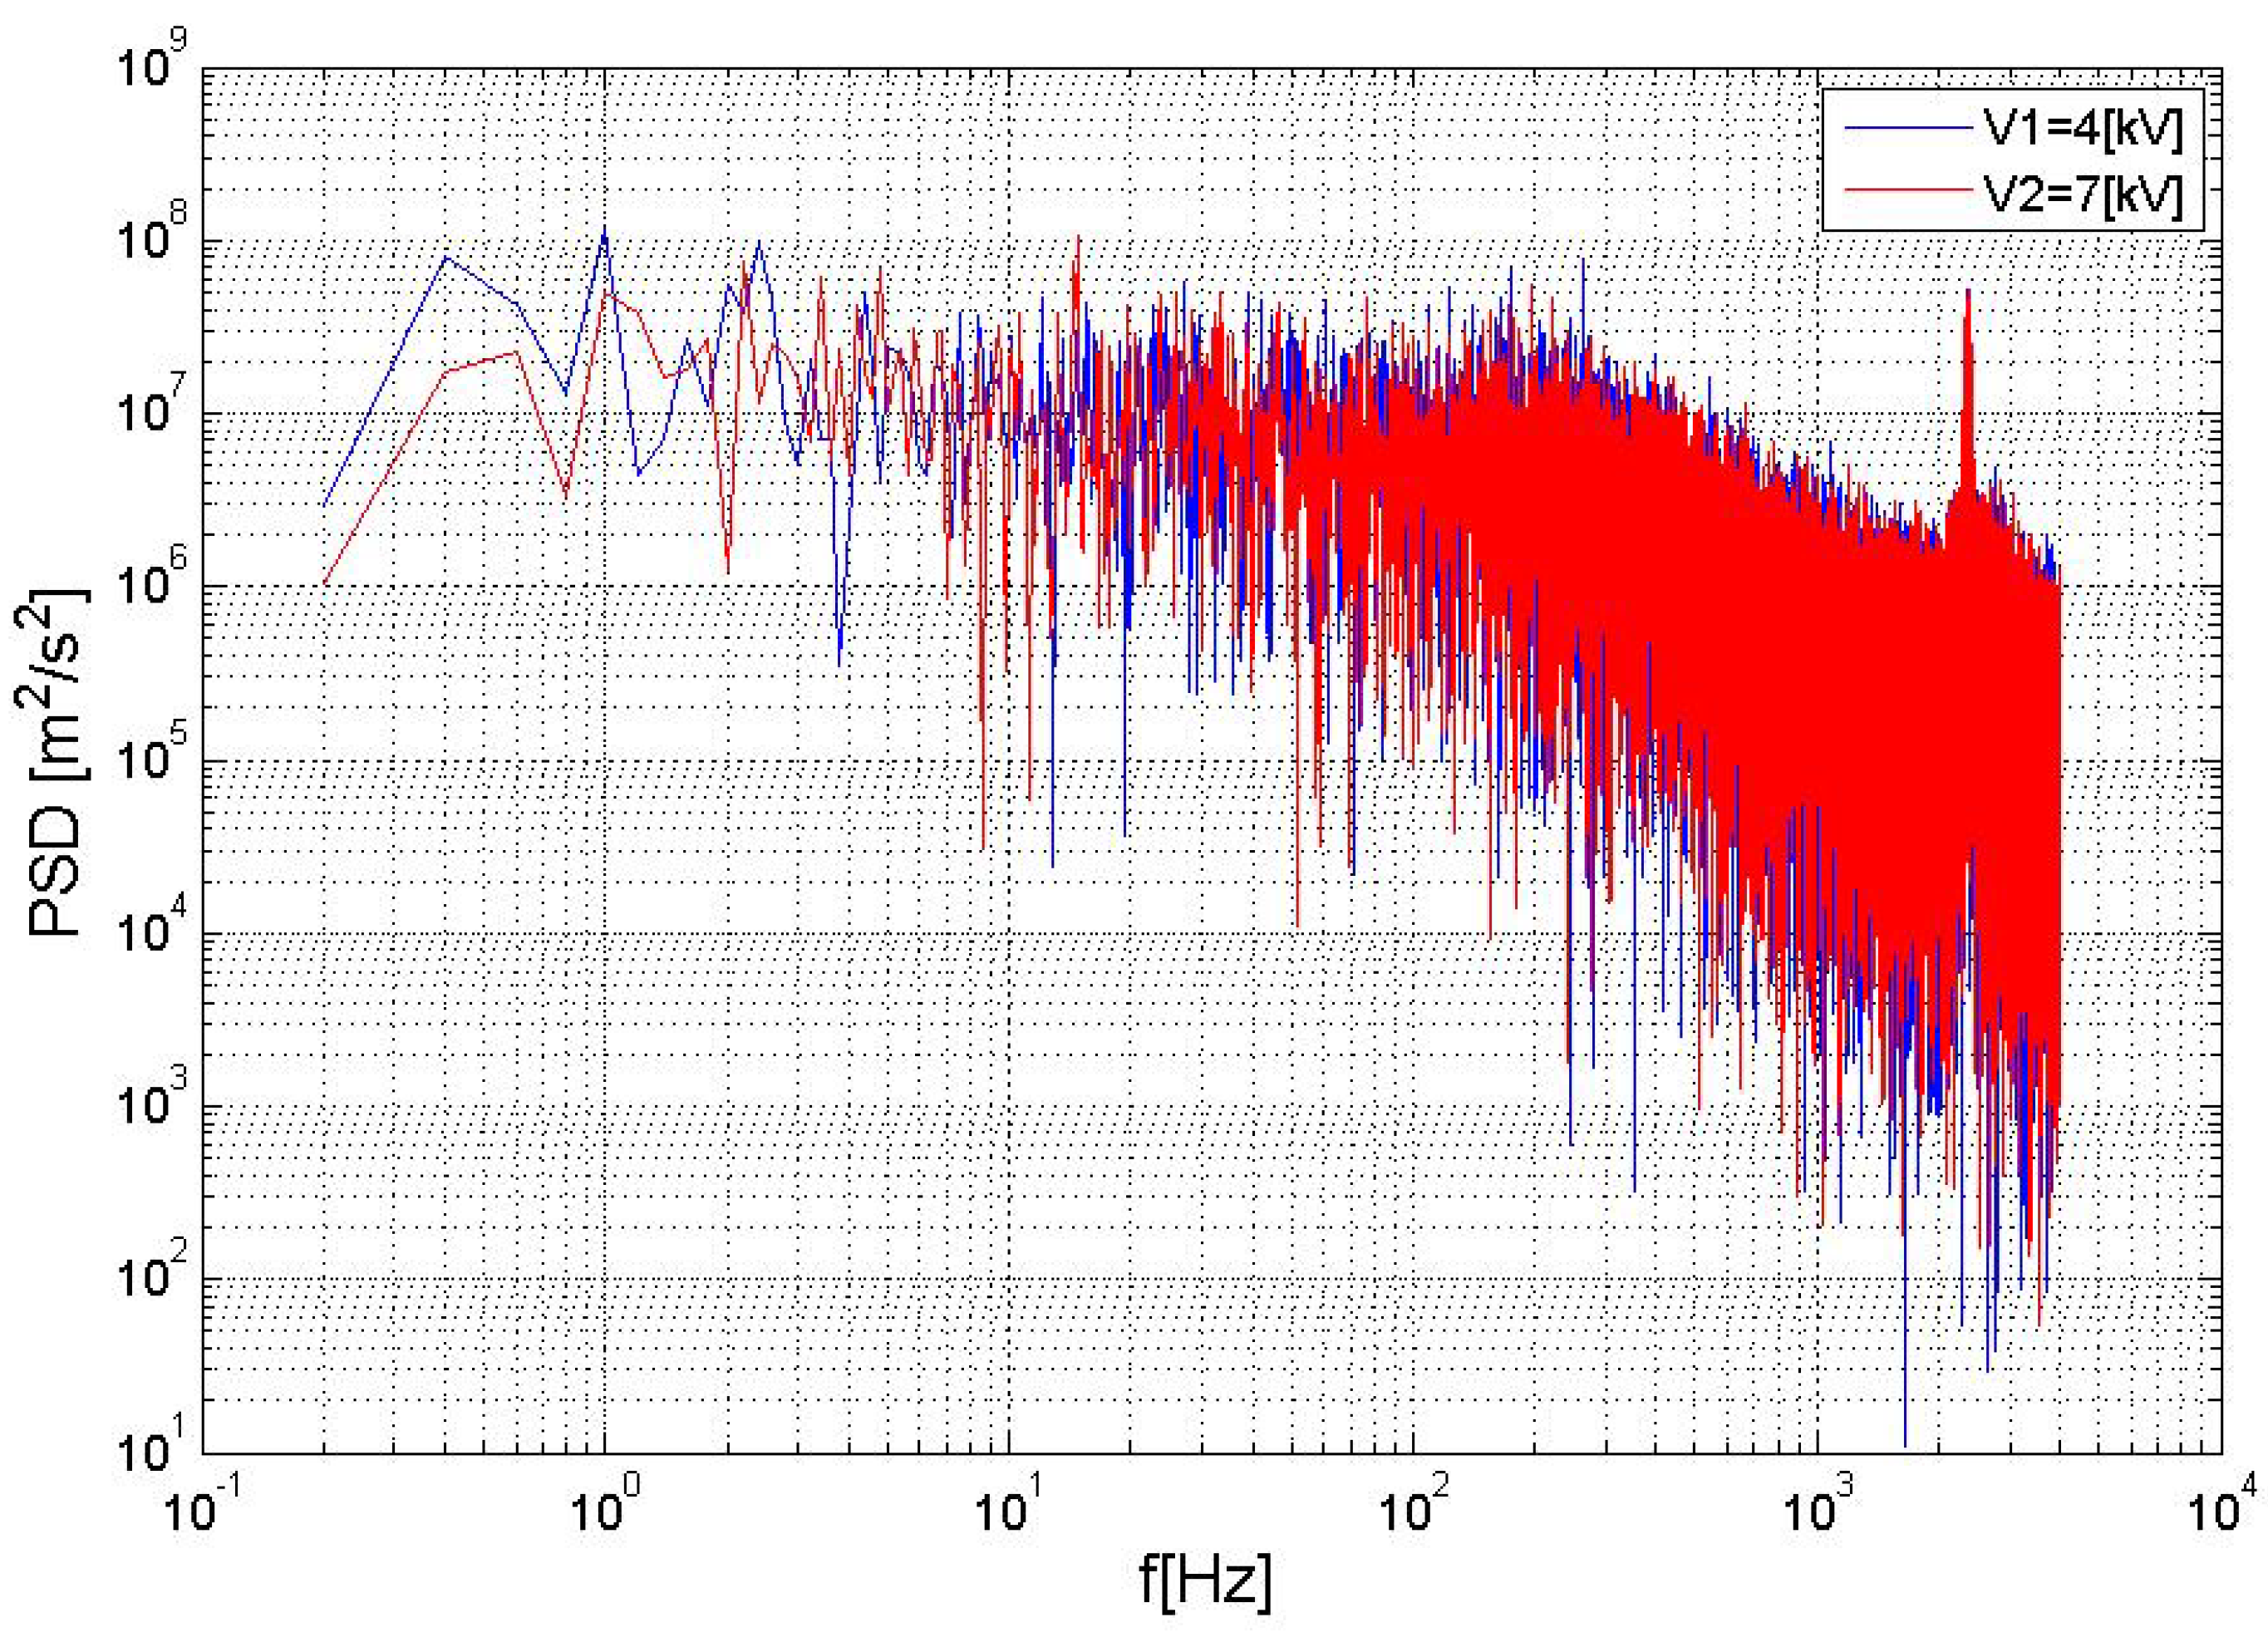
4.3. Spectral Analysis at Specific DBD Actuation Frequencies

To determine the influence of the DBD actuation frequency on the existing characteristic structures of the flow, hot wire measurements were obtained at W 2 using again as a criterion for the choice of point of measurement the location of the RMS velocity peak.
When the DBD was actuated at the same frequency as a dominant characteristic flow frequency without plasma actuation, it seemed there was an increase in the magnitude of the PSD peak, which can be seen in Figure 13. This increase of the magnitude was observed for all Reynolds numbers and both angles of attack. Another interesting phenomenon, which can be seen in Figure 14, Figure 15, Figure 16 and Figure 17, was the presence of another PSD peak at much higher frequencies, of the order of 2000 Hz , which was observed only for certain actuation frequencies. The reason for the presence of this peak is unknown and will be the subject of further investigations.
Again, as shown in Figure 15, other frequency peaks appeared when the DBD was actuated, i.e., multiples of the actuation frequency were observed. The phenomenon of observing the multiples of the actuation frequency occurred in all the other test cases as well. To disqualify this phenomenon as a measurement error, HWA measurements were performed in stagnant flow with DBD actuation where the power spectra retrieved showed neither peaks at the frequency of actuation nor their multiples.
Since other literature on the subject of plasma flow control mentions that the best actuation frequency for the DBD corresponds to reduced frequencies of F c + of 1 to 2, an investigation was made using the power spectra. Studying the effects of actuating the DBD at the dominant characteristic frequencies involved comparing the power spectra when the DBD was actuated at F c + = 1 and the best performing dominant characteristic frequency. The best data for this comparison were obtained at R e = 200,000 and are shown in Figure 16 and Figure 17. At α = 16 , where the pressure distribution showed the best performing actuation frequency was f = 41 Hz , the power spectra showed a higher PSD magnitude when compared to an actuation frequency of 133.3 Hz , which corresponded to F c + = 1 . Again, we noticed that the multiples of the actuation frequency were present in the power spectra. As shown in Figure 17, for α = 24 , it was clear that the same trend was present. At this angle of attack, the only frequency of actuation that had a significant effect on the pressure distribution was f = 266.6 Hz , which corresponded to F c + = 2 . Comparing this actuation frequency to the characteristic flow frequency of 69 Hz , it was observed that the lower actuation frequency was not obviously present in the power spectra. Compared to an actuation frequency of f = 266.6 Hz , the difference in magnitude was quite large. Therefore, a correlation seemed to exist between the magnitude of the PSD peak and the effectiveness of the DBD in re-attaching a separated flow over an airfoil.

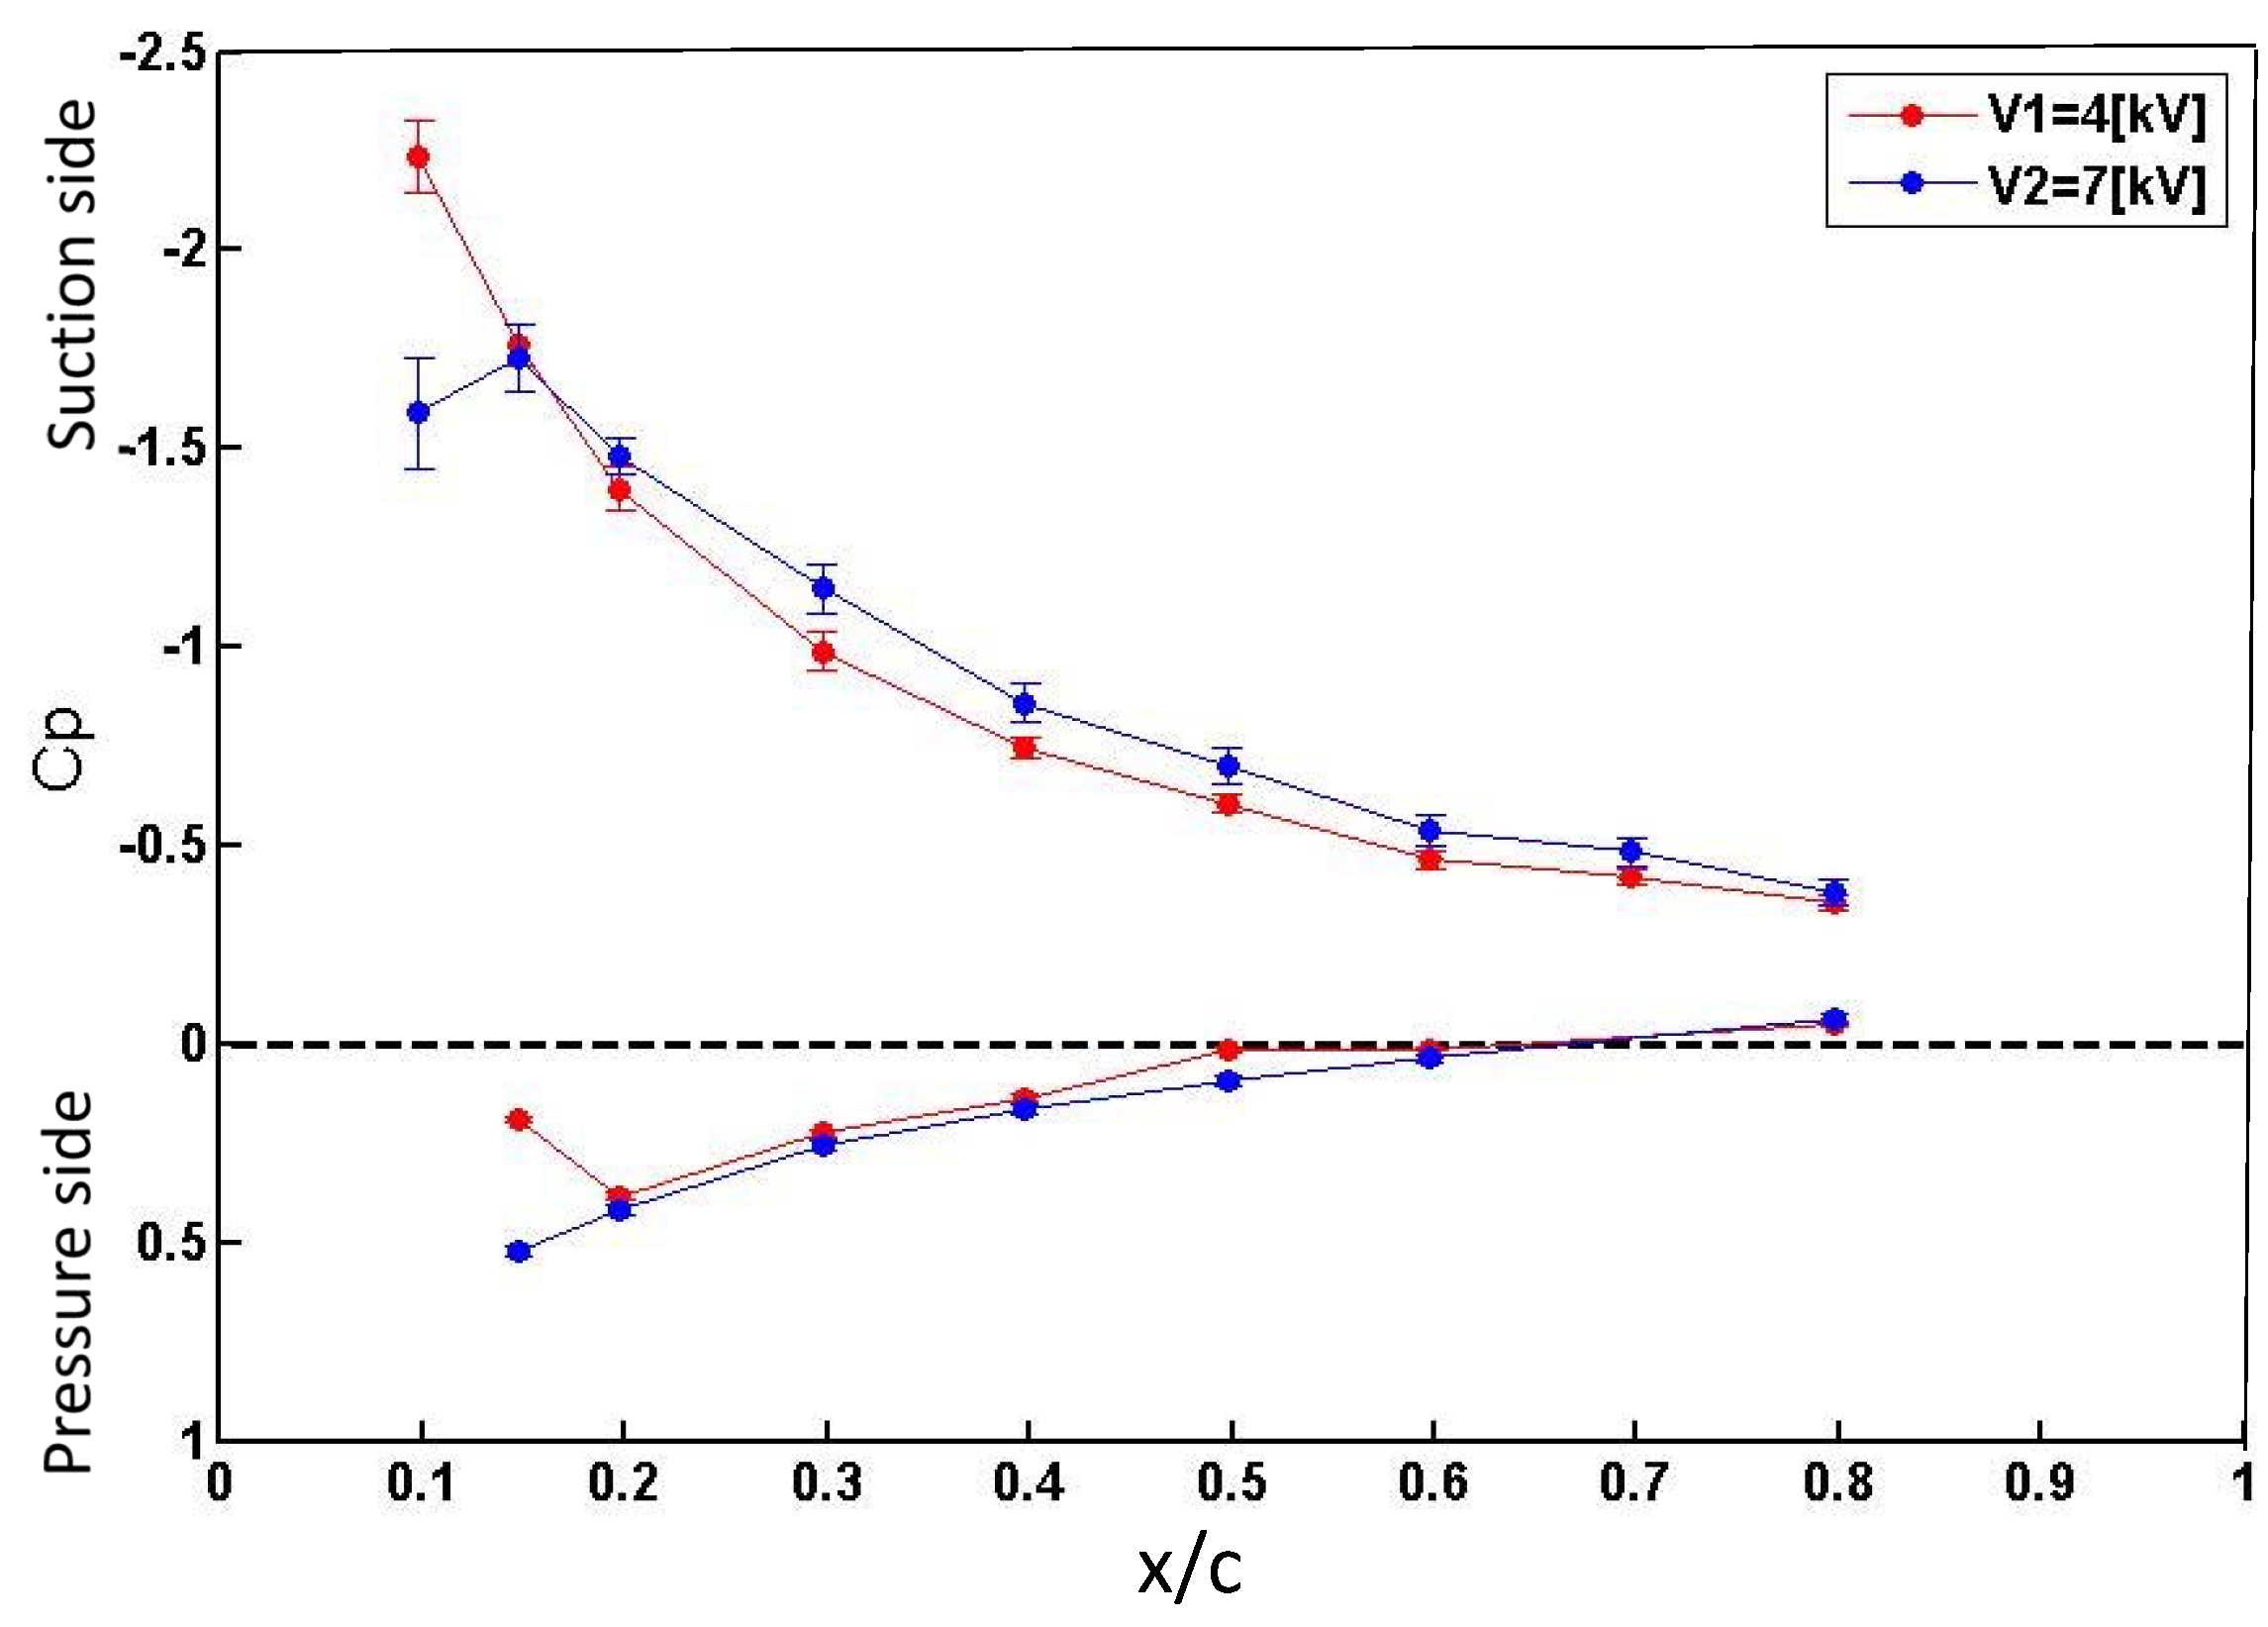
4.4. Influence of Applied Voltage

Two values of voltage were used to produce plasma, specifically 4 kV and 7 kV , in order to study the effects of applied voltage on the control authority of the DBD. This gave interesting results, and what could at first be considered as contradictory data, which also confirmed observations made by Grech et al. [22]. Repeatability problems are not inferred.
As shown in Figure 18, at α = 16 and R e = 100,000 , increasing the applied voltage had a negative effect as the suction peak when 7 kV was applied was significantly lower compared to 4 kV . When analysing the power spectra of this test case, shown in Figure 19, it was observed that the peak at the actuation frequency of 66 Hz was higher at 7 kV . However, the multiple of the actuation frequency at 122 Hz (first harmonic) showed a higher peak for a 4 kV applied voltage. At the same angle of attack and R e = 200,000 , there seemed to be little difference in pressure distributions, although the PSD peak at the actuation seemed to be more pronounced at an applied voltage of 7 kV , as shown in Figure 20 and Figure 21. As in all the Cp graphs, Figure 18, Figure 22 and Figure 23, the upper parts of the graphs correspond to the pressure side and the lower parts to the suction side, as before.
At α = 24 , the findings seem to contradict the observation at α = 16 . Here, at a R e = 100,000 applying 7 kV of voltage resulted in a better pressure distribution, although the flow over the airfoil was still not attached, as shown in Figure 22. When examining the pressure distribution at R e = 200,000 , shown in Figure 23, the optimal performing applied voltage was 4 kV .

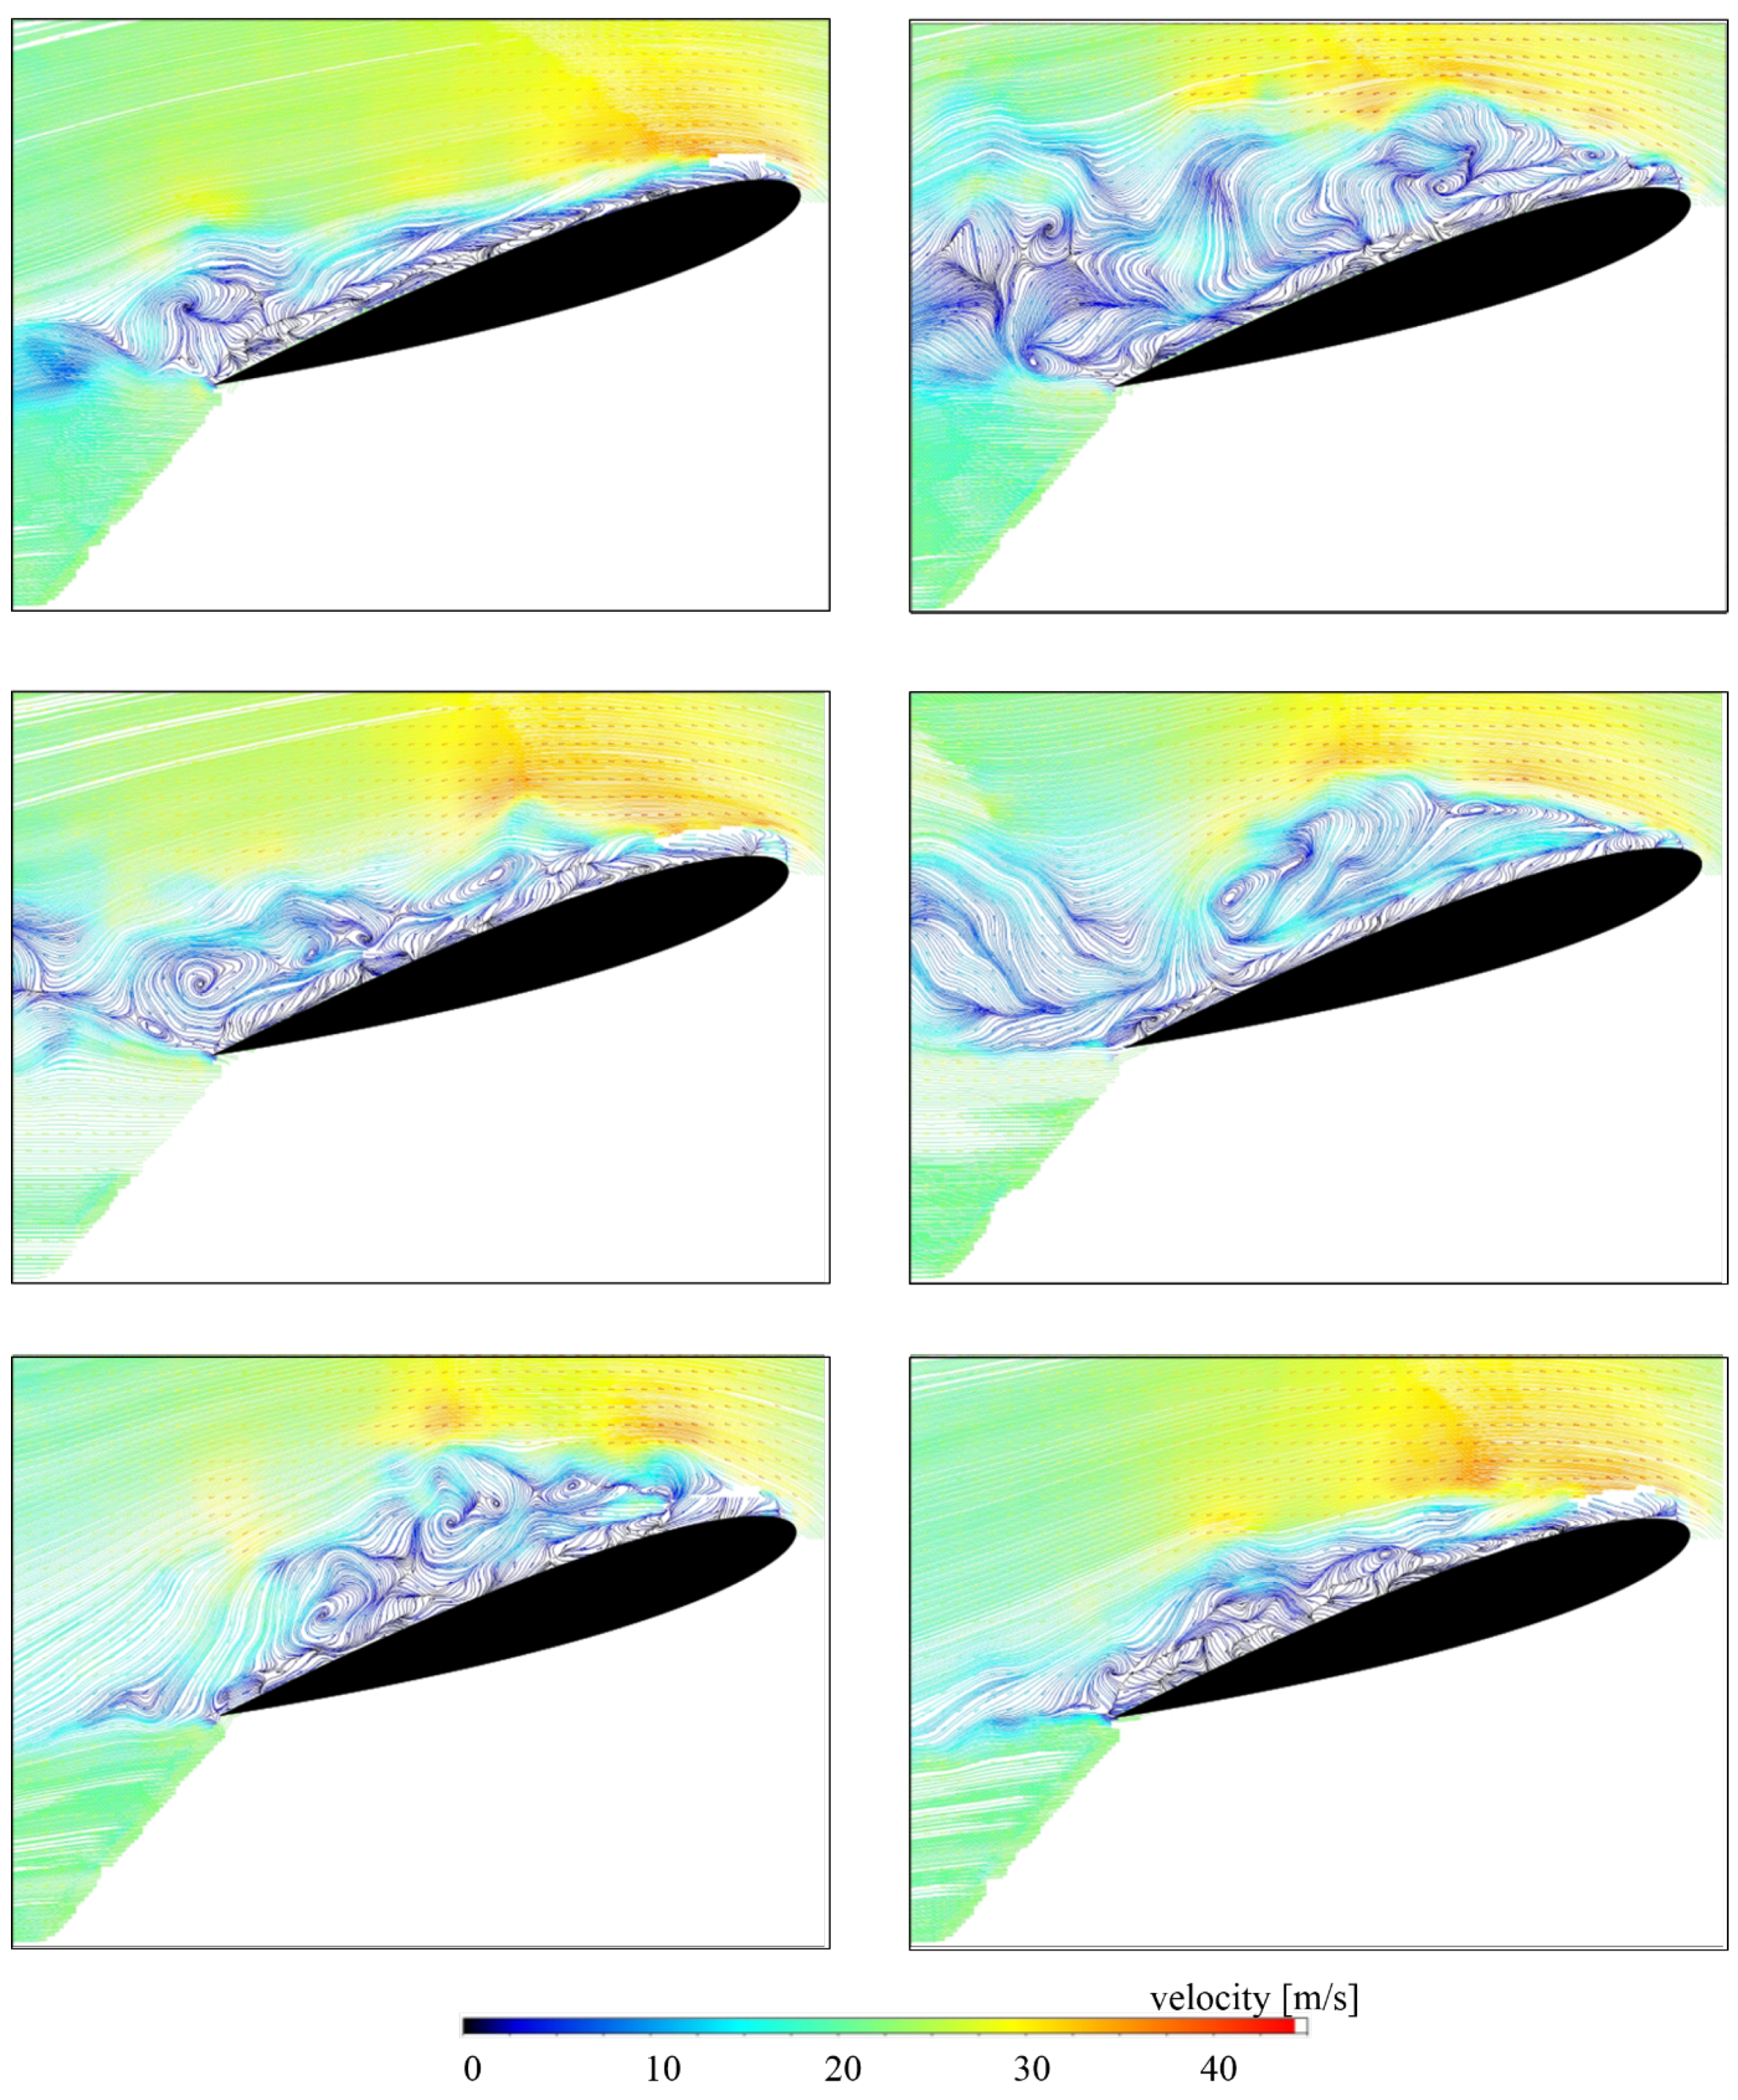
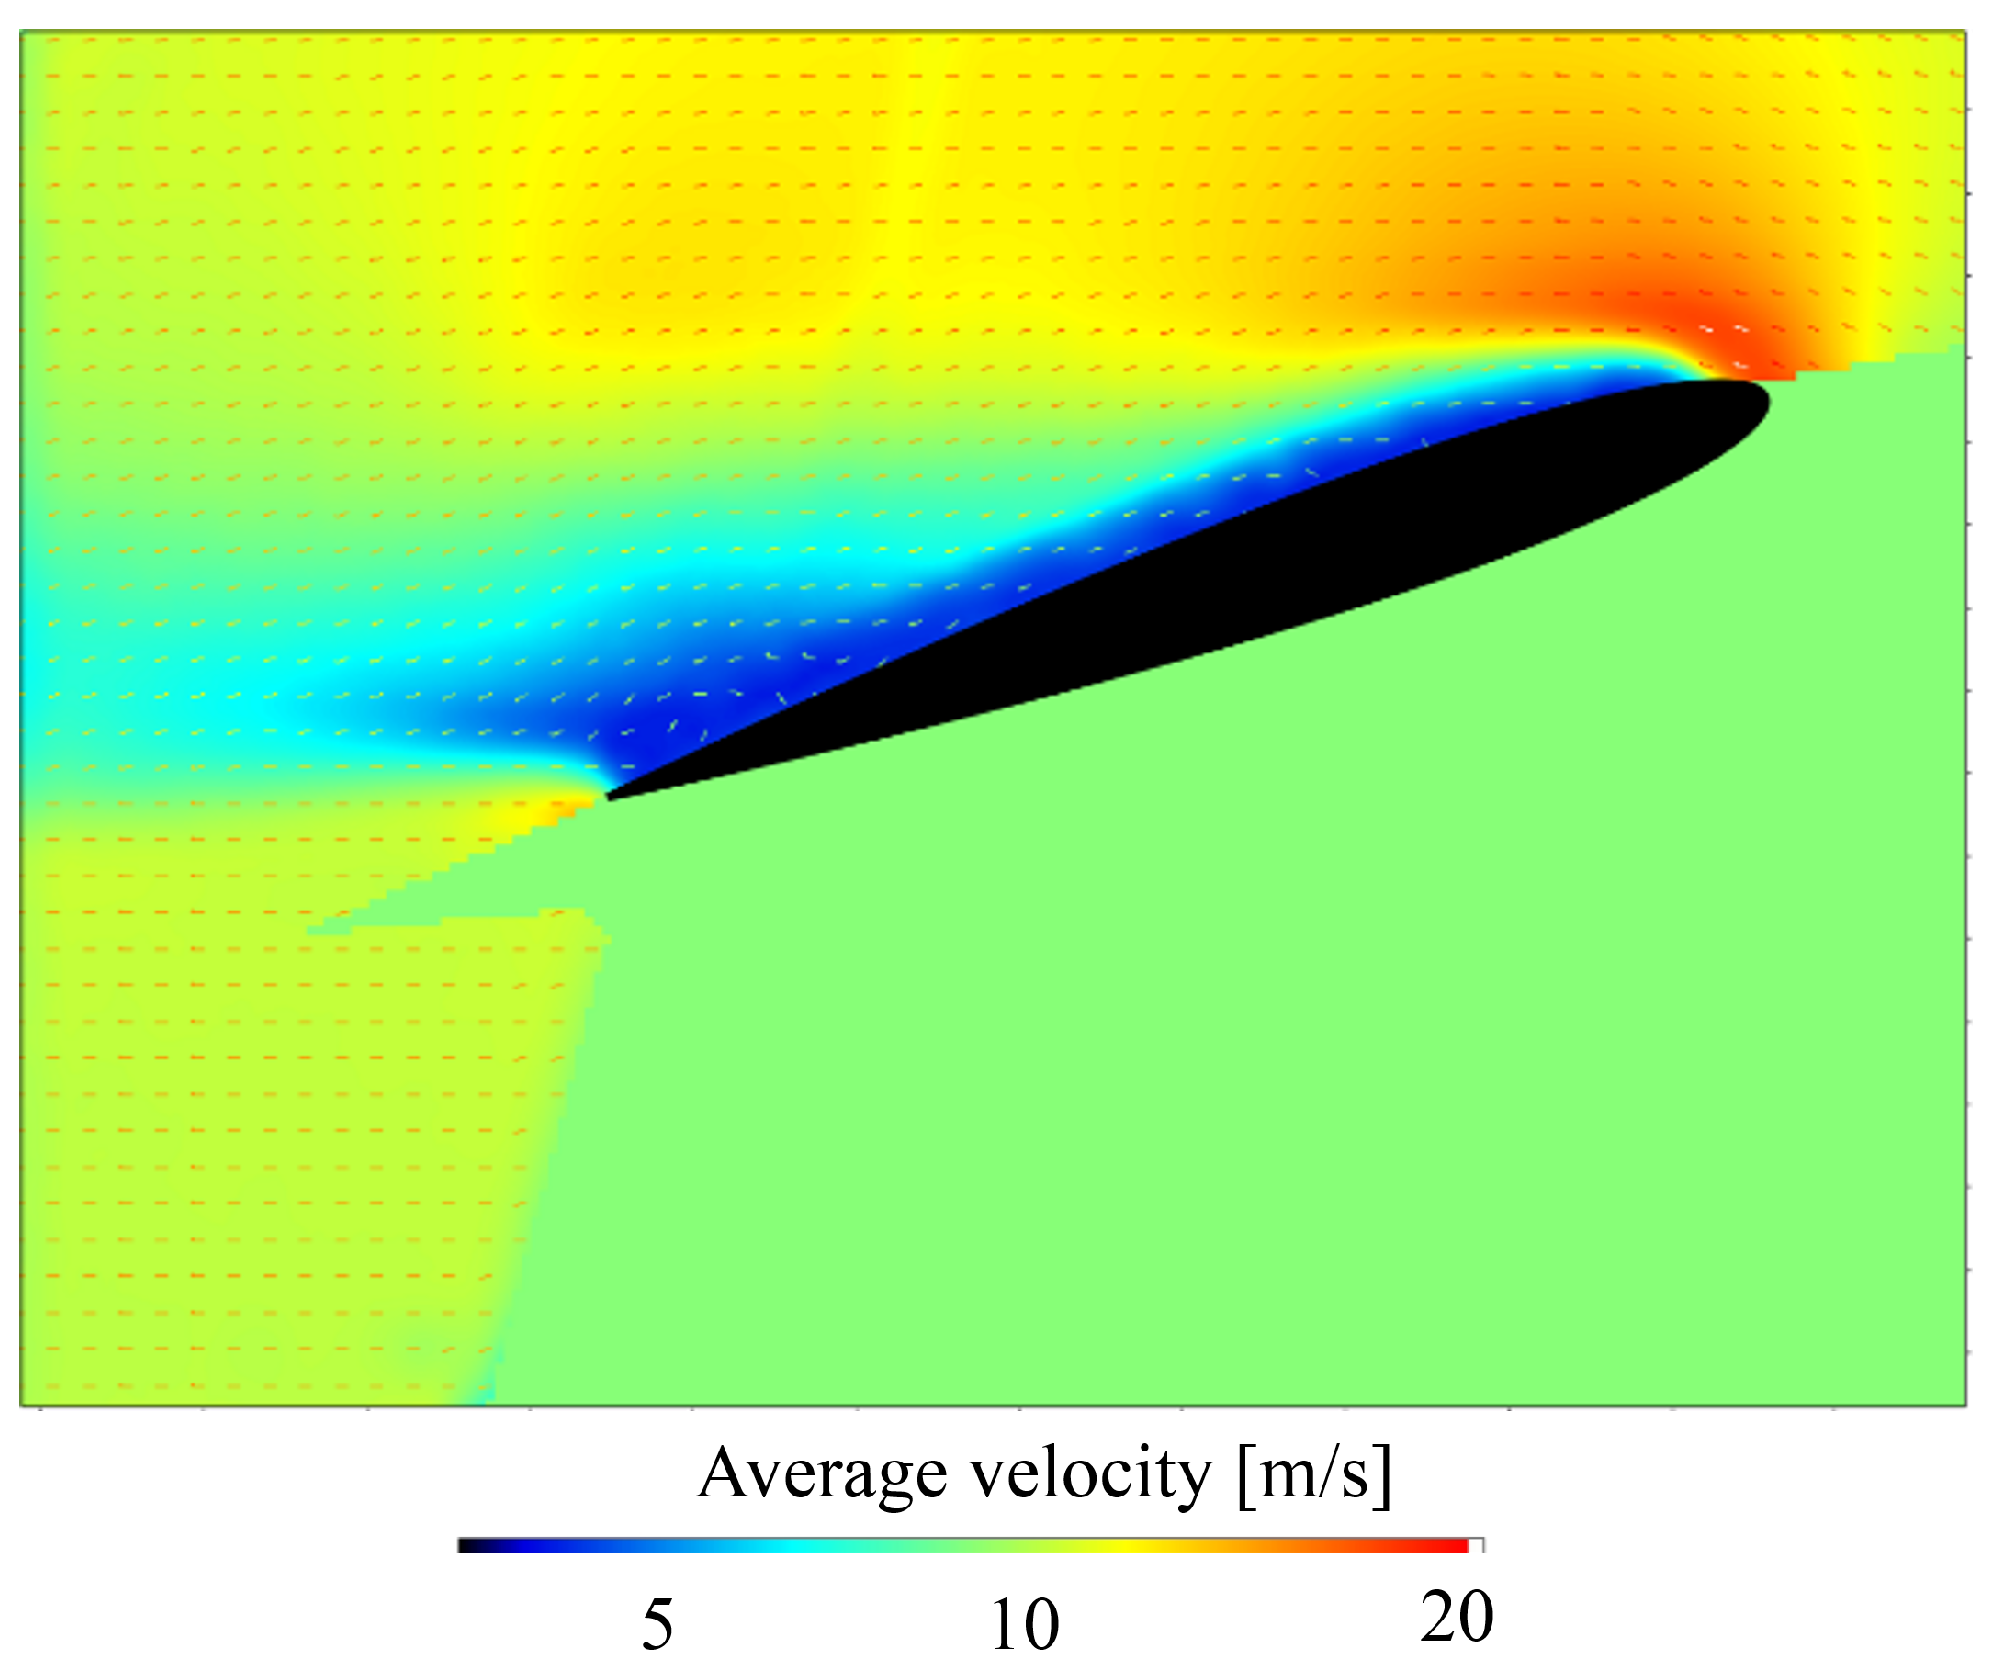
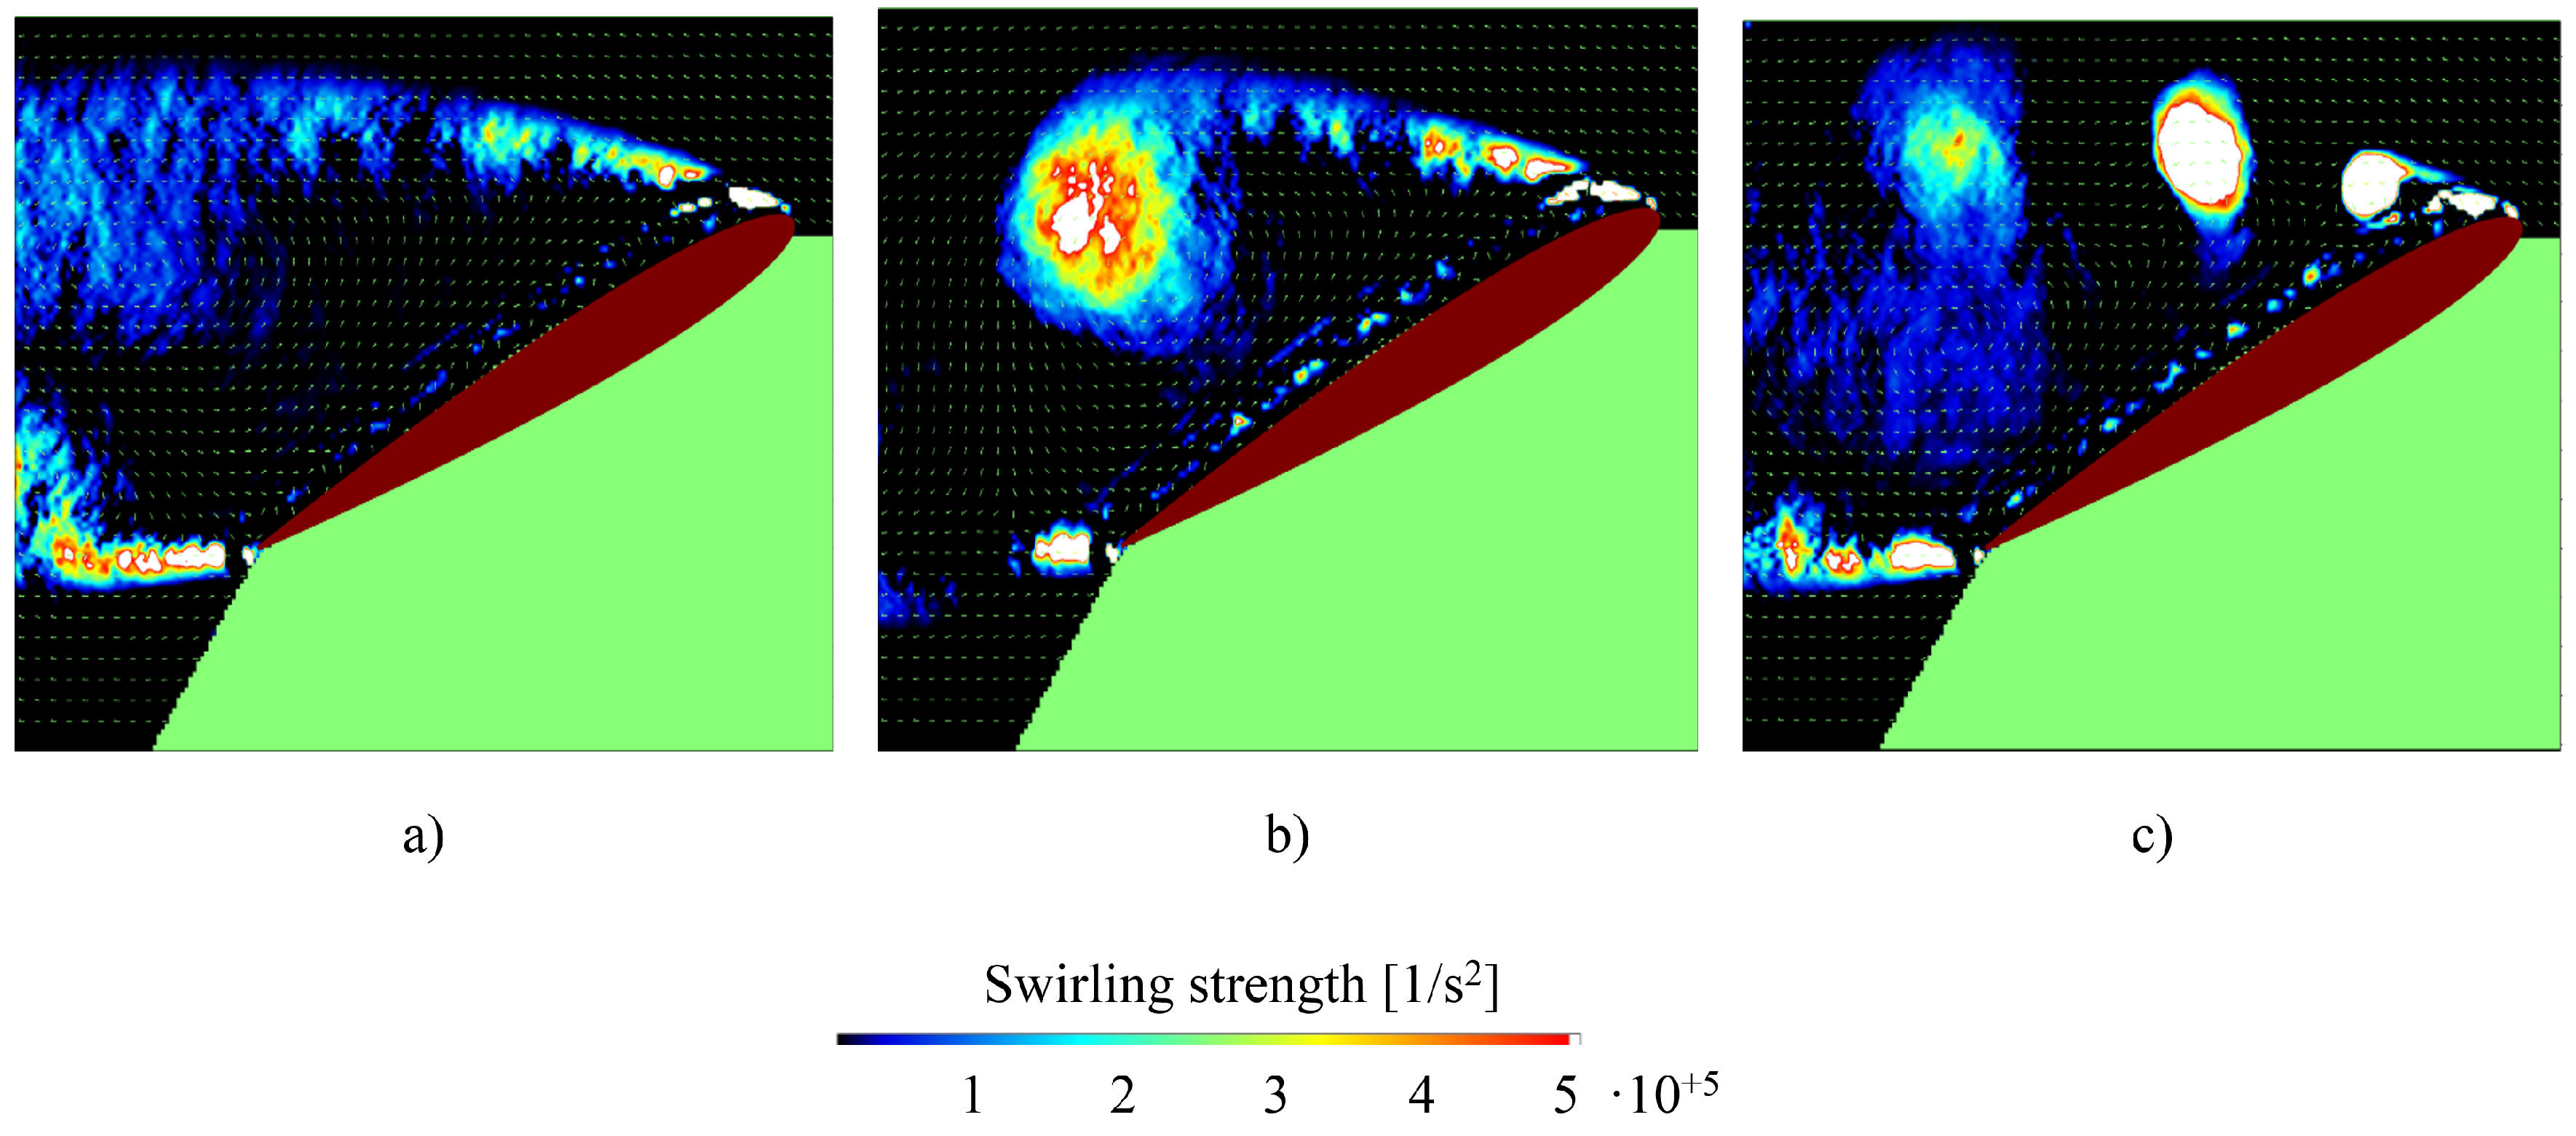
4.5. PIV Flow Measurements

Phase-locked PIV measurements can offer insight into the specifics of the control mechanisms behind NS-DBD actuators. The objective of this analysis was to observe the evolution of the flow over the airfoil when the DBD was active and to study the effect of different actuation frequencies on the structures of the flow.
As mentioned above, re-attachment is an unstable phenomenon, which was shown by the pressure distributions obtained. To study how these instabilities evolve in time, the streamlines from six consecutive instantaneous velocity fields were produced. Each image pair obtained has a phase difference of 3600 with the actuation of the DBD, meaning that an image pair was obtained every ten actuations of the DBD. As shown in Figure 24, the flow over the airfoil was unstable, and therefore became attached and detached at different time instances. Furthermore, the mechanism at work behind this instability seemed to be the formation of a large vortex at the mid-chord of the airfoil. When the particular vortical structure broke down the flow re-attaches again. Note that the Reynolds number for the flow evolution presented was 100,000 and the actuation of the DBD was at F c + = 1 .
However, the existence of this instability seemed to be correlated with the Reynolds number. At the same actuation frequency of F c + = 1 but at R e = 200,000 , this instability was not observed. Furthermore, this actuation frequency was observed to produce better results at a higher R e , since, as shown in Figure 25 (right, corresponding to the higher R e = 20 + 5 ) and Figure 26, where the Reynolds was R e = 10 + 5 , the size of the wake considerably decreased at the higher R e . The dependence on the actuation frequency can be observed, as illustrated within the velocity field clearly in Figure 25 (top), for the conditions R e = 200,000 and α = 16 , where f = 41 Hz for the top left hand side image and f = 133 Hz (i.e., F c + = 1 ) for the image on the top right.
To obtain a better understanding of how the DBD actuator influences the existing characteristic structures in the flow field, images were taken at α = 24 and R e = 200,000 where the instabilities were lower and the changes in the flow structure more pronounced. After the acquisition of 500 image-pairs, a time-averaged representation of the swirling strength was obtained. The frequencies of actuation used for the DBD were 69.0 Hz and 266.6 Hz , of which the latter corresponded to F c + = 2 . Note that the frequency of 69.0 Hz is a characteristic frequency of the flow, which was obtained through analysis of the power spectra (Figure 13, Figure 14 and Figure 15). The first image of Figure 27a corresponds to no actuation, whereas in Figure 27b,c, the actuation is on with frequencies of 69 Hz and 266 Hz , respectively. In Figure 27b, at frequency 69 Hz , the most likely excited structure is the separation vortex. Compared to Figure 27c, where the actuation frequency is 266.6 Hz , it was observed that different excitation mechanisms exist, which form distinct vortical structures that diffuse as they move downstream in the direction of the flow. The maximum swirling strength of the shedded vortices, however, were three times higher for the actuation frequency of 266.6 Hz . This clearly shows how the frequency of actuation influences the flow mechanisms.

5. Conclusions

This paper describes and analyses the mechanisms that allow for control authority for an asymmetric nanosecond pulsed dielectric barrier discharge (NS-DBD) actuator on the aerodynamic characteristics over a typical wing section, represented by a NACA 0015 airfoil profile. Experiments were performed in a low-speed wind tunnel under ambient pressure conditions at freestream flow speeds of 10 and 20 m / s at angles of attack of 16 and 24 for both flow speeds. Pressure taps along the profile chord located at mid-span on both the suction and pressure sides of the airfoil were used also to determine the effectiveness of the actuator at various actuation frequencies. Hot wire anemometry was performed with the aim of identifying dominant frequencies in the flow field over the stalled profile. Furthermore, PIV measurements were taken to identify how different actuation frequencies affect the existing structures in the flow field.
Via hot wire measurements without DBD actuation at different measurement lines along the airfoil and in the wake, the dominant characteristic flow frequencies were obtained. These frequencies were used as an actuation frequency for the DBD and were compared to known effective values of reduced frequency F c + . The degree of control authority for each actuation frequency was assessed by examining the pressure distributions along the airfoil. This analysis revealed that actuating the DBD at the low characteristic flow frequencies, the control authority at re-attaching the flow was significant, and in the case of α = 16 and R e = 200,000 improving the performance of actuation frequencies of F c + = 1 and 2, which were known to be effective. Furthermore, at this angle of attack, the area under the curve of the pressure distribution was increased at the low characteristic frequencies. Actuating the DBD at the high characteristic flow frequencies produced some effect, which was not as significant.
When the most effective frequencies were identified based on pressure distributions, further power spectra were obtained with actuation. This revealed that, when the DBD is actuated at a characteristic flow frequency, the magnitude of the PSD peak is increased. Furthermore, the multiples of the actuation frequency were observed in the power spectra. By comparing the power spectra of different actuation frequencies, it was observed that the most effective frequency also produces a higher PSD peak.
By examining the PIV measurements, it was confirmed that the phenomena which occur with DBD actuation are unstable depending on the Reynolds number. Furthermore, it was observed that, depending on the actuation frequency, different flow structures were excited and therefore the actuation frequency is critical to the control authority of a NS-DBD actuator.
In conclusion, nanosecond-pulsed plasma actuators obtain their control authority via several mechanisms, not only limited to an equivalent energy transfer or on the micro-shockwave that emanates from the actuator [15,17] but particularly on the effect of relating characteristic flow frequencies to the actuation frequencies. This shows that further applications in active flow control can be considered that are not yet suggested in the literature, giving a promising future for these actuators.

Author Contributions

Conceptualization, C.S. and P.L.; methodology, all authors; software, C.S. and D.N.; validation, all authors; formal analysis, C.S. and D.N.; investigation, C.S. and D.N. and H.B.; resources, P.L. and P.O.; writing—original draft preparation, P.L. and C.S.; writing—review and editing, P.O. and P.L. and C.S.; visualization, D.N. and H.B. and C.S.; P.L. performed supervision and project administration.

Funding

This research received no external funding.

Acknowledgments

The authors would like to thank Philip Peschke and Oleg Kotsur for their help and analyses of optimal operating of the PIV system, and Damien Fasel and Steve Couturier from the Swiss Plasma Centre of EPFL for their help with the ns-pulse generator.

Conflicts of Interest

The authors declare no conflict of interest.

Nomenclature

α Angle of attack [ ]
U Freestream velocity [ m / s ]
p Freestream static pressure [ Pa ]
ρ Freestream fluid density [ kg / m 3 ]
fFrequency of actuation [ Hz ]
pLocal static pressure [ Pa ]
UMagnitude of the applied voltage [ kV ]
cModel chord length [ mm ]
sModel span [ mm ]
C p Pressure Coefficient C p = p p 0.5 * ρ U 2 [-]
F c + Reduced frequency based on model chord F c + = f · c U [-]
R e Reynolds number based on model chord and U [-]

References

  1. Prandtl, L. Über Flüssigkeitsbewegung bei sehr kleiner Reibung. In Proceedings of the Third International Congress of Mathematicians, Heidelberg, Germany, 12 August 1904; pp. 484–491, Available in Book: L. Prandtl und A. Betz. Vier Abhandlungen zur Hydrodynamik und Aerodynamik. Universtitatverlag Göttingen 1927. = https://doi.org/10.1002/zamm.19280080126. Reedited in 2010 =https://doi.org/10.17875/gup2010-106. [Google Scholar]
  2. Lachmann, G.V. Boundary Layer and Flow Control. Its Principles and Application; Pergamon Press: Oxford, UK, 1961; Volume 1. [Google Scholar]
  3. Gad-el-Hak, M. Modern developmenst in Flow Control. Appl. Mech. Rev. 1996, 49, 365–379. [Google Scholar] [CrossRef]
  4. Crowther, W.J. Separation Control on a Trailing-Edge Flap Using Air Jet Vortex Generators. J. Aircr. 2006, 43, 1589–1593. [Google Scholar] [CrossRef]
  5. McLean, J.D.; Crouch, J.D.; Stoner, R.C.; Sakurai, S.; Seidel, G.E.; Feifel, W.M.; Rush, H.M. Study of the Application of Separation Control by Unsteady Excitation to Civil Transport Aircraft; Technical Report NASA CR-1999–209228; NASA Langley Research Center: Hampton, VA, USA, 1999.
  6. Cattafesta, L.N.; Sheplak, M. Actuators for Active Flow Control. Annu. Rev. Fluid Mech. 2011, 43, 247–272. [Google Scholar] [CrossRef] [Green Version]
  7. Wilkinson, S.P. Interactive Wall Turbulence Control. In Viscous Drag Reduction in Boundary Layers; Bushnell, D.M., Hefner, J.N., Eds.; AIAA: Washington, DC, USA, 1990; Volume 123, pp. 479–509. [Google Scholar]
  8. Seifert, A.; Darabi, A.; Wygnanski, I. Delay of airfoil stall by periodic excitation. J. Aircr. 1996, 33, 691–698. [Google Scholar] [CrossRef]
  9. Corke, T.C.; Enloe, C.L.; Wilkinson, S.P. Dielectric Barrier Discharge Plasma Actuators for Flow Control. Ann. Rev. Fluid Mech. 2010, 42, 505–529. [Google Scholar] [CrossRef]
  10. Erfani, R.; Erfani, T.; Hale, C.; Kontis, K.; Utyzhnikov, S.V. Optimization of induced velocity for plasma actuator with multiple encapsulated electrodes using response surface methodology. In Proceedings of the 49th AIAA Aerospace Sciences Meeting including the New Horizons Forum and Aerospace Exposition, Orlando, FL, USA, 4–7 January 2011. [Google Scholar]
  11. Caruana, D.; Tropea, C.; Hollenstein, C.; Boeuf, J.-P.; Choi, K.S. PLASMAERO European Project; ERCOFTAC Special Edition on Plasma Aerodynamics; 2013; Volume 94, Publication ERCOFTAC “Plasma Aerodynamics”; Available online: https://www.ercoftac.org/publications/ercoftac_bulletin/bulletin_94/ (accessed on 3 May 2014).
  12. Starikovskii, A.Y.; Nikipelov, A.A.; Nudnova, M.M.; Roupassov, D.V. SDBD plasma actuator with nanosecond pulse-periodic discharge. Plasma Sources Sci. Technol. 2009, 18, 034015. [Google Scholar] [CrossRef]
  13. Moreau, E. Airflow control by non-thermal plasma actuators. J. Phys. D Appl. Phys. 2007, 40, 605–636. [Google Scholar] [CrossRef]
  14. Patel, M.P.; Ng, T.T.; Vasudevan, S.; Post, M.L.; McLaughlin, T.E.; Suchomel, C.F. Scaling effects of an aerodynamic plasma actuator. J. Aircr. 2008, 45, 223–236. [Google Scholar] [CrossRef]
  15. Roupassov, D.V.; Nikipelov, A.A.; Nudnova, M.M.; Starikovskii, A.Y. Flow separation control by plasma actuator with nanosecond pulsed-periodic discharge. AIAA J. 2009, 47, 168–185. [Google Scholar] [CrossRef]
  16. Rethmel, C.; Little, J.; Takashima, K.; Sinha, A.; Adamovich, I.; Samimy, M. Separation control with nanosecond-pulse-driven dielectric barrier discharge plasma actuators. In Proceedings of the 49th AIAA Aerospace Sciences Meeting Including the New Horizons Forum and Aerospace Exposition, Orlando, FL, USA, 4–7 January 2011. [Google Scholar]
  17. Peschke, P. Experimental Investigation of Pulsed DBD Plasma Actuators for Aerodynamic Flow Control. Ph.D. Thesis, EPFL, Vaud, Switzerland, 2014. [Google Scholar] [CrossRef]
  18. Marino, A.; Peschke, P.; De Gregorio, F.; Leyland, P.; Ott, P.; Hollenstein, C.; Donelli, R.S. High Voltage Pulsed DBD Effects on the Aerodynamic Performances and on the Shock Buffet. ERCOFTAC Plasma Aerodyn. 2013, 94, 70–76. Available online: https://www.ercoftac.org/publications/ercoftac_bulletin/bulletin_94/ (accessed on 28 June 2019).
  19. Little, J.; Takashima, K.; Nishihara, M.; Adamovich, I.; Samimy, M. Separation control with nanosecond-pulse-driven dielectric barrier discharge plasma actuators. AIAA J. 2012, 50, 350–365. [Google Scholar] [CrossRef]
  20. Sidorenko, A.A.; Zanin, B.Y.; Postnikov, B.V.; Budovksky, A.D.; Starikovskii, A.Y.; Roupassov, D.V.; Zavialov, I.N.; Malmuth, N.D.; Smereczniak, P.; Silkey, J.S. Pulsed discharge actuators for rectangular wing separation control. In Proceedings of the 45th AIAA Aerospace Sciences Meeting and Exhibit, Reno, NV, USA, 8–11 January 2007. [Google Scholar]
  21. Johnson, G.A.; Scott, S.J. Plasma-aerodynamic boundary layer interaction studies. In Proceedings of the 32nd AIAA Plasmadynamics and Lasers Conference and 4th Weakly Ionized Gases Workshop, Anaheim, CA, USA, 11–14 June 2001. [Google Scholar]
  22. Grech, N.; Leyland, P.; Peschke, P.; Ott, P. Investigation of Flow Separation Control by Nanosecond Pulsed Dielectric Barrier Discharge Actuators. Prog. Flight Phys. 2015, 7, 191–210. [Google Scholar]
  23. Kato, K.; Breitsamter, C.; Obi, S. Flow separation control over a GA387 airfoil by nanosecond pulse-periodic discharge. Exp. Fluids 2014, 55, 1–19. [Google Scholar] [CrossRef]
  24. Lissaman, P.B.S. Low Reynolds number airfoils. Ann. Rev. Fluid Mech. 1983, 15, 223–239. [Google Scholar] [CrossRef]
  25. Geuns, R.; Leyland, P.; Plyushchev, G.; Goekce, S.; Peschke, P. Flow Separation Control with Plasma Actuators. In Proceedings NEPCAP 2014, Sochi; Torus Press: Moscow, Russia, 2014. [Google Scholar]
  26. Geuns, R. NL and Ecole Polytechnique Fédérale de Lausanne. Master’s Thesis, TU Delft, Delft, Switzerland, November 2014. [Google Scholar]
  27. Ashpis, D.E.; Laun, M.C.; Griebeler, E.L. Progress Toward Accurate Measurement of Dielectric Barrier Discharge Plasma Actuator Power. AIAA J. 2017, 55, 2254–2268. [Google Scholar] [CrossRef] [PubMed]
  28. Bradshaw, P. An Introduction to Turbulence and Its Measurement: Thermodynamics and Fluid Mechanics Series; Elsevier: Amsterdam, The Netherlands, 2013. [Google Scholar]
Figure 1. (top) A 3D view of the model used with a NACA 0015 profile (top left) with the insert indents for fixing to the Wind Tunnel section side walls, and a cross-section of the model showing the recess in the profile. (bottom) The profile “blown-up” in the y-direction for clarity to see the marked pressure tap locations used. The green ones were blocked by the actuator.
Applsci 09 02989 g001
Figure 2. Scheme of the dielectric barrier discharge (DBD) actuator.
Applsci 09 02989 g002
Figure 3. The ns-pulse (NS-P) power supply setup, developed in-house at EPFL by the Swiss Plasma Centre.
Applsci 09 02989 g003
Figure 4. Sample current and voltage waveforms for the ns-pulse (NS-P) power supply.
Applsci 09 02989 g004
Figure 5. Location of measurement lines used to obtain the power spectra of flow instabilities without actuation.
Applsci 09 02989 g005
Figure 6. Example of the location where the PSD analysis took place for: the shear layer region close to the leading edge (lines L1, L2, and L3) (left); and the region of wake (W1 and W2) as depicted in Figure 5 (right).
Applsci 09 02989 g006
Figure 7. Power spectra along L1, R e = 100,000 and α = 24 .
Applsci 09 02989 g007
Figure 8. Power spectra along W2, R e = 100,000 and α = 24 .
Applsci 09 02989 g008
Figure 9. C p distribution at R e = 100,000 , U = 10 m / s and α = 16 .
Applsci 09 02989 g009
Figure 10. C p distribution at R e = 200,000 , U = 20 m / s and α = 16 .
Applsci 09 02989 g010
Figure 11. C p distribution at U = 10 m/s and α = 24 .
Applsci 09 02989 g011
Figure 12. C p distribution at U = 20 m/s and α = 24 .
Applsci 09 02989 g012
Figure 13. PSD analysis at R e = 100,000 and α = 16 .
Applsci 09 02989 g013
Figure 14. PSD analysis at R e = 200,000 and α = 24 .
Applsci 09 02989 g014
Figure 15. Power spectra showing multiples of actuation frequency at R e = 100,000 and α = 16 .
Applsci 09 02989 g015
Figure 16. Power spectra at R e = 200,000 and α = 16 .
Applsci 09 02989 g016
Figure 17. Power spectra at R e = 200,000 and α = 24 .
Applsci 09 02989 g017
Figure 18. C p distribution comparing applied voltages at R e = 100,000 and α = 16 , and actuation frequency f = 66.6 Hz .
Applsci 09 02989 g018
Figure 19. PSD analysis comparing applied voltages at R e = 100,000 and α = 16 , and actuation frequency f = 66.6 Hz .
Applsci 09 02989 g019
Figure 20. C p distribution comparing applied voltages at R e = 200,000 and α = 16 , and actuation frequency f = 174.4 Hz .
Applsci 09 02989 g020
Figure 21. PSD analysis comparing applied voltages at R e = 200,000 and α = 16 , and actuation frequency f = 174.4 Hz .
Applsci 09 02989 g021
Figure 22. C p distribution comparing applied voltages at R e = 100,000 and α = 16 , and actuation frequency f = 66.6 Hz .
Applsci 09 02989 g022
Figure 23. C p distribution comparing applied voltages at R e = 200,000 and α = 16 , and actuation frequency f = 266.6 Hz .
Applsci 09 02989 g023
Figure 24. Evolution of different instantaneous flow structures and vortices with plasma actuation at F c + = 1 and R e = 100,000 (constant flow conditions).
Applsci 09 02989 g024
Figure 25. Velocity field at R e = 200,000 and α = 16 and DBD actuation at frequency f = 41 Hz (left) and f = 133 Hz ( F c + = 1 ) (right).
Applsci 09 02989 g025
Figure 26. Velocity field at R e = 100,000 and α = 16 and DBD actuation at F c + = 1 .
Applsci 09 02989 g026
Figure 27. Swirling strengths at R e = 200,000 and α = 24 : with no actuation (a); at actuation frequency of 69 Hz , (b); and at actuation frequency of 266.6 Hz , (c).
Applsci 09 02989 g027

