1. Introduction
The problem of water inrush with fracture rock mass seriously affects underground engineering. Grouting technology has become an important method for the prevention and governance of water inrush disasters. It is very necessary to enhance the research on the effects of grouting and water plugging with flowing water.
Abundant achievements have been acquired in grouting technology. Grouting technology is widely used to control water inrush during the construction of tunnels and mines. Grouting plays an important role in mining because fractures are often caused by water inrushes [
1], but grouting in rock fractures with dynamic water is still a challenge for engineers [
2].
The geological conditions of grouting in rock mass with fractures are complex, therefore, the factors that influence the grouting sealing effect in fractures are varied, for example, the density of joints, fracture opening, grouting materials, flowing water, etc. Many grouting experiments have been carried out in the field and laboratory, and many factors should be considered during grouting. Grouting materials can be divided into multiple categories, and cement grout and chemical grout are the mainly grouting materials used in grouting engineering.
The grouting areas often fracture with flowing water. Meanwhile, the pressure of underground water will increase with the difficulty involved in grouting [
3]. The flowing water in fractures also affects the grout diffusion, and the flowing water also reduces the strength of adjacent clay [
4]. Visualization of grout propagation is achieved through laboratory experiments, using the grout diffusion distance and the shape of grout diffusion as the main research objects. The propagation length of cement grout has positive correlations with the water flow rate and grouting pressure [
1], and methods for calculating the diffusion distance of slurry have been proposed [
5,
6]. To study the shape of grout diffusion, Li proposed the U-shaped diffusion theory of cement grouting in a single plate fracture with flowing water [
7]. Zhang compared the diffusion law of chemical grouting under static water and flowing water and found that the diffusion shape of grout is nearly round under static water conditions [
8].
The goal of grouting is to seal the fracture and block water, and it can be used to improve the shear strength of rock joints [
9]. Kohkichi discussed the grouting effects of rock masses by situ experiments and determined that grouting can improve the deformability of rock mass [
10]. Chemical grouting was simulated in a model of an indoor coal mine shaft by Wang [
11], and grout propagation in soils was determined. Sui investigated the changes in seepage pressure and the grout diffusion law in a plate fracture with flowing water, and determined the relationships among the water flow velocity, gel time, aperture width, and sealing effect of grout [
12]. Liang investigated the sealing effect of chemical grouting in an inclined fracture with water and sand, the results showed that grouting plays an important role in controlling the sand and water [
13]. In addition, grouting pressure plays an important role in grouting and is a crucial factor for grouting results [
14].
However, the natural fracture surfaces are rough in actual grouting projects. The roughness is one of the basic characteristics of rock masses. The concept of the roughness coefficient of structural surfaces was presented by Bardon [
15], and the roughness of fractures was divided into 10 grades by Bardon [
16] according to the degree of fluctuation, where the joint roughness coefficient (
JRC) values were from 0 to 20. Therefore, enhancing research on grouting in rough fractures is necessary. This paper investigated chemical grouting in rough fractures with flowing water, which has a good correlation between theory and actual engineering.
2. Materials and Methods
2.1. Grouting Materials
Experiments were conducted to study flowing water grouting in fractures with different roughness. Modified urea formaldehyde resin (liquid A) and oxalate acid (liquid B) were chosen as grouting materials. These materials are widely used in underground engineering in China. This study mainly investigated the rheological properties of grout. The gel time was used as the chief index of the rheological properties of grout. It was adjusted by adjusting the ratio of liquid A to liquid B. The gel time of the grout was defined as when the fluidity of the liquid A to liquid B was lost. The ratio of liquid A to liquid B was 1:1. The gel time of the grout was controlled by changing the concentration of liquid B.
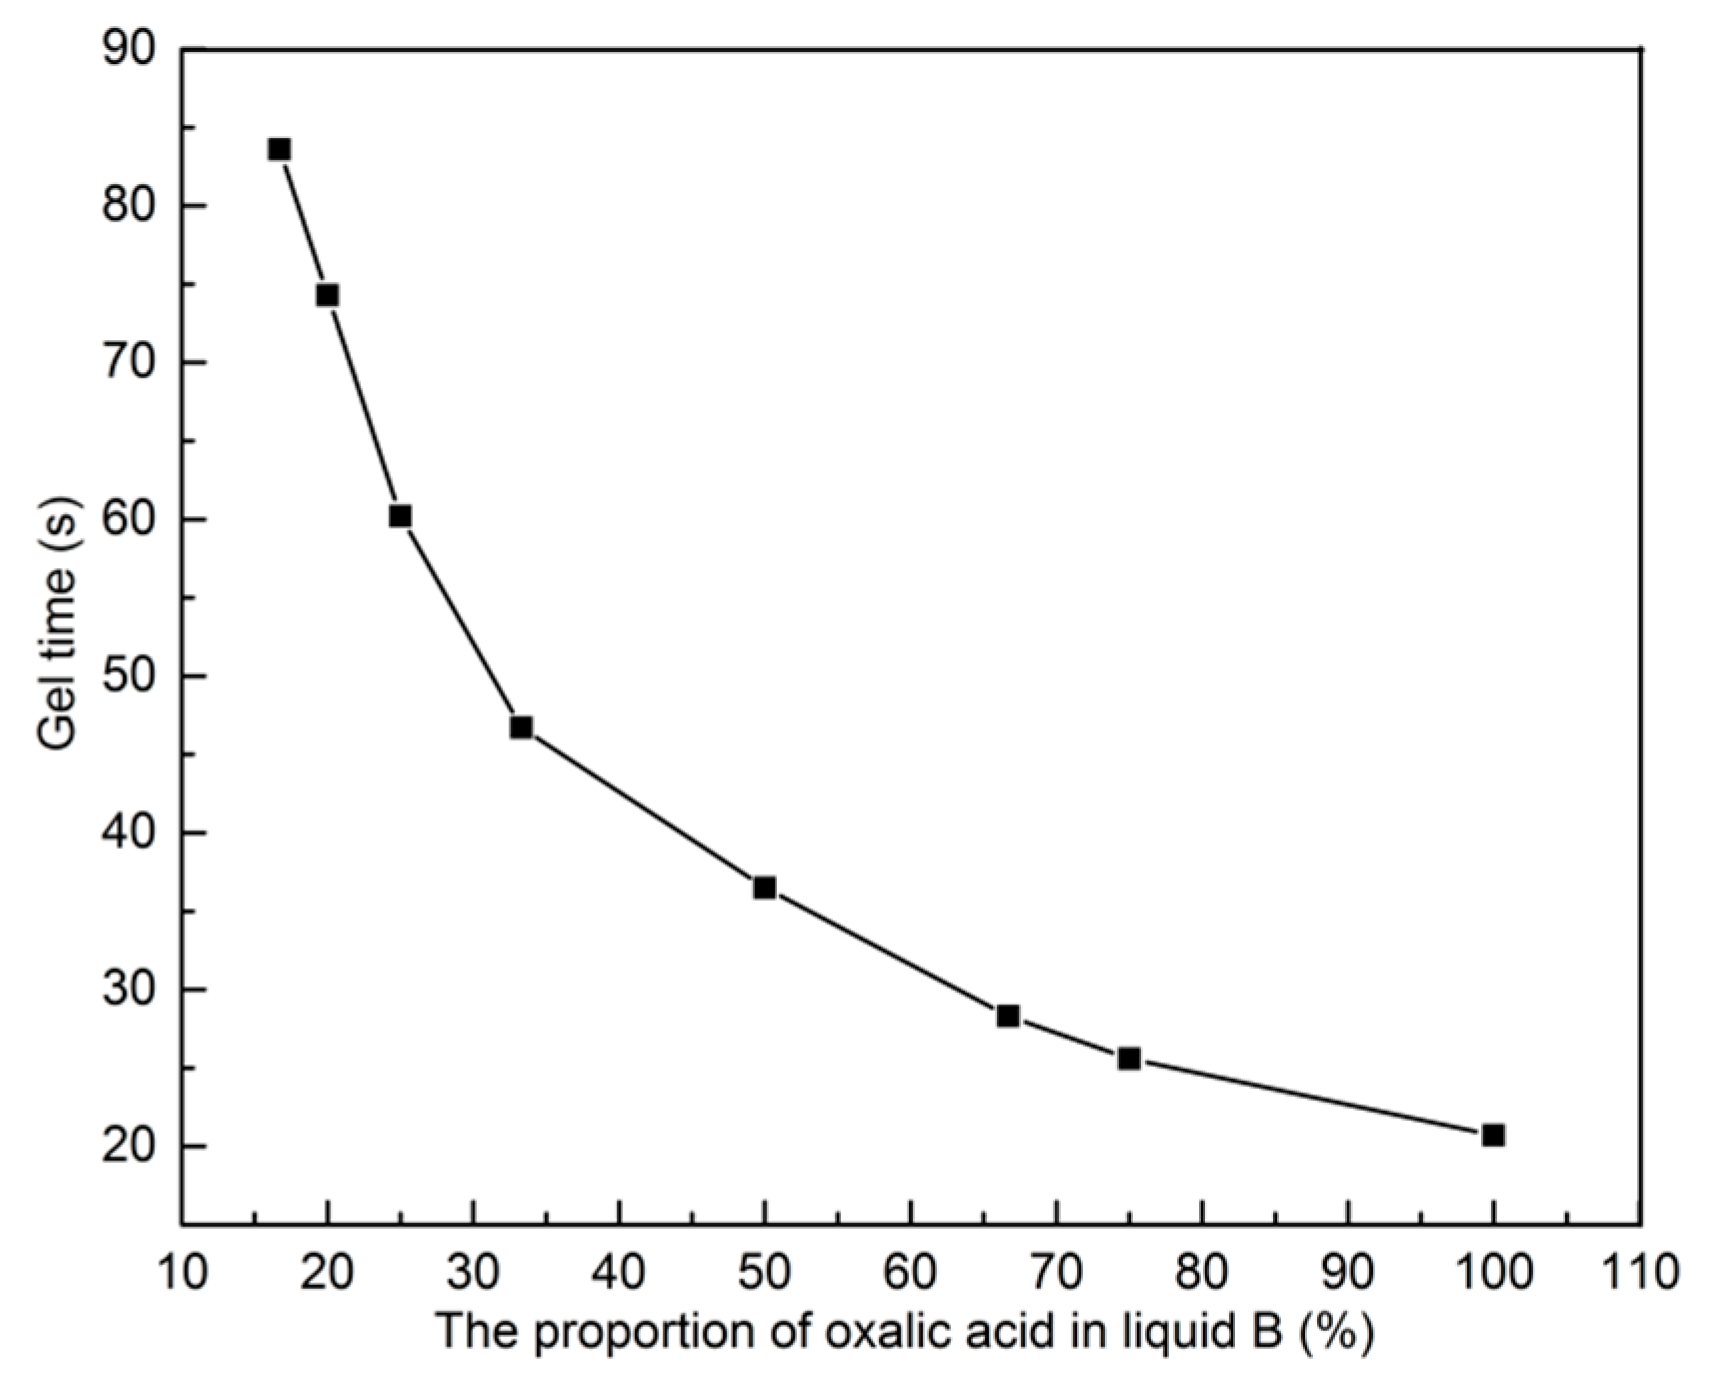
Figure 1 shows the relationship between the gel time and the concentration of oxalic acid in liquid B.
The result shows that the gel time decreased as the oxalic acid’s concentration increased. The gel time ranged from 20.7 to 83.6 s.
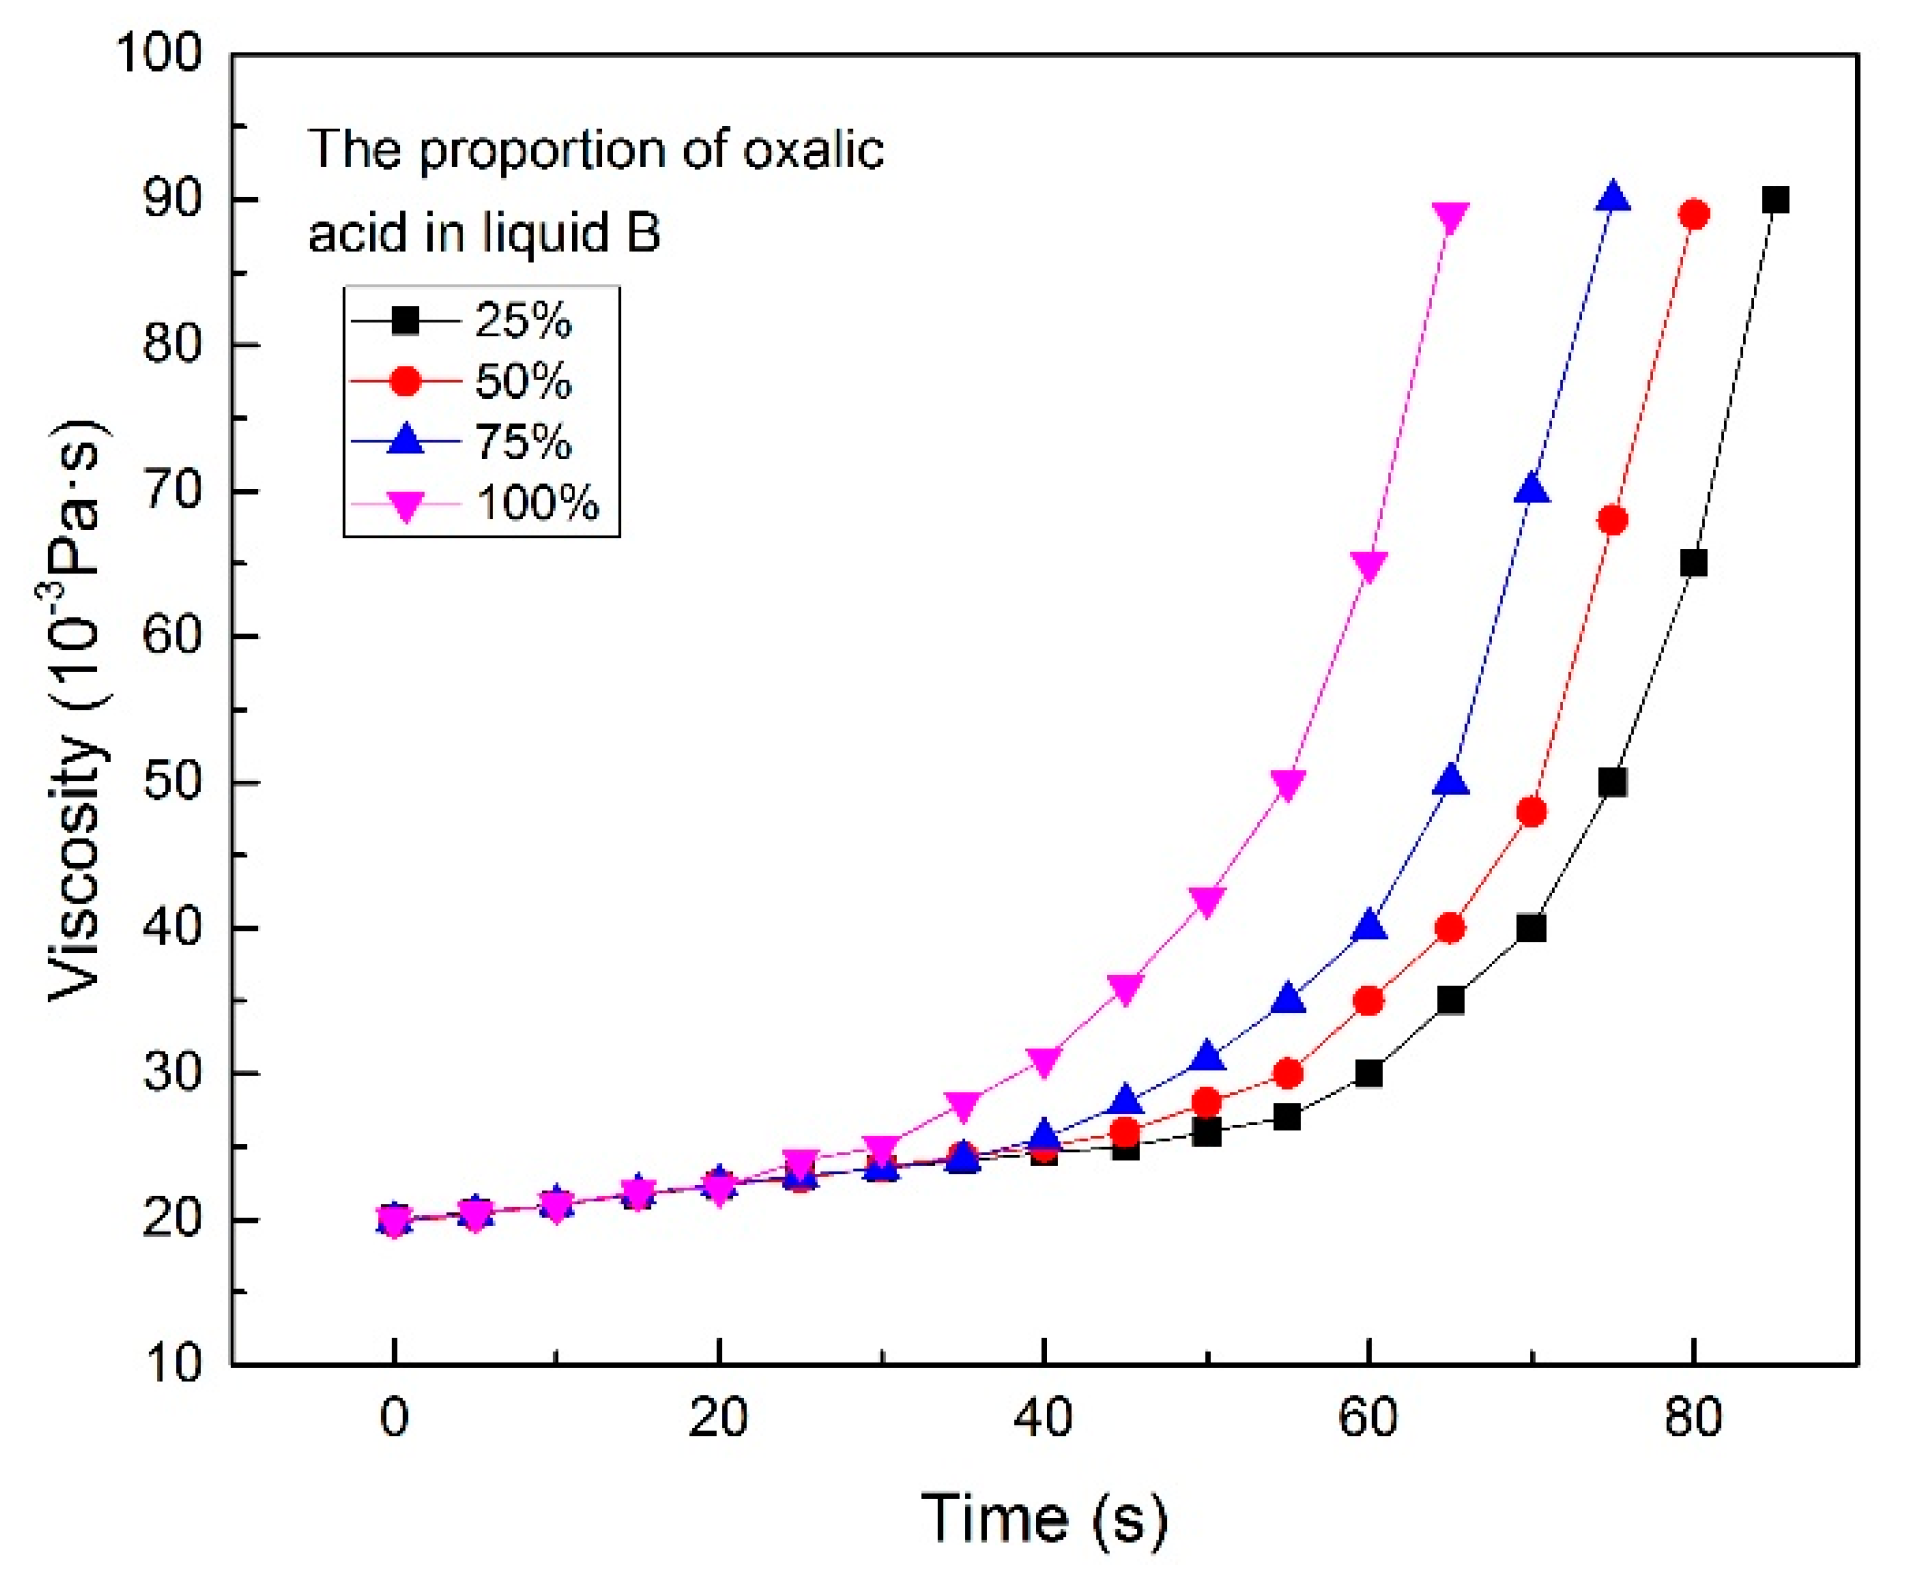
Figure 2 shows the relationship between the viscosity of chemical grout and time measured by viscometer with different proportions of oxalic acid in liquid. The viscosity of the chemical grout increases over time, and the higher the proportion of oxalic acid in liquid B was, the faster the viscosity increased. The viscosity changed slightly before the chemical grout solidifies. The viscosity increased rapidly after solidification of the chemical grout.
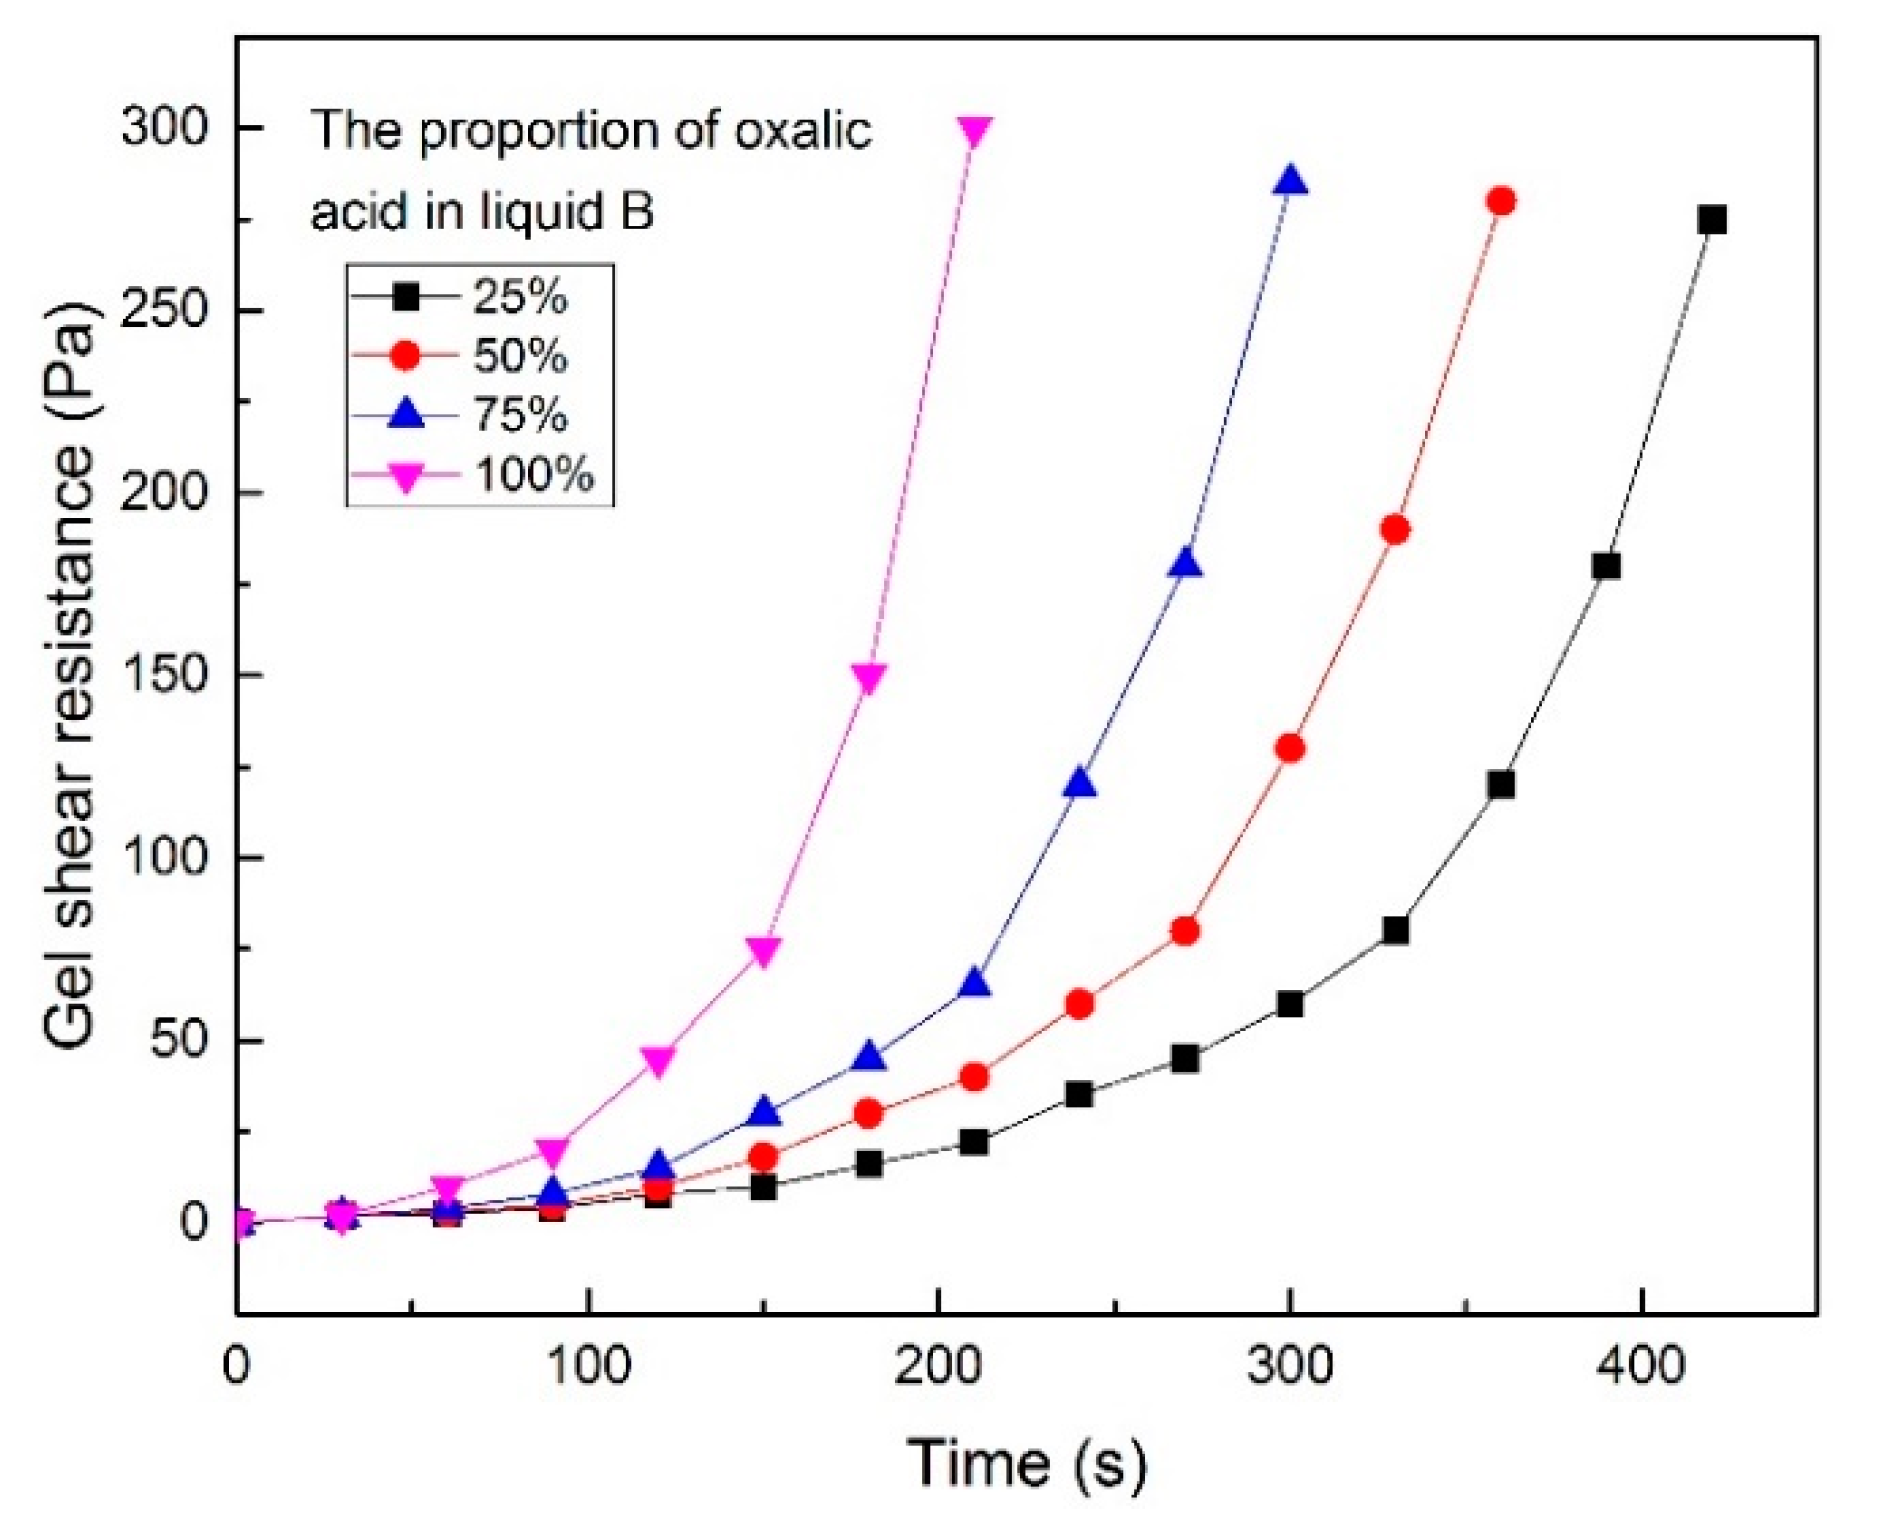
Figure 3 shows the effect of different proportions of oxalic acid in liquid B on the gel shear resistance. The gel shear resistance increased with time, and the higher the concentration of the liquid was, the faster the gel shear resistance increased.
2.2. Method of Generating the Fracture Replica
There are two representative methods to generate fracture replica: Numerical and physical. One of the numerical methods is the exponential variogram, which can be used to characterize the heterogeneity and anisotropy of fractures media as an effective method for studying permeability. However, normal transformation increases the degree of heterogeneity of fracture media. Another method is the self-affine surface, which can be used to simulate the form of a fracture. Three fractures were numerically simulated and the power-law fluid flow in rough fracture was researched by Lavrov [
17] using this method. An isotropic self-affine fractal method was used to simulate the aperture fluctuations, and a numerical model of rough fractures was established to describe a single-phase viscous flow in rough fractures in the work of Meheust [
18]. In terms of physical methods, Scesi and Gattinoni used a cement layer and Bardon’s roughness profiles to prepare sample for permeability testing [
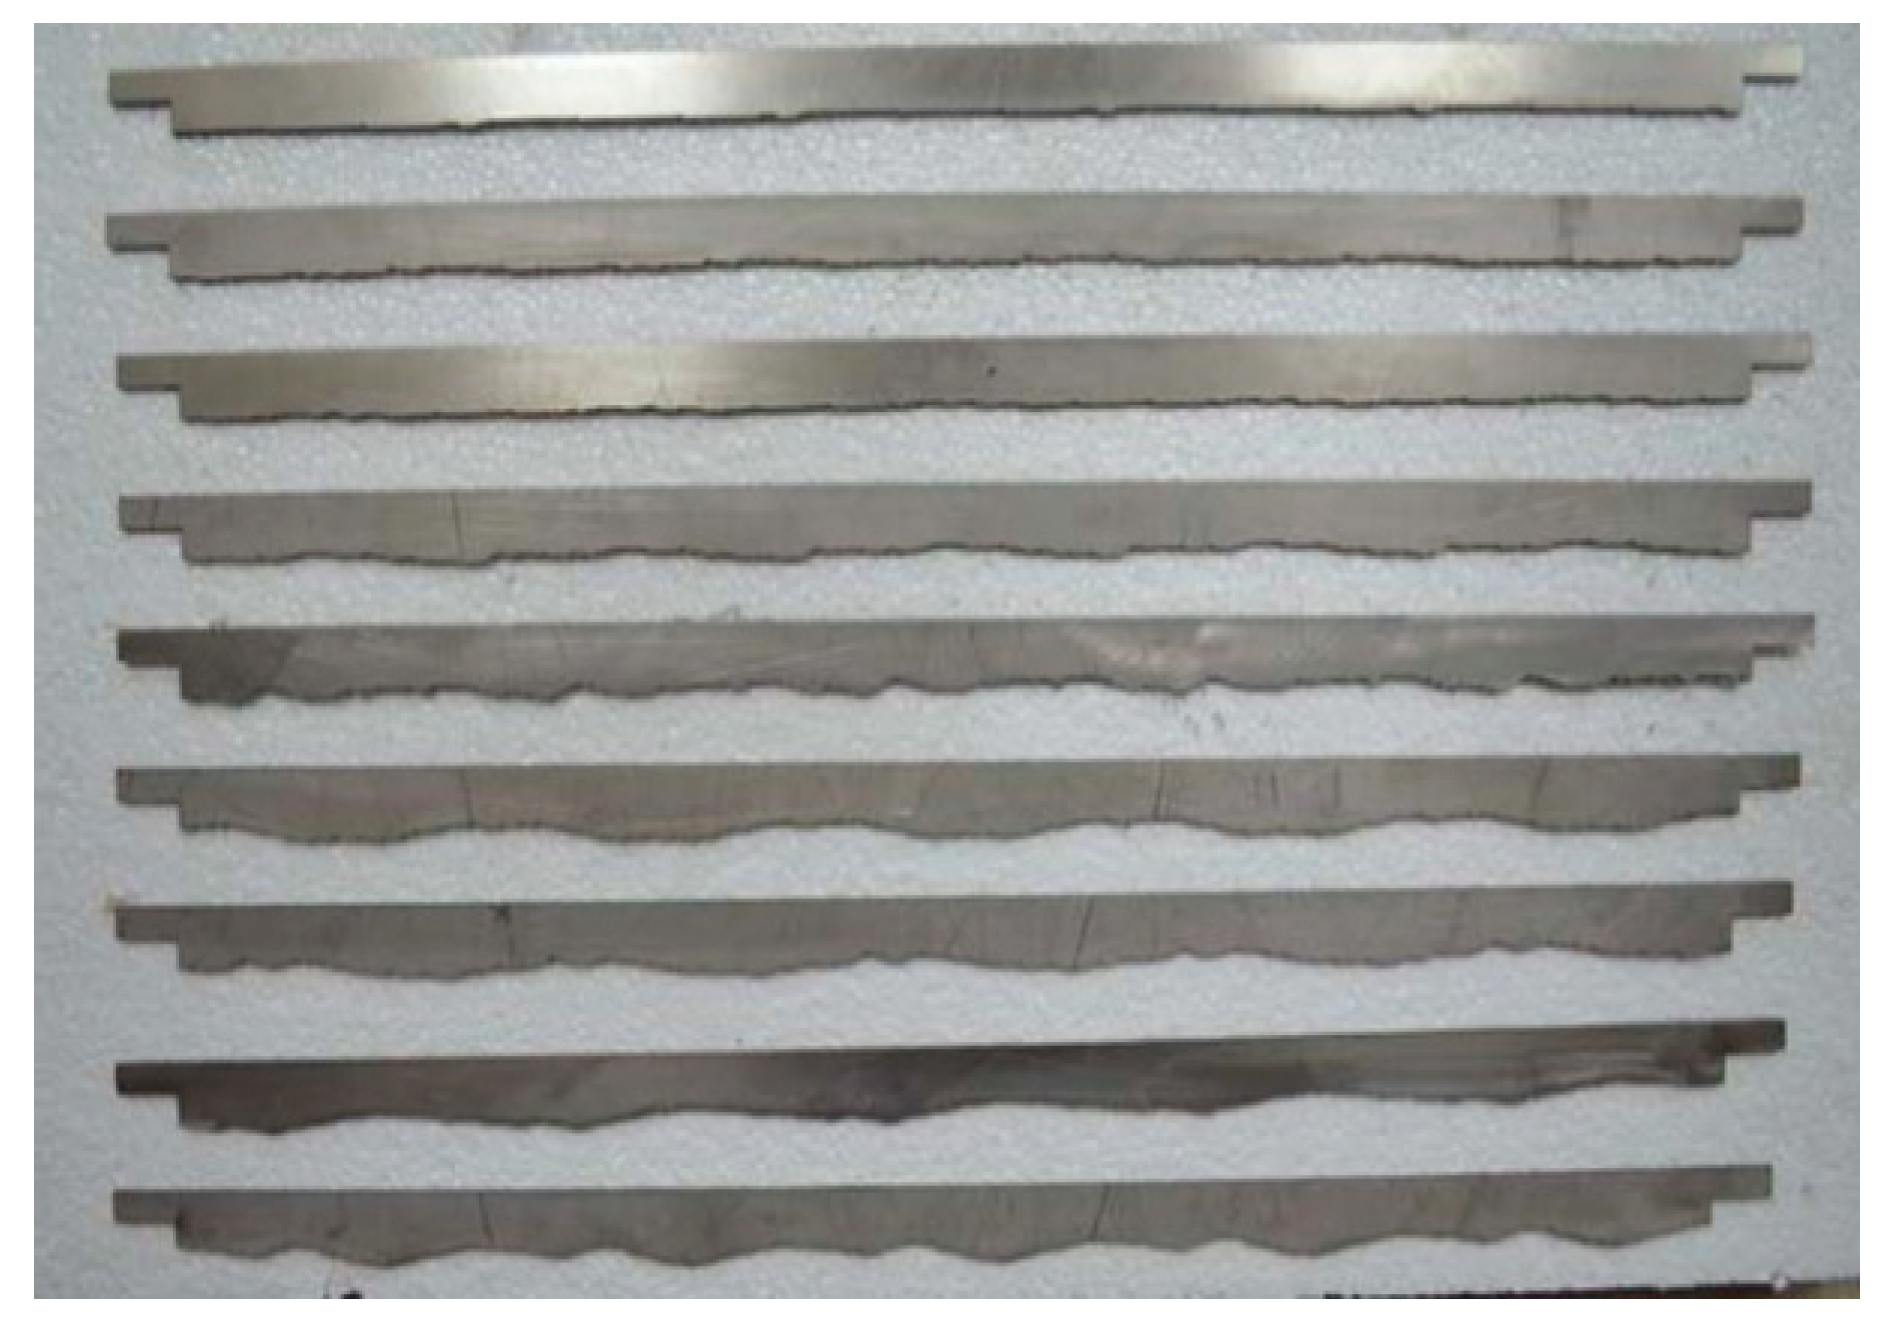
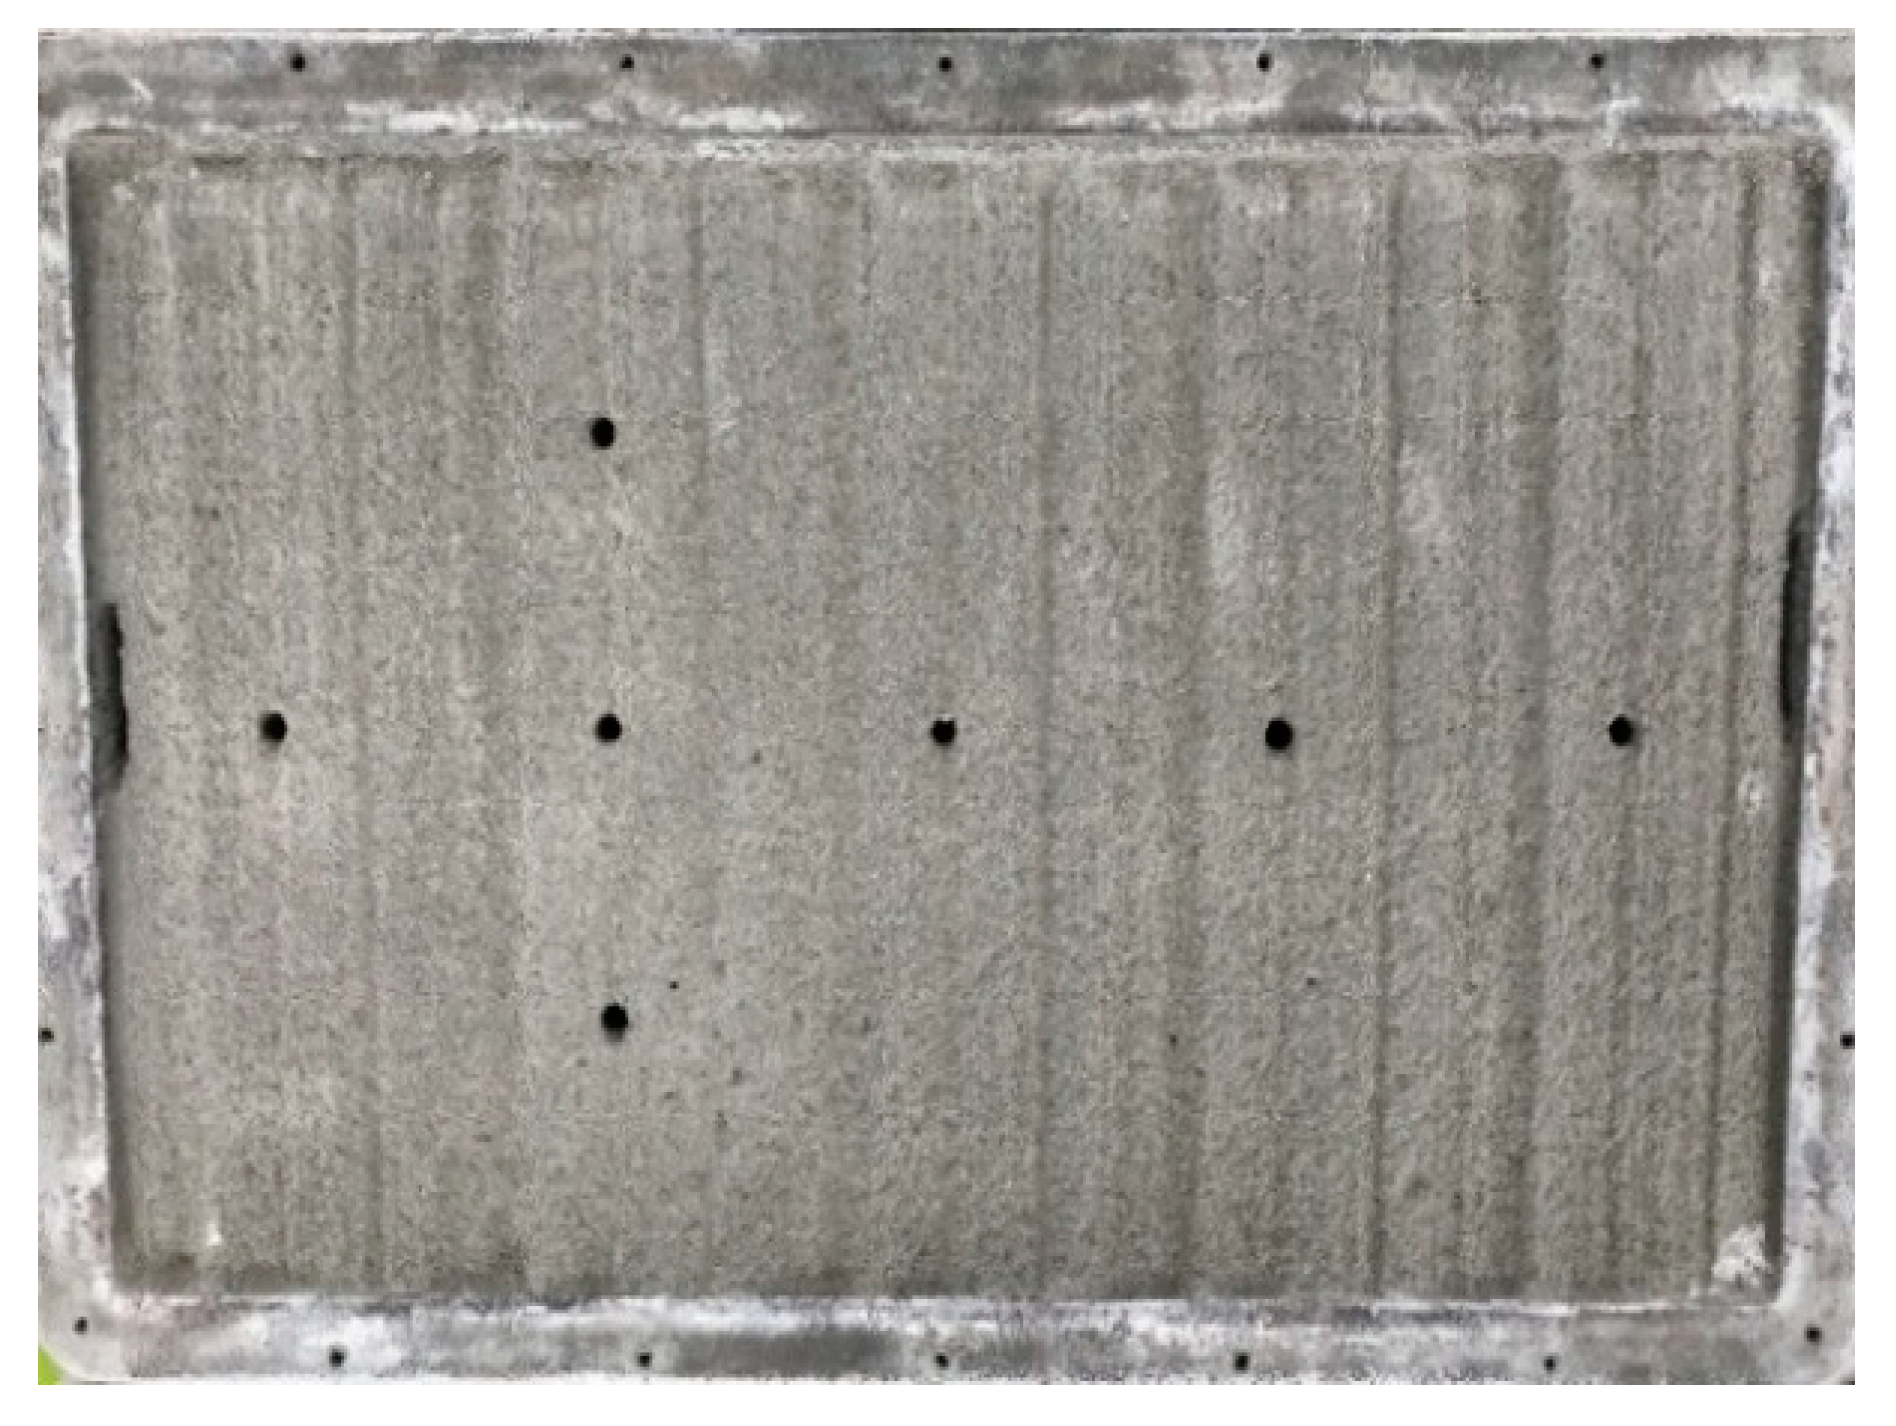
19]. This method was adopted to make fracture replicas with different roughness in this paper. The system used on simulated rough fractures was composed of a PC board, a model box, and a rough fracture, which was made from cement mortar. Grade C25 strength Portland cement with river sand with a particle size of less than 0.1 mm were used in a ratio is 1:3 as the materials to simulate rough fracture. The ratio of water to cement was 1:0.5. This was mixed with river sand form cement mortar. The cement mortar was poured into the model box and the surface was pave. This was maintained for two hours. The steel plates were cut into the shapes of Bardon’s standard roughness profiles using laser cutting technology. The surface of the cement mortar was scraped with the steel plate to form a standard roughness fracture surface.
Figure 4 shows the steel sheets with the Bardon’s standard roughness profiles.
Figure 5 shows the rough fracture simulation model.
2.3. Experimental Device
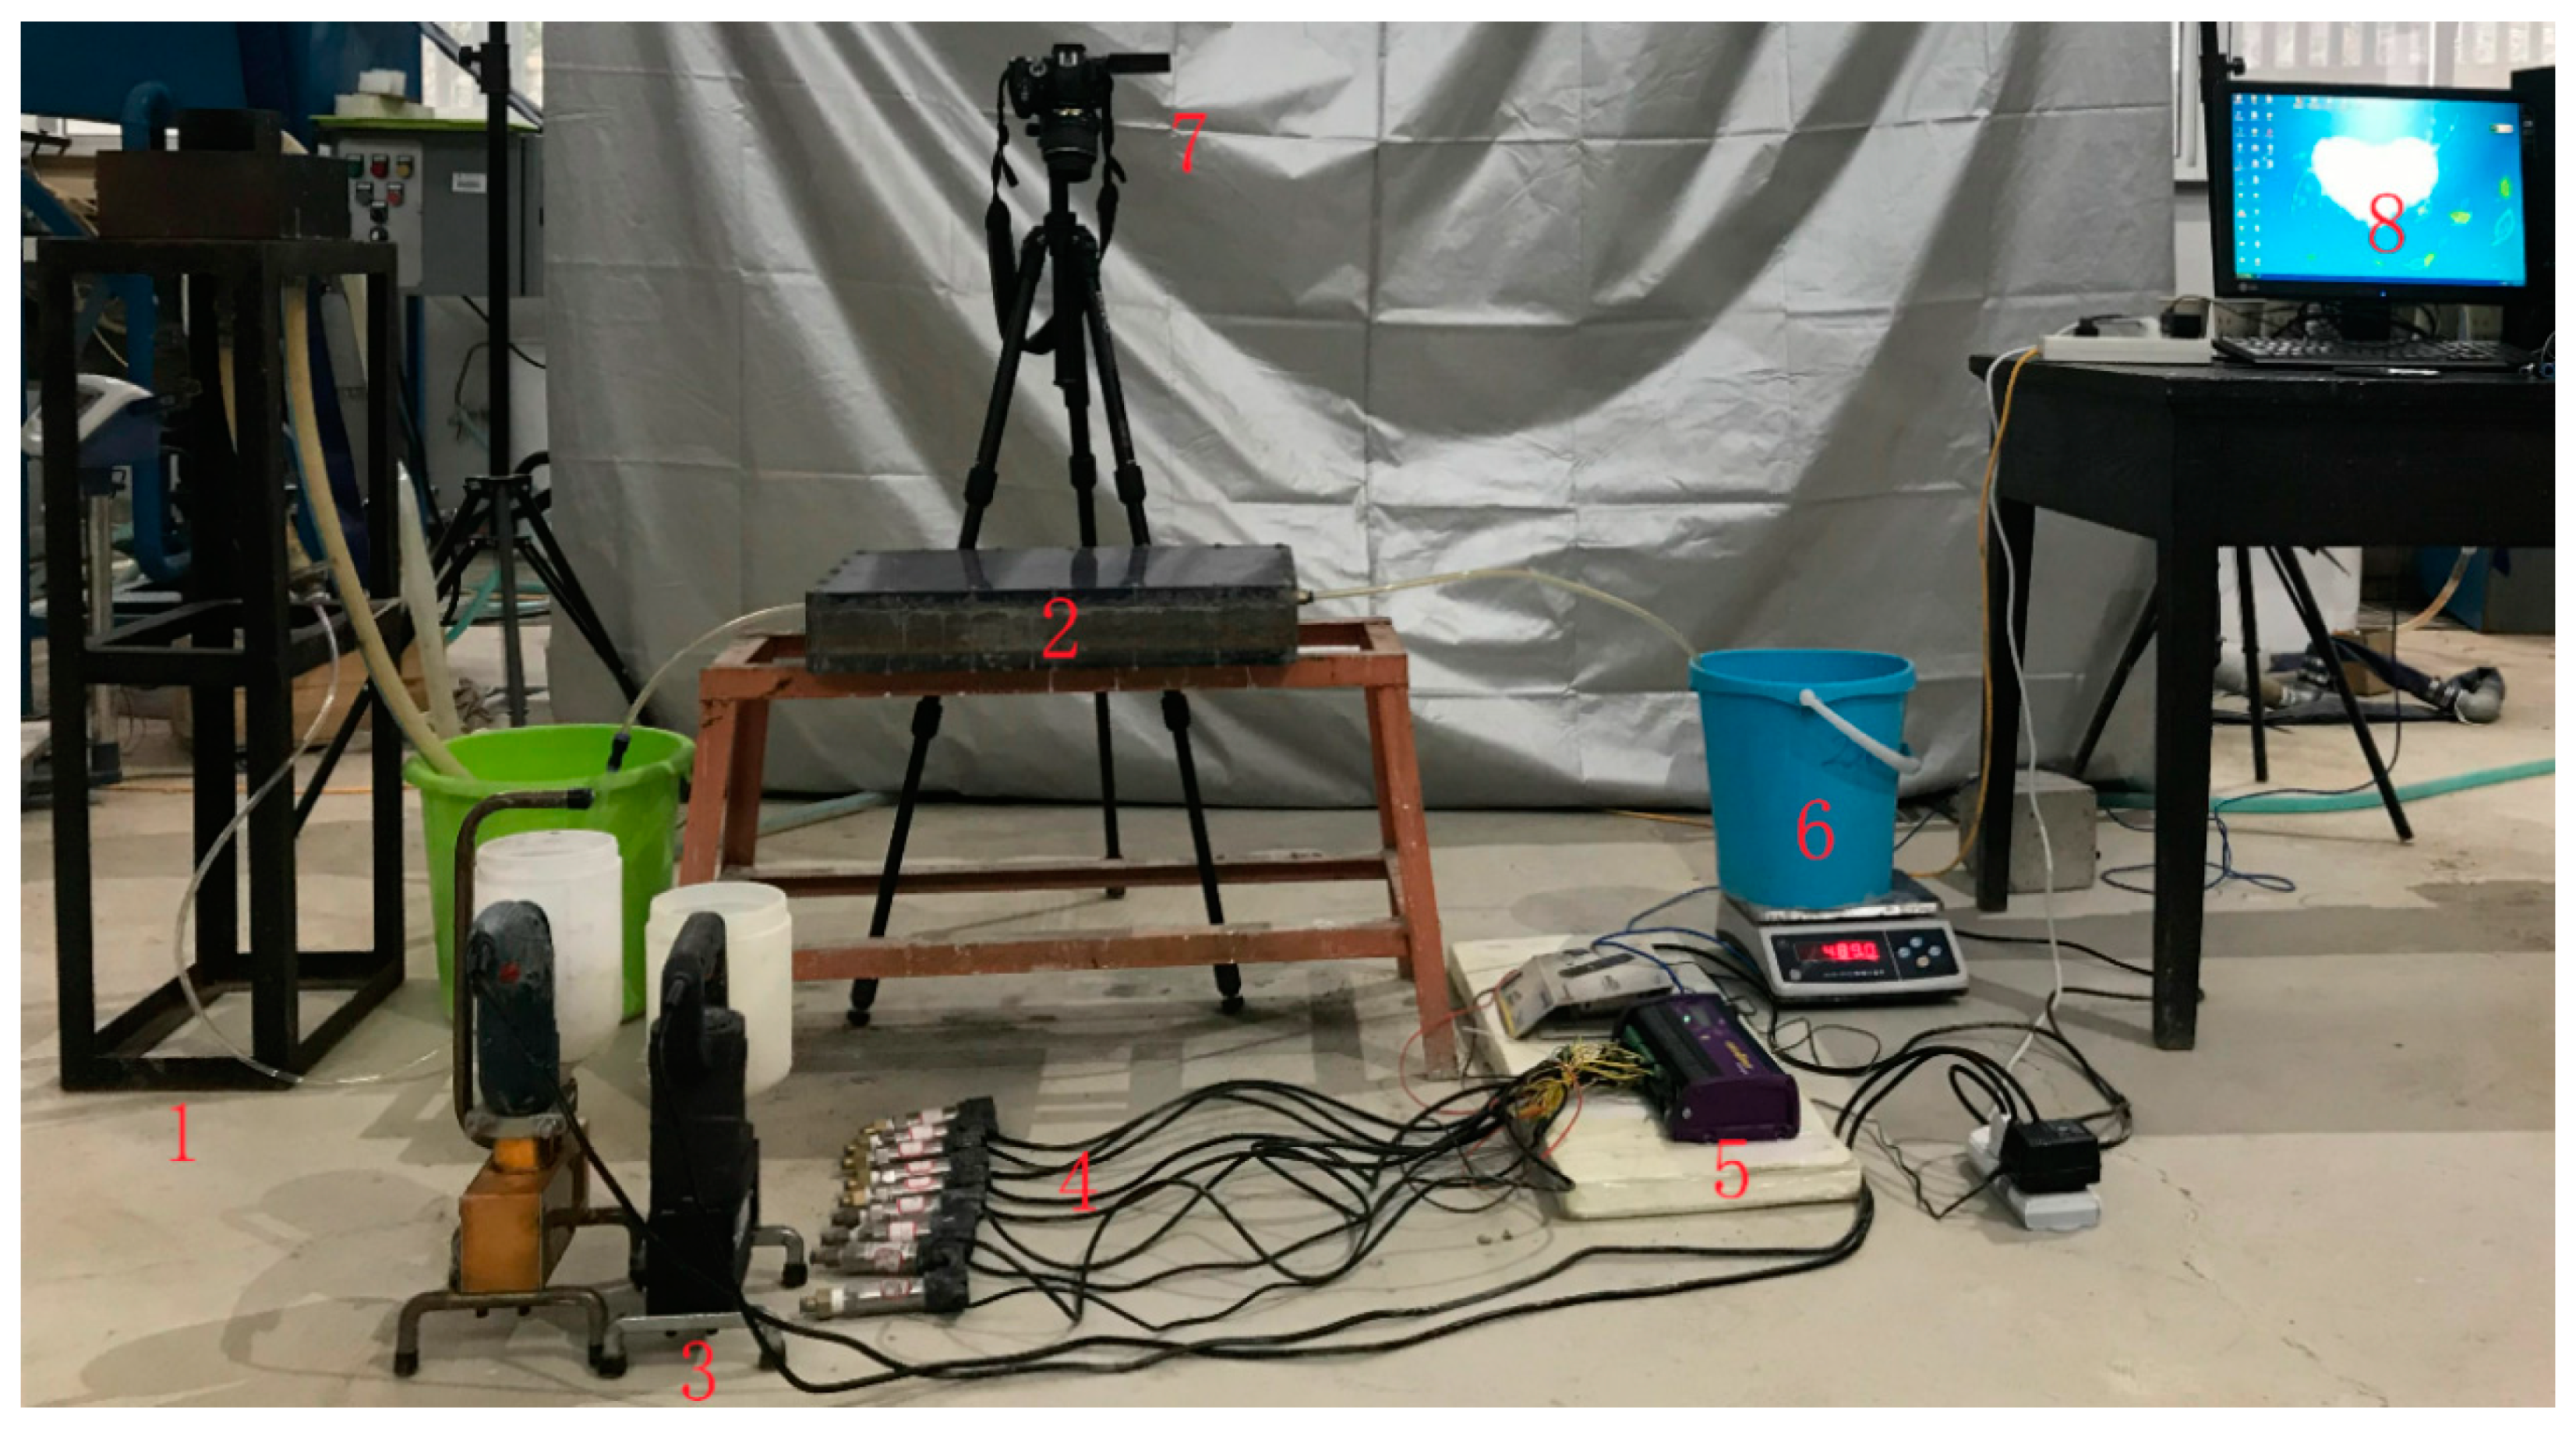
The platform used for chemical grouting in the rough fracture with flowing water was assembled in the laboratory.
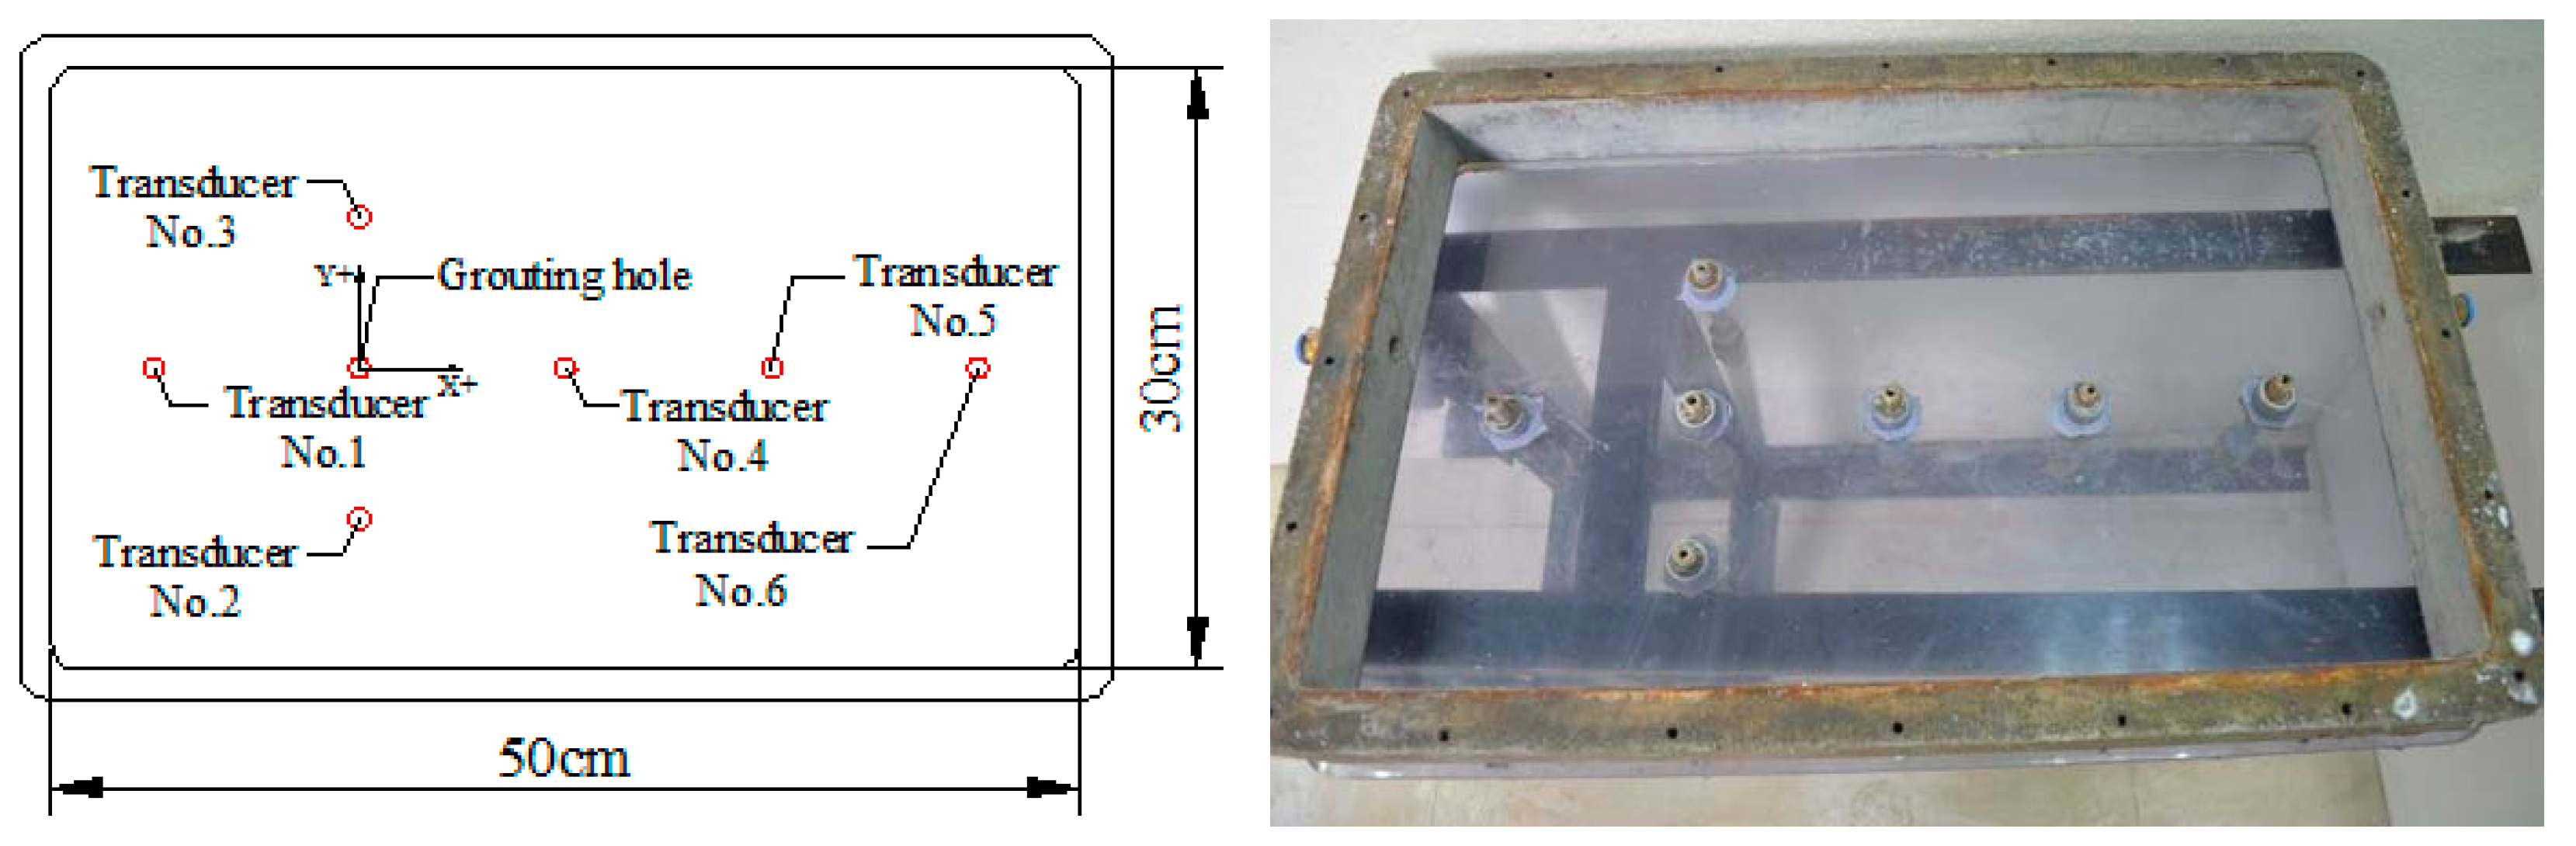
Figure 6 shows the experimental device, which consisted of a stable water head system (labeled 1 in
Figure 6), the simulated fracture (2), a grouting pump (3), pore pressure transducers (4), a data acquisition instrument (5), a weighing system (6), an image acquisition system (7), and a computer (8).
The stable water head system was used to provide a constant flow of water by adjusting the height of the head to control the water velocity. The height of the water head remained constant during the grouting process. The same volumes of liquid A and liquid B were poured into the grouting pumps. Next, the grouting pumps were connected with the grouting hole through the PU tube. There were seven holes on the bottom plate of the model, including one grouting hole and six transducer holes.
Figure 7 shows the layout chart and physical map of each transducer. A rectangular coordinate system was established, and the position of the grouting hole was defined as the origin. The flow direction was defined as the X forward direction, and four pressure measuring holes were arranged in the direction of the X axis, which were located at −10 cm, +10 cm, +20 cm, and +30 cm away from the grouting hole, respectively. There were two pressure measuring holes along the Y axis that were located at a distance from grouting hole of 7.5 cm in each direction. An inlet hole and an outlet hole with an inner diameter of 10 mm were put onto the side wall of the model. The inlet hole was connected with the stable water head system. The data acquisition instrument collected the seepage pressure data in real time. The internal size of the model box used to simulate the rough rock fracture was 50 cm × 30 cm × 10 cm.
2.4. Similarity Theory and Criterion
In the process of grouting with flowing water in rock mass fractures, the movement of grout and water is an interaction among the rock mass, groundwater and grouts. The viscous and rheological properties of grouts are different from those of water. The grouting process in rock mass fractures is very complicated, and similarity criteria for fluid mechanical models should be considered.
Inertia force affects the flow directly, while the pressure, viscous force and gravity affected the fluid as external forces. So, the proportional relationship of forces should be compared with the inertia force [
20,
21]. According to dynamic similarity, it can be obtained that:
where
is the prototype; m is the model;
l is the length;
is the density;
u is the velocity;
K is the similarity index;
Ne is the Newton number.
The Newton number of the model was equal to that of prototype, which ensured power similarity.
The fracture can be classified as follows; widening fractures (fracture width > 5 mm), opening fractures (3–5 mm), micro-tensioning fractures (1–3 mm) and closing fractures (<1 mm). The aperture widths simulated in this paper was 2, 3, 4 and 5 mm. This means that the similarity of the fracture was 1:1, which is a full-scale model.
2.5. Design of Experiment
Considering the diversity of the factors that affect the grouting effect and based on our previous research, the roughness of fracture (JRC) (A), initial water flow rate (B), gel time (C), and fracture opening (D) were selected as the studied factors in the experiment. An orthogonal experiment with four factors and four levels was used.
The length of the Bardon’s standard roughness profiles was 10 cm in the horizontal direction, and each profile was copied four times in the direction of the length. Then, standard roughness profiles of 50 cm length were formed. Steel plates were used to simulate 10 Bardon’s standard roughness profiles, and four steels were selected as the research objects based on the degree of fluctuation, which included the JRC values of 2–4, 6–8, 12–14, and 18–20.
By adjusting the height of the water head to control the initial water flow rate, it was ensured that the tank with the stable water head device was always full of water during the experiment. Water was collected from outlet into the cylinder and the time and volume were recorded. The velocity of water flow was determined by calculating the volume of water across the fracture over time. Initial water flow speeds of 0.4, 0.8, 1.2, and 1.6 cm/s were selected as the four levels.
In this paper, gel times of 36.5, 46.7, 60.2, and 83.6 s were chosen as the different levels.
The concept of equivalent opening was introduced to maintain the consistency of fracture opening in the tests. Zheng put forward the concept of “equivalent hydraulic opening” based on the fracture dip angle and azimuth angle [
22]. The equivalent fracture opening was determined by measuring the excess water flow across the rough fracture surface. The equivalent fracture opening levels selected were 2, 3, 4, and 5 mm.
The four factors and four levels used in the experiment are shown in
Table 1.
The orthogonal array for chemical grouting in a rough fracture with flowing water is shown in
Table 2.
3. Tests Results and Analyses
3.1. Grout Propagation Process
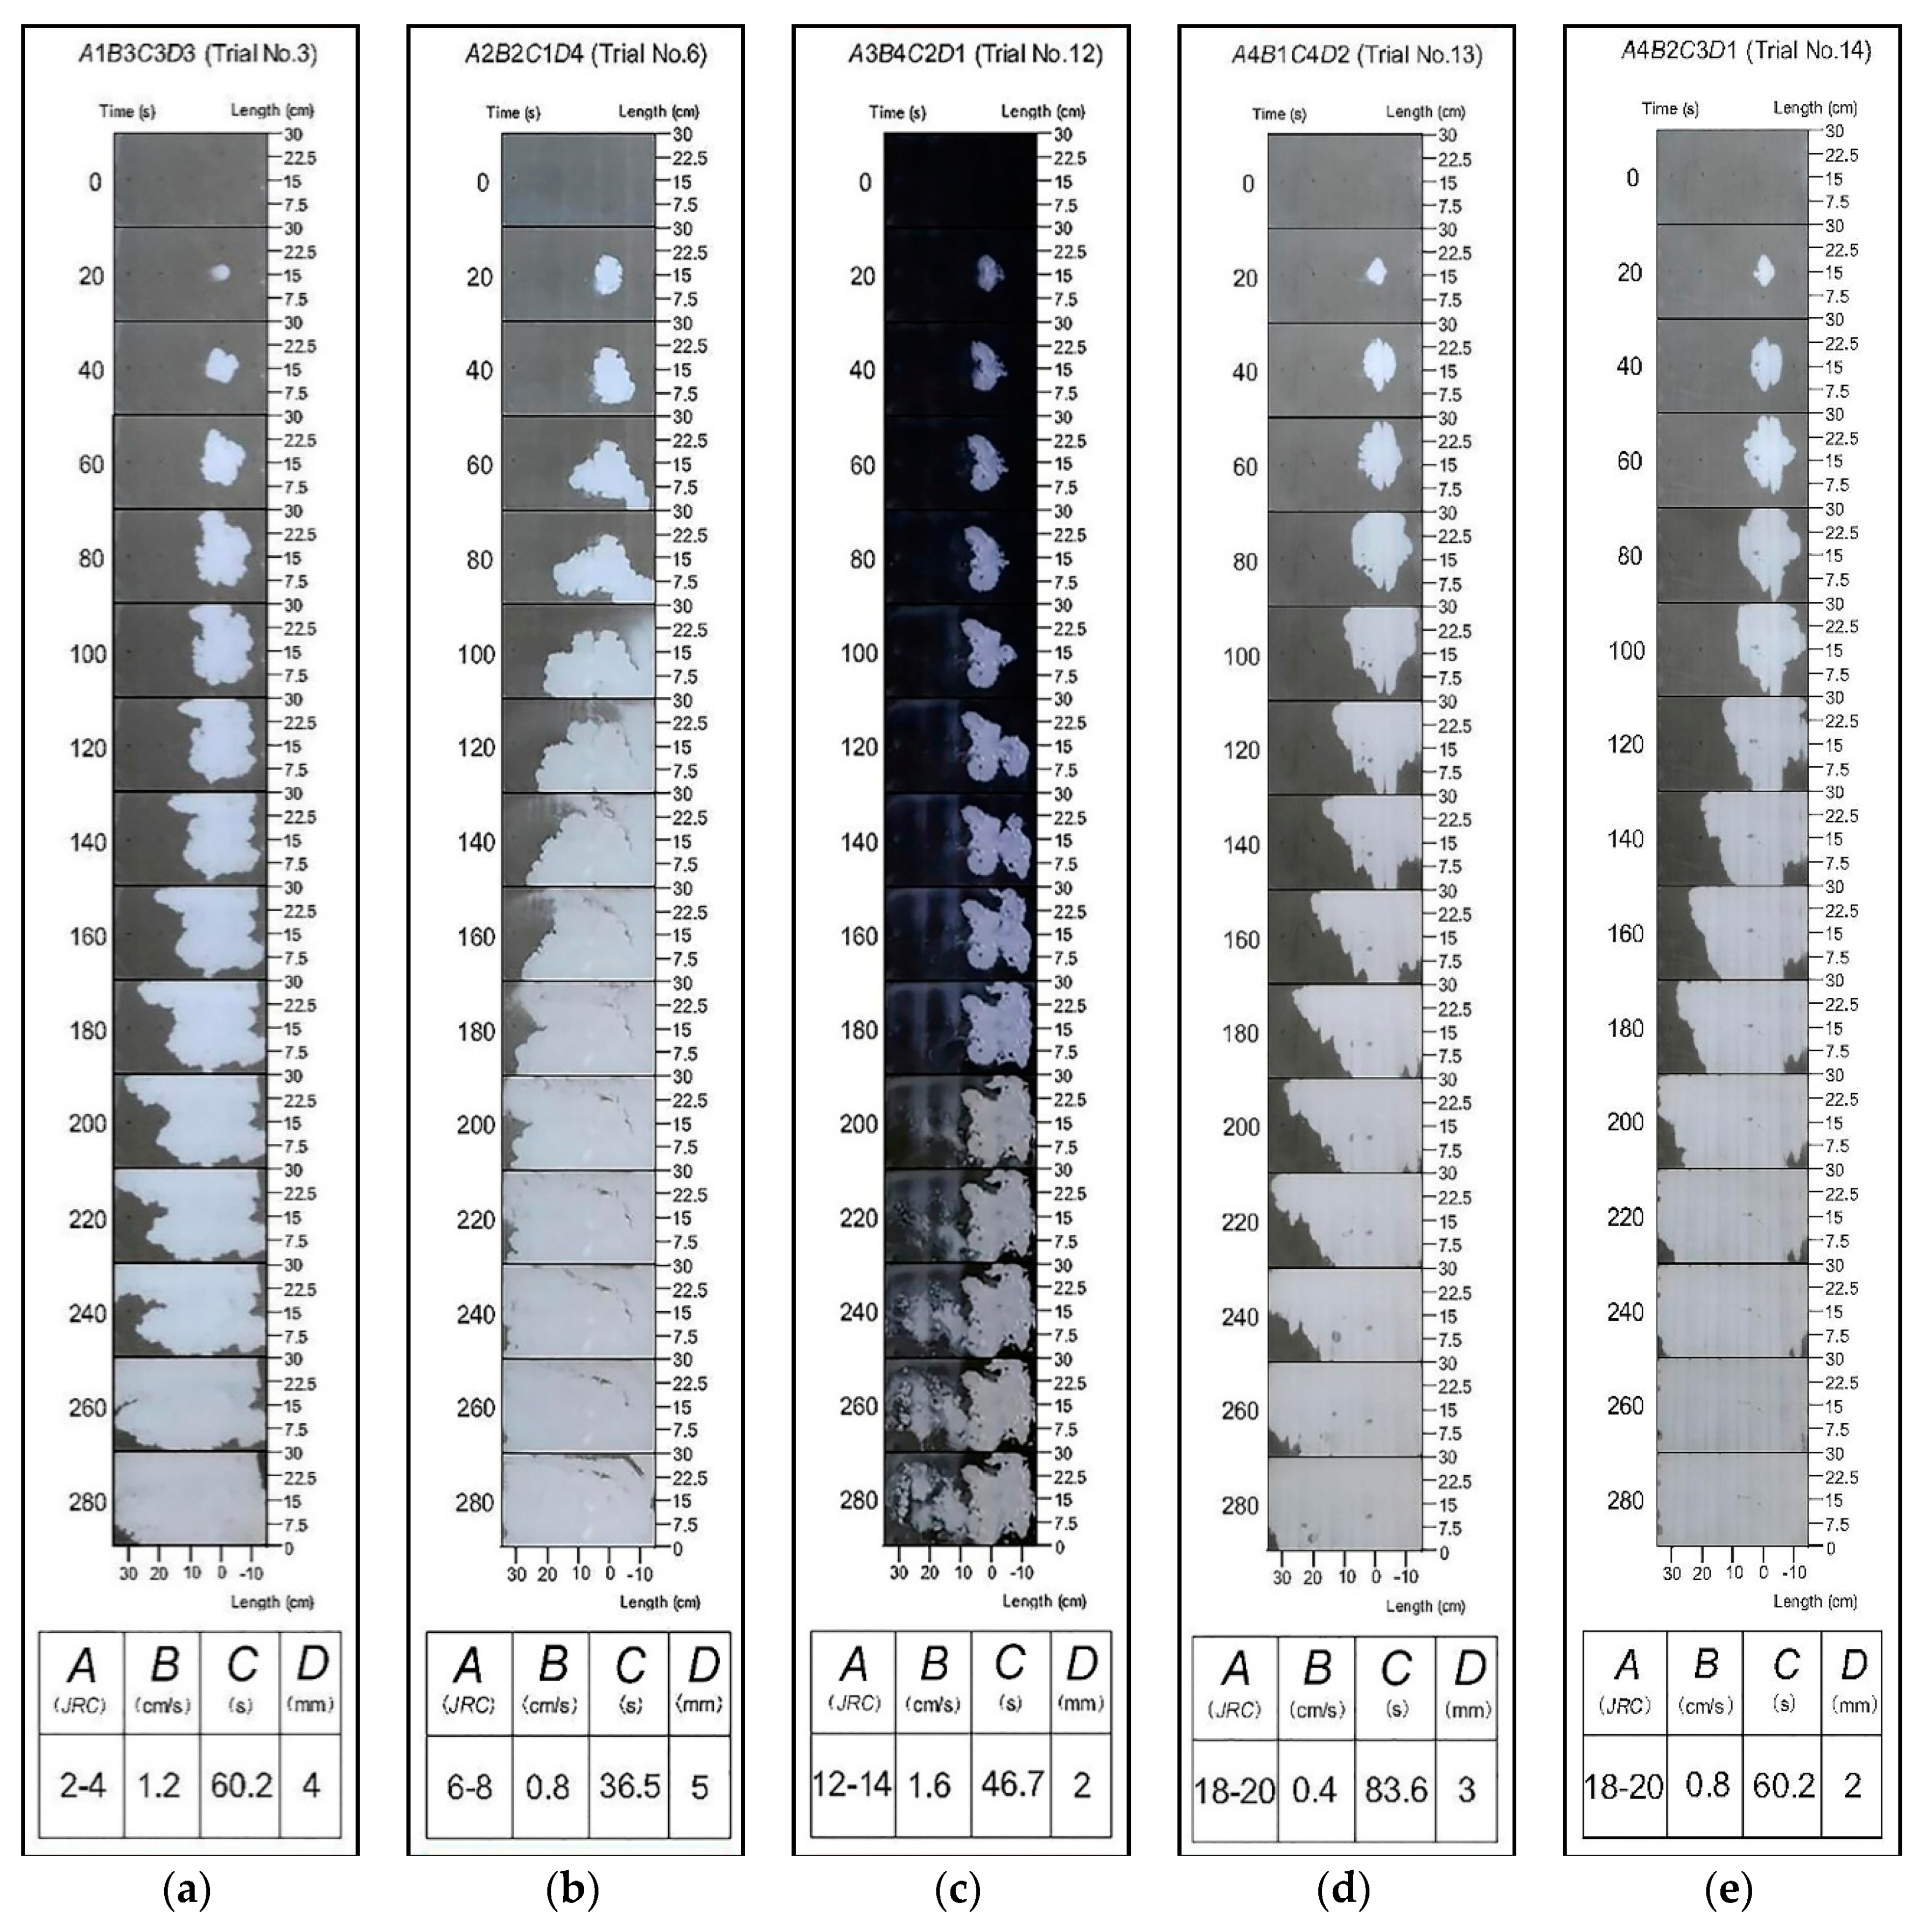
Sixteen groups of experiments were carried out at room temperature (22 degrees), and the whole process of grout diffusion was recorded. Five sets of test images were selected as the representatives for the analysis.
Figure 8a presents the grout diffusion process for the condition
JRC = 2–4. In this case, the fluctuation of the simulated rough fracture was smaller. The diffusion process could be divided into two stages: Near circular diffusion and the whole passage near rectangular stage. The first stage lasted for 100 s, and the same slurry diffusion distance was formed in each direction. The next stage was sustained from 100 to 280 s, after grouting for 100 s, the grout began to spread to the boundary. Afterwards, in the direction of the X axis, with the scouring effect of water flow, the velocity of grout diffusion in the direction of flow became faster than that in the direction of the reverse flow. In the direction of the Y axis, the diffusion distance was basically the same in the direction of the vertical flow.
Figure 8b shows pictures of the grout diffusion in trial No.6, where the grout diffusion was similar to that in trial No.3. The gel time was the shortest as a result of the grout solidifying quickly. At 120 s, a water gushing channel was formed under the inrush of water. A compete grout diffusion process was reached with continuous grouting.
Figure 8c presents pictures showing the fair effect of water plugging. The grout was washed away easily since the rate of the initial water flow was the fastest, and the grout was taken away by water to the outlet. The grout also did not spread to the boundary.
Figure 8d shows images of the grout diffusion in test No.13 with simulation of a rough fracture of
JRC = 18–20. The maximum fluctuation degree increased the resistance of grout diffusion. The grout spread along the direction of the Y axis first. Then, it began to expand across the rough fracture with the increase of grouting pressure and finally reached the boundary of the model.
Figure 8e presents the grout diffusion in trial No.14, which had the best sealing effect in orthogonal experiment, and the whole fracture was filled with grout. The process of grout diffusion was similar to that trial No.13.
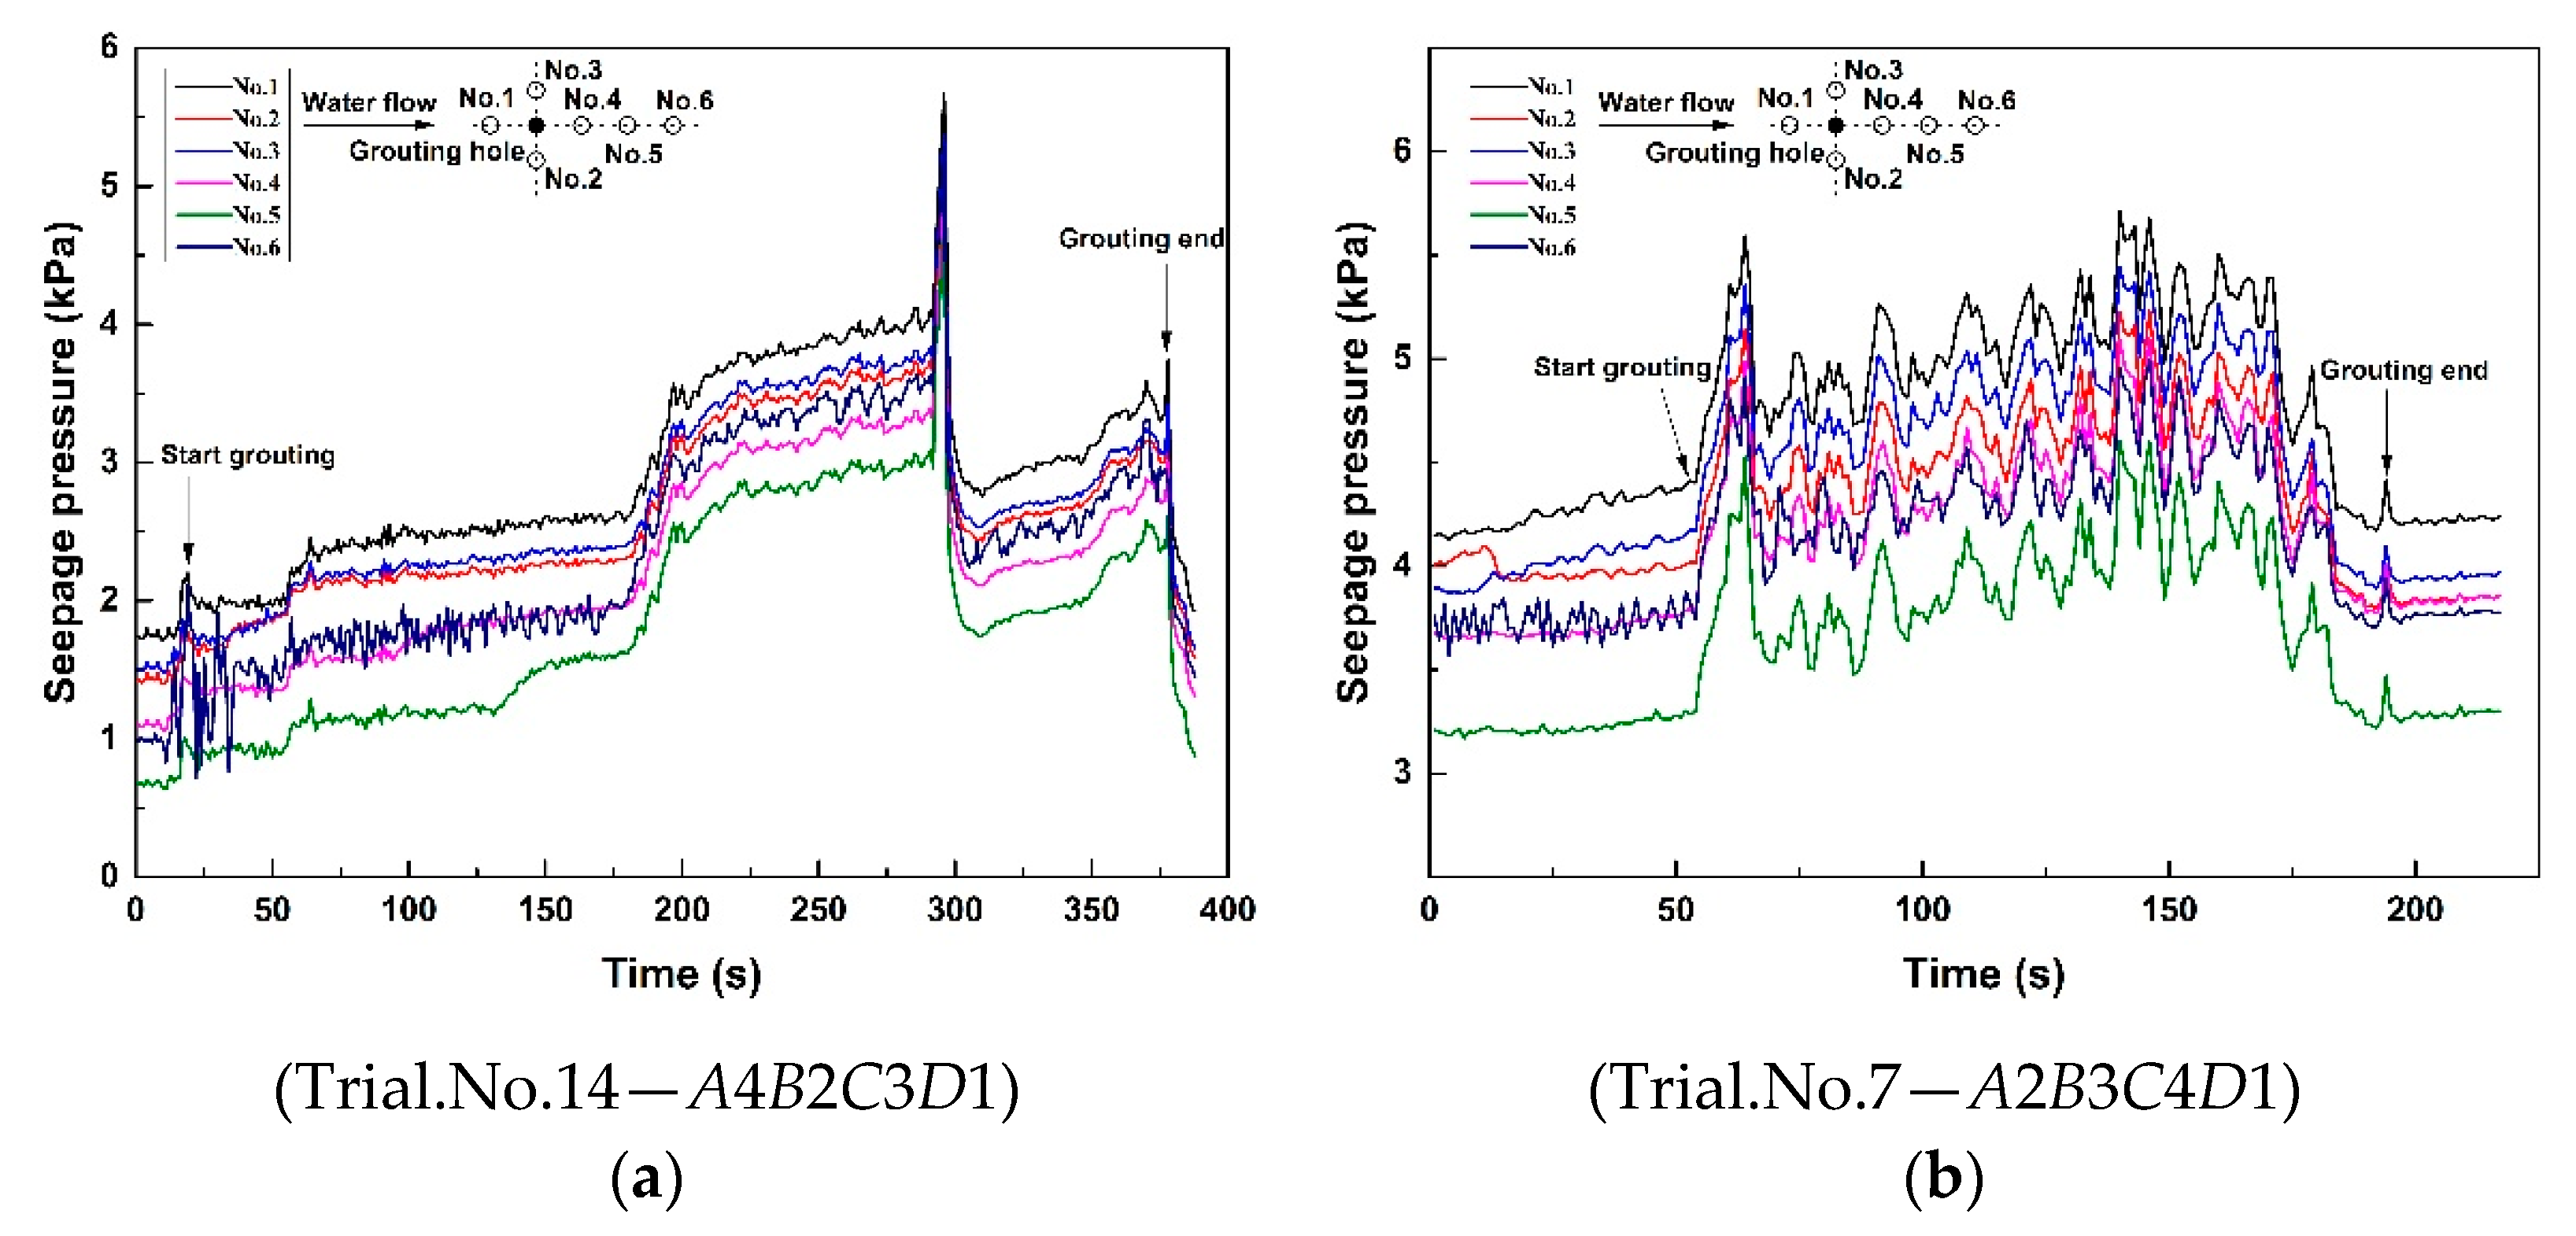
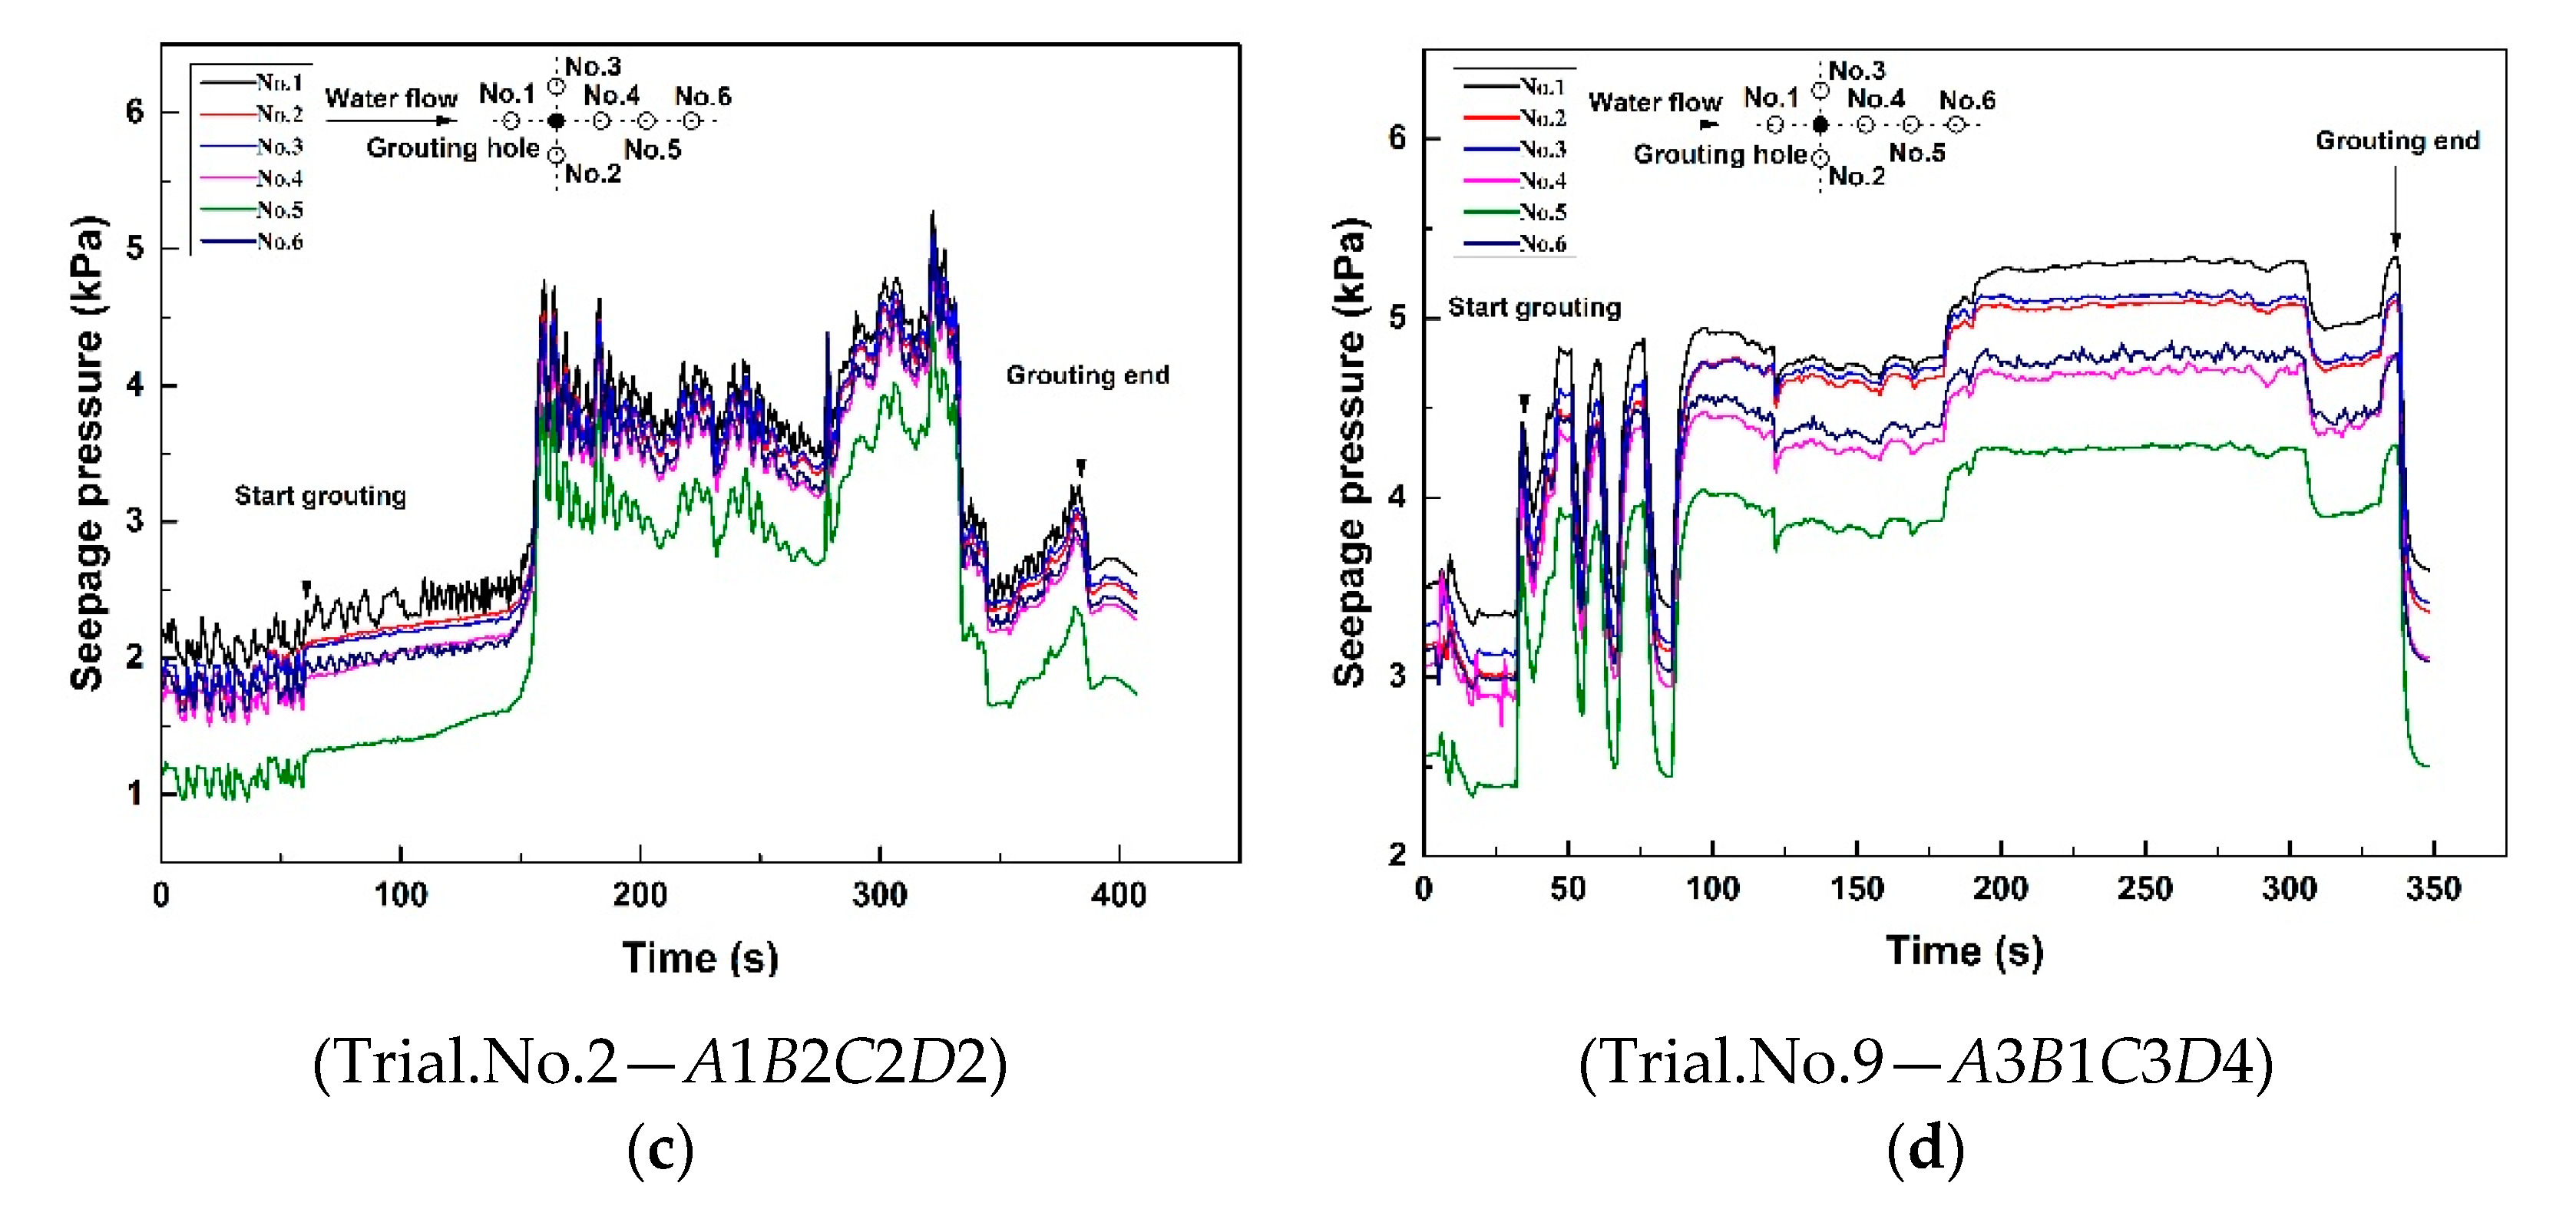
3.2. Analysis of the Grouting Seepage Pressure in the Rough Fracture
A series of curves was acquired on the basis of the data from the pressure sensors in the orthogonal experiment. The curves of seepage pressure had good regularity, the seepage pressure change curve in the orthogonal experiment on grouting in a rough fracture with flowing water were divided into “single peak types”, “multi-peak types”, and “platform types”. The change curves of seepage pressure were divided into three types, which are shown in
Figure 9.
(1) “Single peak type” change curve of seepage pressure
The basic characteristics of the “single peak type” are shown in
Figure 9a. By regulating the velocity of the flowing water to the level of the test, the model of the simulated rough fracture became full of water. After starting grouting, the grout diffused to the measuring point during the prophase of grouting, and the seepage pressure had little change in this process. The grouting pressure increased with the consolidation of grout, and the seepage pressure reached the peak value while the grout filled the whole fracture. Then, the seepage pressure began to decrease after the grouting ended.
(2) “Multi-peak type” change curve of seepage pressure
The seepage pressure field of trials No.2, No.6, No.7, and No.13 in the orthogonal experiment belonged to the “multi-peak type” change curve of seepage pressure. Representatives of the “multi-peak type” are shown in
Figure 9b,c. The basic features of the “multi-peak type” were as follows: The grout was diffused under grouting pressure and flowing water. The seepage pressure increased to the peak value as time went by, and the fracture began to be blocked by the grout at the same time. Then, the seepage fracture declined since the grout had not been condensed completely, and this was washed away by flowing water. Afterwards, this process repeated until the grout plugged up the fracture completely, and this led to a multi peak value.
(3) “Platform type” of the seepage pressure change curve.
There were five groups with the “platform type” change curve of seepage pressure in the orthogonal experiment: Trials No.4, No.8, No.9, No.15, and No.16. A typical “platform type” change curve of the seepage pressure is shown in
Figure 9d. The seepage pressure increased to the first peak value in early grouting. Then, the value had little change for a period of time. The reason for this phenomenon was that the grout did not spread to the whole fracture. Chemical grout spread to each measurement point first. After that, the grout diffused to the boundary of the fracture and the seepage pressure showed little change in the meantime. After the grout spread to the boundary, the passage of water was blocked which caused the seepage pressure to rise. With the end of grouting, the value of seepage pressure started to fall.
3.3. Analysis of the Change in the Water Flow Rate during the Grouting
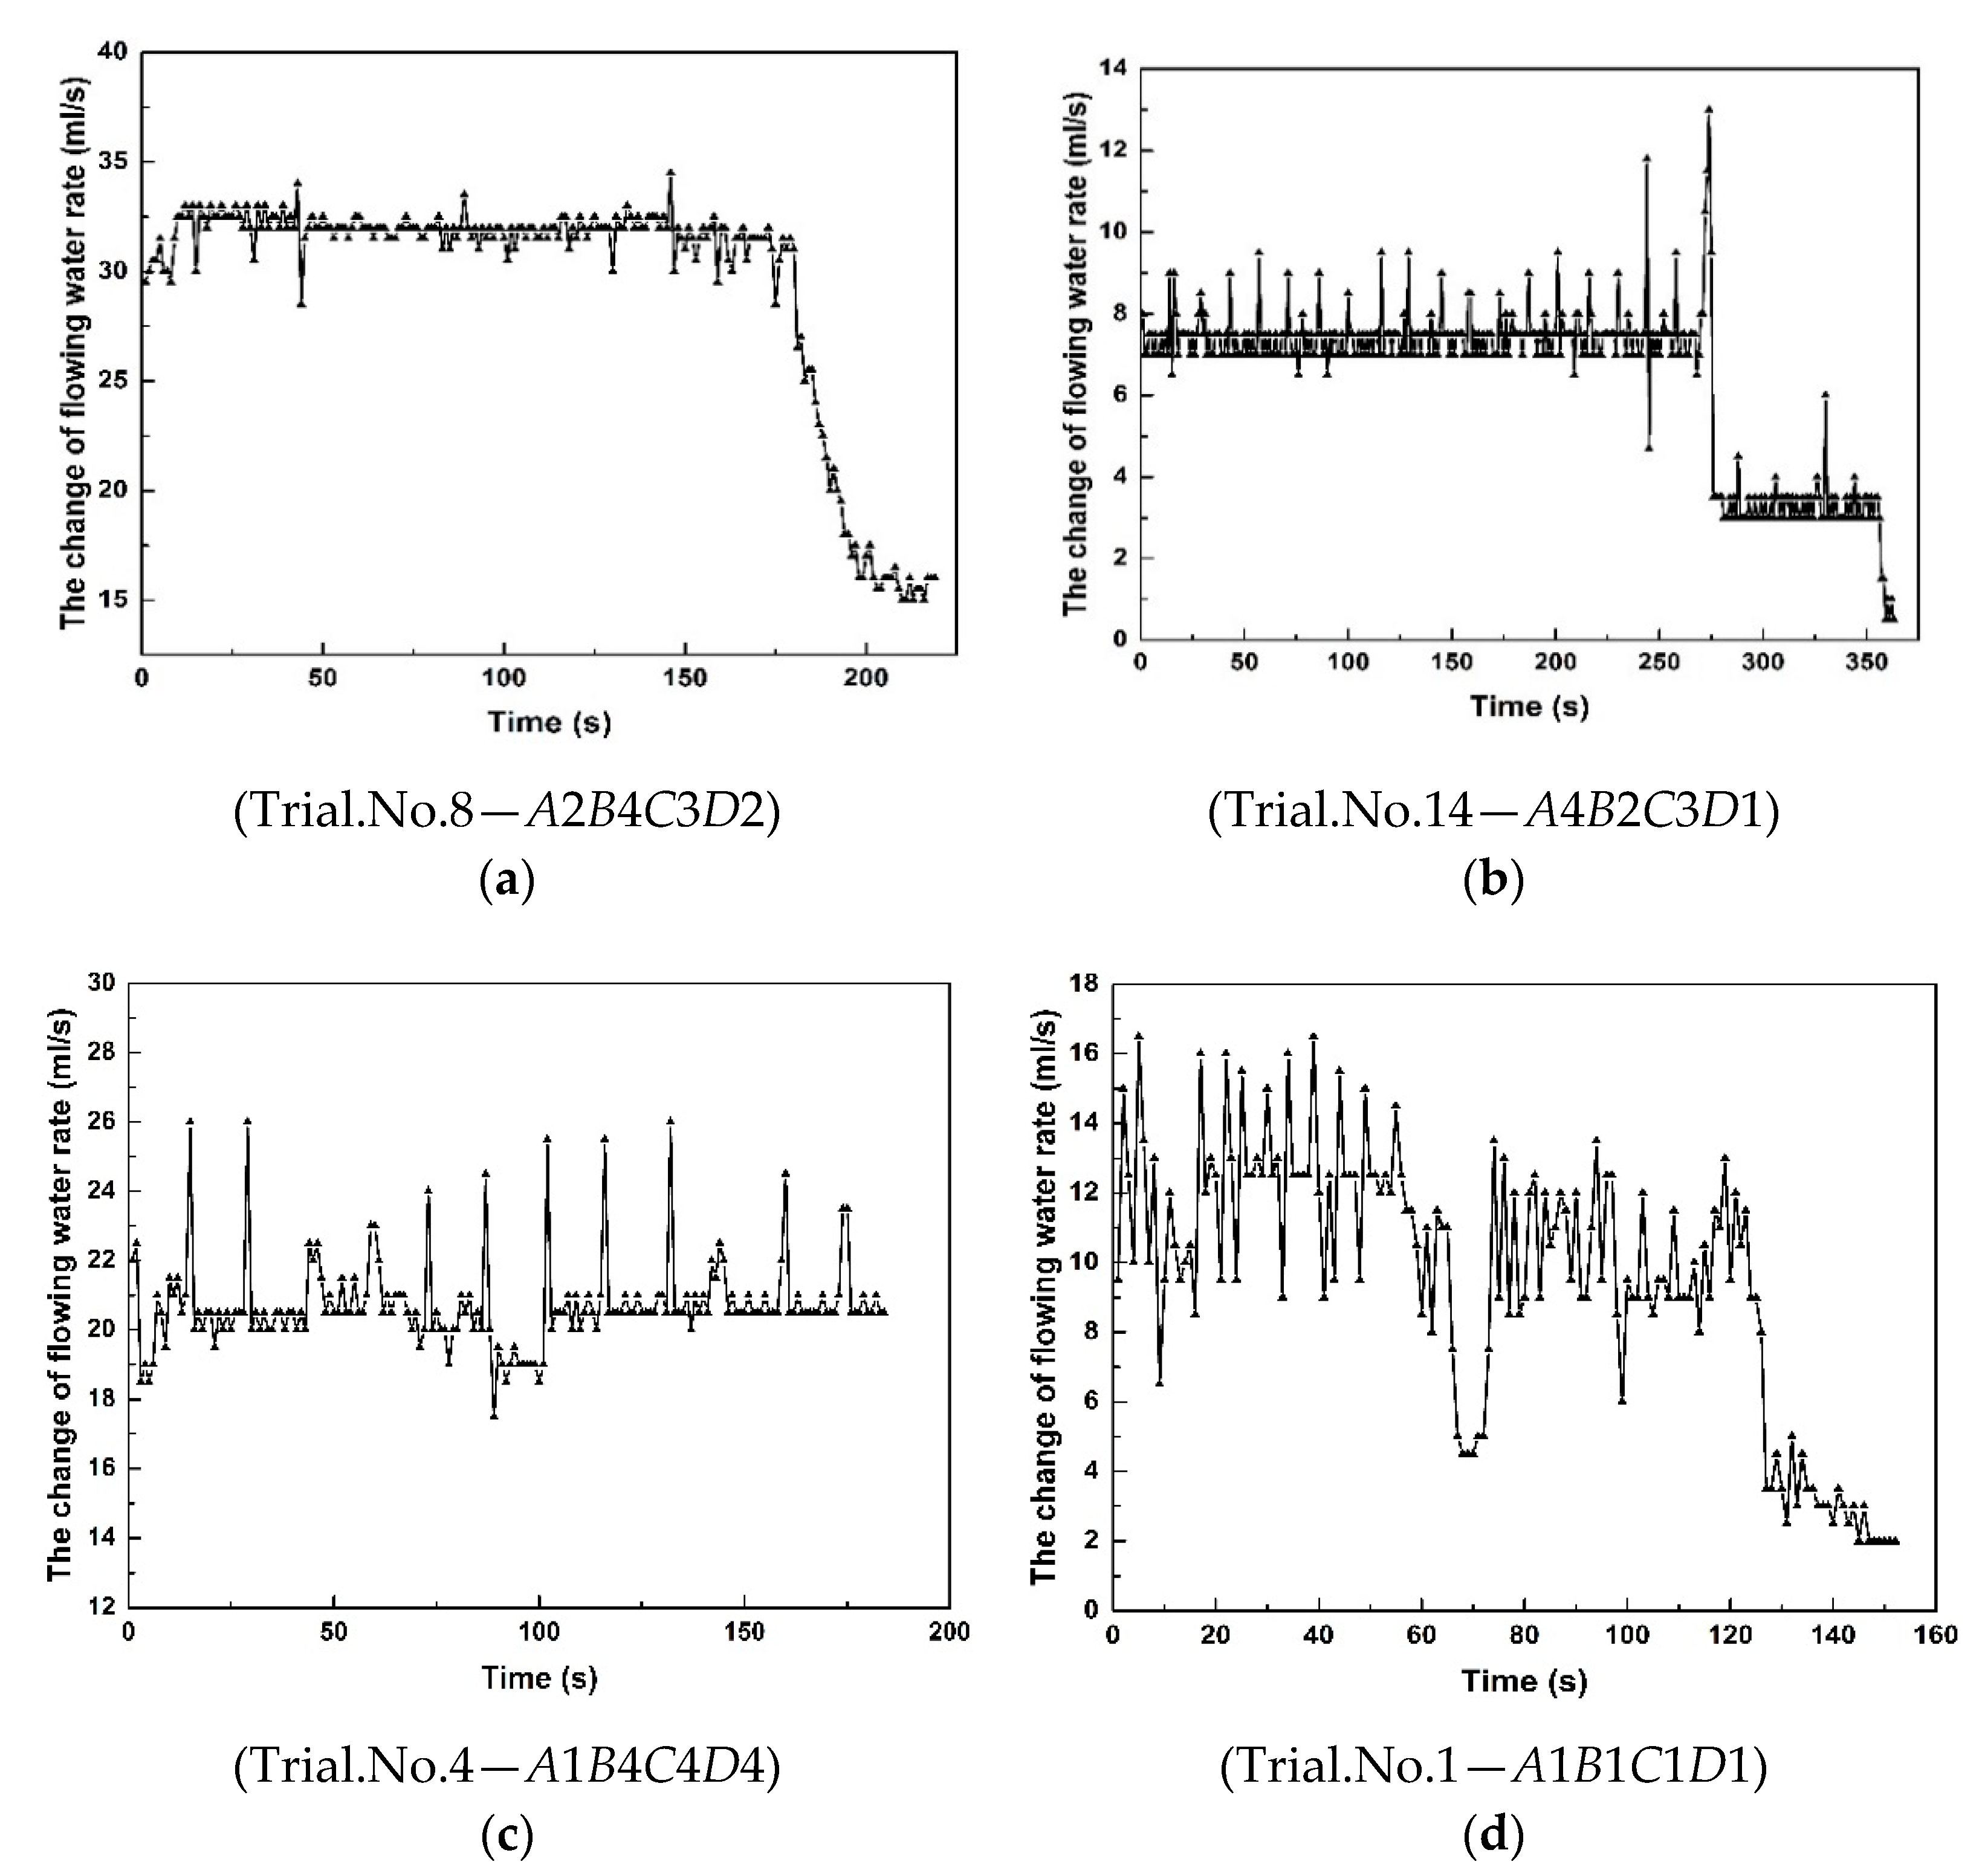
Grout and water flowed out through the outlet to the weighing platform during the grouting and flowing water rate changed constantly. The change in the water flow rate was monitored at all times by using a camera. The flow change was expressed by the variation in the platform scale number. The change curve of the flowing water rate in the orthogonal experiment can be divided into three categories: “Single platform decreasing type”, “double platform decreasing type”, and “multi-peak fluctuating type”. The change curve of the flowing water is shown in
Figure 10.
(1) “Single platform decreasing type” change curve of the water flow rate
The single platform decreasing type was split into three stages, as shown in
Figure 10a. The first stage was the initial rising stage, which indicated the start of grouting. The flow rate rose to the peak value as the grout began to enter the fracture. The reason for this is that the grout washed the original water in the fracture away and caused the water flow rate to reach its peak value. The second stage was the stable platform stage. As grouting continued, chemical grout was injected into the fracture constantly, and the common movement of two kinds of fluid with chemical grout and flowing water was maintained. The flow of water at the end of the fracture was kept steady. In the third stage, the flow declined rapidly and eventually became steady. The chemical grout gradually spread to the edge of the fracture until it filled the fracture and caused concretion. An effective barrier to flowing water flow was realized, which caused the flow to decline and become steady.
(2) “Double platform decreasing type” change curve of the water flow rate
The “double platform decreasing type” change curve of the water flow rate is shown in
Figure 10b. It can be divided into three stages. In the first stage, from 0 to 275 s, the grout diffused slowly because of the large fluctuation (
JRC of 18–20). The grout primarily spread into the grooves and had little effect on the water flow rate. After the grout had filled the grooves in the direction of the
Y axis, the grout spread all the around and the water flow rate declined rapidly. In the second stage, from 275 to 350 s, the chemical grout was injected into the fracture and a stable grouting stage formed. After 350 s, the water flow rate reduced obviously while the grout filled the fracture. The final change in the water flow rate was close to 0 and a good water plugging efficiency was achieved.
(3) “Multi-peak fluctuating type” change curve of the water flow rate
The “multi peak fluctuating type” change curve with flowing water is shown in
Figure 10c,d.
Figure 10c shows a type of water plugging failure. The initial water flow rate is maximum when
JR C= 2–4, where the surface of the rough fracture is near the horizontal. The grout was taken away under the flowing water, and the blocking channel did not form. Thus, the grouting effect failed completely. Another situation of the multi peak fluctuating type is shown in
Figure 10d, with the first phase from 0 to 67 s. There are many peak values owing to the large changes in the water flow. Chemical grout was injected into the fracture and the balance of the single flowing fluid was broken. From 67 to 73 s, temporary plugging formed, and the grout that had not completely solidified was washed away under the conditions of flowing water. The water flow fluctuated repeatedly with the continuous grouting. At 125 s, the water gushing channel was blocked by chemical grout, and the water flow showed an effective decline.
3.4. Sealing Effect
The whole process of water flow change was detected during the simulated rough fracture grouting. The sealing effect can be used as the evaluation criterion of grouting plugging. After the grouting finished and stabilized, the ratio of the reduction of water flow to the initial water flow was defined as the water sealing effect (
SE). The formula of
SE was put forward by Eriksson [
23], as follows:
where
is the initial water flow before grouting and
is the water flow after grouting.
A classification system for the grouting effect was proposed by Sui [
12], as shown in
Table 3.
Table 4 showed the results of the orthogonal test of chemical grouting in a rough fracture with flowing water. Trial number 14 which had a
JRC of 18–20, an initial water flow speed of 0.8 cm/s, a gel time of 60.2 s, and a fracture opening of 2 mm, had the largest water plugging rate and the best plugging effect. Trial number 4 which had a
JRC of 2–4, an initial water flow speed of 1.6 cm/s, a gel time of 83.6 s, and a fracture opening of 5 mm, had the smallest water plugging rate and the worst plugging effect. The value of sealing effect ranged from 6.82% to 93.75% across the whole test.
Table 5 lists the range of influences on the sealing effect for different variables,
SEi (
i = 1, 2, 3, 4) indicates the average values for factors with the same level. The factors and levels used in the experimental are shown in
Table 1.
SE1 represents the average value of sealing effect with the first level of each factor.
SE2 represents that the average value of sealing effect with the second level of each factor. For example, when
JRC = 2–4 was the first level of fracture roughness, the
SE1 of the fracture roughness was obtained by calculating the average of trials 1, 2, 3 and 4, as shown in
Table 5. The value of 0.4 cm/s was the first level of the initial water flow speed, so the
SE1 of the initial water flow speed was obtained by calculating the average of trial 1, 5, 9, and 13 as shown in
Table 5. The difference between the maximum and minimum values of diverse levels with same factors was regarded as an important indicator to reflect the date fluctuation. The larger the range of values was, the greater influence of water plugging rate was. The relationship of various factors from
Table 5 was in the order
RA >
RD >
RB >
RC, and the factors of affecting grouting plugging were followed by
A,
D,
B, and then
C.
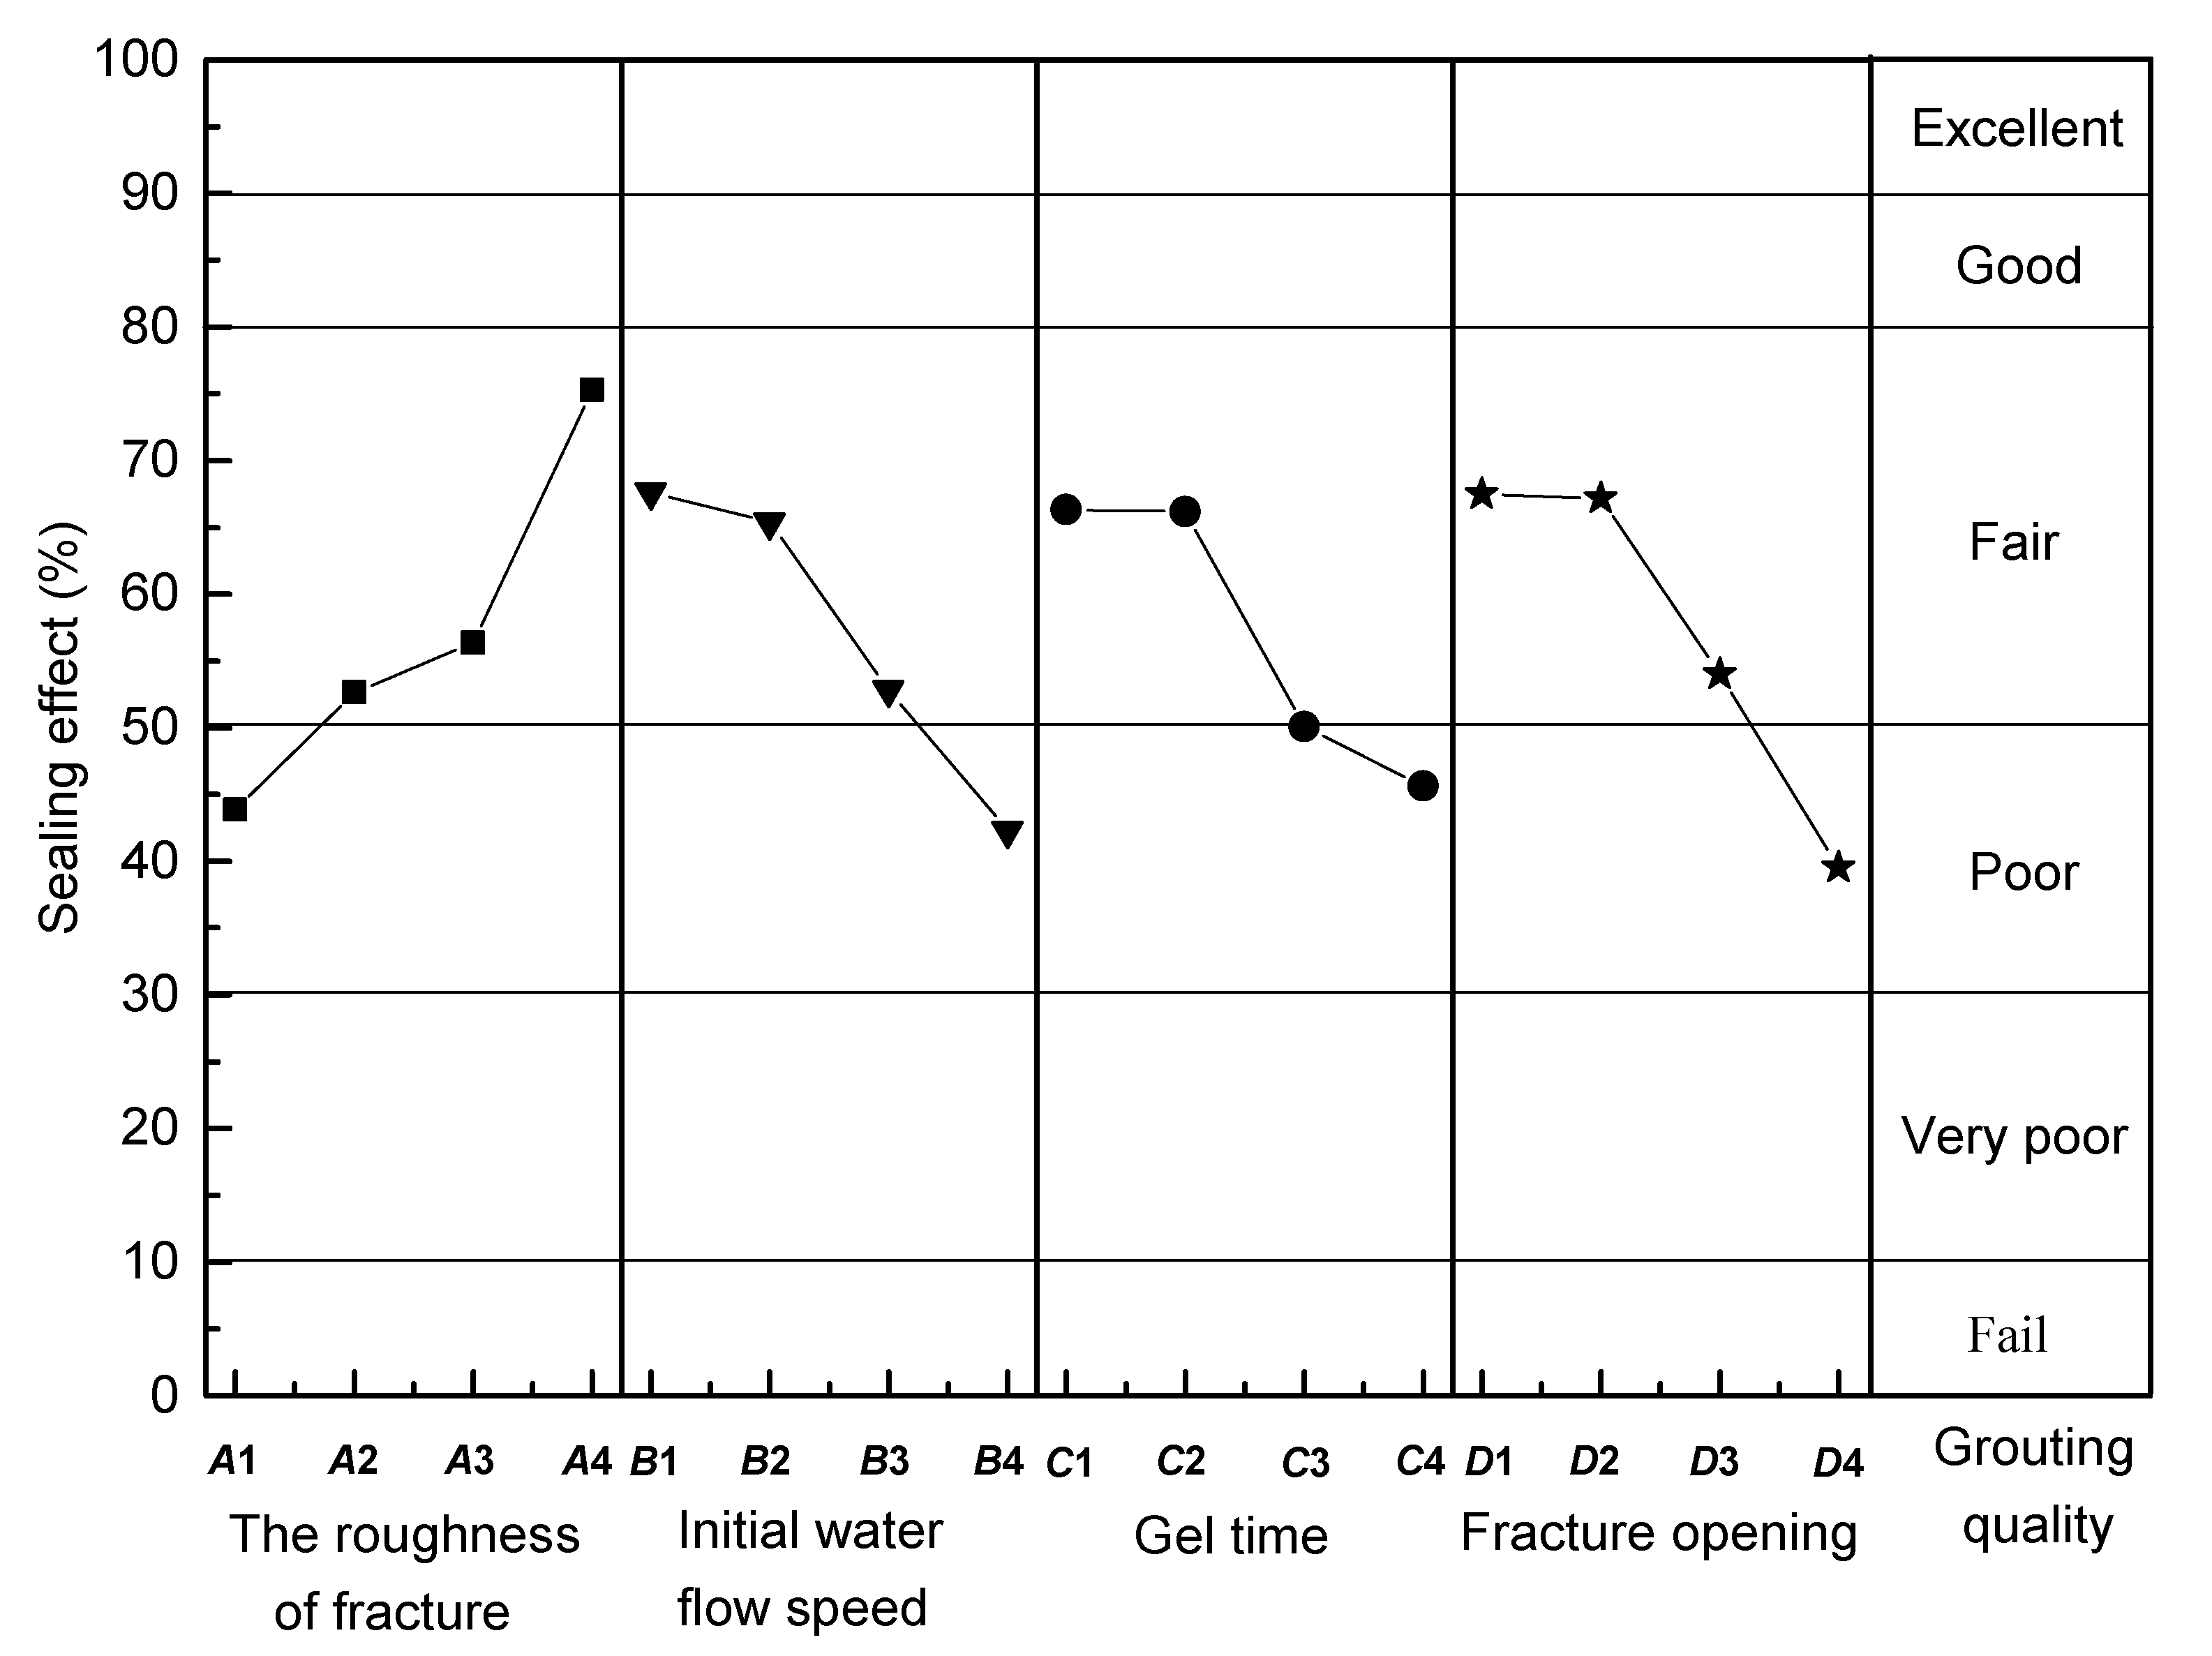
A visual analysis chart was drawn according to the
Table 5. Four factors showed a good correlation with the sealing effect. The sealing effect increased as the fracture roughness increased, while the sealing effect decreased as the initial water flow speed, gel time, and fracture opening increased. The best orthogonal results are shown in
Figure 11, where a
JRC of 18–20 is shown to be the best level of fracture roughness, the velocity of 0.4 cm/s is the best initial water flow speed, 36.5 s is the best gel time and 2 mm is the best fracture opening. Therefore, the best combination of test levels is
A4
B1
C1
D1 in theory. The best combination of test levels was shown to be
A4
B2
C3
D1 in the orthogonal test. Therefore,
A4
B1
C1
D1 was test under in the same experimental conditions, and the sealing effect reached 100%. The sealing effect was better than that of
A4
B2
C3
D1, which verified the correctness of orthogonal experiment. The worst combination of test levels in the test was
A1
B4
C4
D4, which is in agreement with the theory. These results confirm the accuracy of the test results.
4. Discussion and Limitations
Previous studied on grouting were based on the simulated single plate device. The experimental device used in this paper realized the visualization of the grouting process, and allowed the value of grout diffusion to be observed. The rock fracture in Bardon’s standard roughness coefficient curves were used as a simulation model, as rough fractures are more similar to real fractures. The sealing effect of grouting in orthogonal experiments was acquired by monitoring the changes in the initial water flow rate, and the sequence of the influential factors in the sealing effect was obtained to provide the basis for choosing factors during actual grouting engineering. However, the scale model of the experiment was simplified and idealized and only four factors that affect the sealing effect were considered. In further studies, experiments on grouting in rough fracture networks with flowing water should be carried out, and 3D printing technology could be used to simulate rock masses. Moreover, an experimental scheme should be combined with an actual engineering process.
5. Conclusions
In this paper, a set of chemical grouting tests were carried out to simulate rough fractures using Bardon’s standard roughness curves. The fracture roughness, initial water flow speed, gel time, and fracture opening were selected as the factors for the orthogonal test. The changes in seepage pressure, grout diffusion, and water flow were monitored in real time during the grouting process. The optimal combination of grouting plugging was determined according to the analysis of the sealing effect of each test. The main achievements and conclusions are as follows:
(1) The factors affecting the grouting effect in the chemical grouting experiment of a rough fracture with flowing water were as follows: The fracture roughness, initial water flow speed, fracture opening, and gel time. The optimal combination of levels in the orthogonal test is A4B1C1D1. The fracture joint roughness coefficient was shown to have the greatest influence on the grouting effect.
(2) The grout diffusion pattern of grout is related to the fracture roughness. The smaller the value of JRC is, the easier the grout diffusion is. The larger the initial water flow speed is, the less complete the grout shape is.
(3) The seepage pressure change curves of grouting plugging tests with the fracture roughness coefficient can be divided into three types: Single peak type, multi-peak type, and platform type.
(4) The curves of the water flow across the rough fracture can be divided into three categories: Single platform decreasing type, double platform decreasing type, and multi-peak type.
Author Contributions
Conceptualization, W.S., J.X. and L.J.; data curation, L.J.; formal analysis, L.J. and J.X.; investigation, L.J.; methodology, J.X., W.S., and L.J.; validation, L.J. and J.X.; writing—original draft, L.J.; writing—review and editing, W.S. and L.J.
Acknowledgments
The authors thank the support of the National Key R & D Project under Grant No. 2017YFC1501303 and the National Natural Science Foundation of China under Grant No.-41472268.
Conflicts of Interest
The authors declare no conflict of interest.
References
- Zhang, J. Investigations of water inrushes from aquifers under coal seams. Int. J. Rock Mech. Min. Sci. 2005, 42, 350–360. [Google Scholar] [CrossRef]
- Yang, P.; Li, T.; Song, L.; Deng, T.; Xue, S. Effect of different factors on propagation of carbon fiber composite cement grout in a fracture with flowing water. Constr. Build. Mater. 2016, 121, 501–506. [Google Scholar] [CrossRef]
- Mao, D.; Lu, M.; Zhao, Z.; Ng, M. Effects of water related factors on pre-grouting in hard rock tunneling. Procedia Eng. 2016, 165, 300–307. [Google Scholar] [CrossRef]
- Mohammed, M.H.; Pusch, R.; Knutsson, S. Study of cement-grout penetration into fractures under static and oscillatory conditions. Tunn. Undergr. Space Technol. 2015, 45, 10–19. [Google Scholar] [CrossRef]
- Funehag, J.; Fransson, A. Sealing narrow fractures with a Newtonian fluid model prediction for grouting verified by field study. Tunn. Undergr. Space Technol. 2006, 21, 492–498. [Google Scholar] [CrossRef]
- Yang, M.; Yue, Z.; Lee, P.K.; Su, B.; Tham, L.G. Prediction of grout penetration in fractured rocks by numerical simulation. Can. Geotech. J. 2011, 39, 1384–1394. [Google Scholar] [CrossRef]
- Li, S.; Zhang, X.; Zhang, Q.; Sun, K.; Xu, Y.; Zhang, W.; Li, H.; Liu, R.; Li, P. Research on mechanism of grout diffusion of dynamic grouting and plugging method in water inrush of underground engineering. Chin. J. Rock Mech. Eng. 2011, 30, 2377–2396. [Google Scholar]
- Zhang, G.; Zhan, K.; Gao, Y.; Wang, W. Comparative experimental investigation of chemical grouting into a fracture with flowing and static water. Min. Sci. Technol. 2011, 21, 201–205. [Google Scholar]
- Salimian, M.H.; Baghbanan, A.; Hashemolhosseini, H.; Dehghanipoodeh, M.; Norouzi, S. Effect of grouting on shear behavior of rock joint. Int. J. Rock Mech. Min. Sci. 2017, 98, 159–166. [Google Scholar] [CrossRef]
- Kikuchi, K.; Igari, T.; Mito, Y.; Utsuki, S. In situ experimental studies on improvement of rock massed by grouting treatment. Int. J. Rock Mech. Min. Sci. 1997, 34, 138. [Google Scholar] [CrossRef]
- Wang, D.; Sui, W. Grout diffusion characteristics during chemical grouting in a deep water-bearing sand layer. Int. J. Min. Sci. Technol. 2012, 22, 589–593. [Google Scholar] [CrossRef]
- Sui, W.; Liu, J.; Hu, W.; Qi, J.; Zhan, K. Experimental investigation on sealing efficiency of chemical grouting in rock fracture with flowing water. Tunn. Undergr. Space Technol. 2015, 50, 239–249. [Google Scholar] [CrossRef]
- Liang, Y.; Sui, W.; Qi, J. Experimental investigation on chemical grouting of inclined fracture to control sand and water flow. Tunn. Undergr. Space Technol. 2019, 83, 82–90. [Google Scholar] [CrossRef]
- Rafi, J.Y.; Stille, H. Control of rock jacking considering spread of grout and grouting pressure. Tunn. Undergr. Space Technol. 2014, 40, 1–15. [Google Scholar] [CrossRef]
- Bardon, N. Review of a new shear-strength criterion for rock joints. Eng. Geol. 1973, 7, 287–332. [Google Scholar] [CrossRef]
- Bardon, N.; Choubey, V. The shear strength of rock joints in theory and practice. Rock Mech. 1977, 10, 1–54. [Google Scholar] [CrossRef]
- Lavrov, A. Redirection and channelization of power-law fluid flow in a rough-walled fracture. Chem. Eng. Sci. 2013, 99, 81–88. [Google Scholar] [CrossRef]
- Meheust, Y.; Schmittbuhl, J. Geometrical heterogeneities and permeability anisotropy of rough fractures. J. Geophys. Res. 2001, 106, 2089–2102. [Google Scholar] [CrossRef]
- Sces, L.; Gattinoni, P. Roughness control on hydraulic conductivity in fractured rocks. Hydrogeol. J. 2007, 15, 201–211. [Google Scholar] [CrossRef]
- Wu, Y. Engineering Fluid Mechanics; China Architecture & Building Press: Beijing, China, 2006. [Google Scholar]
- Zhang, J. Fluid Dynamics; China University of Mining and Technology Press: Jiangsu, China, 2001. [Google Scholar]
- Zheng, C. Simulation Research of Grouting in Fractured Rock Mass. Ph.D. Thesis, Central South University, Changsha, China, 1999. [Google Scholar]
- Eriksson, M. Prediction of Grout Spread and Sealing Effect: A Probabilistic Approach. Ph.D. Thesis, Royal Institute of Technology, Stockholm, Sweden, 2002. [Google Scholar]
© 2019 by the authors. Licensee MDPI, Basel, Switzerland. This article is an open access article distributed under the terms and conditions of the Creative Commons Attribution (CC BY) license (http://creativecommons.org/licenses/by/4.0/).


