Article

Optimization of Accelerator Mixing Ratio for EPDM Rubber Grommet to Improve Mountability Using Mixture Design

1
Industrial Technology Research Institute, Kongju National University, Kongju 31080, Korea
2
Company-affiliated R&D center/New Business Manager, DAESUNG HI-TECH Co., Ltd., Cheonan 31025, Korea
3
Department of Mechanical Engineering, Industrial Technology Research Institute, Kongju National University, Kongju 31080, Korea
*
Author to whom correspondence should be addressed.
Appl. Sci. 2019, 9(13), 2640; https://doi.org/10.3390/app9132640
Submission received: 26 April 2019 / Revised: 19 June 2019 / Accepted: 25 June 2019 / Published: 29 June 2019
(This article belongs to the Section Mechanical Engineering)

Abstract

:
A grommet, made of ethylene propylene diene methylene (EPDM) rubber, is an integral part used for fixing and protecting the wire inserted from the outside to the inside of vehicles. Rubber compounds exhibit various mechanical properties and vulcanization characteristics depending on the accelerator mixing ratio. These mechanical properties affect the insertion and detachment forces when the grommet is manufactured and fixed to the vehicle body. In this study, we experimentally analyzed the changes in the properties of EPDM rubber depending on the vulcanization accelerator to improve the mounting performance of the grommet, and subsequently derived the optimum accelerator mixing ratio. We implemented a mixture design strategy to derive the optimum mixing ratio for obtaining the desired mechanical properties and vulcanization characteristics. The insertion and separation forces of the existing grommet were compared with those of the grommet fabricated using the derived mixing ratio and we found that the mounting performance was improved compared to the existing grommet.

1. Introduction

The last few decades have seen the development of a wide variety of elastomers (rubber materials) for application to diverse fields. Fluororubber (a fluorocarbon elastomer), a special type of elastomer with excellent thermal and chemical resistance, is used in packing missiles and rockets. Silicones are used as materials for medical devices and electrical insulation owing to their non-toxic, weather-resistant, heat-resistant, and cold-resistant properties [1,2,3]. Ethylene propylene diene methylene (EPDM) rubber exhibits excellent ozone resistance but poor oil resistance, and it cannot be used in applications wherein it comes into contact with oil [4,5]. A grommet is one of many products made using EPDM rubber, and it is one of the main parts of automobiles that fixes and protects the wire harness from the outside to the inside of the vehicle [6]. A grommet is manufactured via injection molding of EPDM rubber, and the mounting force is changed according to the mechanical properties of EPDM [7,8]. The mounting force can be divided into the insertion force generated when the grommet is mounted on the car panel and the detachment force generated when the grommet is released. In the automobile industry, the insertion force is set to 98 N or less for ease of operation and efficiency, and the release force is set to 69 N or more to prevent the grommet from getting displaced. Various studies on grommets are underway. Kim et al. reported that the mounting force was changed according to the grommet shape, and derived the shape of the grommet required to improve the mounting performance [9]. Hans et al. reported that nonlinear material constants were derived from the nonlinear material properties of the grommet, and nonlinear analysis was carried out to analyze the behavior [10]. In this study, the effect of the vulcanization accelerator on the EPDM was investigated and a grommet was manufactured to compare the insertion and detachment forces.
Here, we remark that the mechanical properties of rubber are considerably influenced by the choice of the vulcanization accelerator, and the vulcanization characteristics vary widely depending on the type and mixing ratio of the accelerator [11]. Moreover, natural rubber and synthetic rubber exhibit different reactions to the same accelerator, which may act as an ultra-rapid accelerator for the former and a retardant for the latter [12,13]. While several studies have been carried out to examine the properties and effects of general accelerators [14], very few studies have focused on deriving or estimating the optimum accelerator mixing ratio via efficient and systematic experiments for realizing desirable, application-specific mechanical properties of rubbers [15,16].
In our study, the blending ratio of the EPDM and the vulcanization accelerator was optimized to improve the mounting ability of the grommet. We experimentally analyzed the changes in the properties of the EPDM rubber depending on the vulcanization accelerator and derived the optimum mixing ratio. Using the mixture design strategy, we derived the optimum accelerator mixing ratio. Experiments were conducted to validate the formulation derived from the mixture design strategy [17,18,19,20]. The grommet was manufactured based on the derived blending ratio and the mounting performance was improved compared to the existing grommet.

2. Experimental Procedures

2.1. Test Specimen Preparation

In this experiment, we used carbon master batch (CMB) (Kumho Polychem., Seoul, Korea), S (sulfur) (specific gravity = 1.53) and accelerators. CMB was prepared by compounding EPDM KEP960N (F) (Mooney viscosity = ML (1 + 8) of 49 at 125 °C, ENB (ethylidene norbornene) content = 5.7 wt%, ethylene content = 70 wt%, extender oil = 50 PHR) (Kumho Polychem., Seoul, Korea) with zinc oxide, carbon black, distillates (petroleum), and hydrotreated heavy paraffinic (Nexen corp, Siheung, Korea) in different proportions. We used the following five different accelerators: the thiazole-based accelerators MBT (2-mercaptobenzothiazole) (specific gravity = 1.25) and DM (dibenzothiazyl disulfide) (specific gravity = 1.26); the guanidine-based accelerator DPG (diphenylguanidine); the thiuram-based accelerator TRA (dipentamethylenethiuram tetrasulfide) (specific gravity = 1.22); and the dithiocarbamate-based accelerator BZ (zinc di-n-butyl dithiocarbamate) (specific gravity = 1.07). Among the accelerators used in this experiment, DPG was obtained from Gteen Chemtech Co. Ltd., Seoul, Korea and the remaining accelerators and sulfur were supplied by Wooshin Chemical Co. Ltd., Pyeongtaek, Korea. Given the sensitivity of raw rubber to temperature, we carried out our specimen preparation and experiments in a constant environment (temperature: 25 ± 5 °C; humidity ≤60%). The raw rubber was left for 24 h after kneading and vulcanizing, and acclimatized to the lab temperature for over 1 h prior to experiments. Roll mixing was performed using a standard-sized roller as per ISO 2393 standards [21] under the following roll mixing conditions: roll diameter = 152.4 mm, roll speed ratio = 1:1.4, and a roll interval of 10 ± 3 mm. Roll mixing of each sample was performed in the following order: rotation of CMB raw rubber for 5 min, addition of accelerator and rotation for another 5 min, gathering of kneaded raw rubber, mixing of the accelerator via triangular folding. To prevent rubber scorching due to friction-induced roller-surface temperature rise, we performed roll mixing in cycles involving 30 min of roll mixing and 10 min of cooling at room temperature while maintaining the roller surface temperature at ≤40 °C.

2.2. Test Method for Mechanical Property Analysis

Specimens for hardness testing were fabricated as a compression molding as per KS M 6518 standards [22] (Ø29 × 12.7 ± 0.13 mm) by vulcanizing the mixed rubber sample at 180 °C for 900 s using a rubber molder. The hardness of the mixed rubber was measured in accordance with the hardness testing procedure based on spring force as per KS M 6518. The experimental environment was maintained constant (temperature: 25 ± 5 °C; humidity ≤60%). After positioning the Shore A hardness tester perpendicular to the lateral part of the specimen, we measured the specimen hardness by applying a load of 1 kg via a lever.
Next, we fabricated dumbbell #3 specimens to measure the tensile strength and elongation of the mixed rubber. To prepare these specimens, we vulcanized square-shaped mixed rubber samples (150 × 150 × 2 mm) at 180 °C for 600 s as specified in ISO 2393, and we cut them into the dumbbell #3 shapes. We measured the tensile strength (MPa) and elongation (%) of each specimen using a universal testing machine. For the calculation of tensile strength and elongation, we measured the maximum load at a testing speed of 500 mm/min, as per KS M 6518. The experiment was performed under the same conditions as before (temperature 25 ± 5 °C and humidity ≤60%).

2.3. Test Method for Analysis of Vulcanization Characteristics

We measured the vulcanization characteristics of EPDM rubber in accordance with KS M 6687 using an oscillating-disc rheometer [23]. Of the various measurement values acquired with the rheometer, we selected T MAX (maximum torque value (Nm)), TC 10 (the point in time (s) when T MIN is 10% of T MAX), and TC 90 (the point in time (s) when T MIN is 90% of T MAX) for the analysis of the vulcanization characteristics. A constant experimental environment was maintained (temperature: 25 ± 5 °C; humidity ≤60%). The mixed rubber sample was cut into a flat square (30 × 30 × 5 ± 1 mm) and positioned at the center of the rheometer. The measurement was performed at 180 °C for 15 min.

3. Experimental Analysis

3.1. Mixture Design

Mixture design is an experimental design strategy for mixing multiple components to create a compound to identify the effect of individual components on the reaction variables and to derive the optimum mixing ratio [24,25,26,27]. Let xi represent the ratio of the n-th component in a compound consisting of q components. These components (n = q) have the following constraints:
x i 0 ,   i = 1 , 2 , q ,
i = 1 a x i = x 1 + x 2 + + x q = 1 .
Among various mixture designs, we used the extreme vertices design considering the lower and upper limits of the components. Extreme vertices designs are mixture designs that cover only a sub-portion or smaller space within the simplex. Designs for these experiments are useful because many product design and development activities in industrial situations involve formulations or mixtures. The presence of both lower and upper bound constraints on the components often creates this condition. The goal of an extreme vertices design is to choose design points that adequately cover the design space [28]. We implemented mixture design using Minitab to identify the optimum mixing ratios of the components: CMB, S, and accelerators.
Based on the mixing ratio of the existing grommet, we configured the seven mixture variables that were considered in the experiment to add up to 1000 g while satisfying the constraints (upper and lower limits) presented in Table 1, with the input amount of each component set at ±20%. We obtained the design matrix of the extreme vertices design, which allows estimation up to the second term of the model. Axial points were added to the extreme vertices design based on the center point, and the seven design points were used to compute 139 mixing ratios. Each measurement was repeated twice to reduce the standard deviation and error.

3.2. Analysis of Characteristics

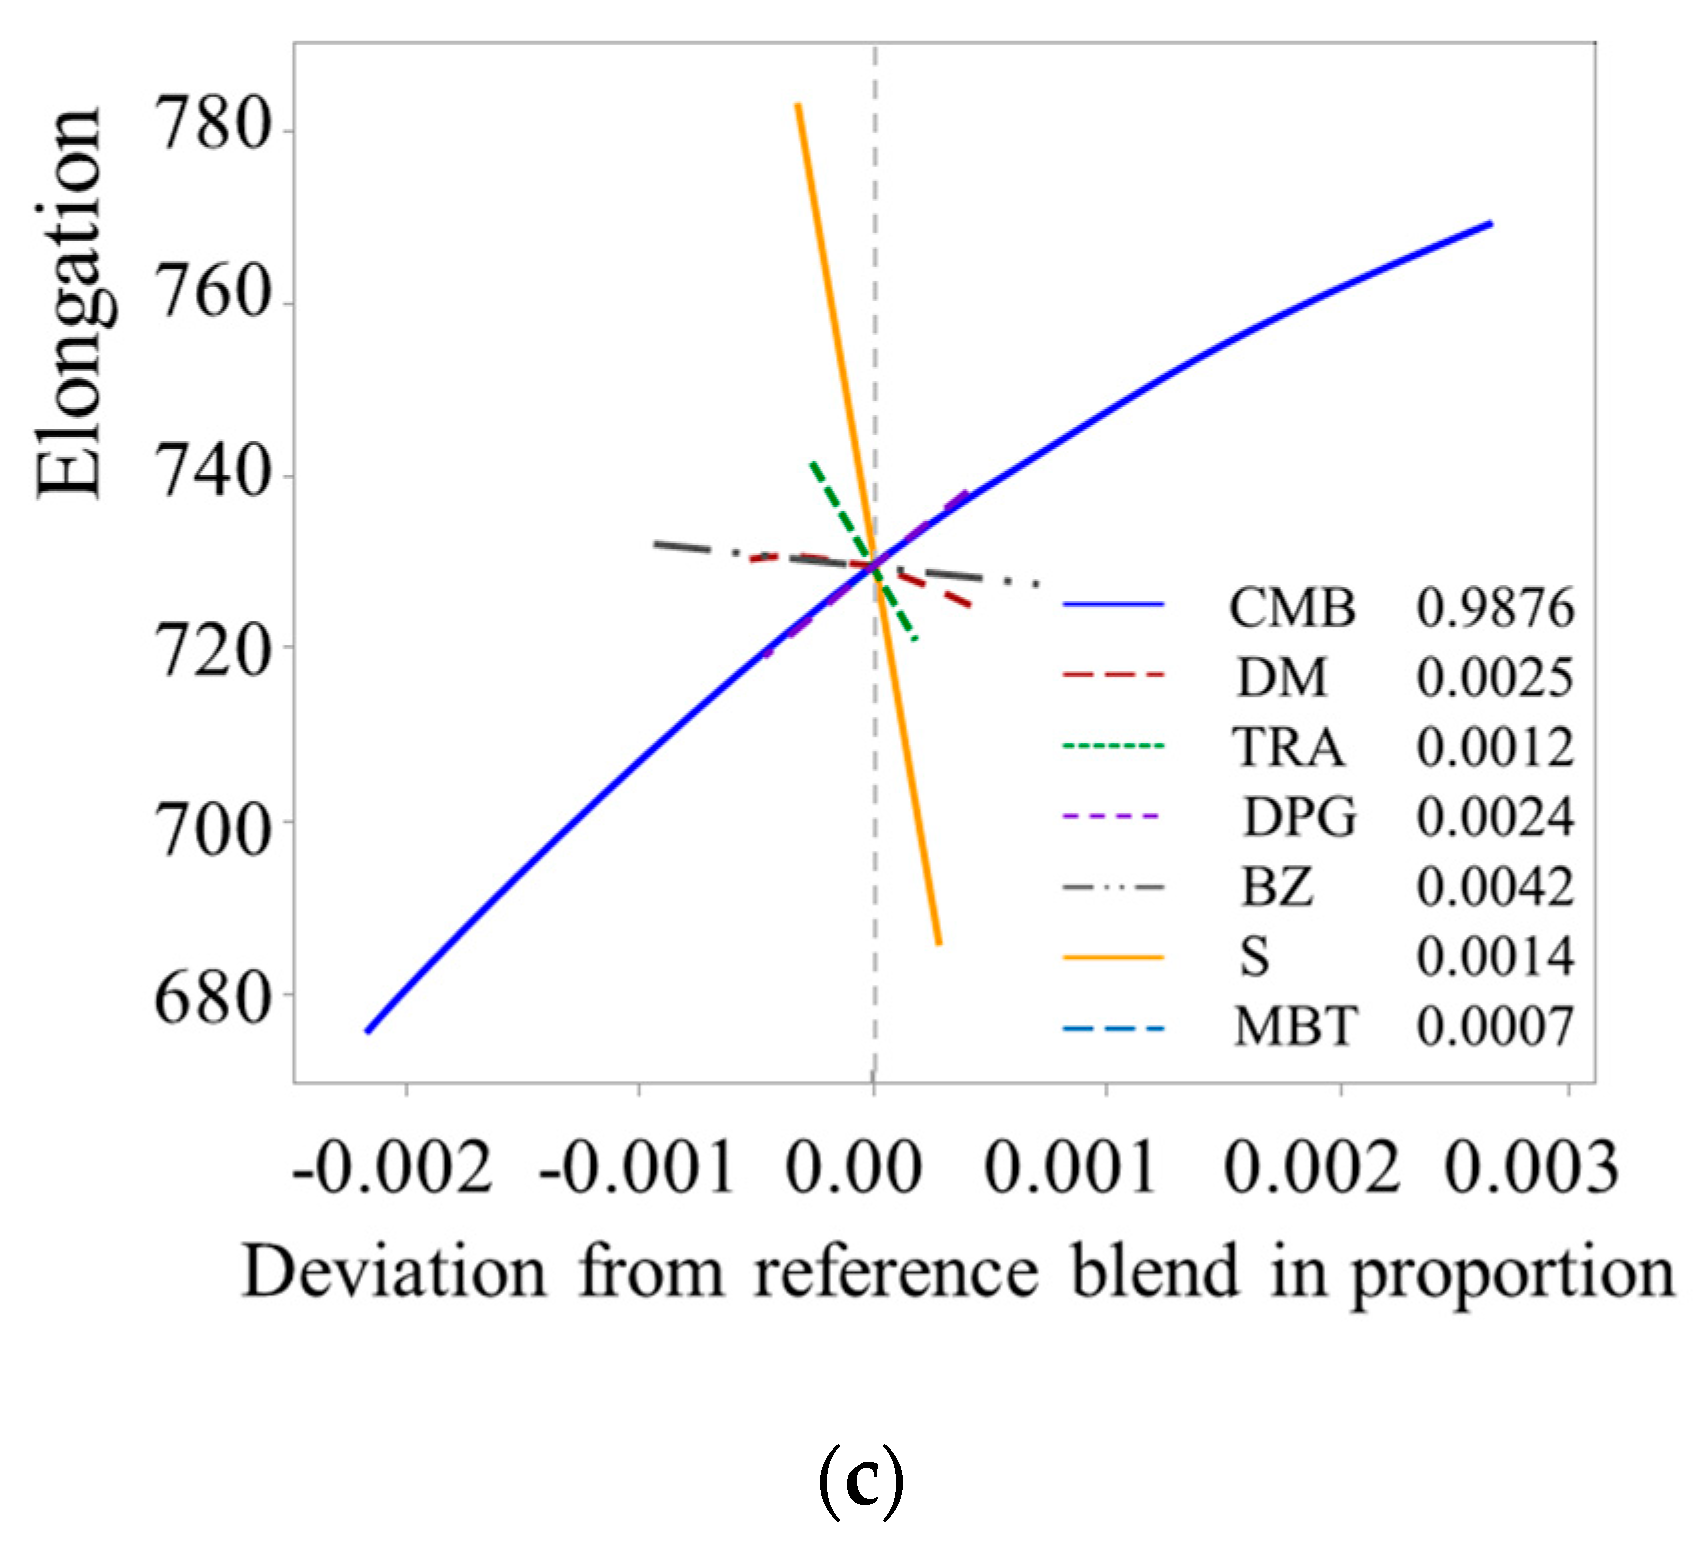
Next, we analyzed the mechanical properties and vulcanization characteristics resulting from the mixture design. Hardness, tensile strength, and elongation were analyzed as the mechanical properties; we analyzed the mixing-ratio-dependent vulcanization characteristics after measuring parameters T MAX, TC 10, and TC 90. The Cox response trace plot was used to analyze the results of the experiments performed based on the mixture design. The trace curves of the Cox response trace plots depict the effect of changing the ratio of the corresponding component along an imaginary line connecting the reference blend to a vertex. These curves are useful in cases where it is difficult to identify the response using contour or surface plots because the compound has four or more components. A short response trace points to a small proportion of the component. Further, the greater the effect of a component, the steeper the slope of the trace. Figure 1 shows the Cox response trace plots representing the mixture-ratio-dependent mechanical properties. Figure 1a depicts hardness as a function of the mixing ratio; we note that S exerts the greatest effect on hardness, followed by the accelerators DPG and TRA. Figure 1b shows the response trace plots for tensile strength, on which S again exerts the greatest influence, followed by TRA. Figure 1c shows the response trace plots for elongation; in this case, S strongly influences elongation, but in an inverse manner, contrary to the cases of hardness and tensile strength.
Figure 2 shows the Cox response trace plots representing the mixture-ratio-dependent vulcanization characteristics. Figure 2a presents T MAX as a function of the mixing ratio; we note that S exerts the greatest effect on T MAX, followed by accelerator TRA. Figure 2b shows the Cox response trace plots for TC 10; in this case, BZ exerts the greatest effect on TC 10, followed by DM. Figure 2c shows the Cox response trace plots corresponding to TC 90, wherein we observe that TC 90 is most influenced by DPG and BZ.

3.3. Mixing Ratio Optimization Setup

In addition to the above experiments, we performed experiments to derive the optimum mixing ratio for satisfying the mechanical properties and vulcanization characteristics based on the experimental results obtained by applying the mixture design strategy. Table 2 lists the target values, upper and lower limits, and weights. These were employed for manufacturing a car grommet. The hardness and tensile strength of the grommet are the factors influencing the insertion force. TC 10 is an important value for scorch management and TC 90 is used for predicting the final curing time and setting the target values given in the table.
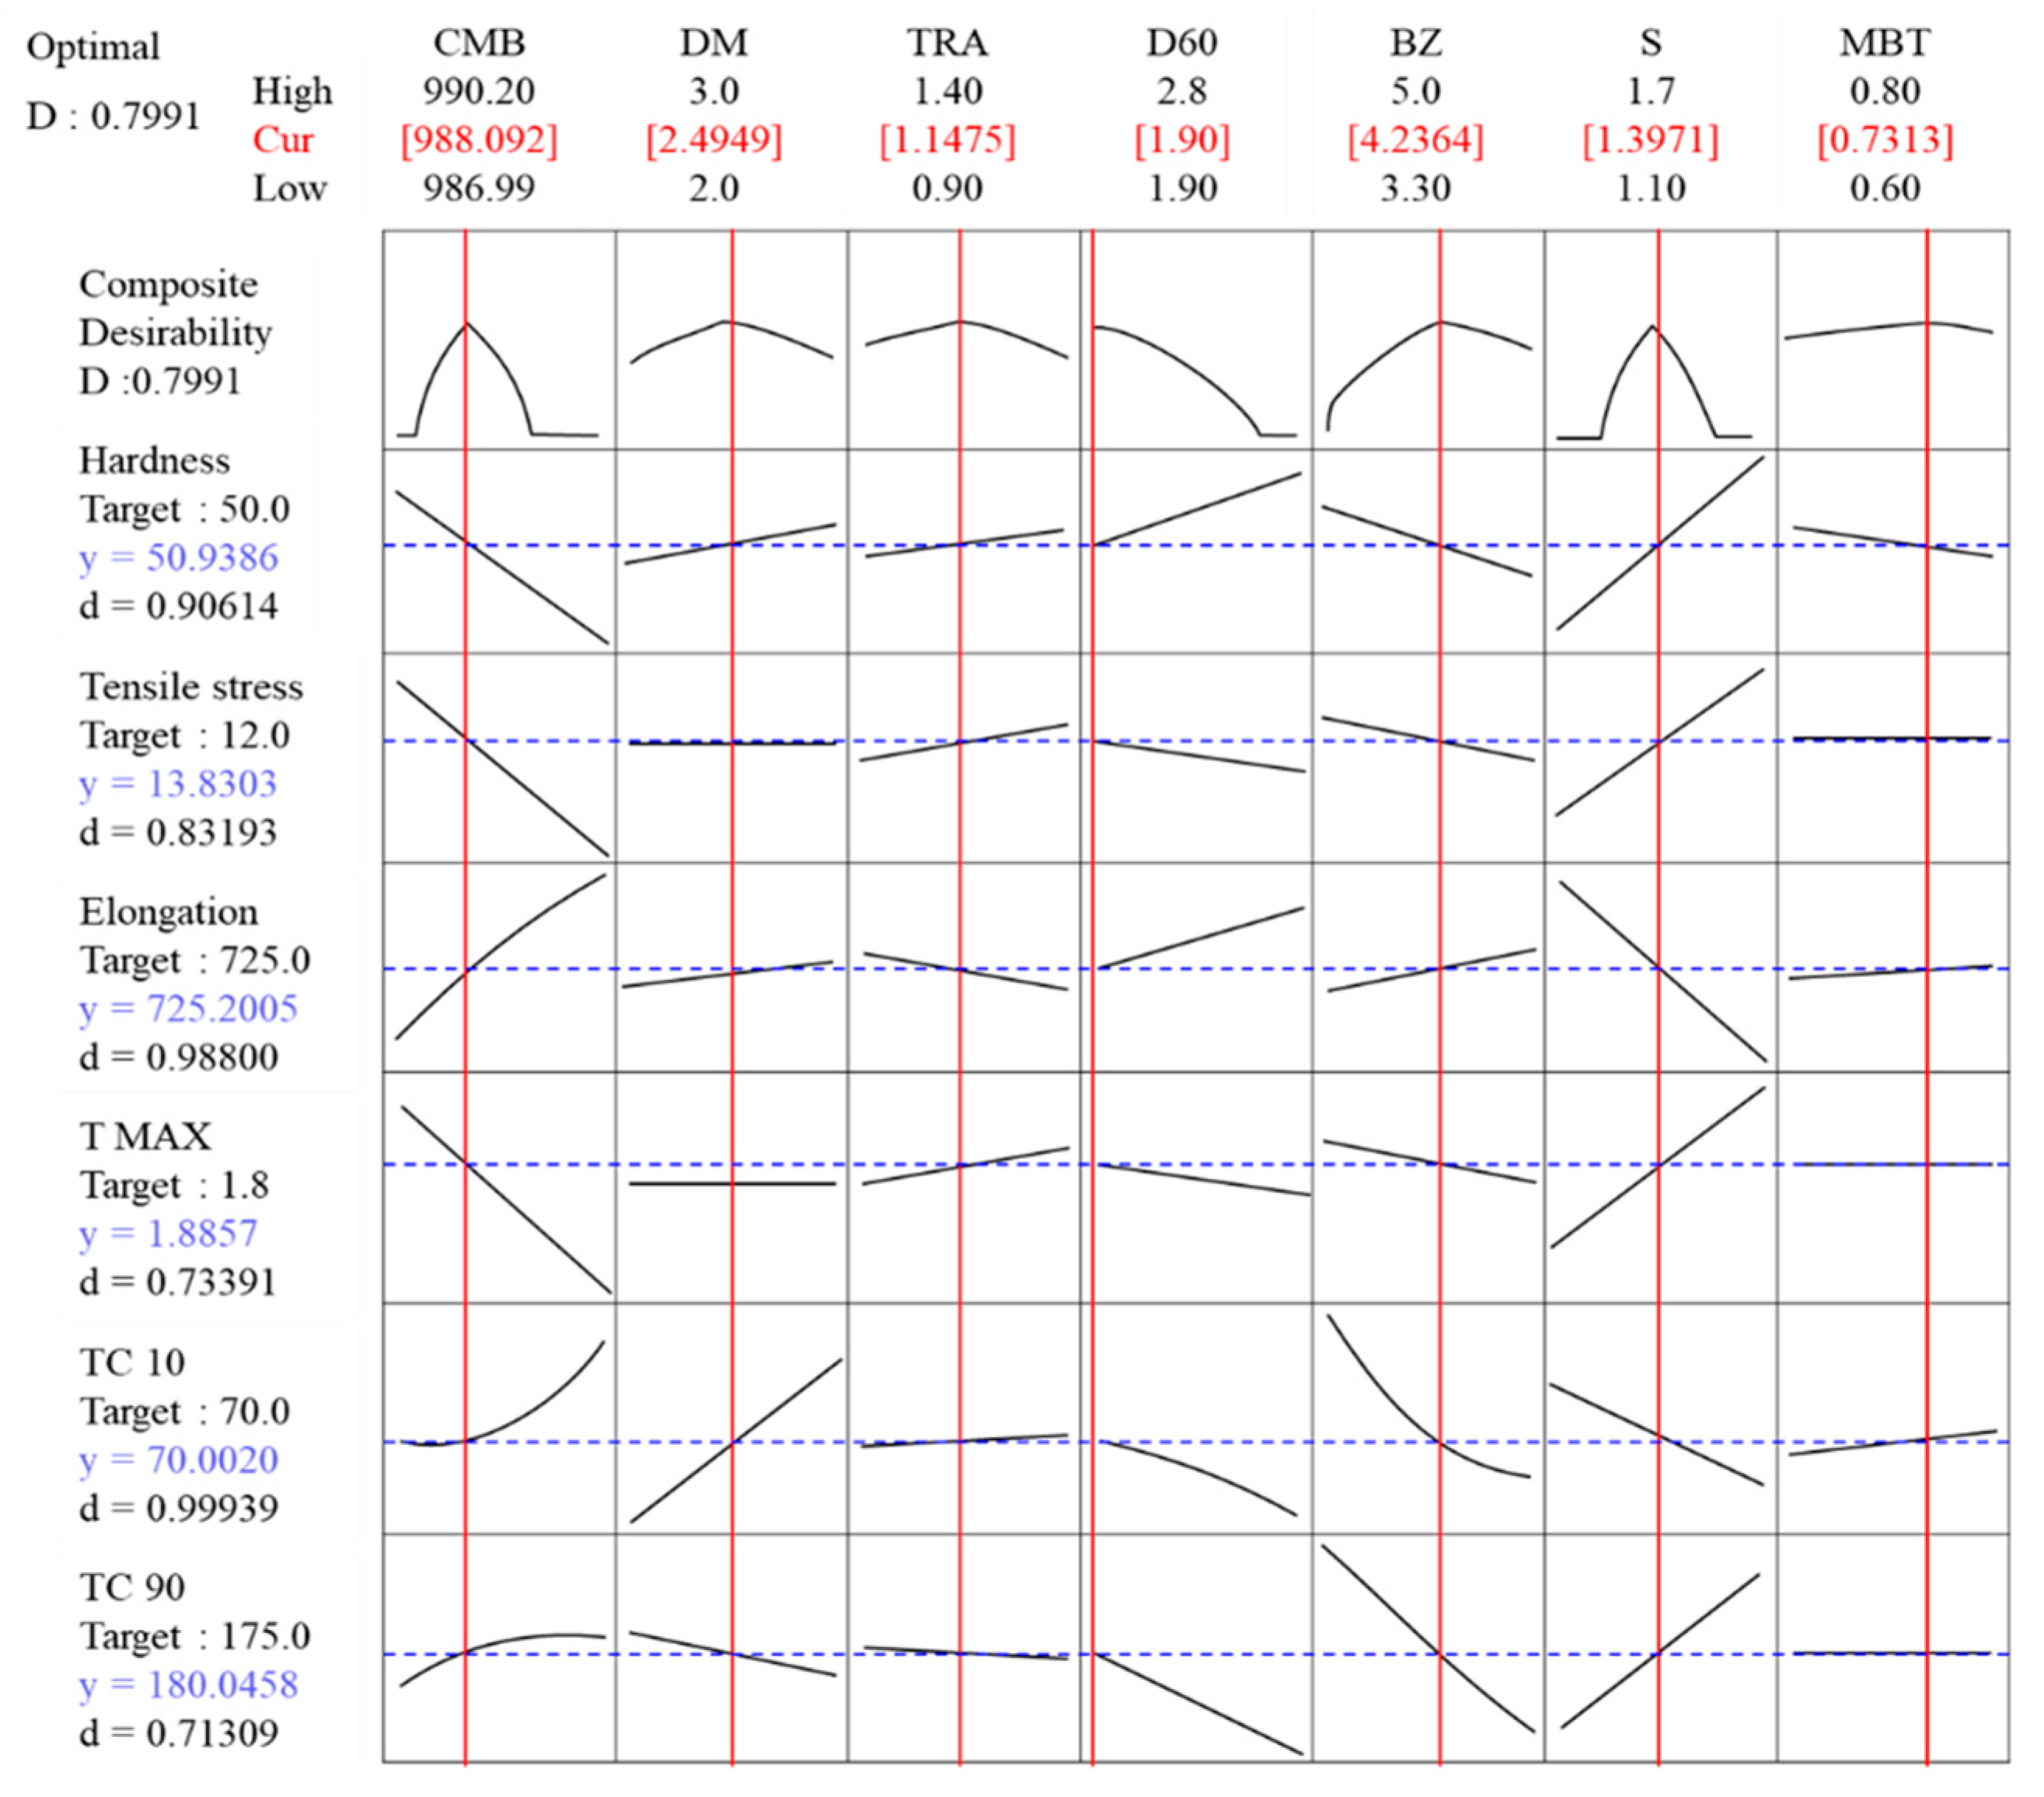
Figure 3 illustrates the optimization plot representing the mixing ratio of each component required to reach the target value, obtained using the response optimization tool Minitab. The plot indicates how different experimental settings affect the predicted responses for a stored model. The predicted values of hardness, tensile strength, and elongation were 50.93, 13.83, and 725.2, respectively, and the T MAX, TC 10, and TC 90 values were 1.89, 70.0, and 180.0, respectively, for the following mixing ratio: CMB 988.09, DM 2.49, TRA 1.15, DPG 1.90, BZ 4.24, S 1.40, and MBT 0.73. The overall desirability of the composite was 79.9%, hardness was 90.6%, tensile stress was 83.2%, and elongation was 98.8%. The desirabilities of T MAX, TC 10, and TC 90 were 73.4%, 99.9%, and 71.3%, respectively.
To test the validity of the derived mixing ratio and conditions, we performed additional experiments. For the validation experiments, we mixed the sample at the set mixing conditions and measured the hardness, tensile strength, and elongation, employing the same experimental methods as above; we also analyzed the vulcanization characteristics. Each validation experiment was repeated four times. The analysis of the results yielded a maximum error of 8.9% relative to the predicted values, as indicated in Table 3.

3.4. Grommet Making and Testing

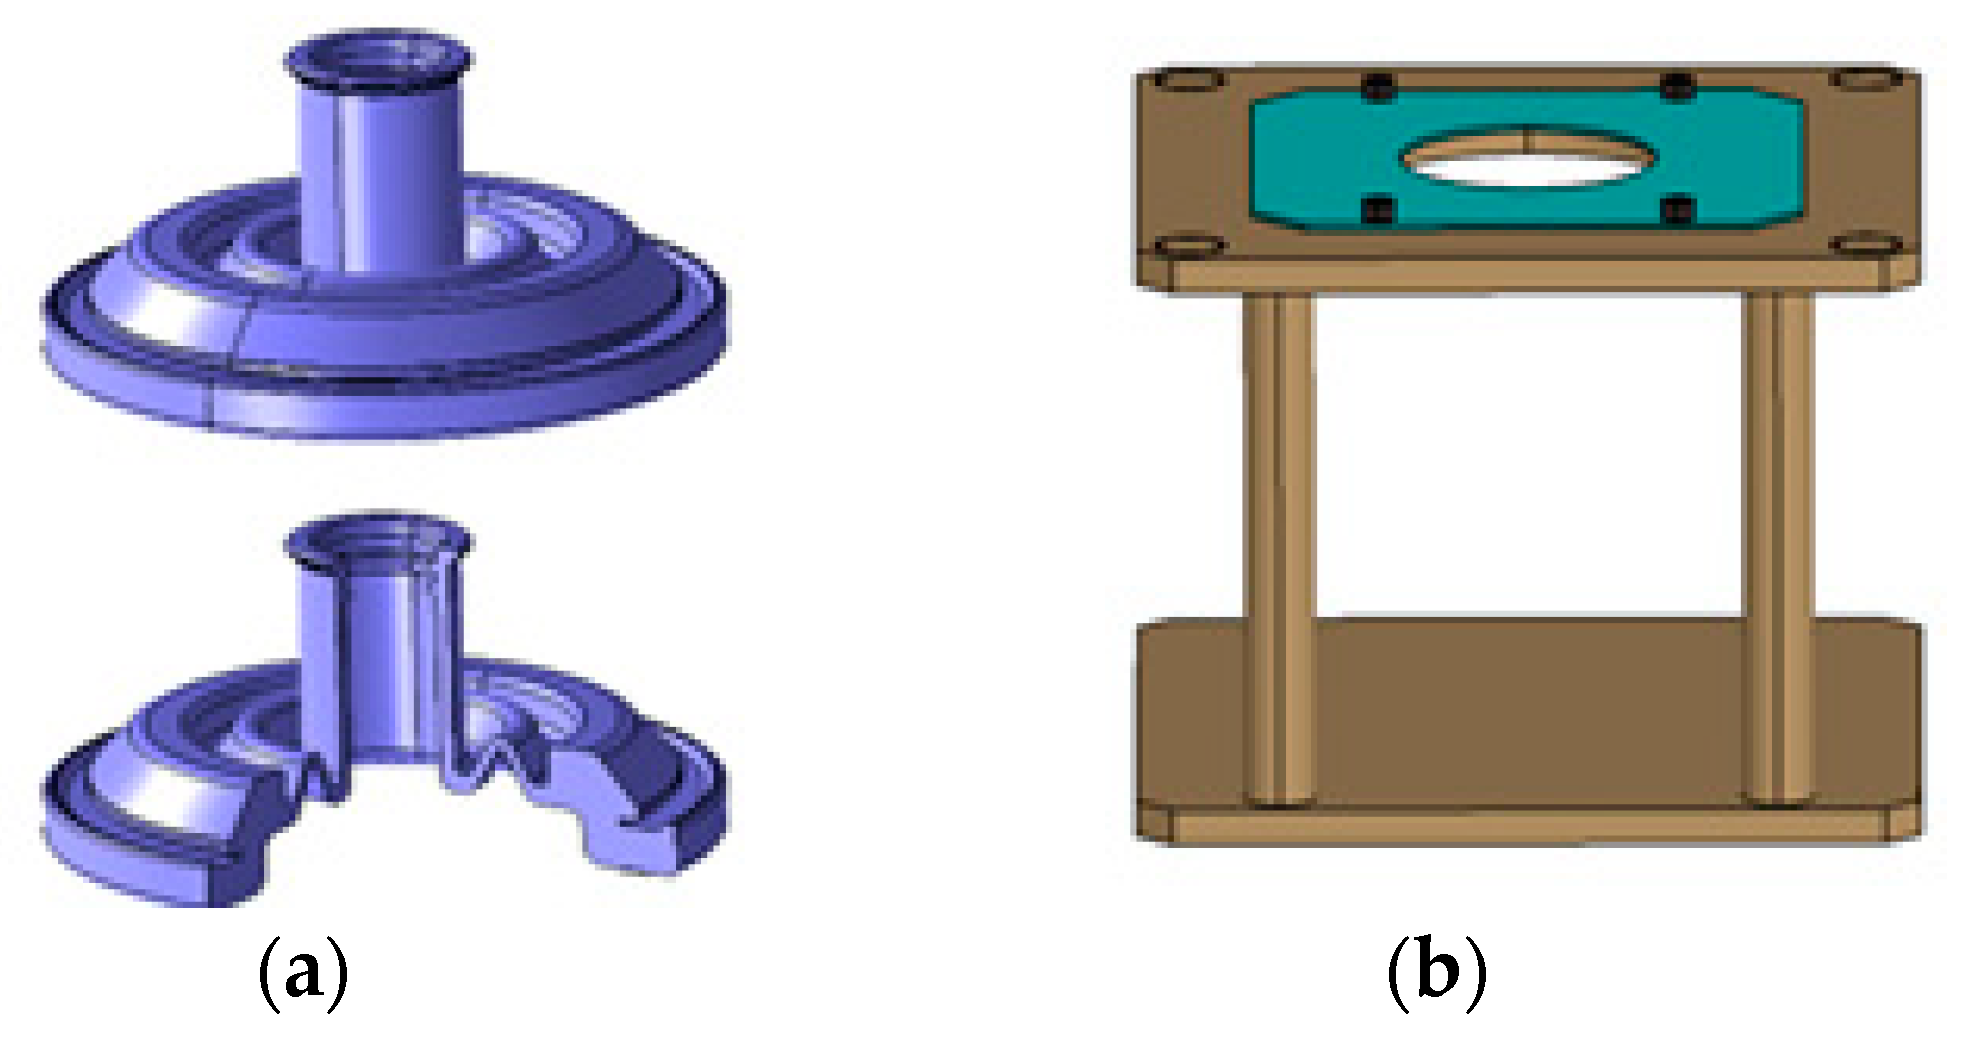
A grommet was fabricated using compounded rubber according to the derived ratio. The grommet produced was a bellows-type grommet [9]. The temperature of the grommet was kept at 180 °C for 900 s. Three grommets with the existing formulation and three with the formulation derived through mixture design were fabricated under the same processing conditions. The manufactured grommet was a test standard for use in vehicle wiring required by the automobile industry. Figure 4a shows the conceptual diagram of the bellows-type grommet. Figure 4b shows the panel fixing jig for the grommet mounting experiment.
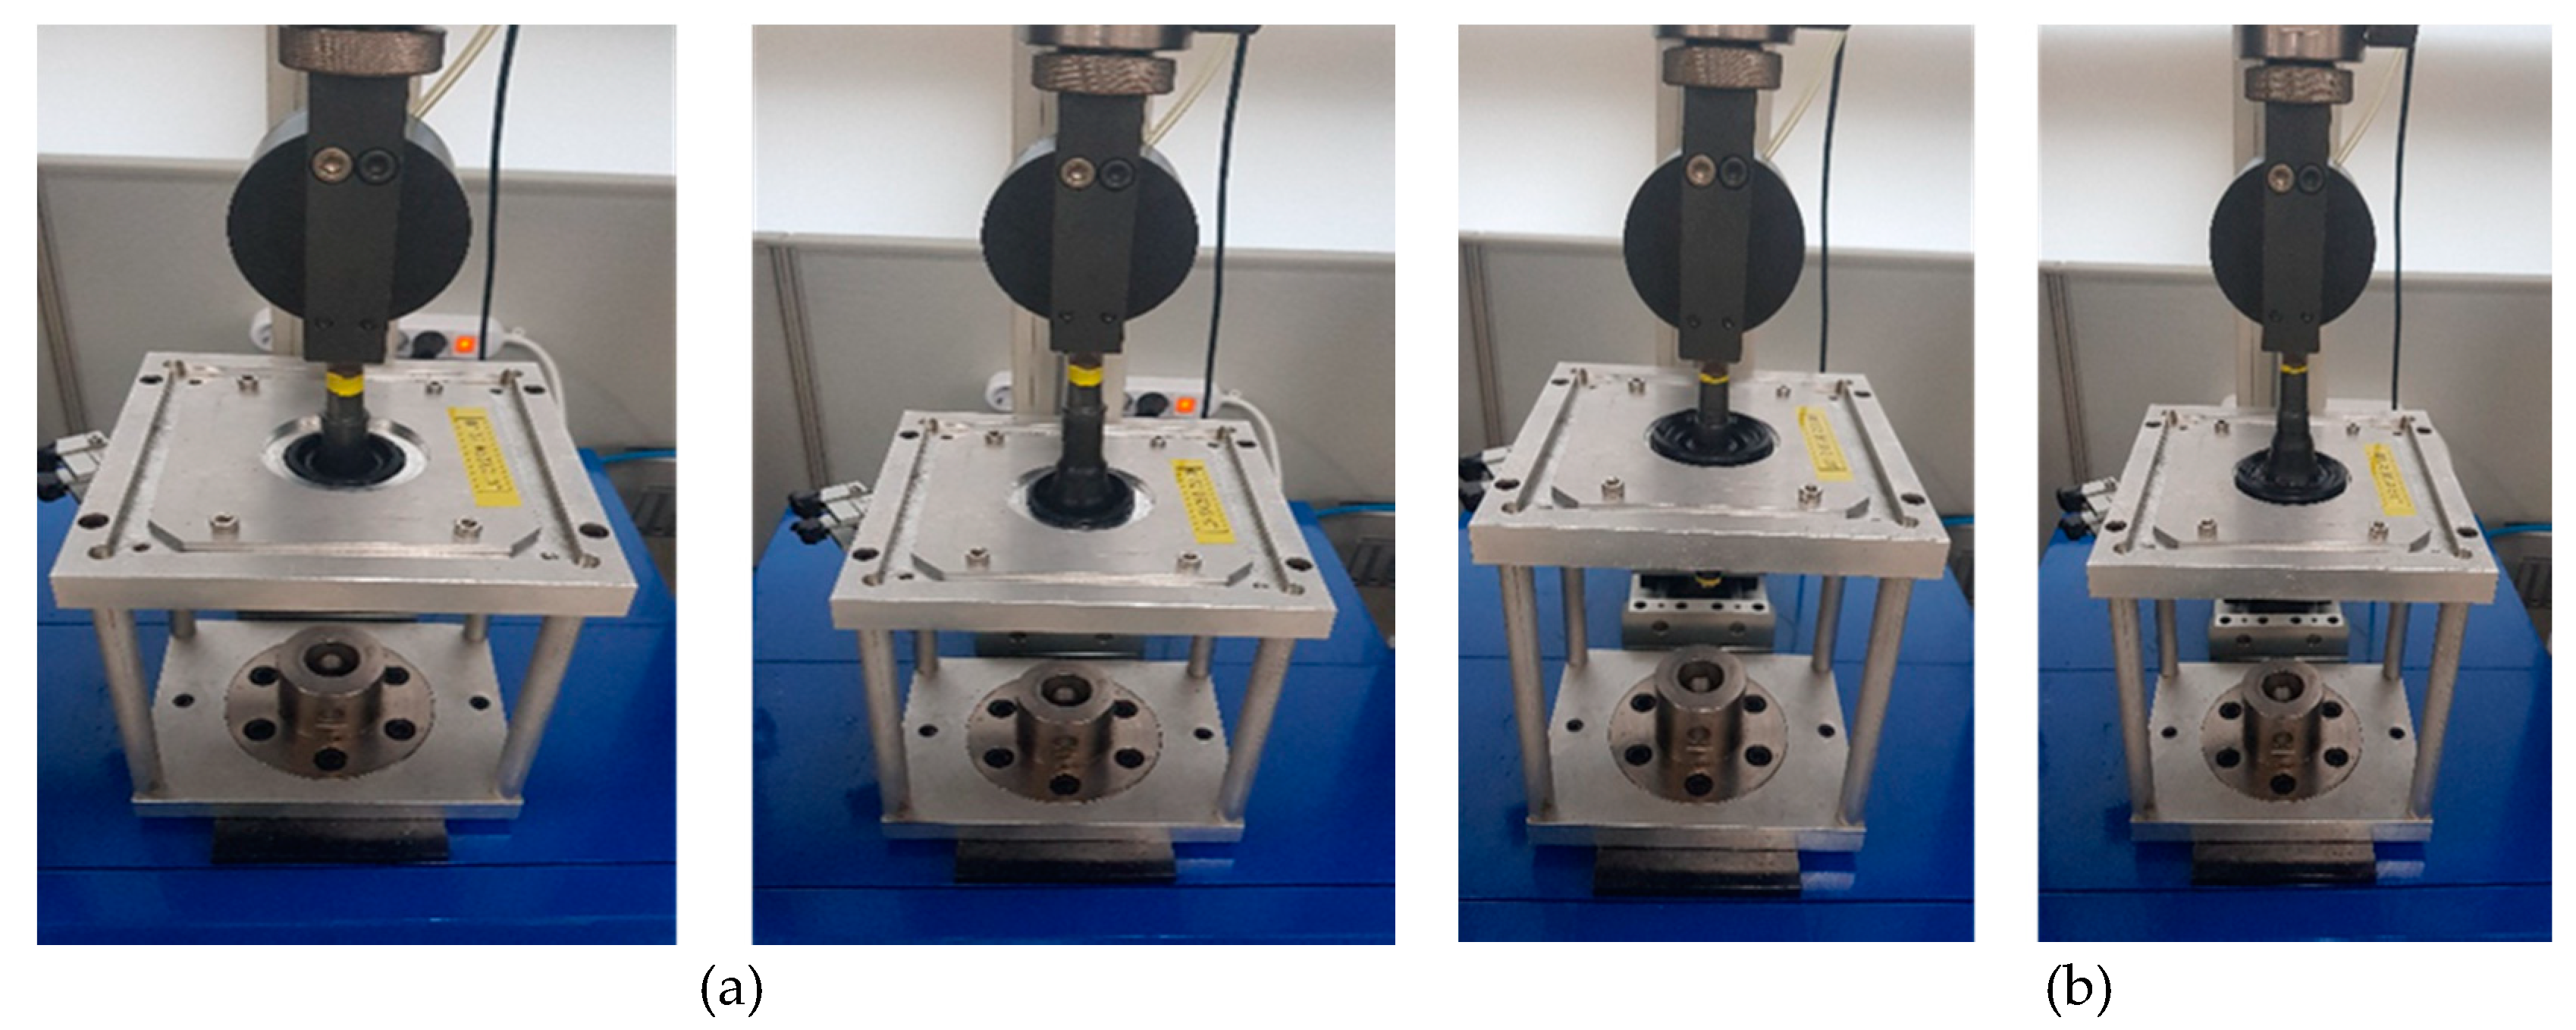
To measure the mounting force, the wire holding part was fixed using fixing tape to the universal testing machine and the wire was pulled until the grommet was firmly fitted to the steel plate. Force was applied until the grommet was fitted in the panel and when being released. The speed of the universal testing machine head was 50 mm/min to measure the insertion and withdrawal forces. Figure 5 shows the measurement of the insertion and separation forces. Figure 5a is a photograph showing a grommet mounted on a jig to measure the insertion force of the grommet and shows a process in which the grommet is inserted before being pulled and the grommet is stretched. Figure 5b shows the drawing of the grommet to pull out the grommet with the grommet inserted into the plate initially to measure the separation force.

4. Analysis of Grommet Mountability

Result Analysis

Figure 6 shows that the insertion force and the separation force of the newly manufactured grommet were reduced compared to the conventional grommet, and the value satisfies the reference value. Figure 6a shows that the average maximum insertion force was 114.98 N in the case of the conventional grommet—16.98 N higher than the reference value of 98 N. In the case of the grommets fabricated using the optimized compounding ratio, the maximum load average was 65.33 N, which was lower than the standard by 32.67 N. This means that the mounting performance improved when the grommet was inserted into the panel. In addition, Figure 6b shows a measurement graph of the separation force. The average maximum load of the separation force decreased from 160.06 N for the conventional grommet to 96.67 N for grommets fabricated using the optimized compounding ratio, which is higher than the reference value of 69 N.

5. Conclusions

In this study, to improve the mounting performance of grommets, we performed various experiments to analyze the properties of EPDM rubber depending on the type of accelerator used and derived the optimum mixing ratio. After quantifying the effects of accelerators on EPDM rubber, we analyzed the mechanical properties and vulcanization characteristics resulting from the use of five different accelerators. Regarding the mechanical properties, we analyzed the hardness, tensile strength, and elongation, which were most influenced by the S content. The accelerator that exerted the greatest effect on the mechanical properties was TRA. TRA also exerted the greatest effect on the vulcanization characteristics, followed by BZ.
We applied the mixture design as a strategy to achieve mixing ratio optimization, with the aim of obtaining the desired mechanical properties and vulcanization characteristics. Based on the results, we analyzed response traces depending on the mixing ratio and derived the optimum mixing ratio. The grommet was fabricated using the derived mixing ratio, and the insertion and separation forces were compared and analyzed. The comparison confirmed that the insertion force decreased by 43.2% and the separation force decreased by 29.2% compared to the conventional grommet. The insertion and separation forces corresponded to the reference values; the mounting force improved when the grommet was fabricated using the derived mixing ratio and mounted on a car panel.

Author Contributions

Y.S.K., Y.T.K., and E.S.J. conceived and designed the experiments; Y.S.K., Y.T.K., and E.S.J. performed the experiments; Y.S.K., Y.T.K., and E.S.J. analyzed the data; Y.S.K., Y.T.K., and E.S.J. contributed reagents/materials/analysis tools; Y.S.K., Y.T.K., and E.S.J. wrote the paper.

Funding

This research was financially supported by the Ministry of SMEs and Startups (MSS), Korea, under the “Convergence and Integration R&D (P0005112)” supervised by the Korea Institute for Advancement of Technology (KIAT).

Conflicts of Interest

The authors declare no conflict of interest.

References

  1. Maria Daniela, S.; Anton, A.; Elena, M.; Gabriela, C.; Nicusor, F.; Cristian, V.; Daniela, P.; Florica, D. Effects of electsron beam irradiation on the mechanical, thermal, and surface properties of some EPDM/butyl rubber composites. Polymers 2018, 10, 1206. [Google Scholar] [CrossRef]
  2. Lev, Y.; Faye, A.; Volokh, K.Y. Experimental study of the effect of temperature on strength and extensibility of rubberlike materials. Exp. Mech. 2018, 58, 847–858. [Google Scholar] [CrossRef]
  3. Diana, P.; Aurelian, Z.; Catalin, A.; Florin, B.; Rodica, M. FDM process parameters influence over the mechanical properties of polymer specimens: A review. Polym. Test 2018, 69, 157–166. [Google Scholar] [CrossRef]
  4. Šarac, T.; Quiévy, N.; Gusarov, Q.; Konstantinovic, M.J. Influence of γ-irradiation and temperature on the mechanical properties of EPDM cable insulation. Radiat. Phys. Chem. 2016, 125, 151–155. [Google Scholar] [CrossRef]
  5. Kim, S.M.; Kim, K.J. Thiazole Type Accelerator effects on silane/silica filled natural rubber compound upon vulcanization and mechanical properties. Polym. Korea 2012, 36, 235–244. [Google Scholar] [CrossRef]
  6. Lee, S.-B.; Yeom, S.-H.; Han, C.-Y.; Woo, C.-S. A study on finite element analysis and aging test for automotive grommet. Elastomers Compos. 2012, 47, 201–209. [Google Scholar] [CrossRef]
  7. Tjong, S.C.; Ke, Y.C. Fracture toughening behavior of elastomer modified polyphenylene ether/polyamide blends. Eur. Polym. J. 1998, 34, 1565–1750. [Google Scholar] [CrossRef]
  8. Zhao, Y.; Liu, Z.; Su, B.; Chen, F.; Fu, Q.; Ning, N.; Tian, M. Property enhancement of PP-EPDM thermoplastic vulcanizates via shear-induced break-up of nano-rubber aggregates and molecular orientation of the matrix. Polymer 2015, 63, 170–178. [Google Scholar] [CrossRef]
  9. Kim, Y.; Hwang, E.; Jeon, E. Optimization of Shape Design of Grommet through Analysis of Physical Properties of EPDM Materials. Appl. Sci. 2019, 9, 133. [Google Scholar] [CrossRef]
  10. Han, C.-Y.; Lee, S.-B. A Study on the Behavior for Automotive Grommet by Using FEA. Trans. Korean Soc. Automot. Eng. 2010, 18, 74–79. [Google Scholar]
  11. Kim, S.-M.; Kim, K.-J. Effects of Accelerators on the Vulcanization Properties of Silica vs. Carbon Black Filled Natural Rubber Compound. Polymer (Korea) 2013, 37, 269–275. [Google Scholar] [CrossRef]
  12. Nabil, H.; Hanafi, I. Improving the tensile properties of natural rubber compounds containing ground ethylene propylene diene rubber waste by twostage processing. Procedia Chem. 2016, 19, 810–815. [Google Scholar] [CrossRef]
  13. Sae-oui, P.; Sirisinha, C.; Thepsuwan, U.; Thapthong, P. Influence of accelerator type on properties of NR/EPDM blends. Polym. Test 2017, 26, 1062–1067. [Google Scholar] [CrossRef]
  14. Phadke, A.; Bhattacharya, A.; Chakraborty, S.; De, S. Studies of vulcanization of reclaimed rubber. Rubber Chem. Technol. 1983, 56, 726–736. [Google Scholar] [CrossRef]
  15. Felipe, N.L.; Cléverson, F.S.G.; Maria, F.; De, S.; Regina Célia Reis, N. Mechanical and rheological properties of nitrile rubber/fluoromica composites. Appl. Clay Sci. 2018, 162, 165–174. [Google Scholar] [CrossRef]
  16. Alexandrescu, L.; SÖnmez, M.; Georgescu, M.; NiŢuicĂ, M.; Ficai, A.; Trusca, R.; GurĂu, D. Polymer nanocomposites PE/PE-g-MA/EPDM/nanoZnO and TiO2 dynamically crosslinked with sulphur and accelerators. Procedia Struct. Integr. 2017, 5, 667–674. [Google Scholar] [CrossRef]
  17. Costa, H.M.D.; Ramos, V.D.; Silva, W.S.D.; Sirqueira, A.S. Analysis and optimization of polypropylene (PP)/ethylene–propylene–diene monomer (EPDM)/scrap rubber tire (SRT) mixtures using RSM methodology. Polym. Test. 2010, 29, 572–578. [Google Scholar] [CrossRef]
  18. Dengwu, J.; Caijun, S.; Qiang, Y.; Xiaopeng, A.; Yu, L. Mixture design of concrete using simplex centroid design method. Cem. Concr. Compos. 2018, 89, 76–88. [Google Scholar] [CrossRef]
  19. Gorman, J.W.; Hinman, J.E. Simplex Lattice Designs for Multicomponent Systems. J. Technometrics 1962, 4, 463–487. [Google Scholar] [CrossRef]
  20. Ding, J.D.; Yan, P.Y.; Liu, S.L.; Zhu, J.Q. Extreme vertices design of concrete with combined mineral admixtures. Cem. Concr. Res. 1999, 29, 957–960. [Google Scholar] [CrossRef]
  21. ISO 2393:2014. Rubber Test Mixes—Preparation, Mixing and Vulcanization—Equipment and Procedures; International Organization for Standardization: Geneva, Switzerland, 2014. [Google Scholar]
  22. KS M 6518:2016. Physical Test Methods for Vulcanized Rubber; Korean Industrial Standards: Seoul, Korea, 2016. [Google Scholar]
  23. KS M 6687:2016. Test Method for Rubber Compound—Vulcanizing Characteristics Using Oscillating Disk Cure Meter; Korean Industrial Standards: Seoul, Korea, 2016. [Google Scholar]
  24. Damir, G.; Davorin, K. Optimization of hybrid manufacturing for surface quality, material consumption and productivity improvement. Strojniški Vestnik-J. Mech. Eng. 2017, 63, 567–576. [Google Scholar] [CrossRef]
  25. Irfan, S.; Dan, Z. Optimization of the brake factor for an S-Cam foundation brake using RSM. Strojniški vestnik-J. Mech. Eng. 2016, 62, 503–510. [Google Scholar] [CrossRef]
  26. Sajjad, D.; Hamid, R.P.; Oveis, B. An extreme vertices mixture design approach tothe optimization of methylal production process using p-toluenesulfonic acid as catalyst. Chem. Eng. Res. Des. 2016, 112, 155–162. [Google Scholar] [CrossRef]
  27. Maamoun, A.; Xue, Y.; Elbestawi, M.; Veldhuis, S. Effect of selective laser melting process parameters on the quality of Al alloy parts: Powder characterization, density, surface roughness, and dimensional accuracy. Materials 2018, 11, 2343. [Google Scholar] [CrossRef] [PubMed]
  28. Worrapon, W.; Chayathach, P.; Thongchai, K.; Surapol, N. An Extreme vertices mixture design approach to optimization of tyrosinase inhibition effects. Eng. J. 2017, 22, 175–185. [Google Scholar] [CrossRef]
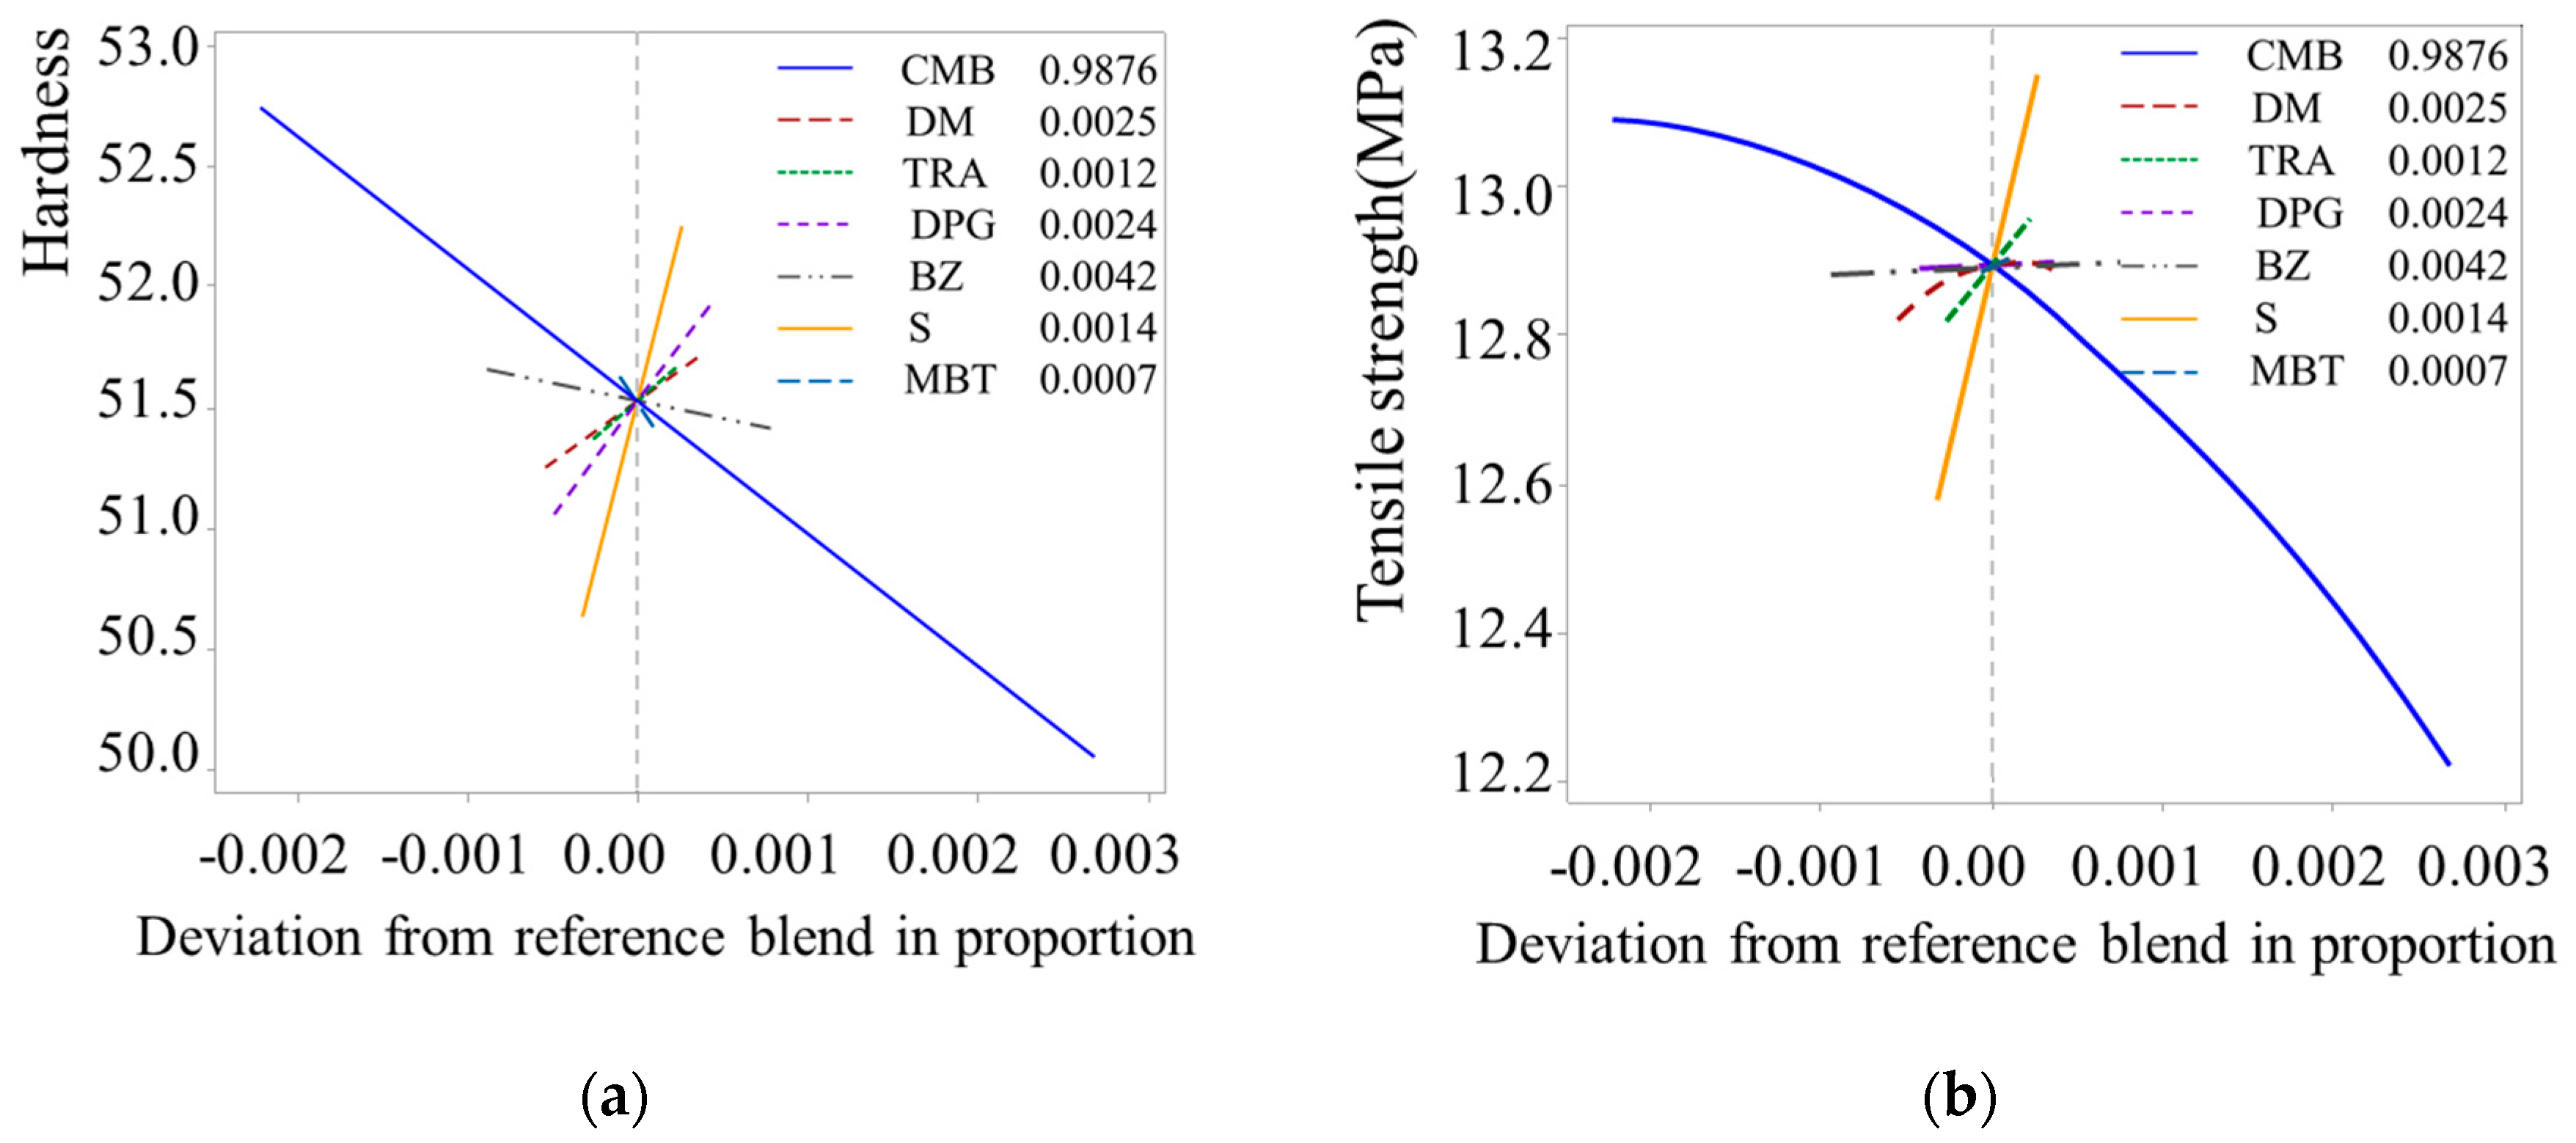
Figure 1. Cox response trace plots for mechanical properties depending on mixing ratio: (a) hardness; (b) tensile strength; (c) elongation.
Applsci 09 02640 g001aApplsci 09 02640 g001b
Figure 2. Cox response trace plots of vulcanization characteristics as a function of mixing ratio: (a) T MAX; (b) TC 10; (c) TC 90.
Applsci 09 02640 g002
Figure 3. Optimization plot representing the mixing ratio of each component.
Applsci 09 02640 g003
Figure 4. Grommet and jig diagram: (a) bellows-type grommet; (b) jig for fixing the panel.
Applsci 09 02640 g004
Figure 5. Measurement of the insertion and separation forces: (a) depicts the measurement of the insertion force; (b) shows that of the separation force.
Applsci 09 02640 g005
Figure 6. Results of the insertion and separation forces: (a) insertion force and (b) separation force.
Applsci 09 02640 g006
Table 1. Experimental design of mixtures.
DivisionUnitLower limit12345Upper limit
DMg2.022.032.252.262.492.763.03
TRAg0.900.911.001.011.111.231.35
DPGg1.861.872.082.082.302.582.80
BZg3.323.333.713.714.094.544.98
MBTg0.550.560.620.620.680.760.83
Sg1.121.131.251.261.381.531.68
CMBg990.22 985.33
Totalg1000.00 1000.00
DM, dibenzothiazyl disulfide; TRA, dipentamethylenethiuram tetrasulfide; DPG, diphenylguanidine; BZ, zinc di-n-butyl dithiocarbamate; MBT, 2-mercaptobenzothiazole; S, sulfur; CMB; carbon master batch.
Table 2. List of parameters for optimization experiments.
DivisionLowerTargetUpperWeight
Mechanical characteristicsHardness (Shore A)4050602
Tensile strength (MPa)1112131.5
Elongation (%)7007257502.5
Vulcanization characteristicsT MAX (Nm)1.351.802.261.5
TC 10 (s)6570751.5
TC 90 (s)1501752001.5
Table 3. Results of validation experiments.
No.Mechanical CharacteristicsVulcanization Characteristics
Hardness (Shore A)Tensile Strength (MPa)Elongation (%)T MAX (Nm)TC10 (s)TC90 (s)
15113.037451.8976196
25111.95738.11.8576189
35211.81750.51.8877195
45113.02727.41.9276200
Average51.2512.45740.251.8876.25195
Similarity2.5%2.3%2.1%0.3%8.9%8.3%