Design and Evaluation of a Deformable Sensor for Interstitial Pore Pressure Measurement in Concrete under Very High Stress Level


Abstract
1. Introduction
2. Experimental Set Up
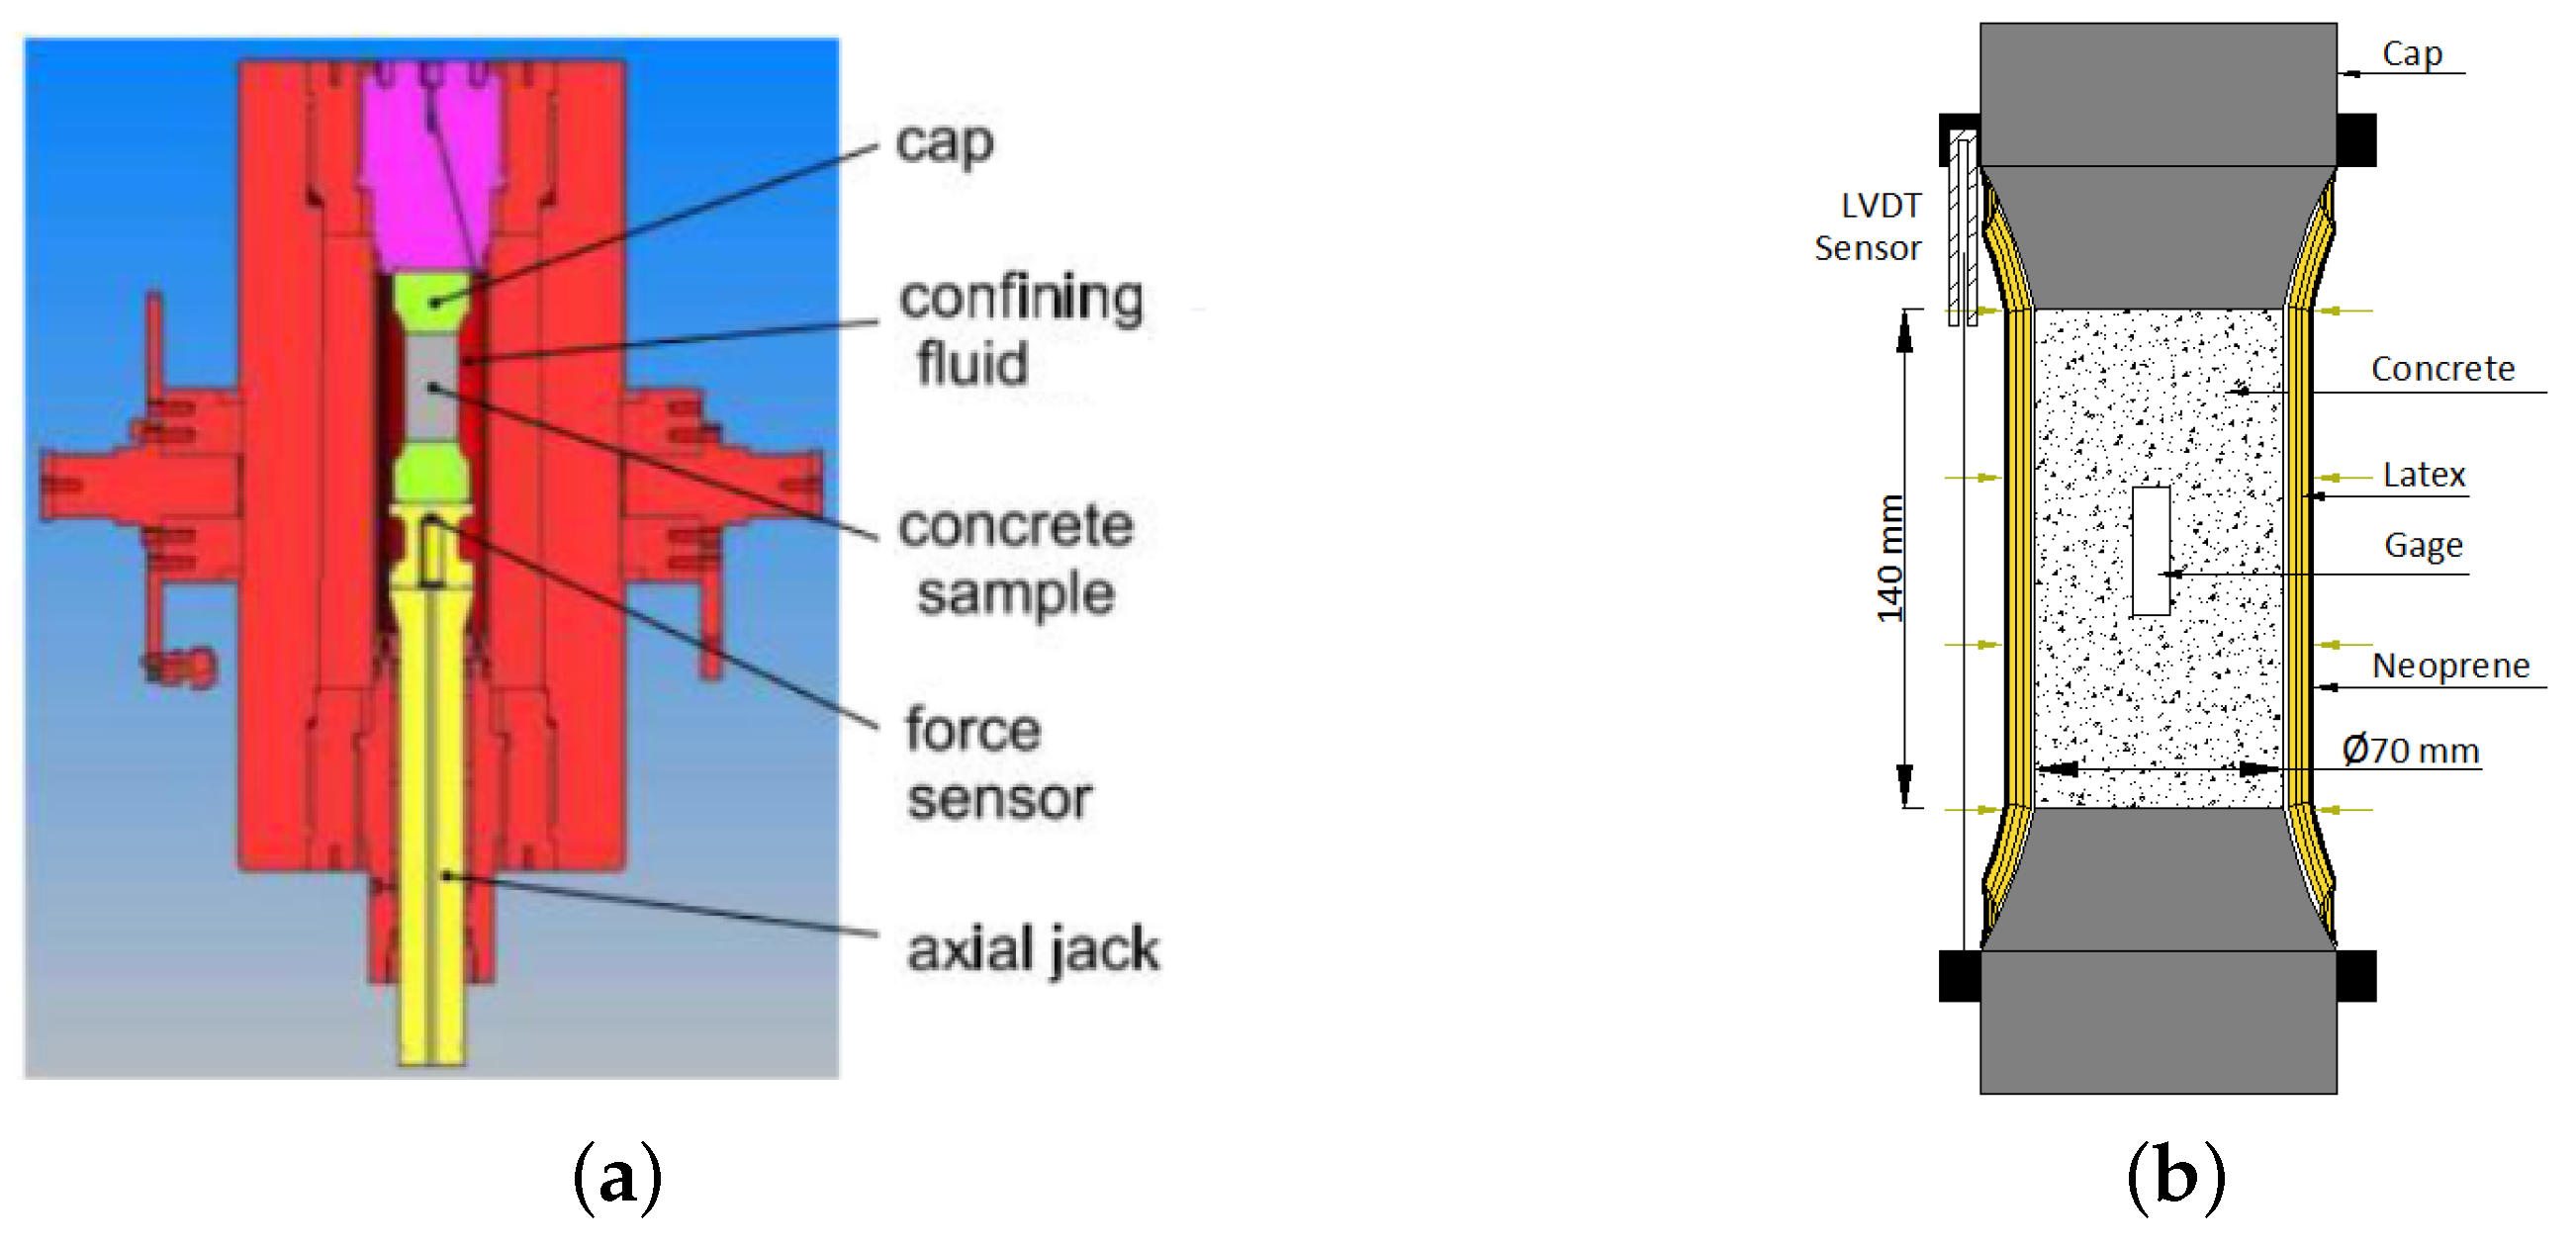
2.1. Giga Press Overview
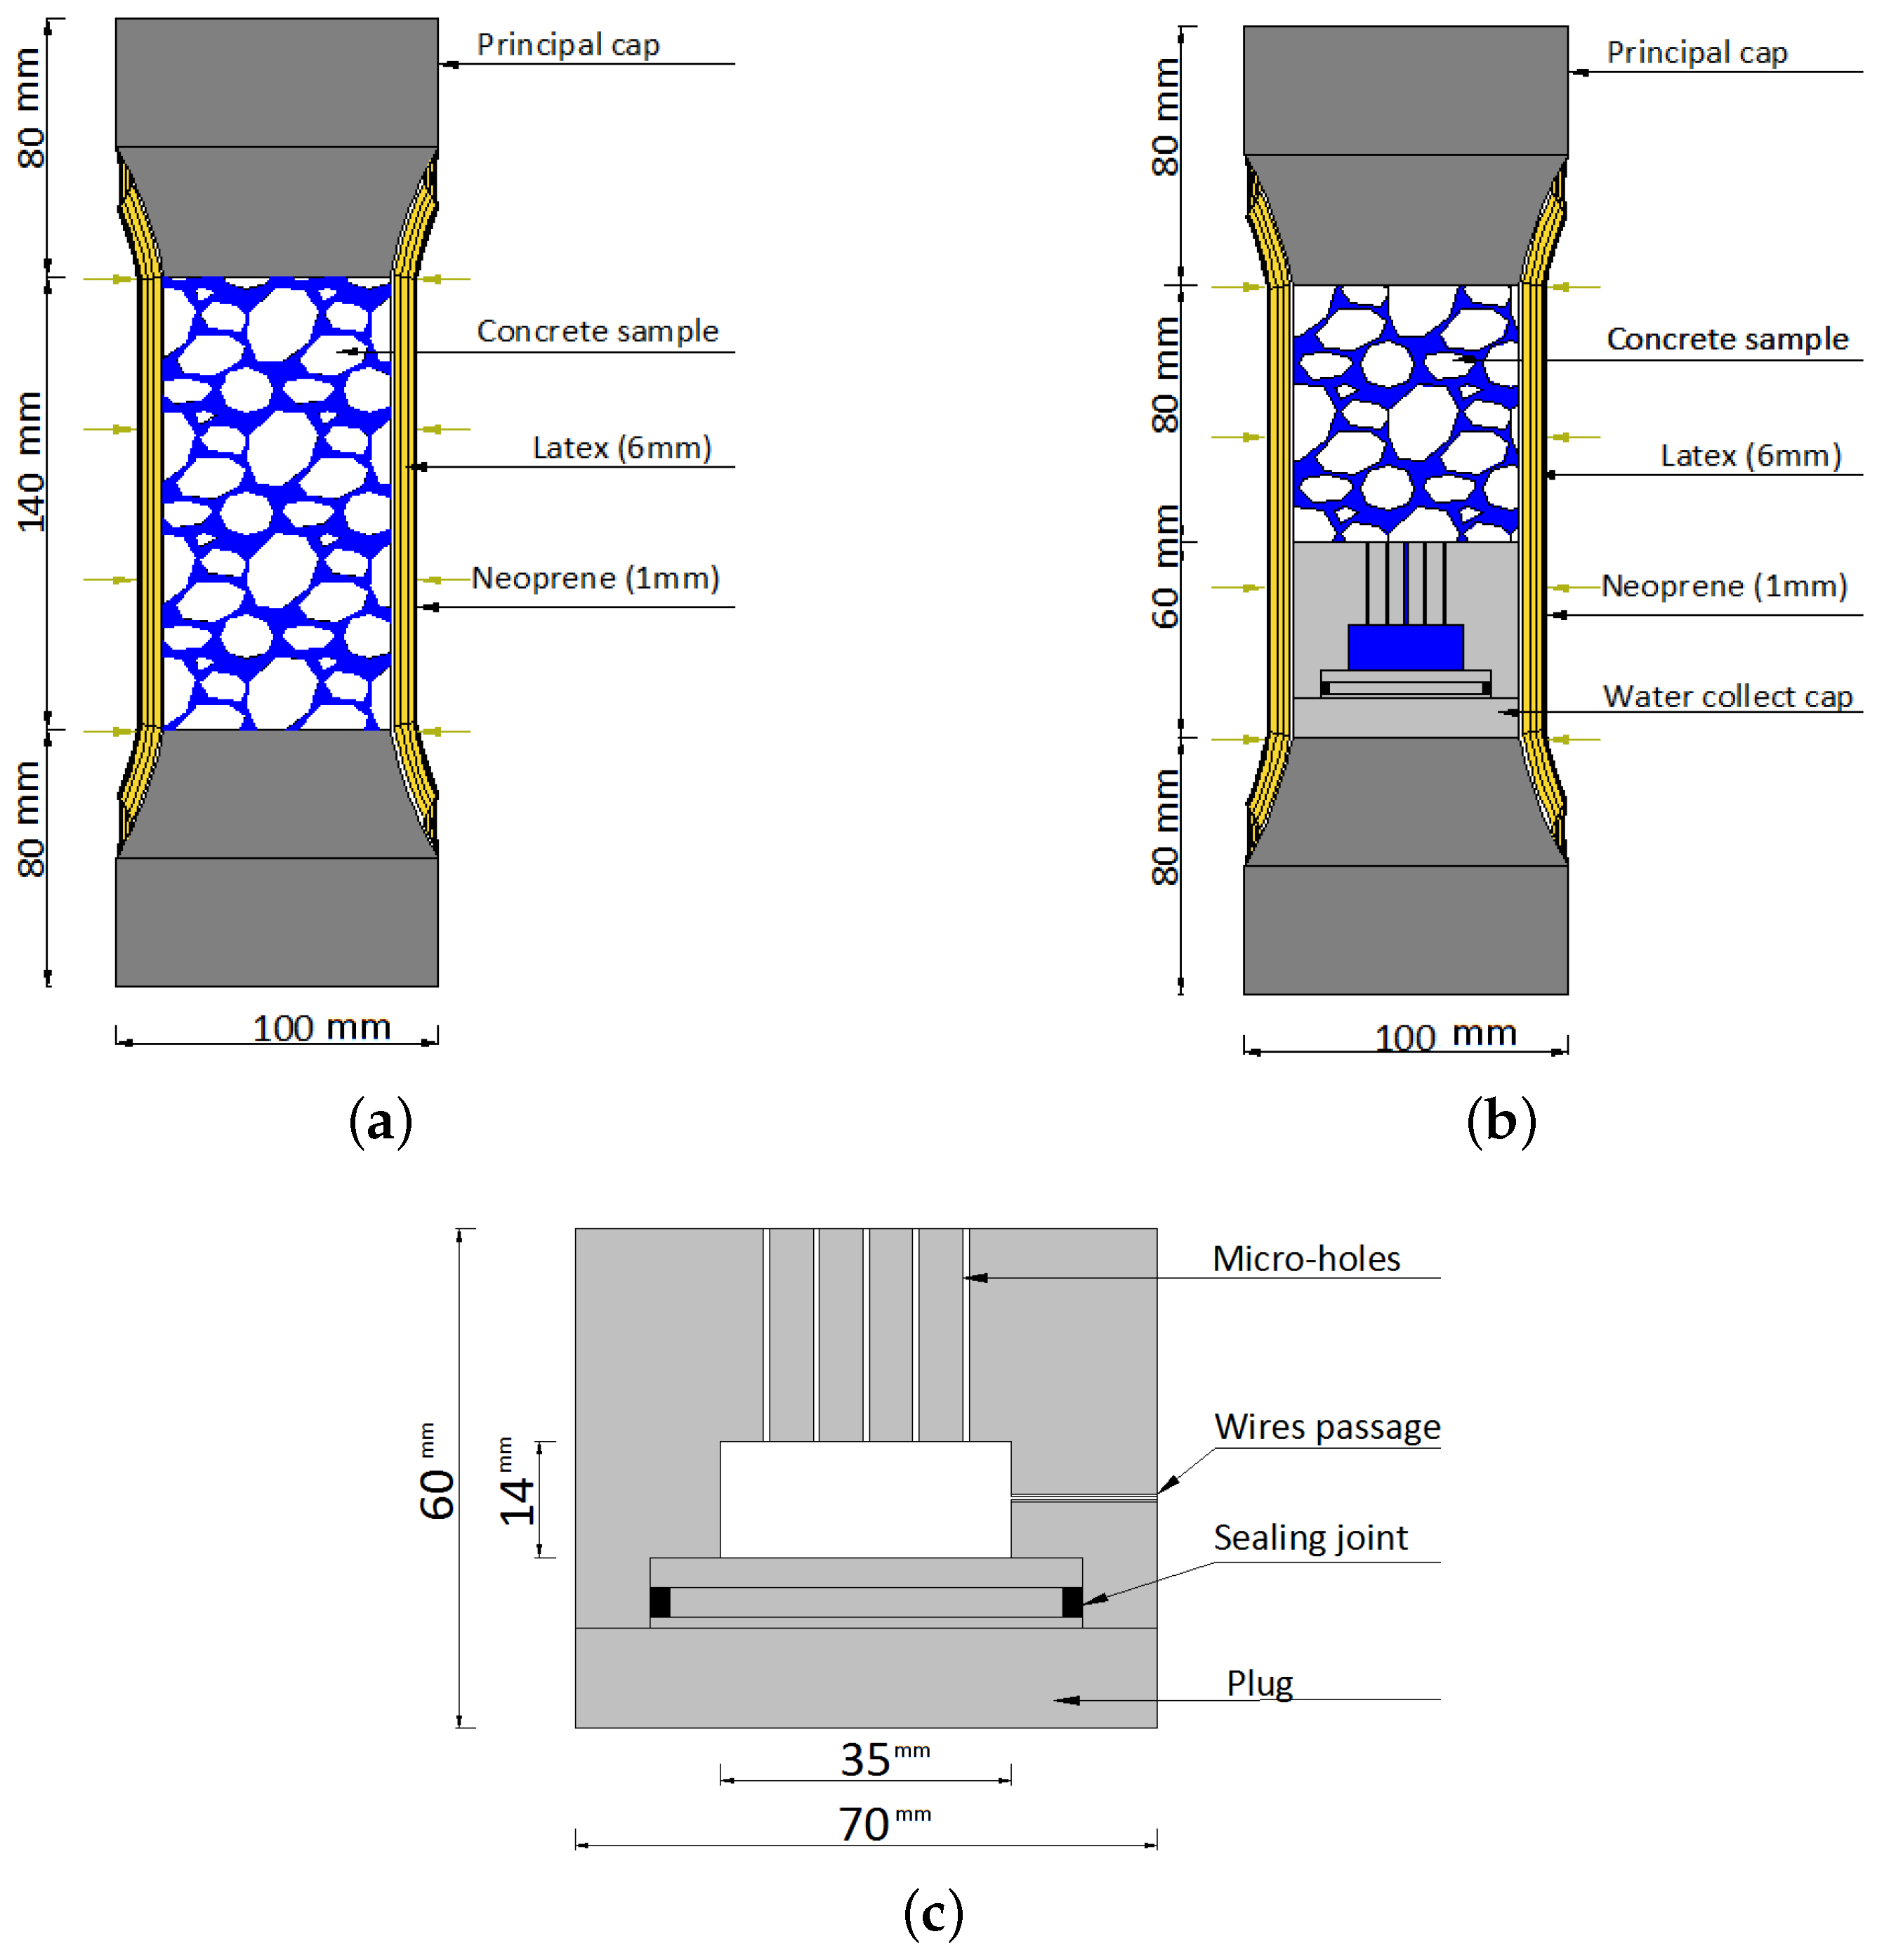
2.2. Drainage System
3. Pressure Sensor Concept and Design
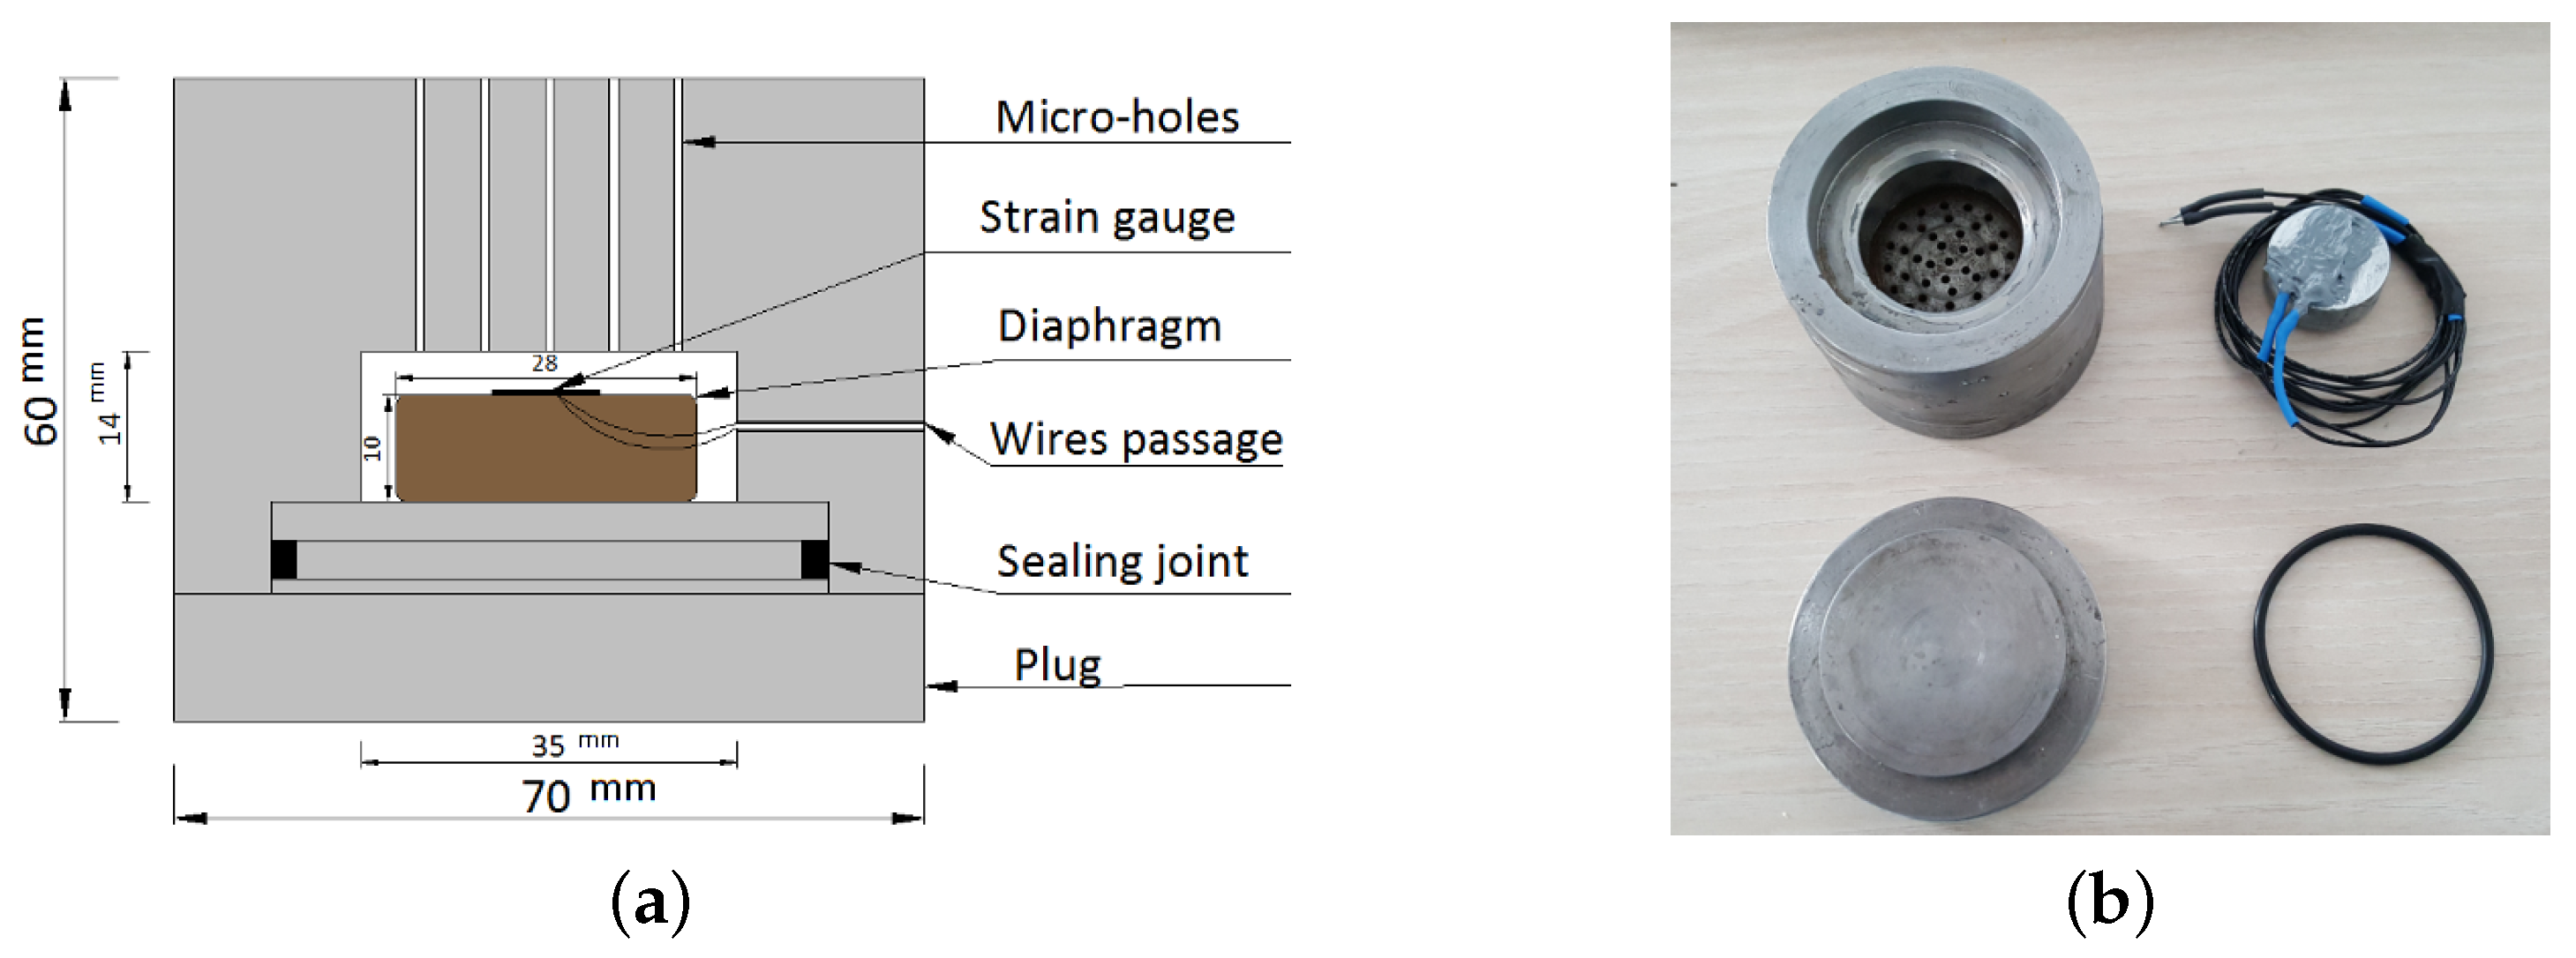
3.1. Hydrostatic Sensor (HS)
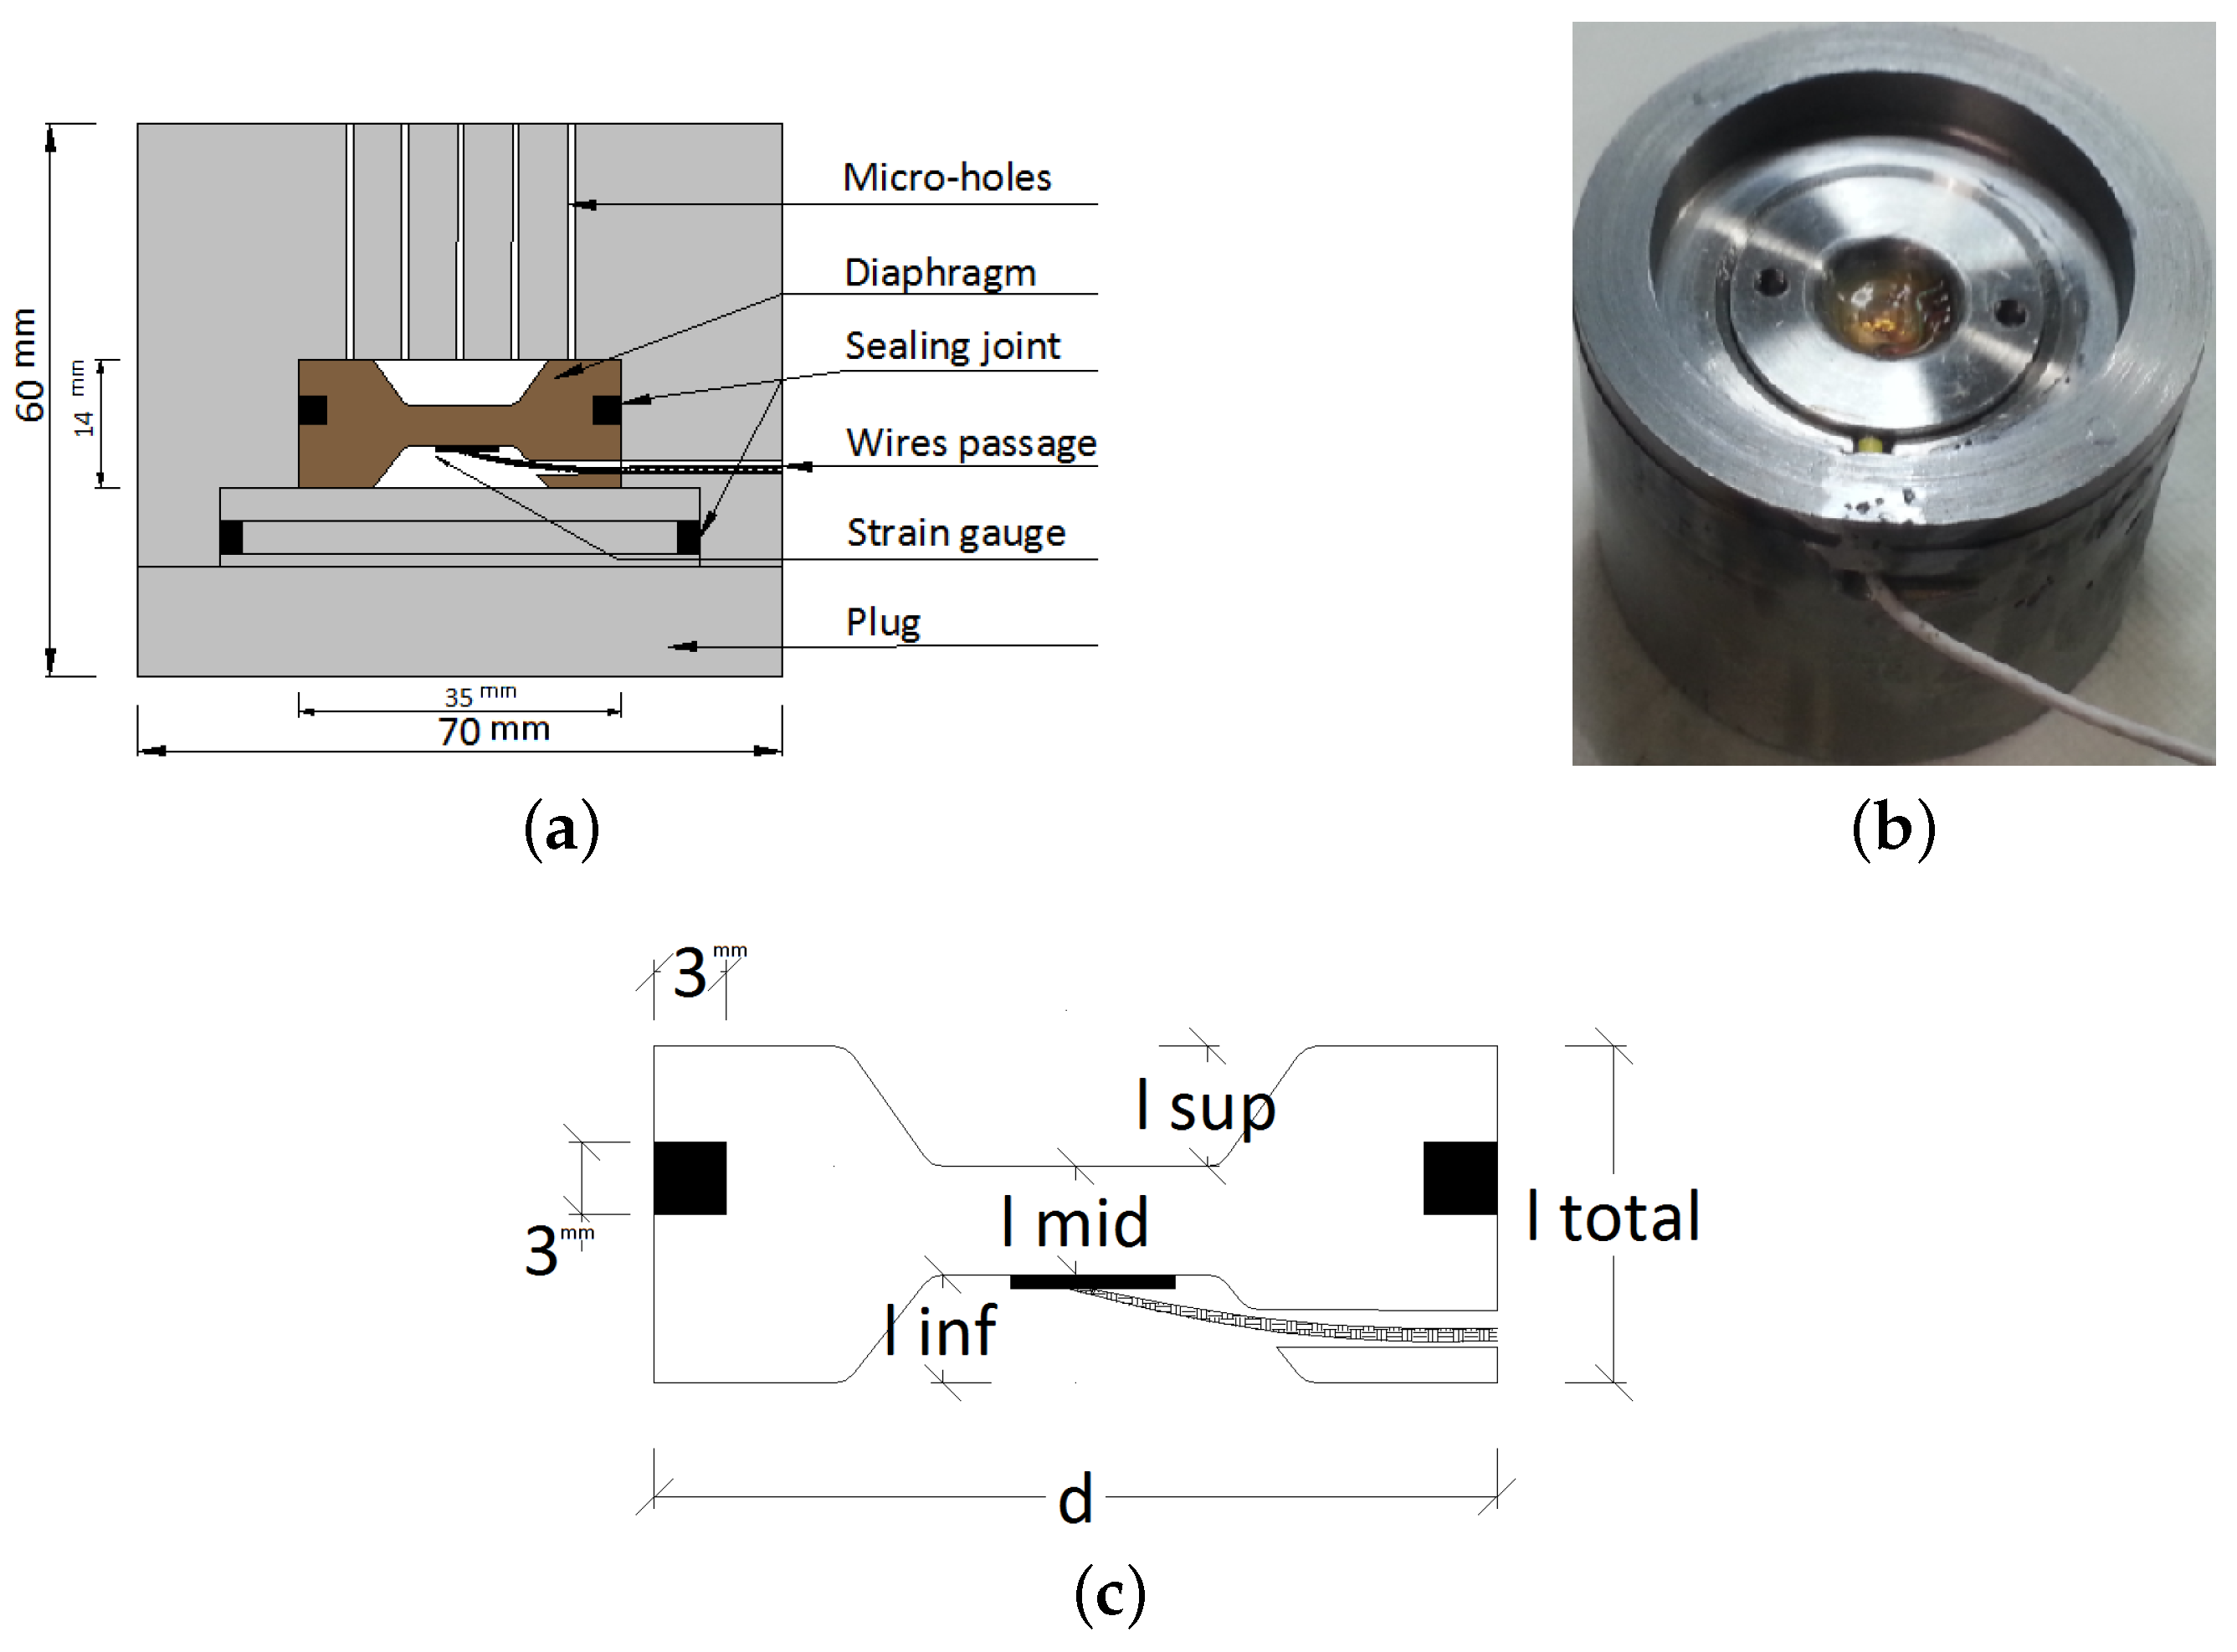
3.2. Membrane Sensor (MS)
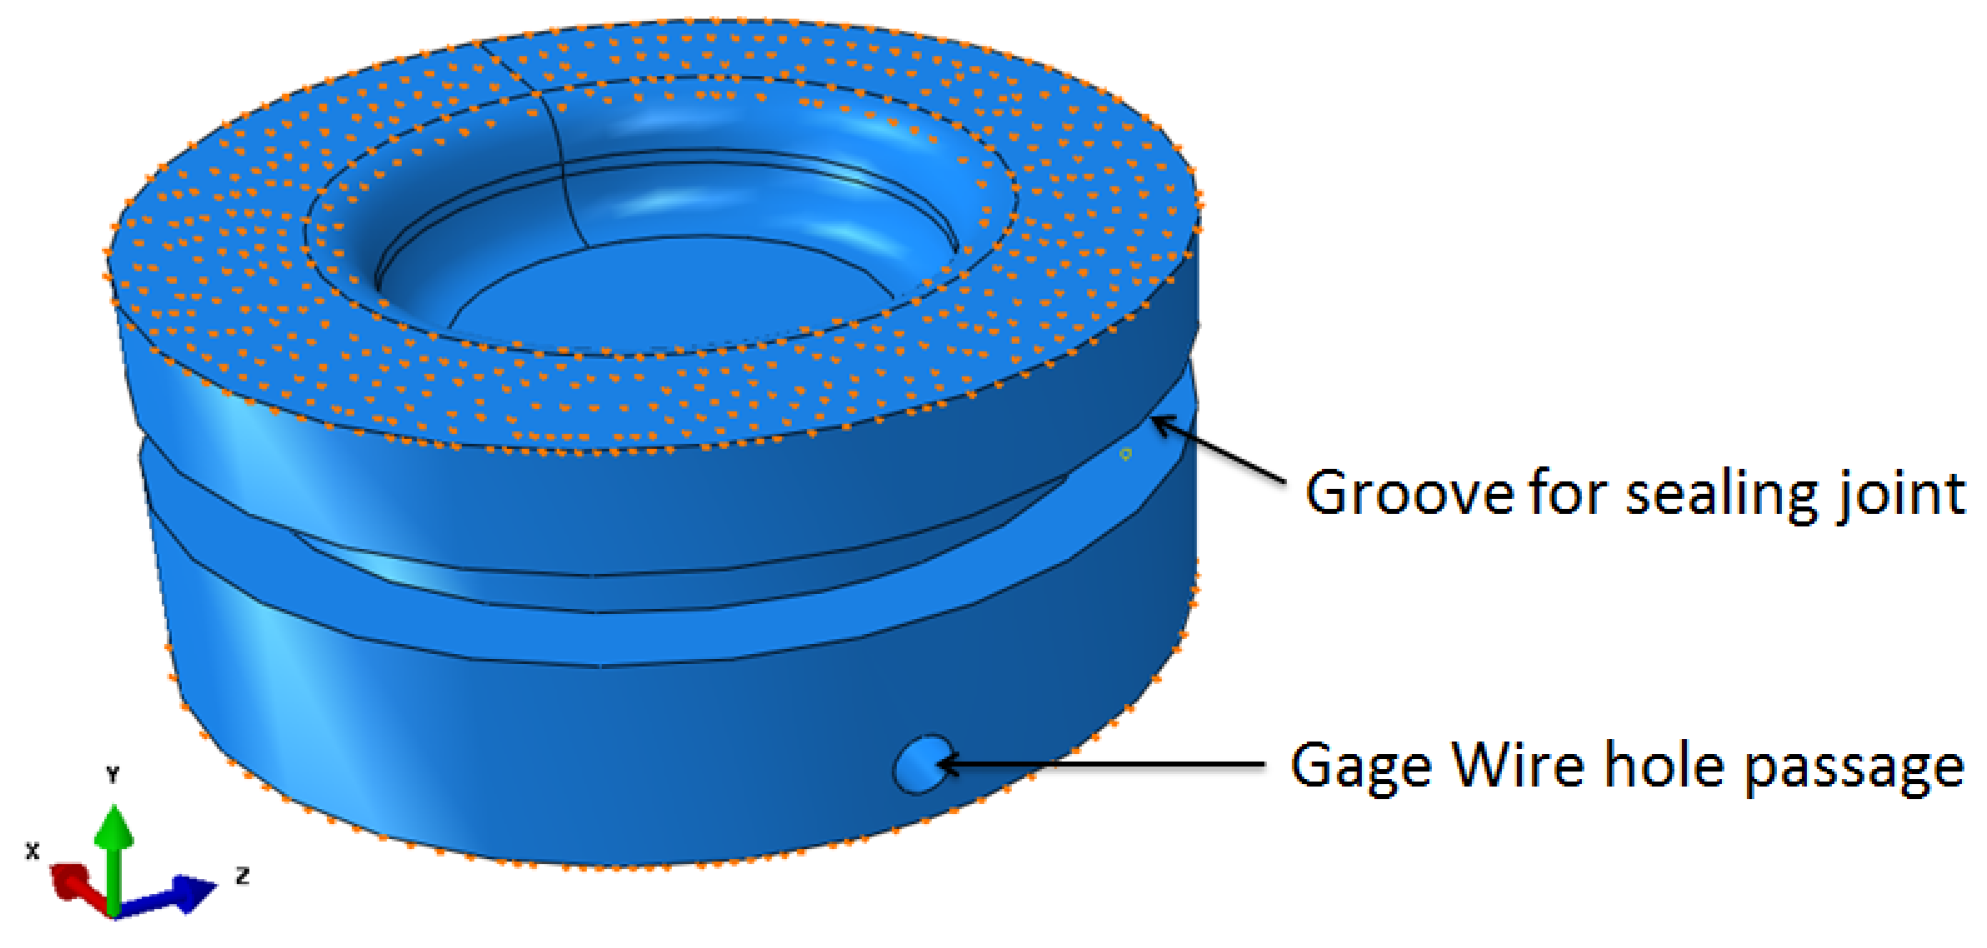
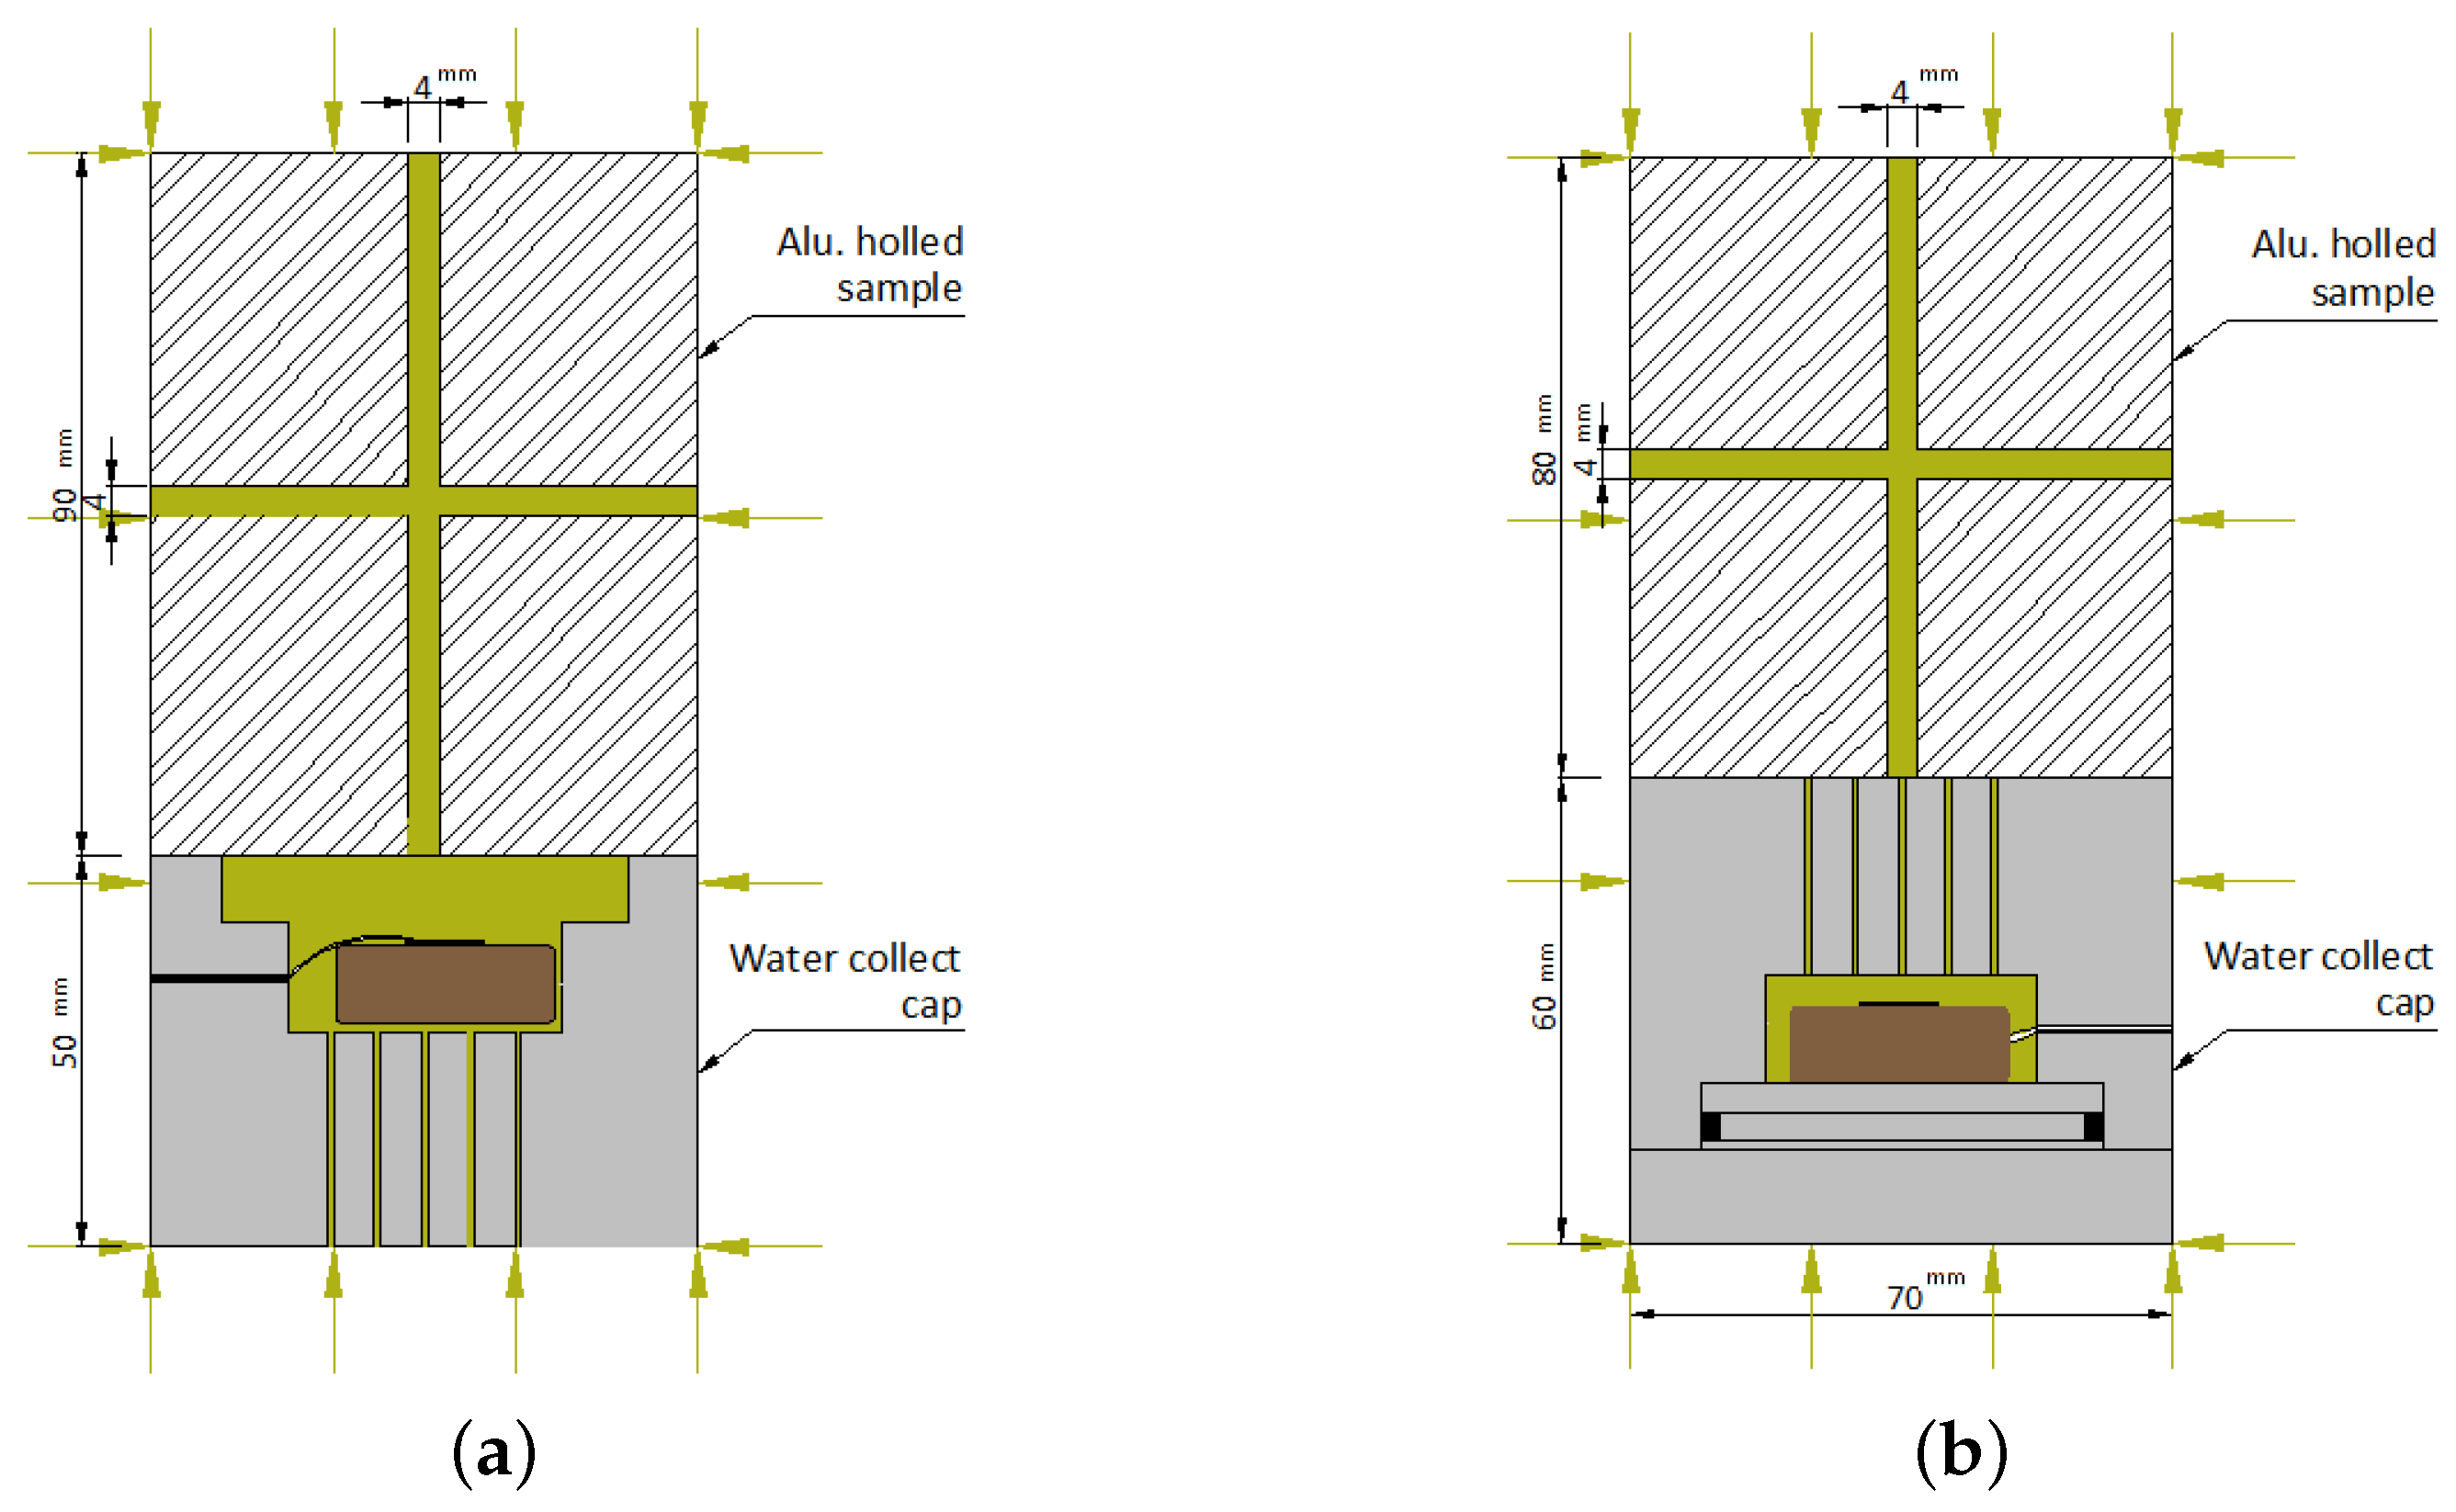
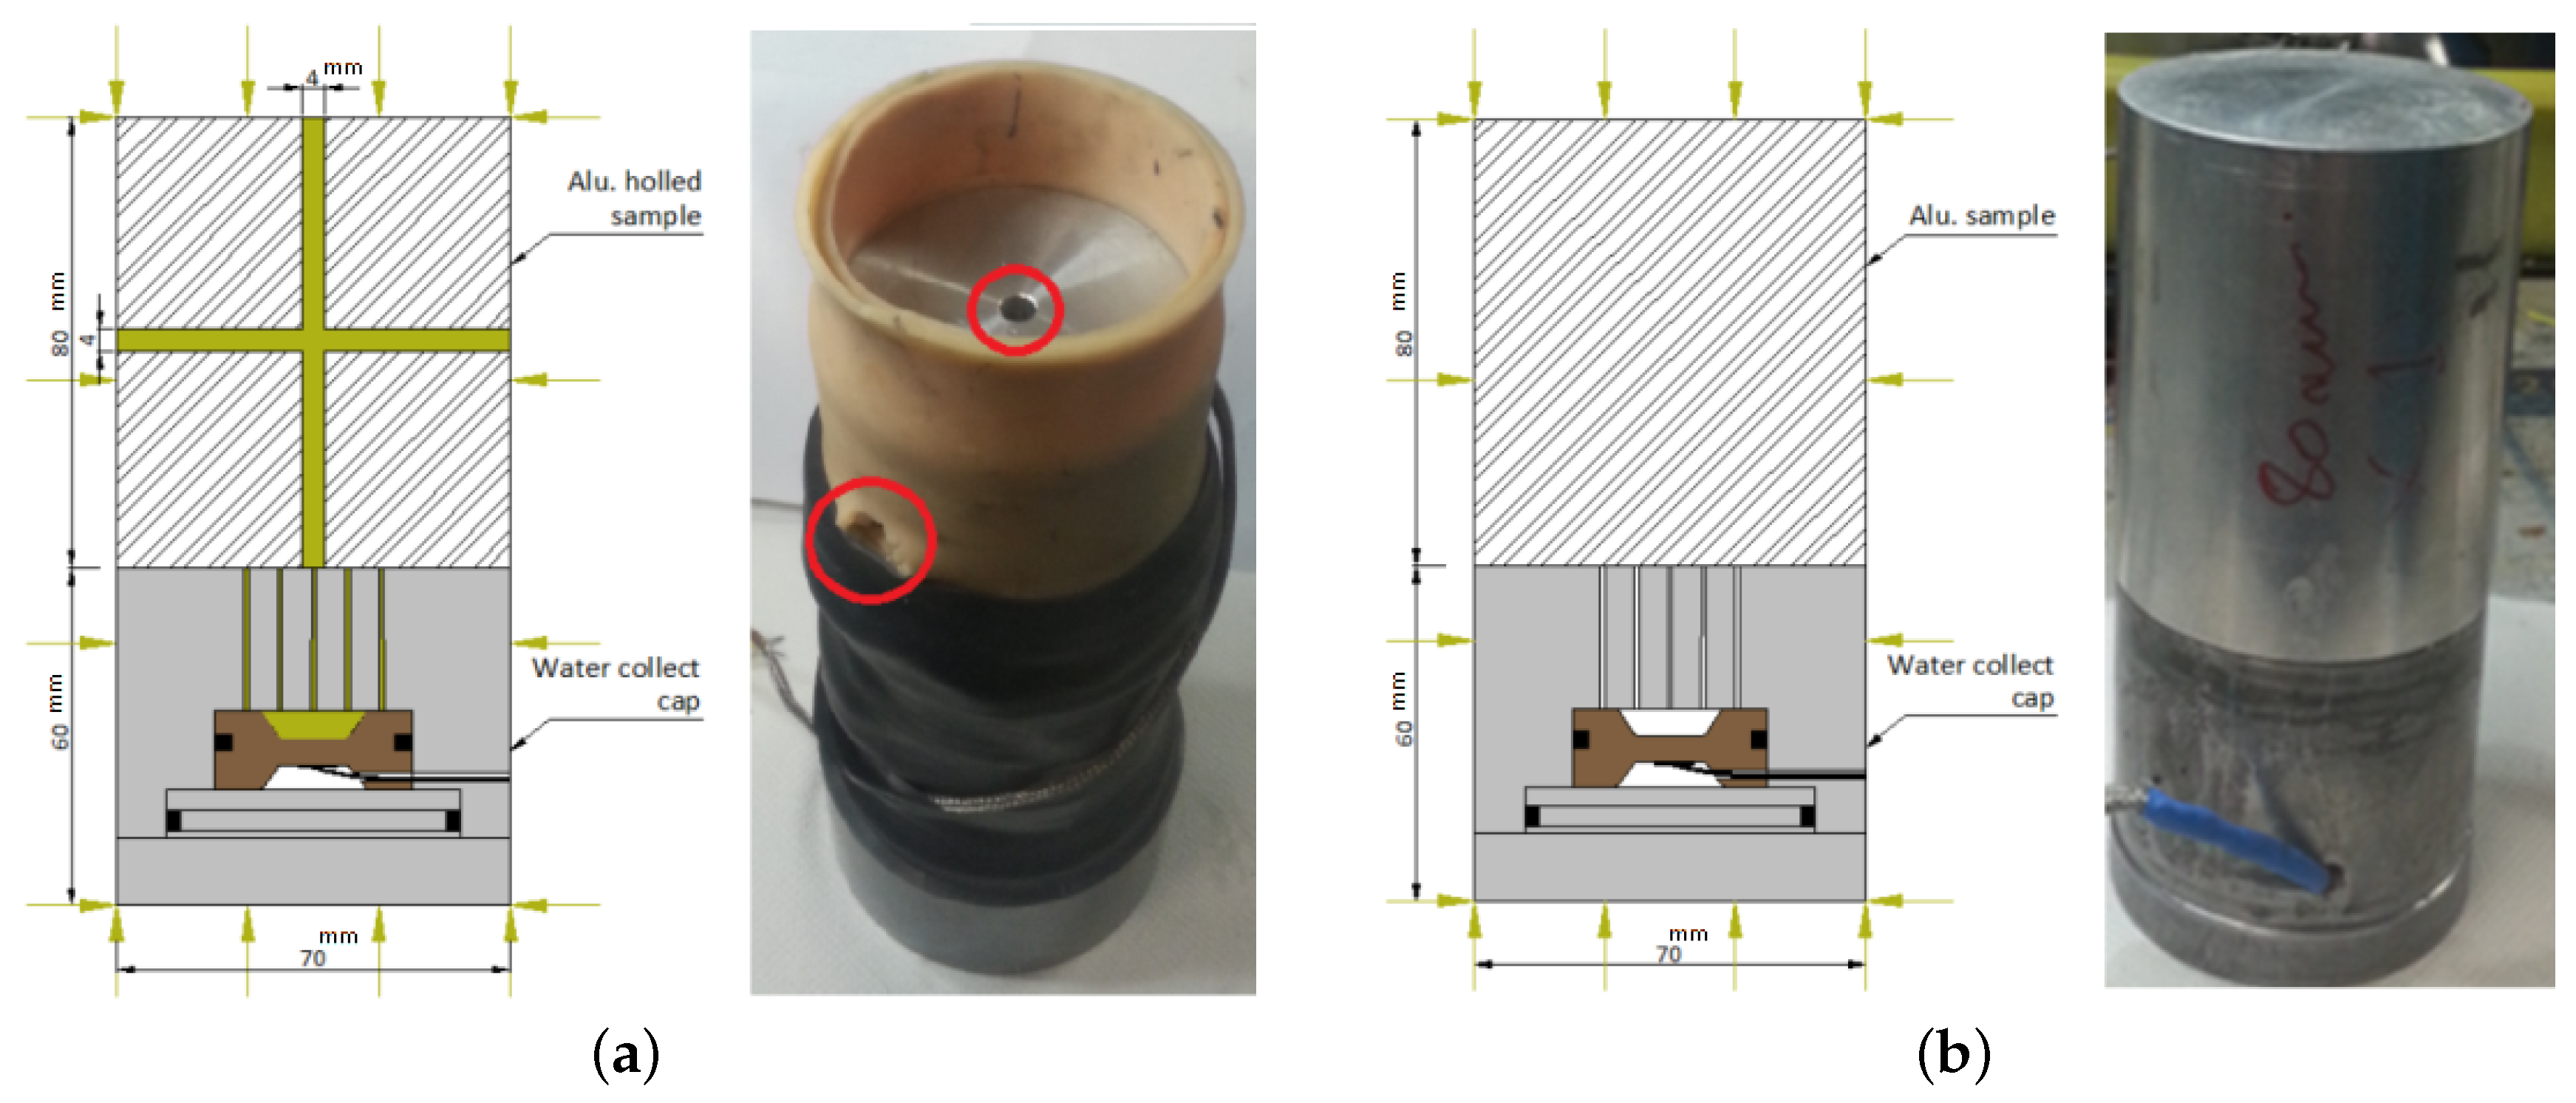
3.2.1. Geometry and Design
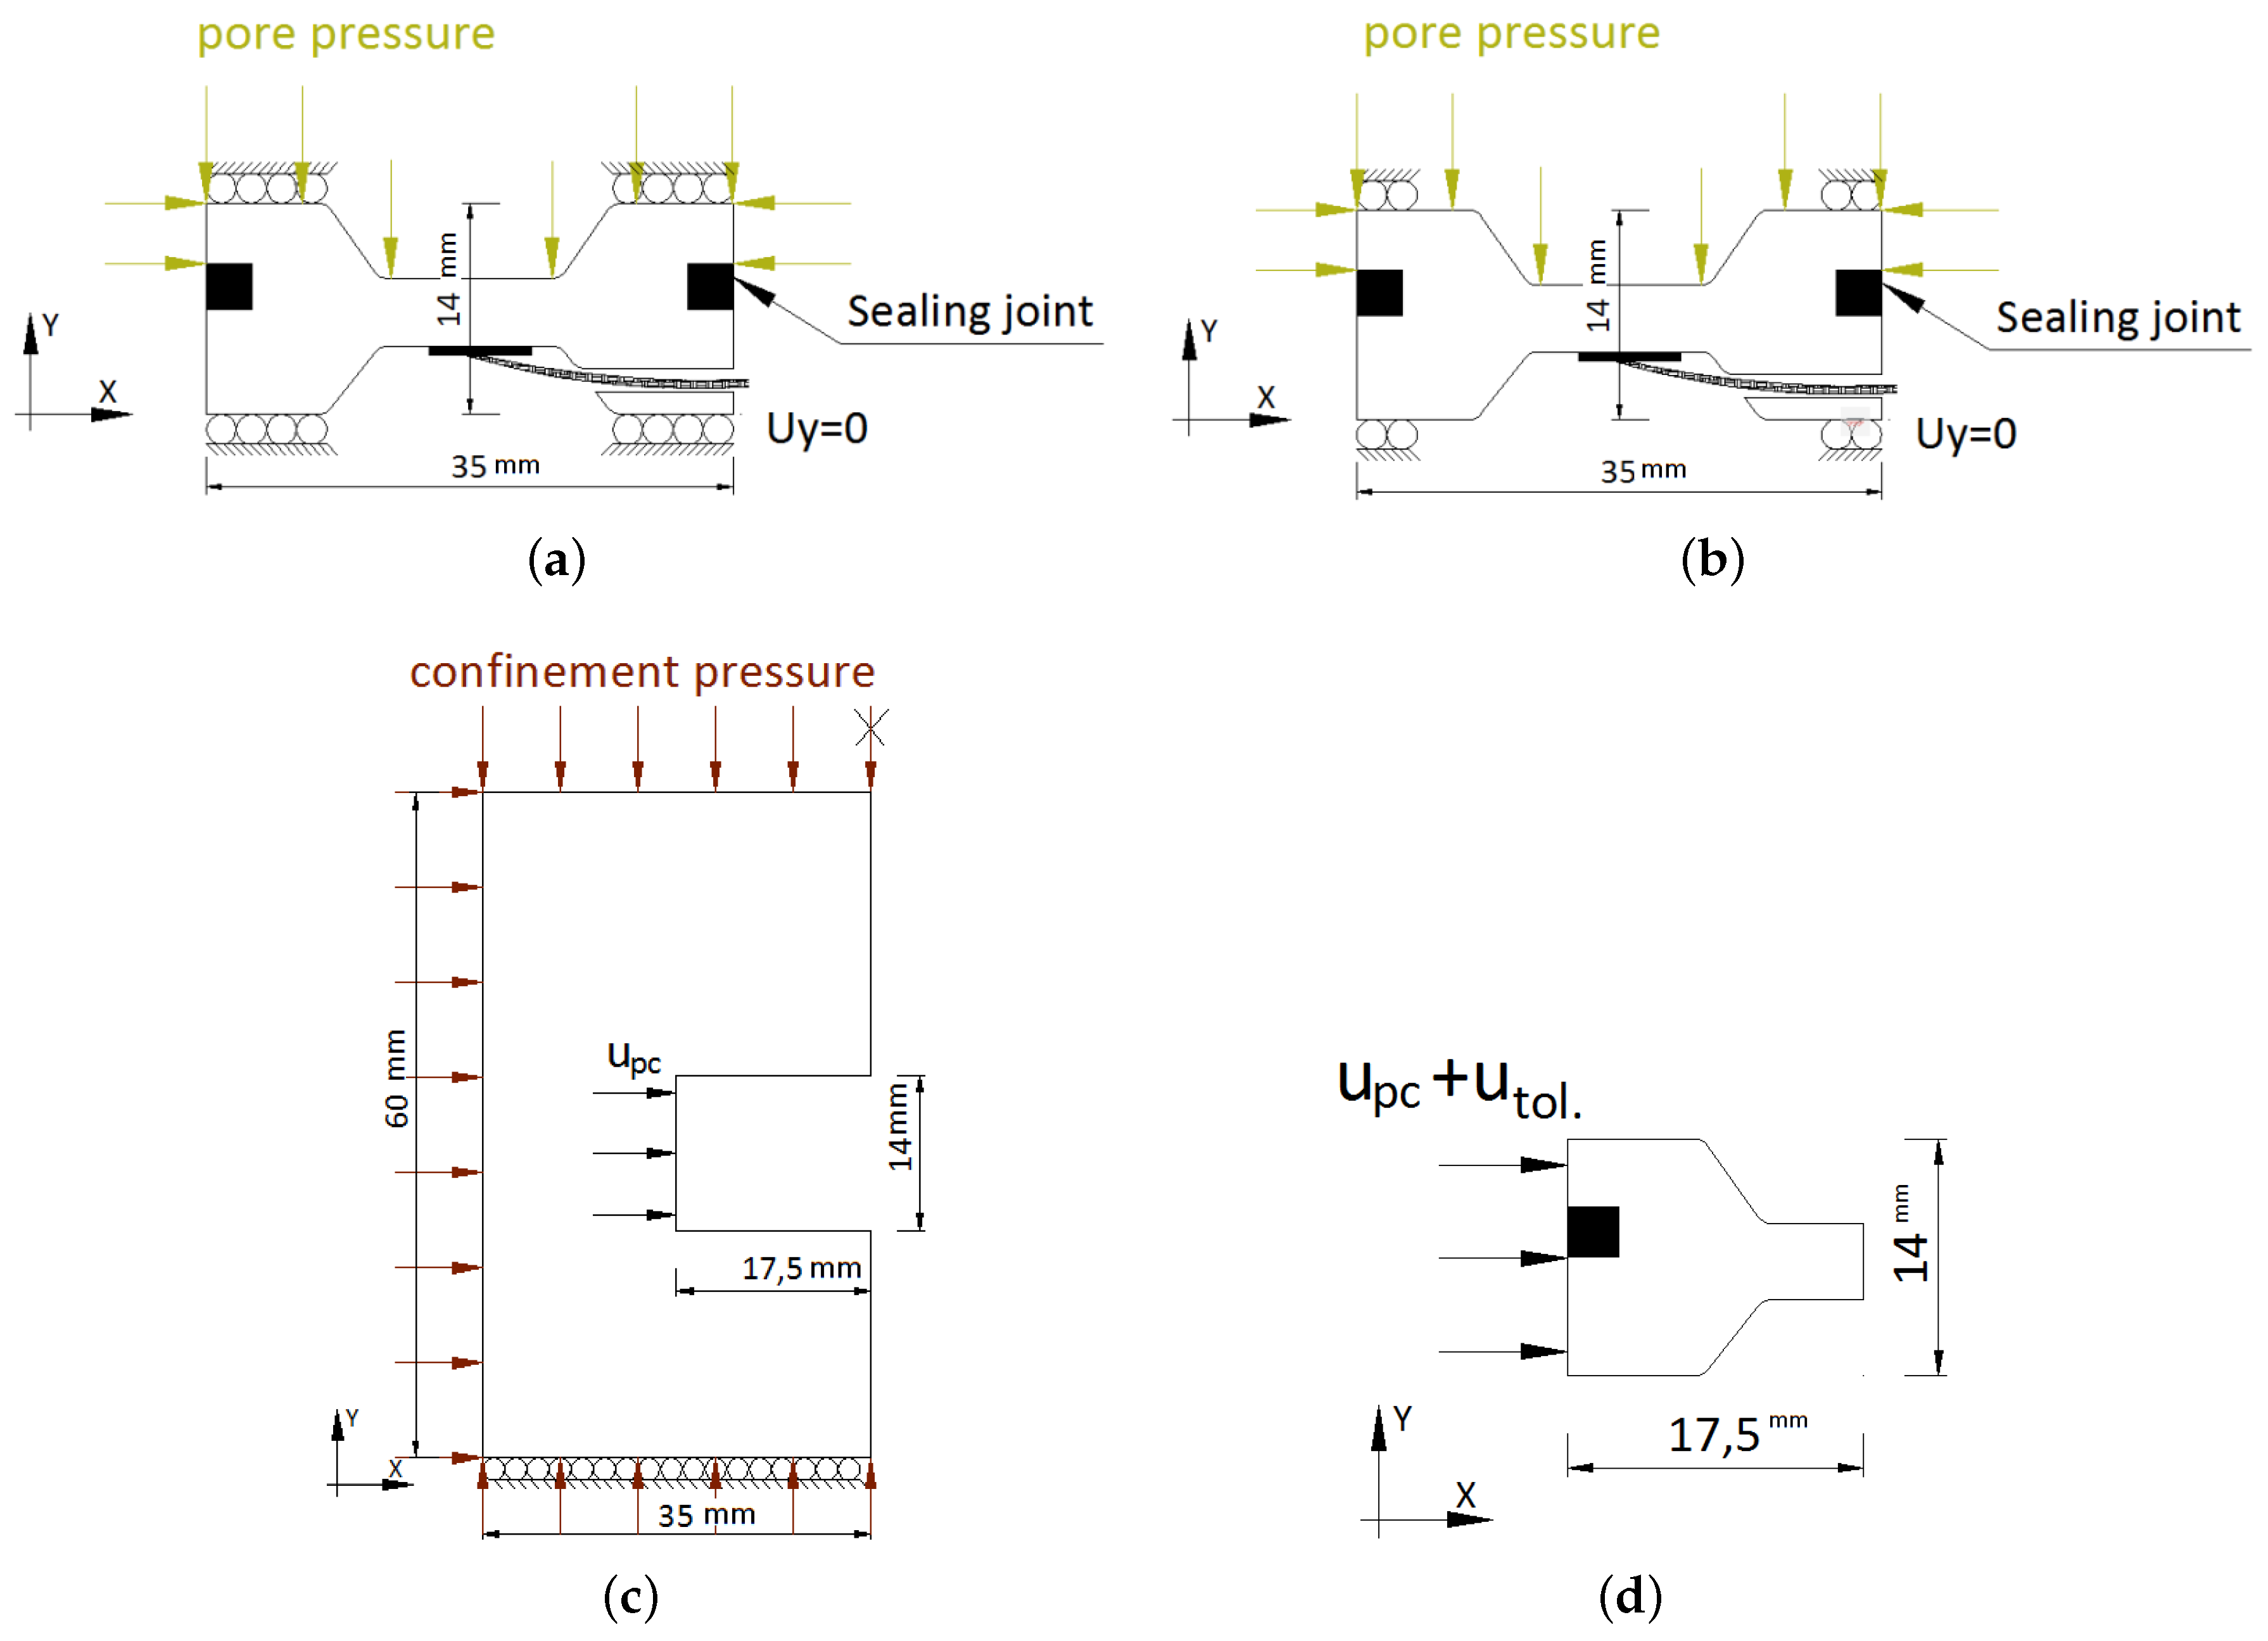
3.2.2. Loading and Boundary Conditions
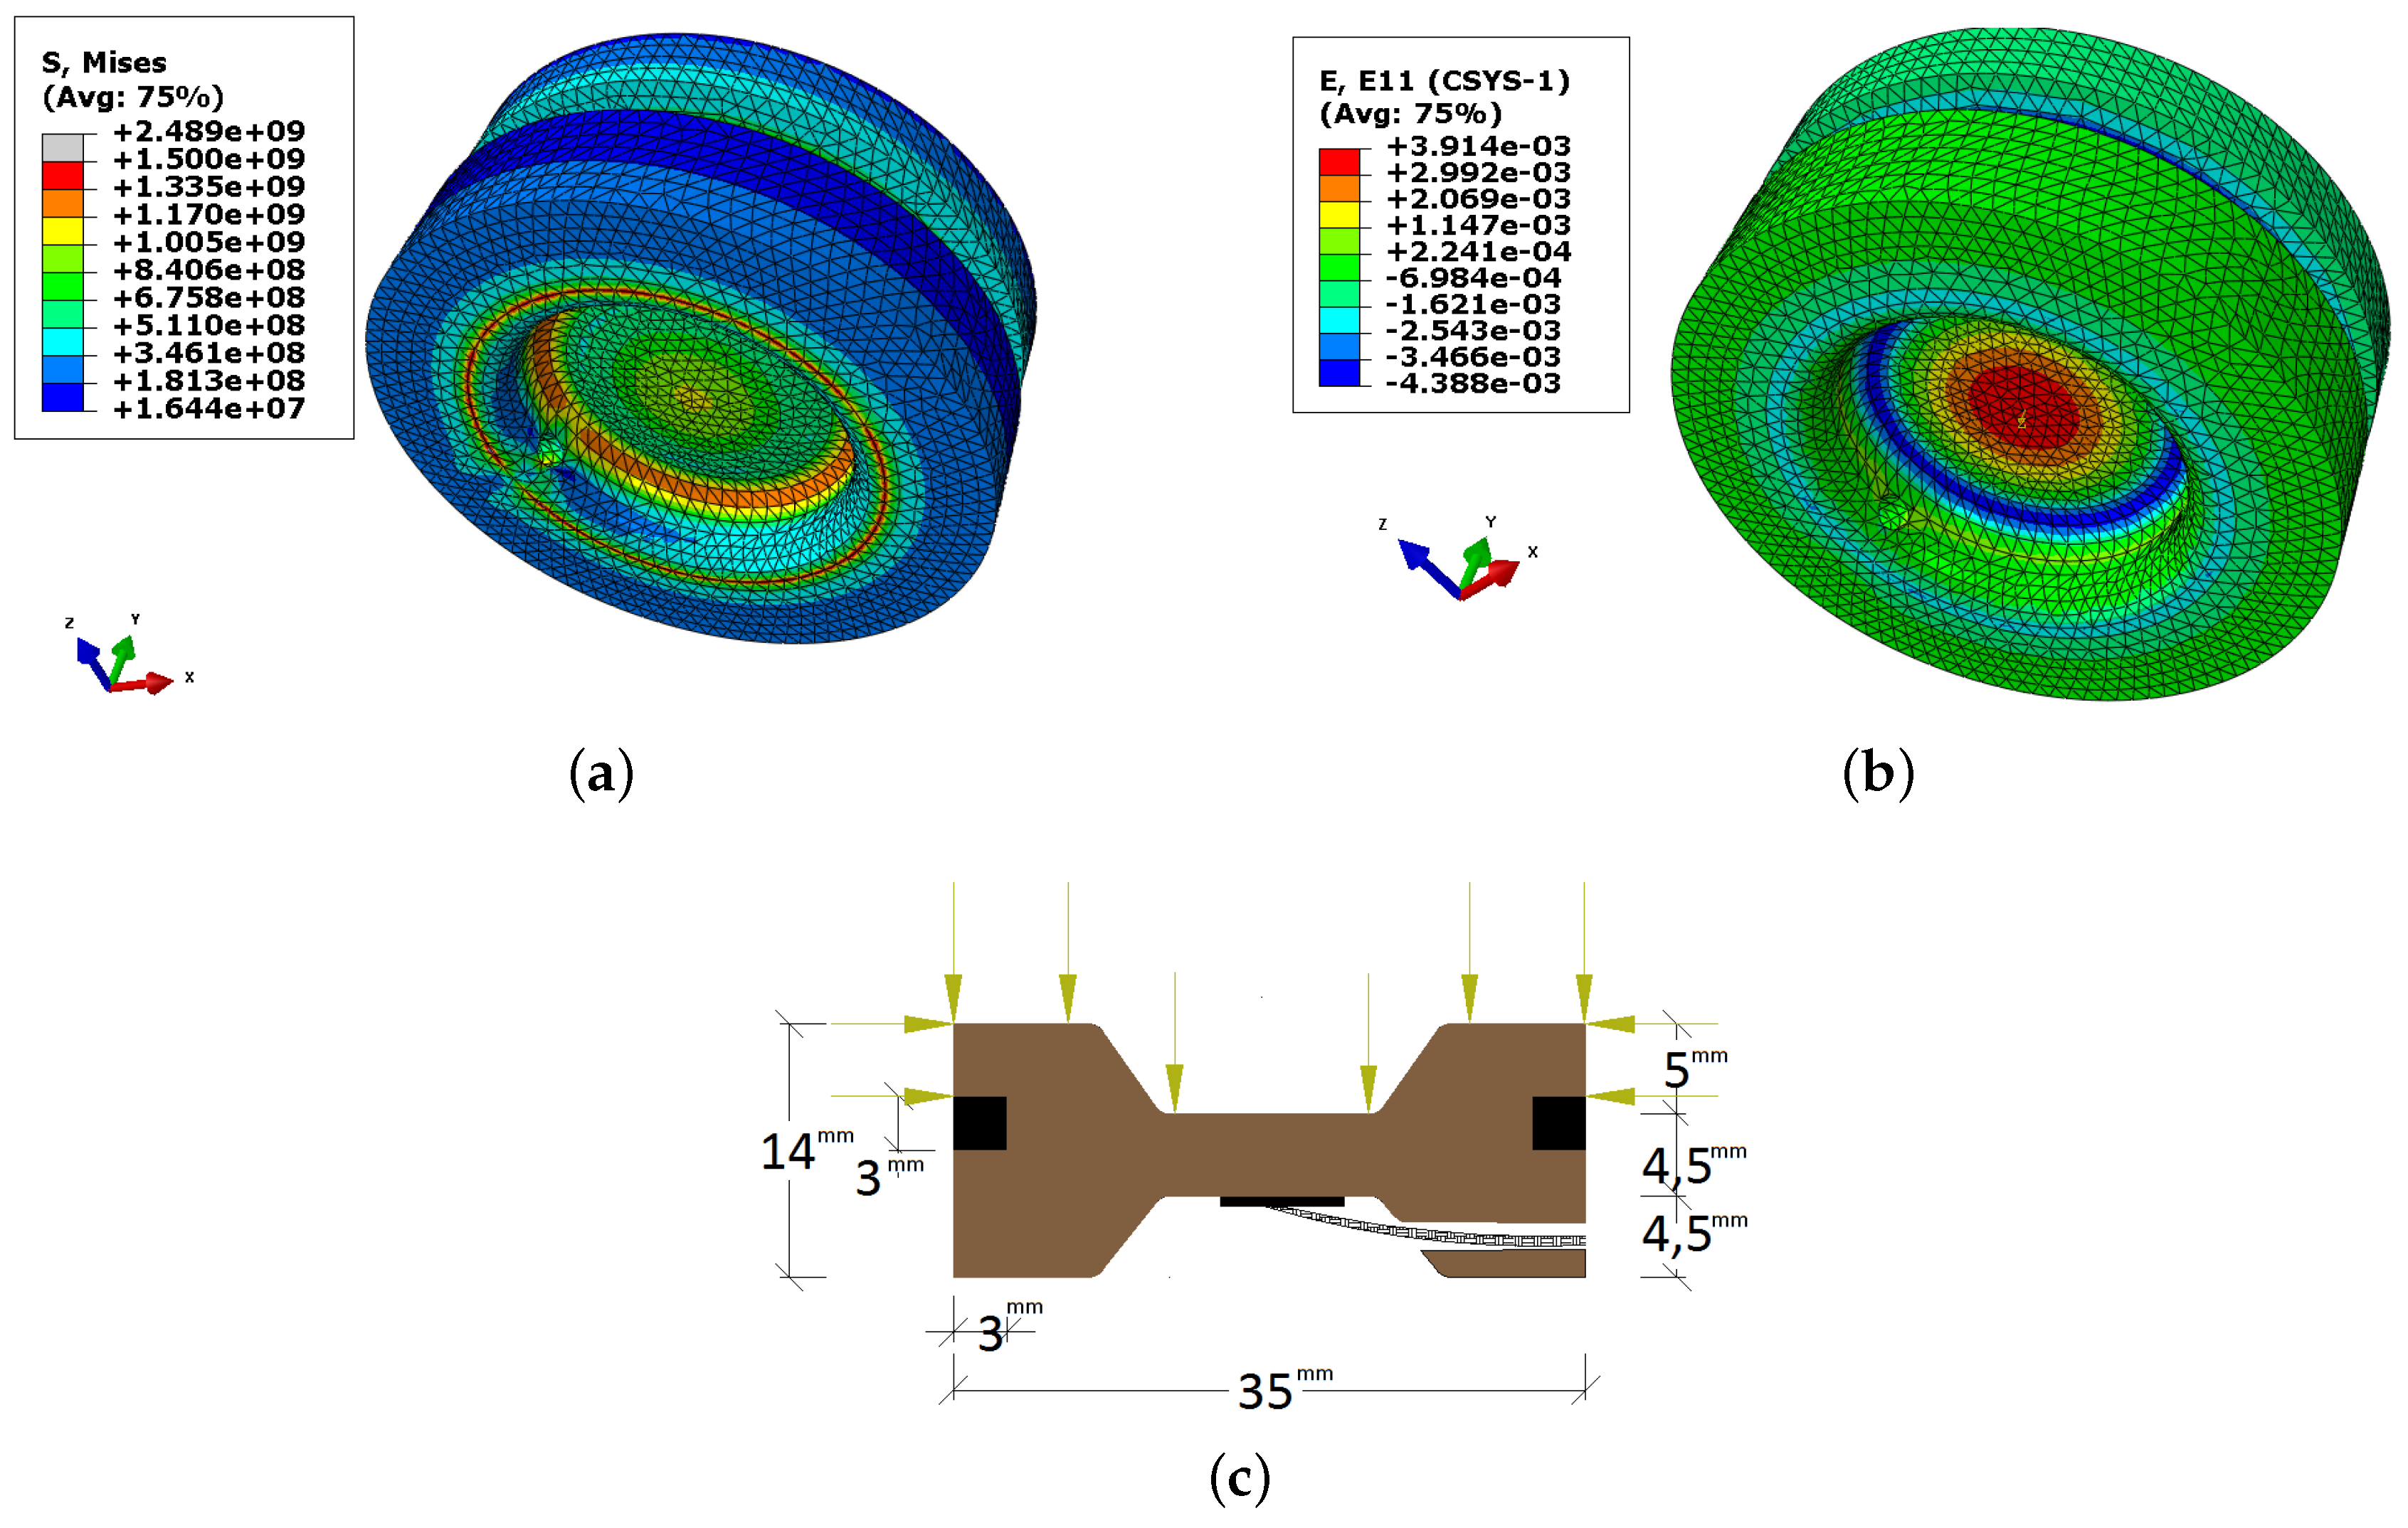
3.2.3. Effect of Interstitial Pore Pressure: Stress-Strain Analysis and Geometry Validation
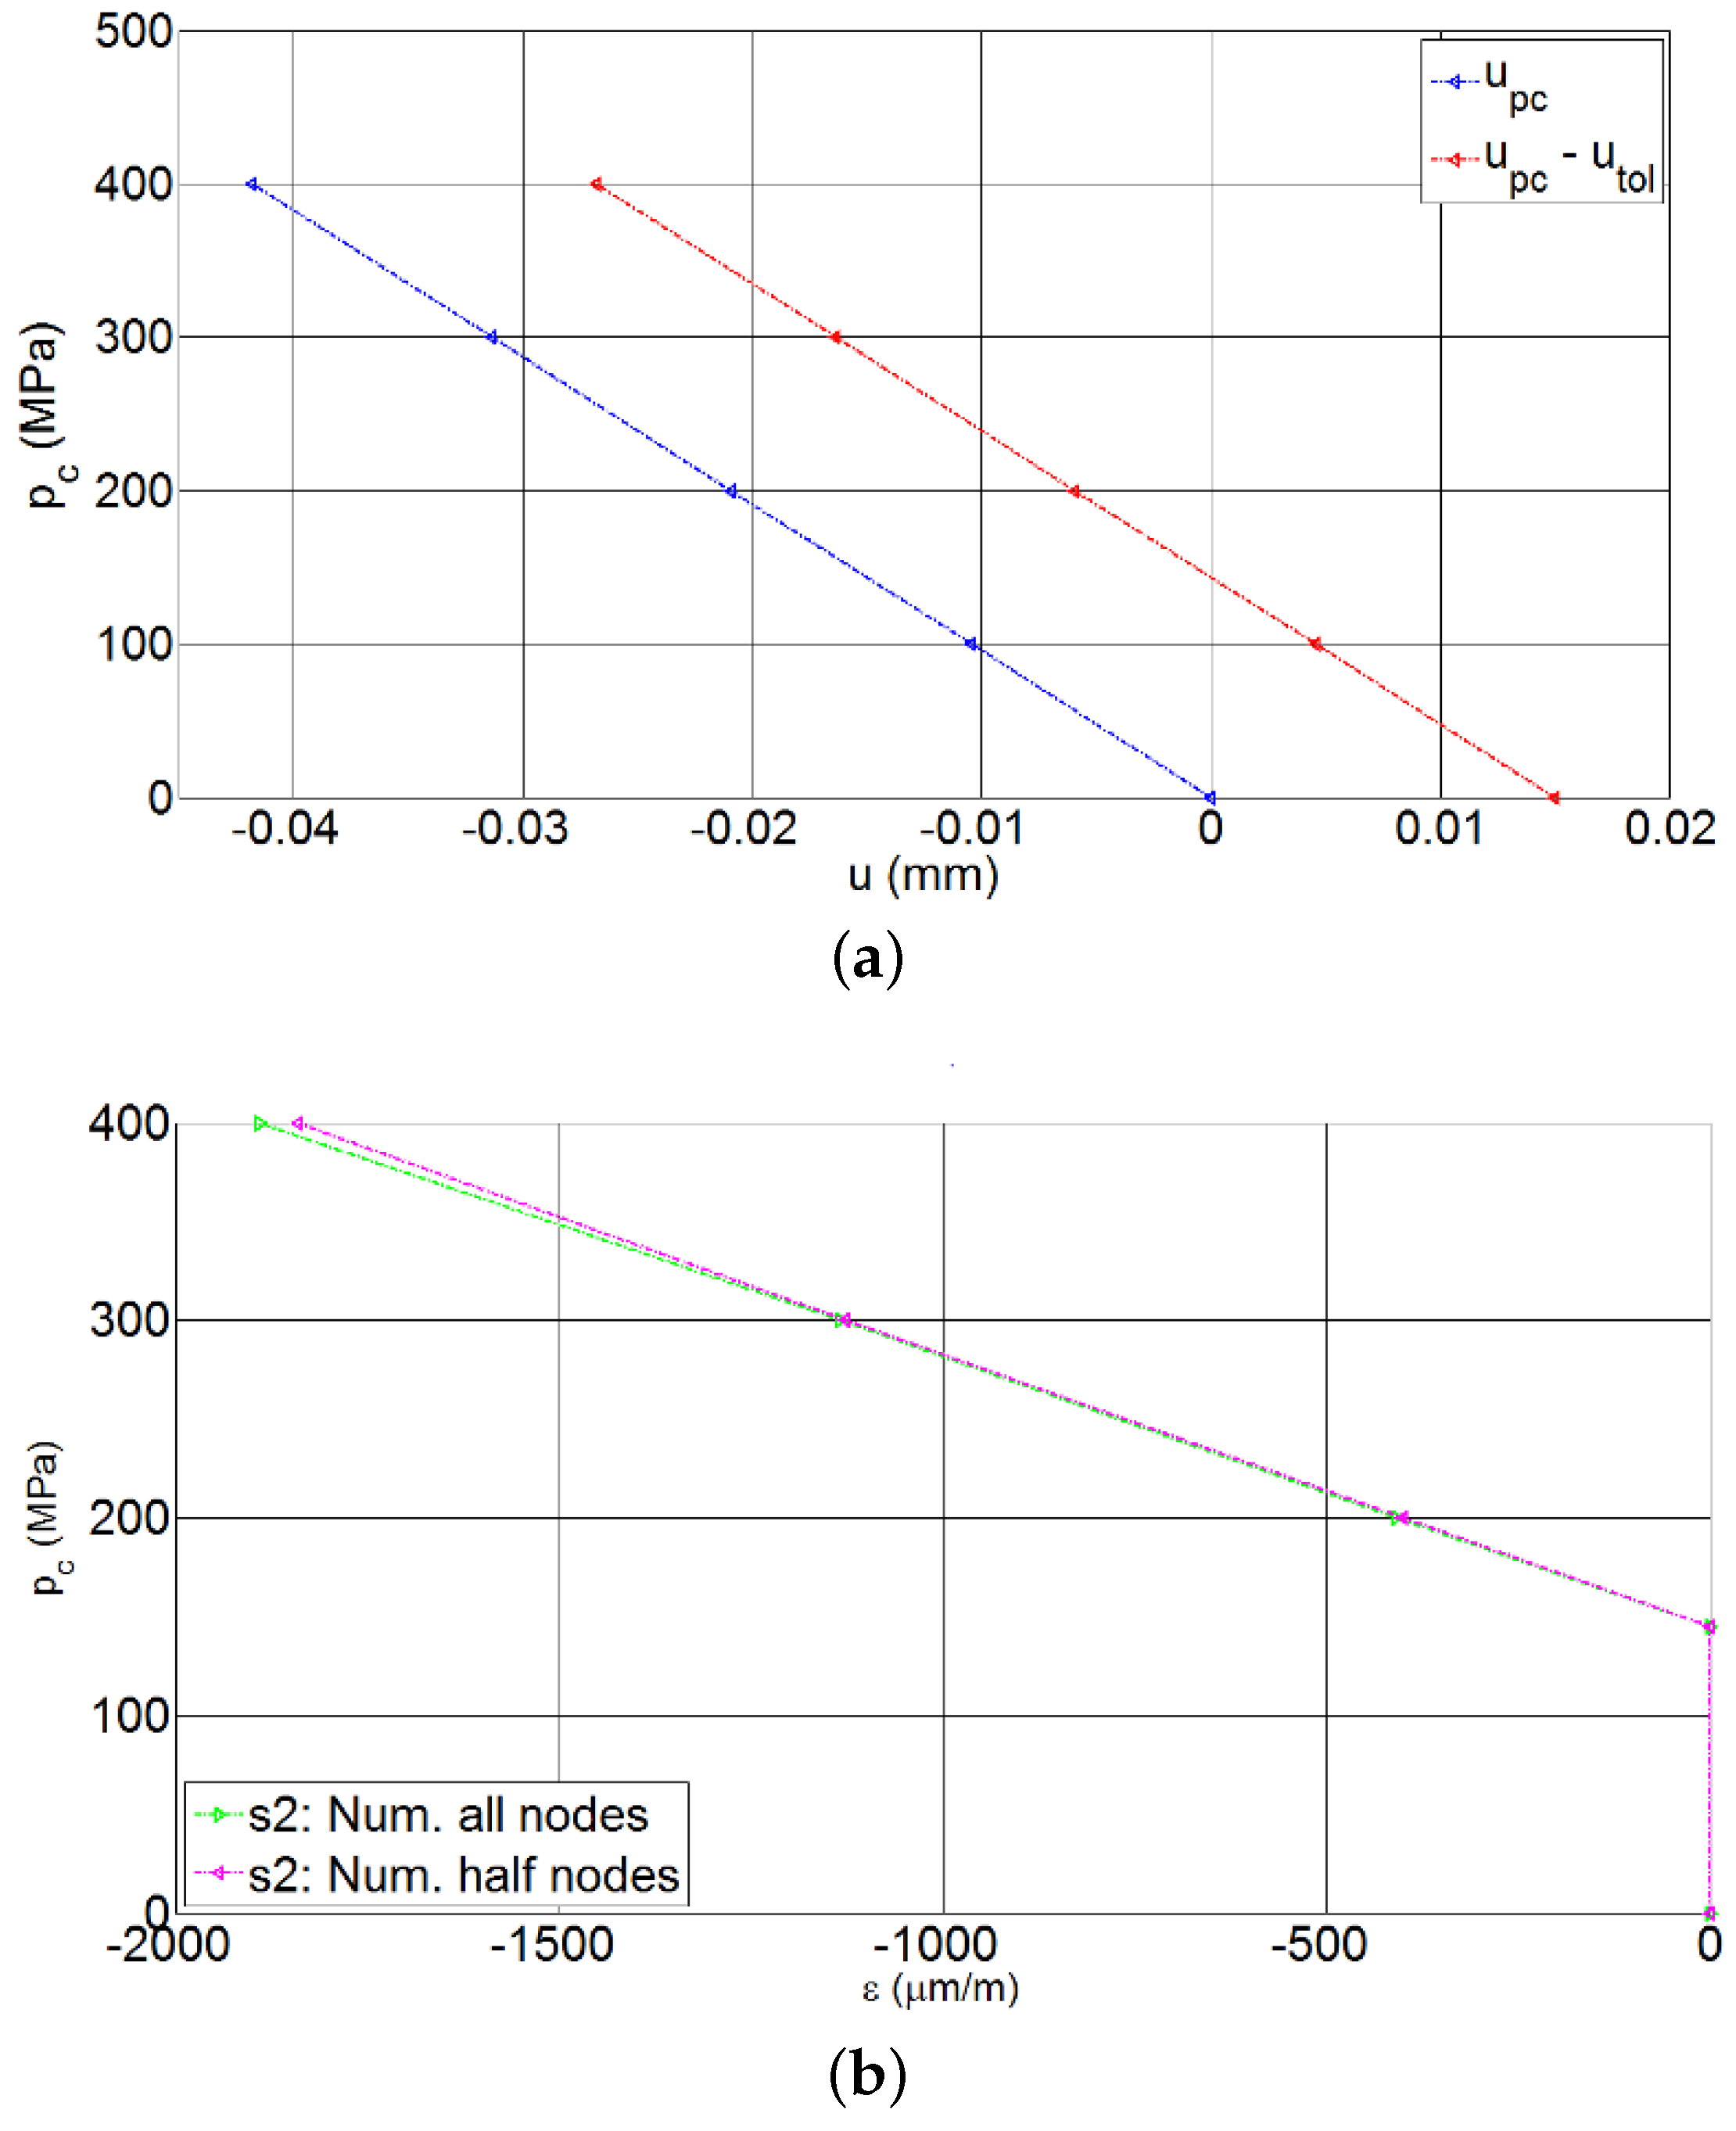
3.2.4. Effect of the Confining Pressure on the Sensor
4. Sensors Calibration Tests
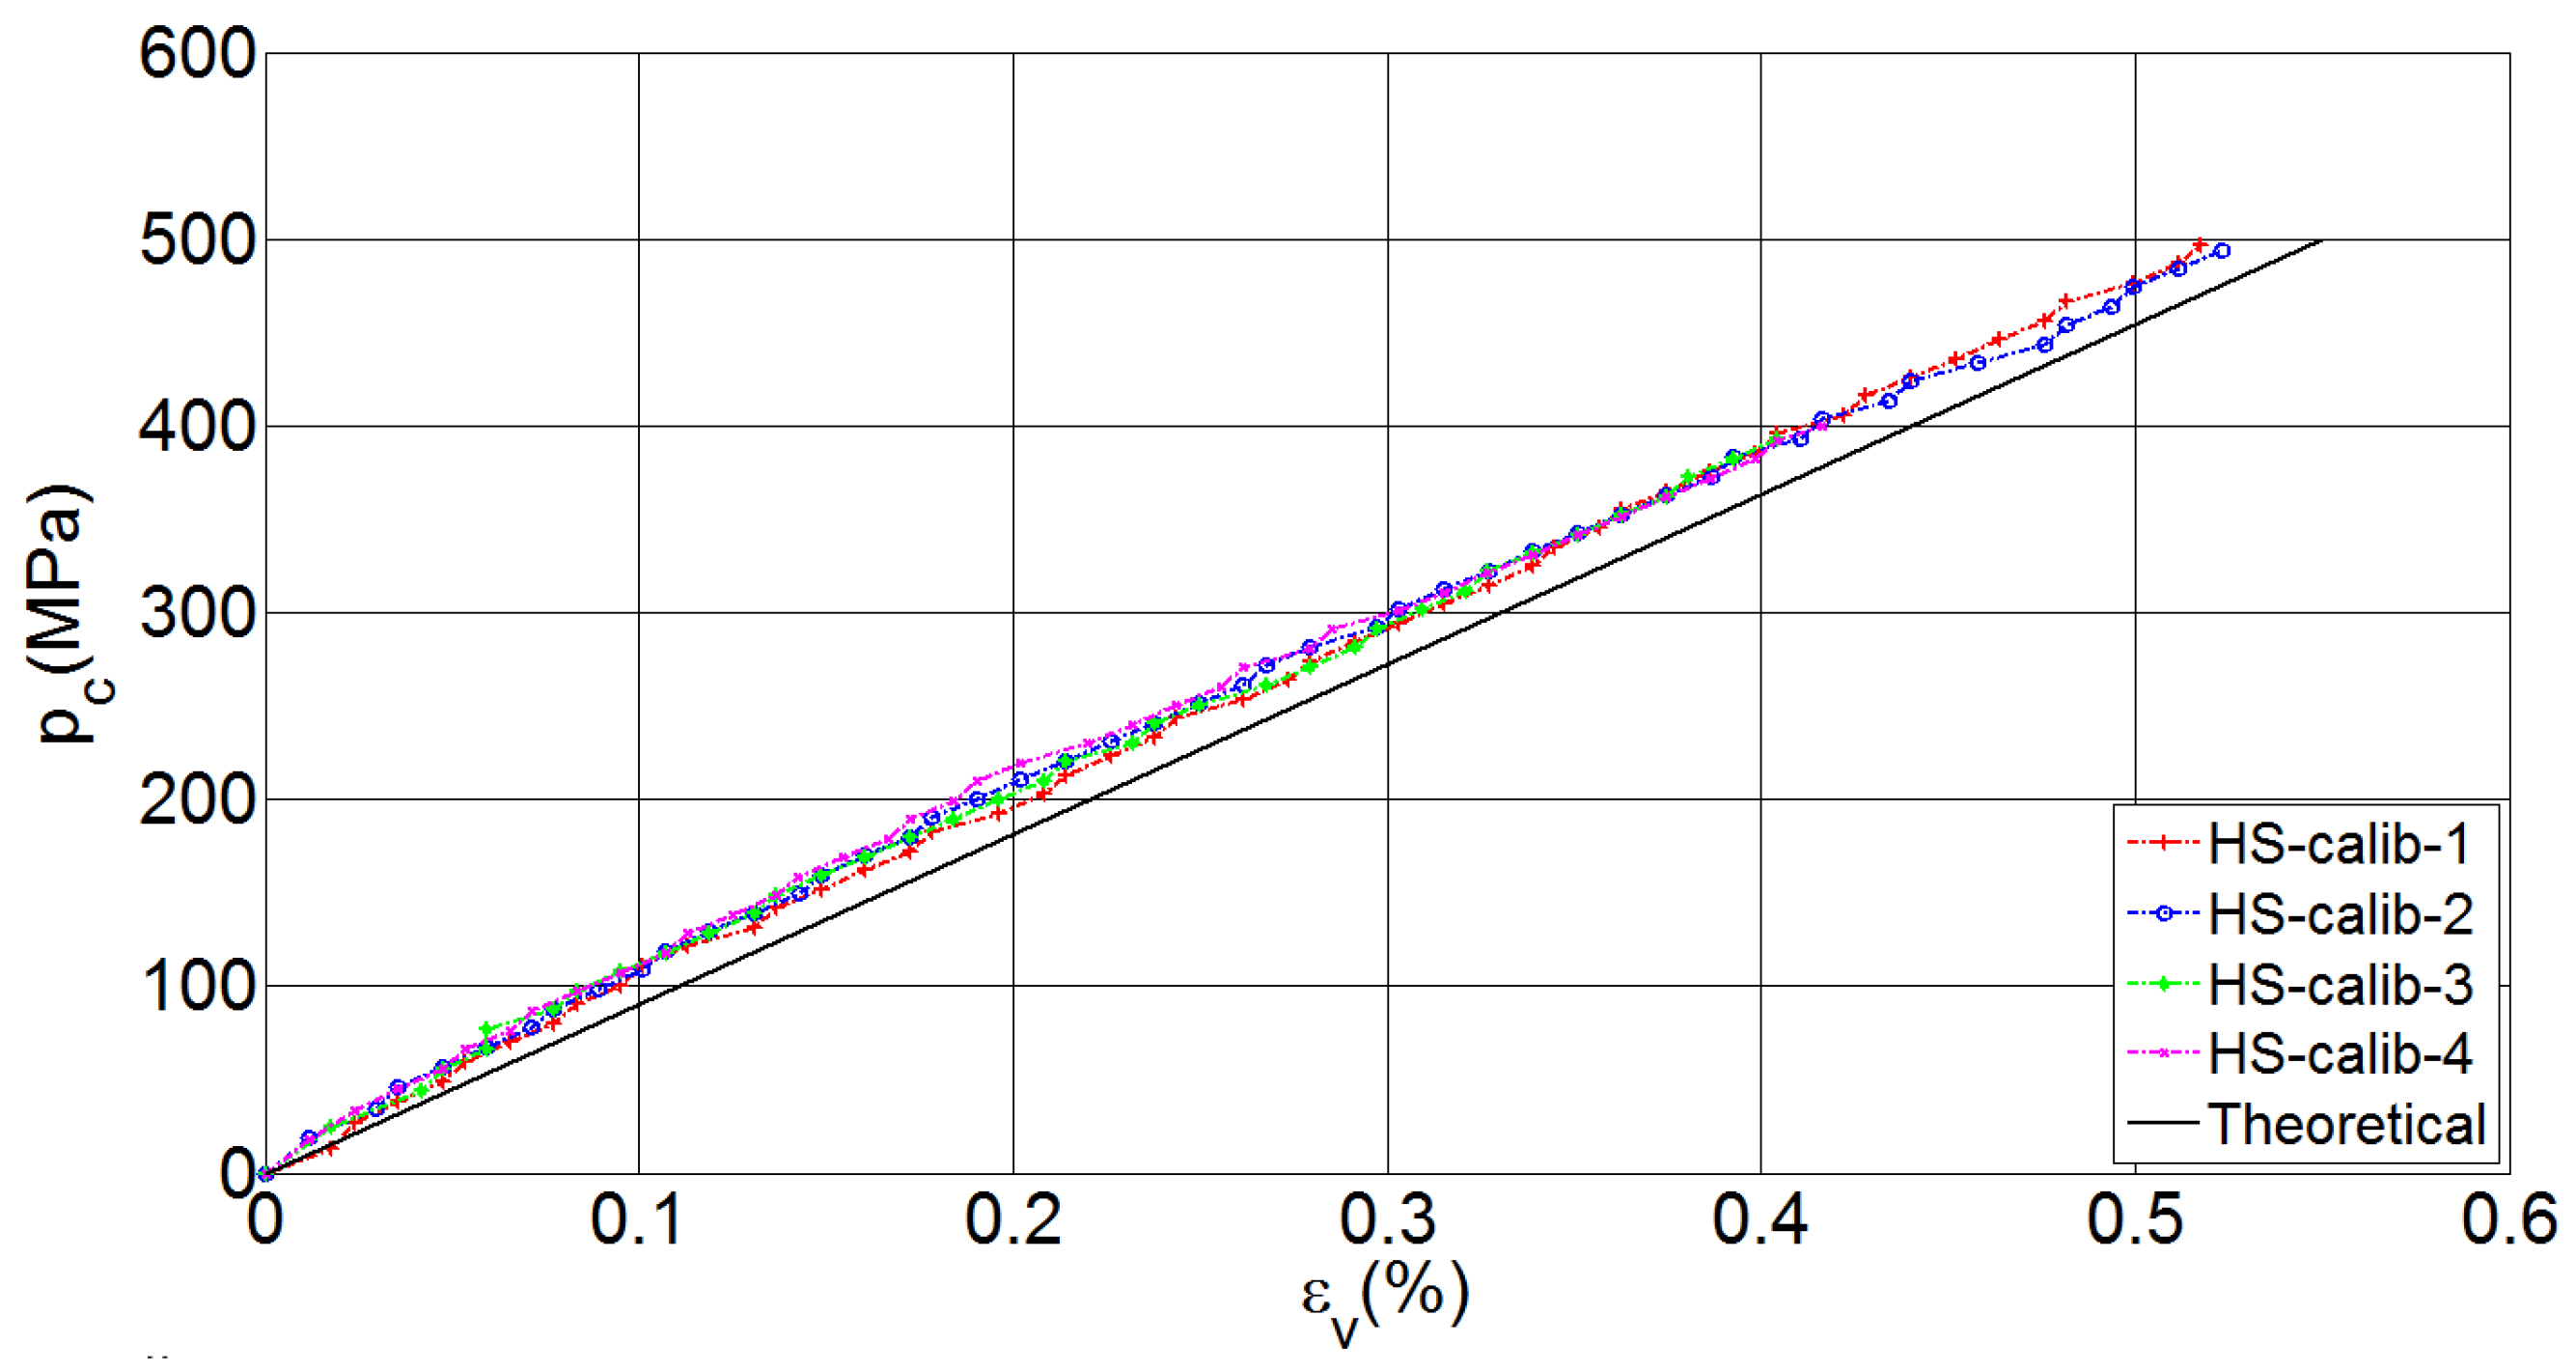
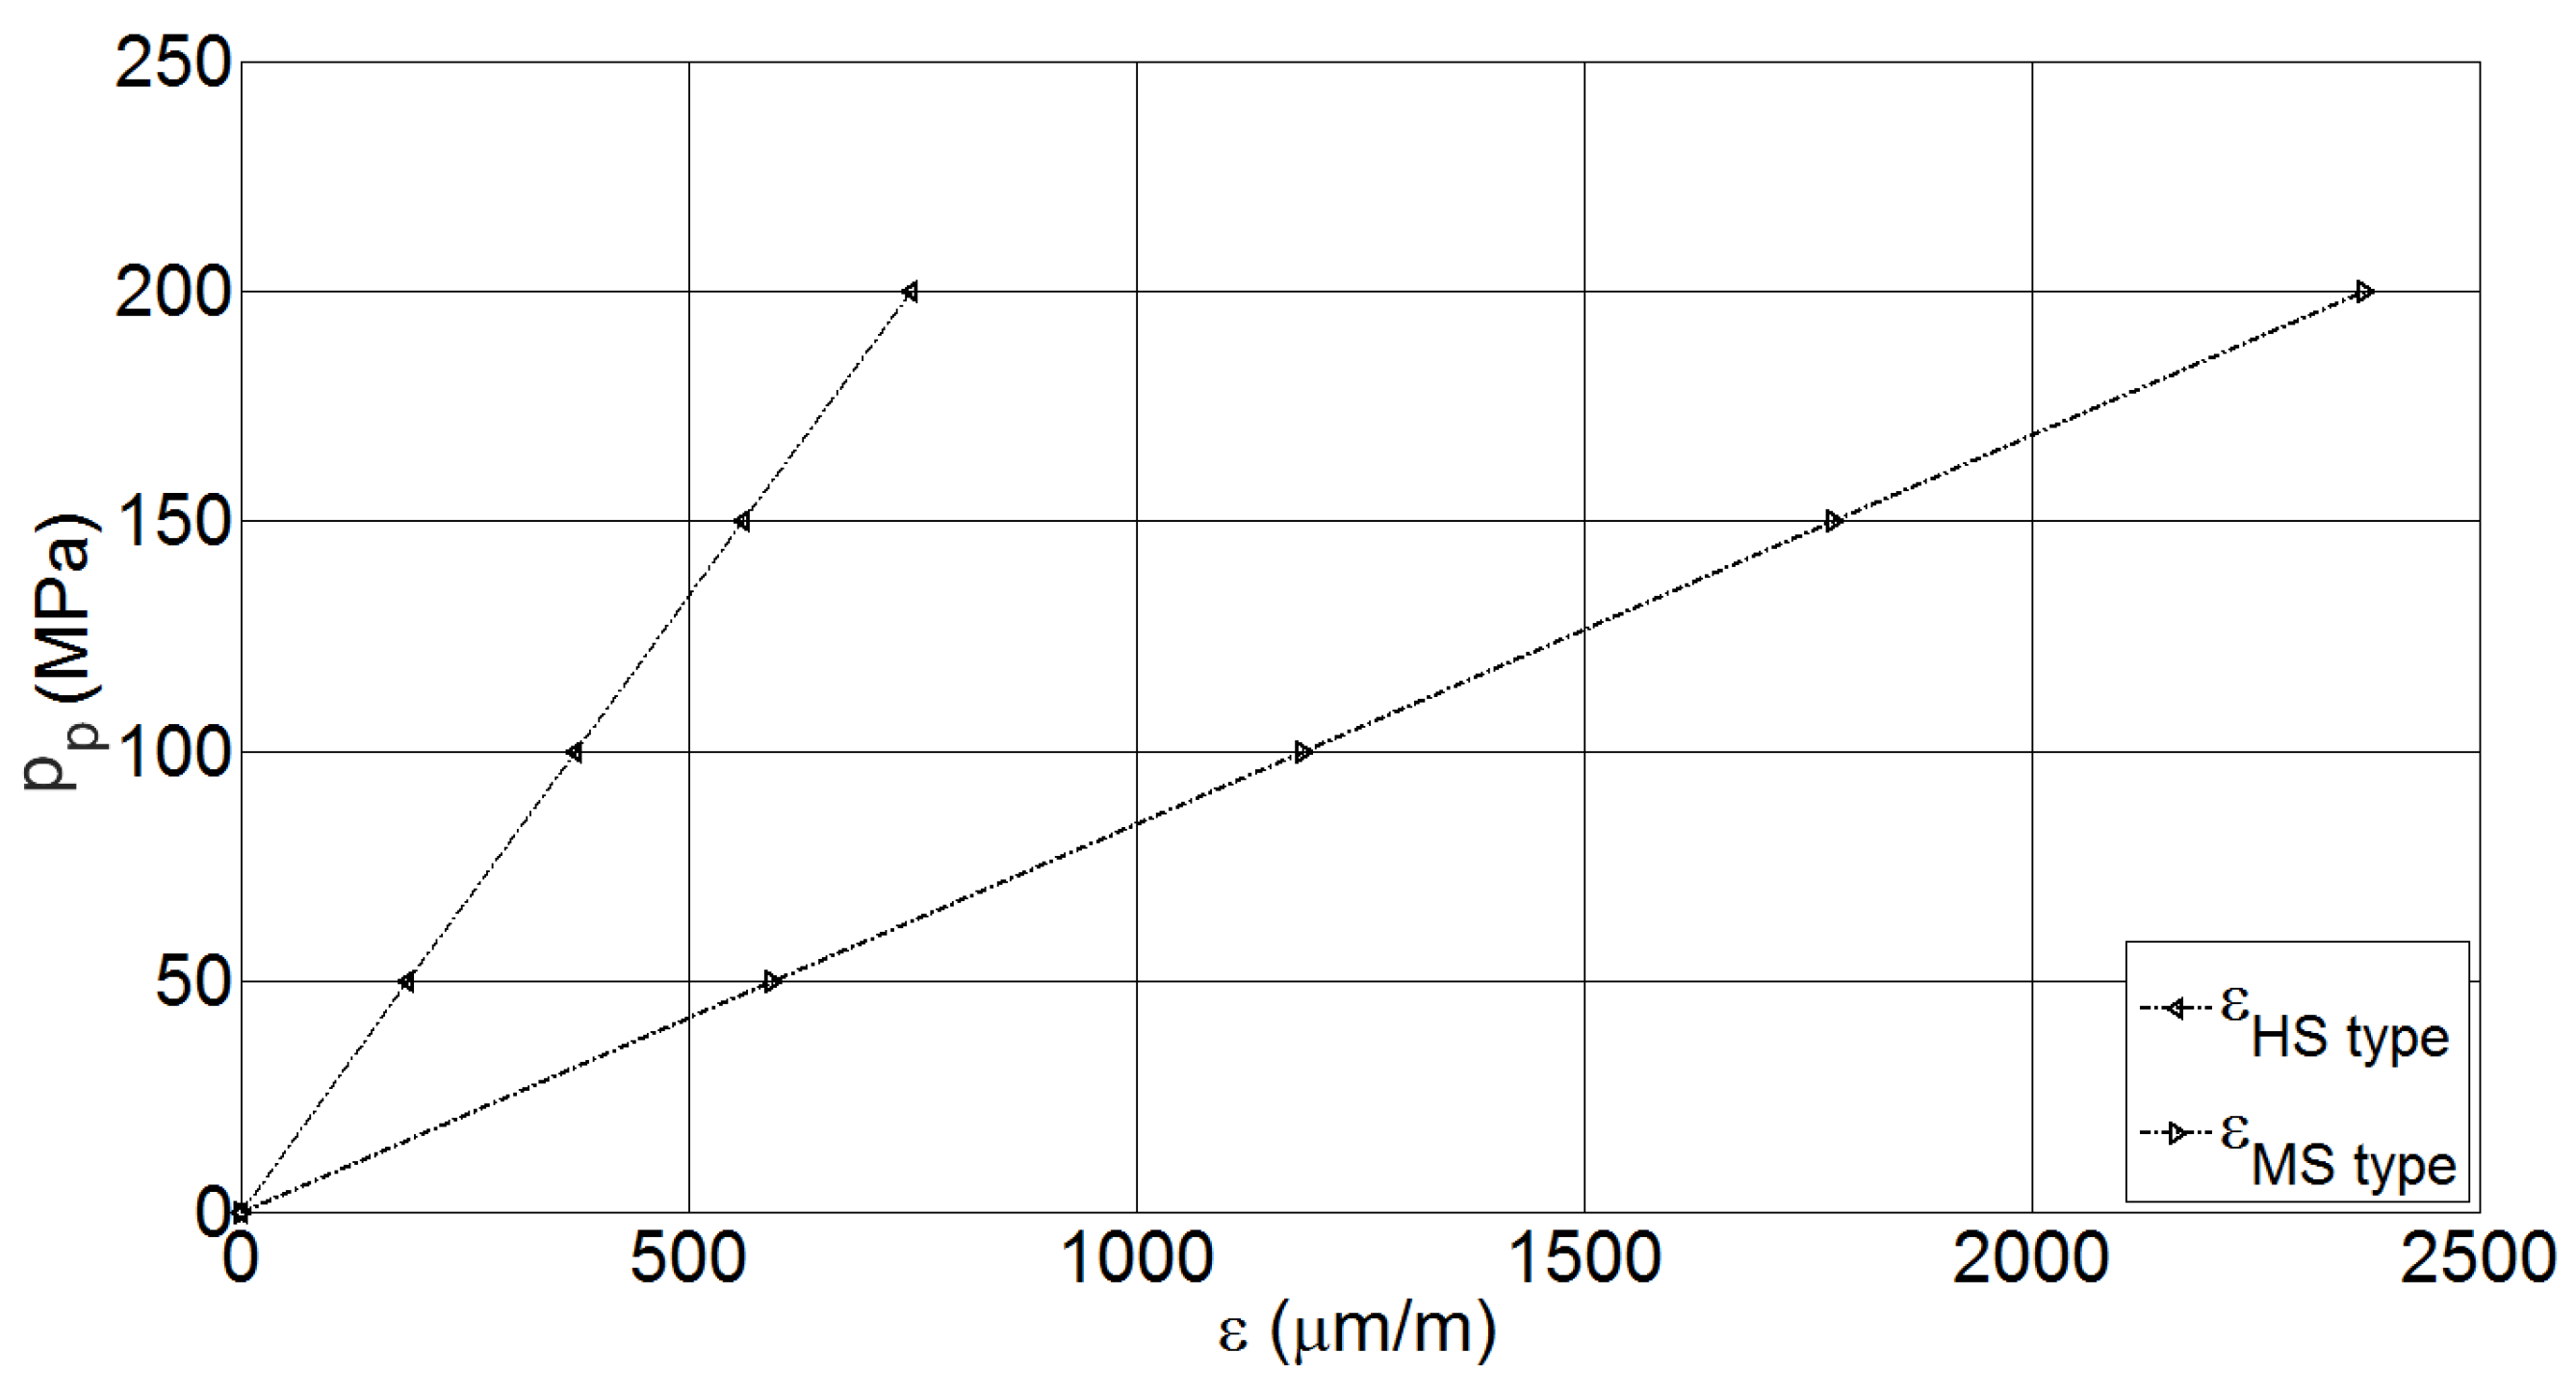
4.1. HS Calibration
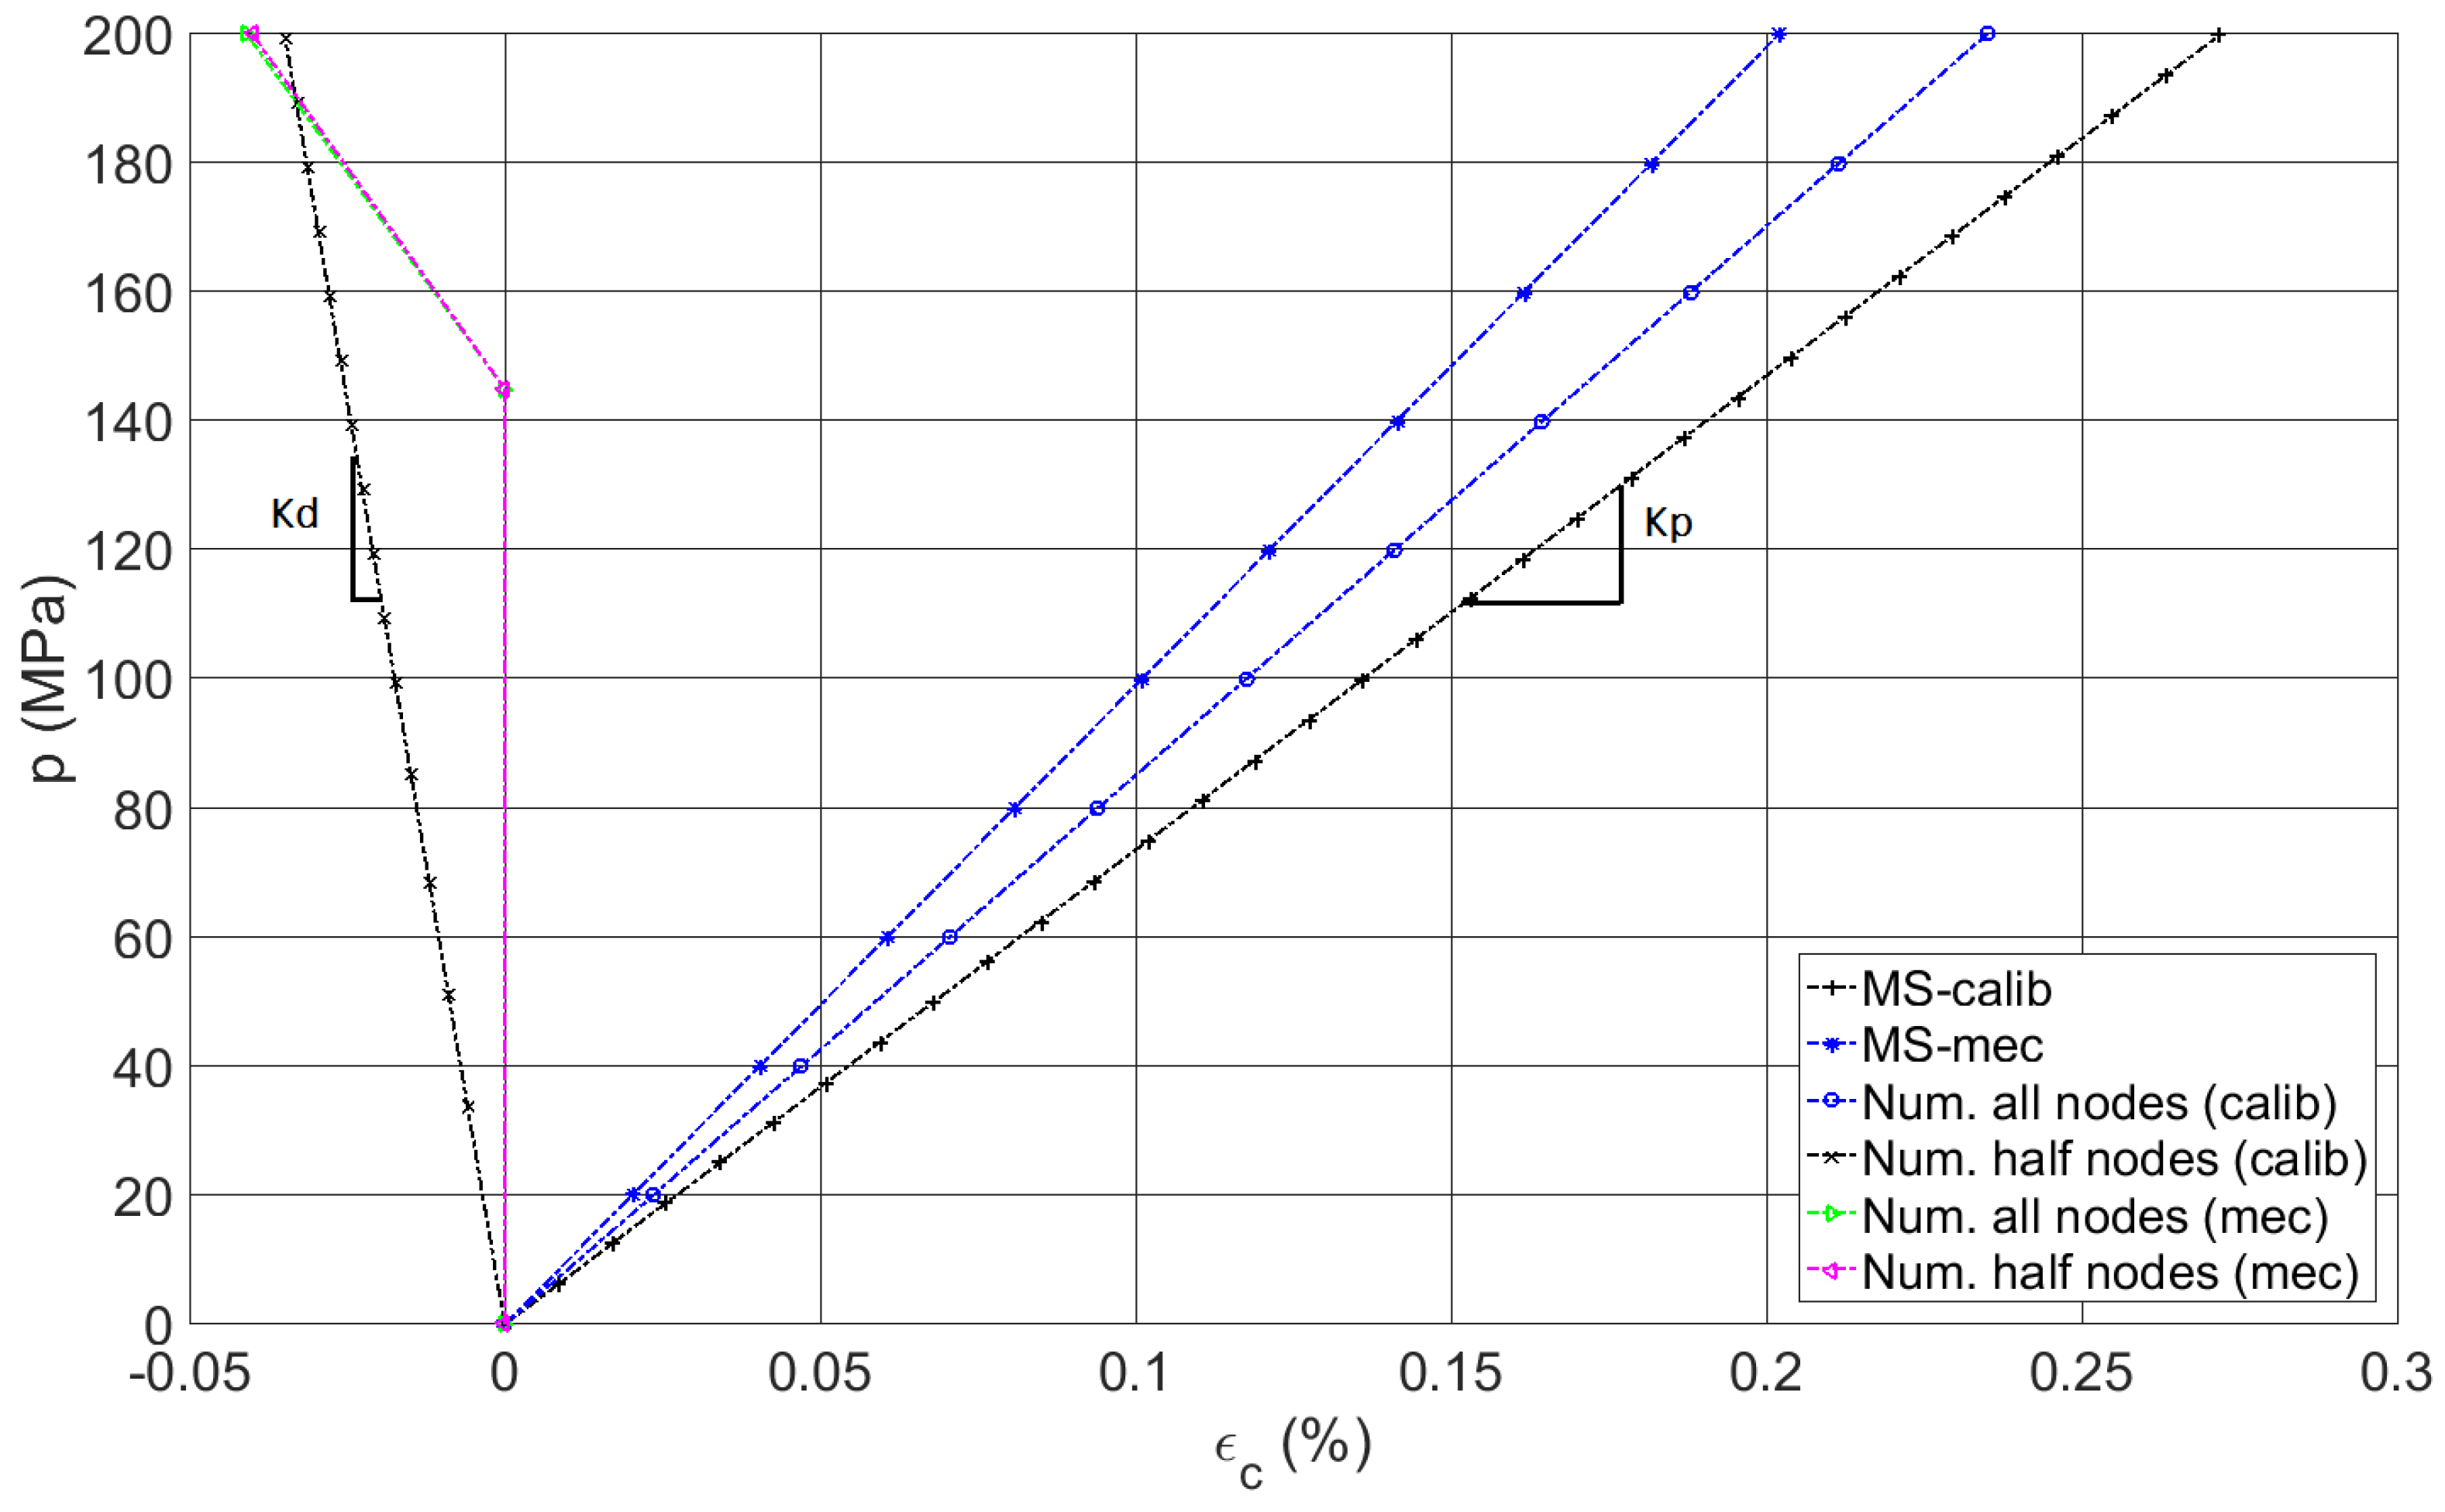
4.2. MS Calibration
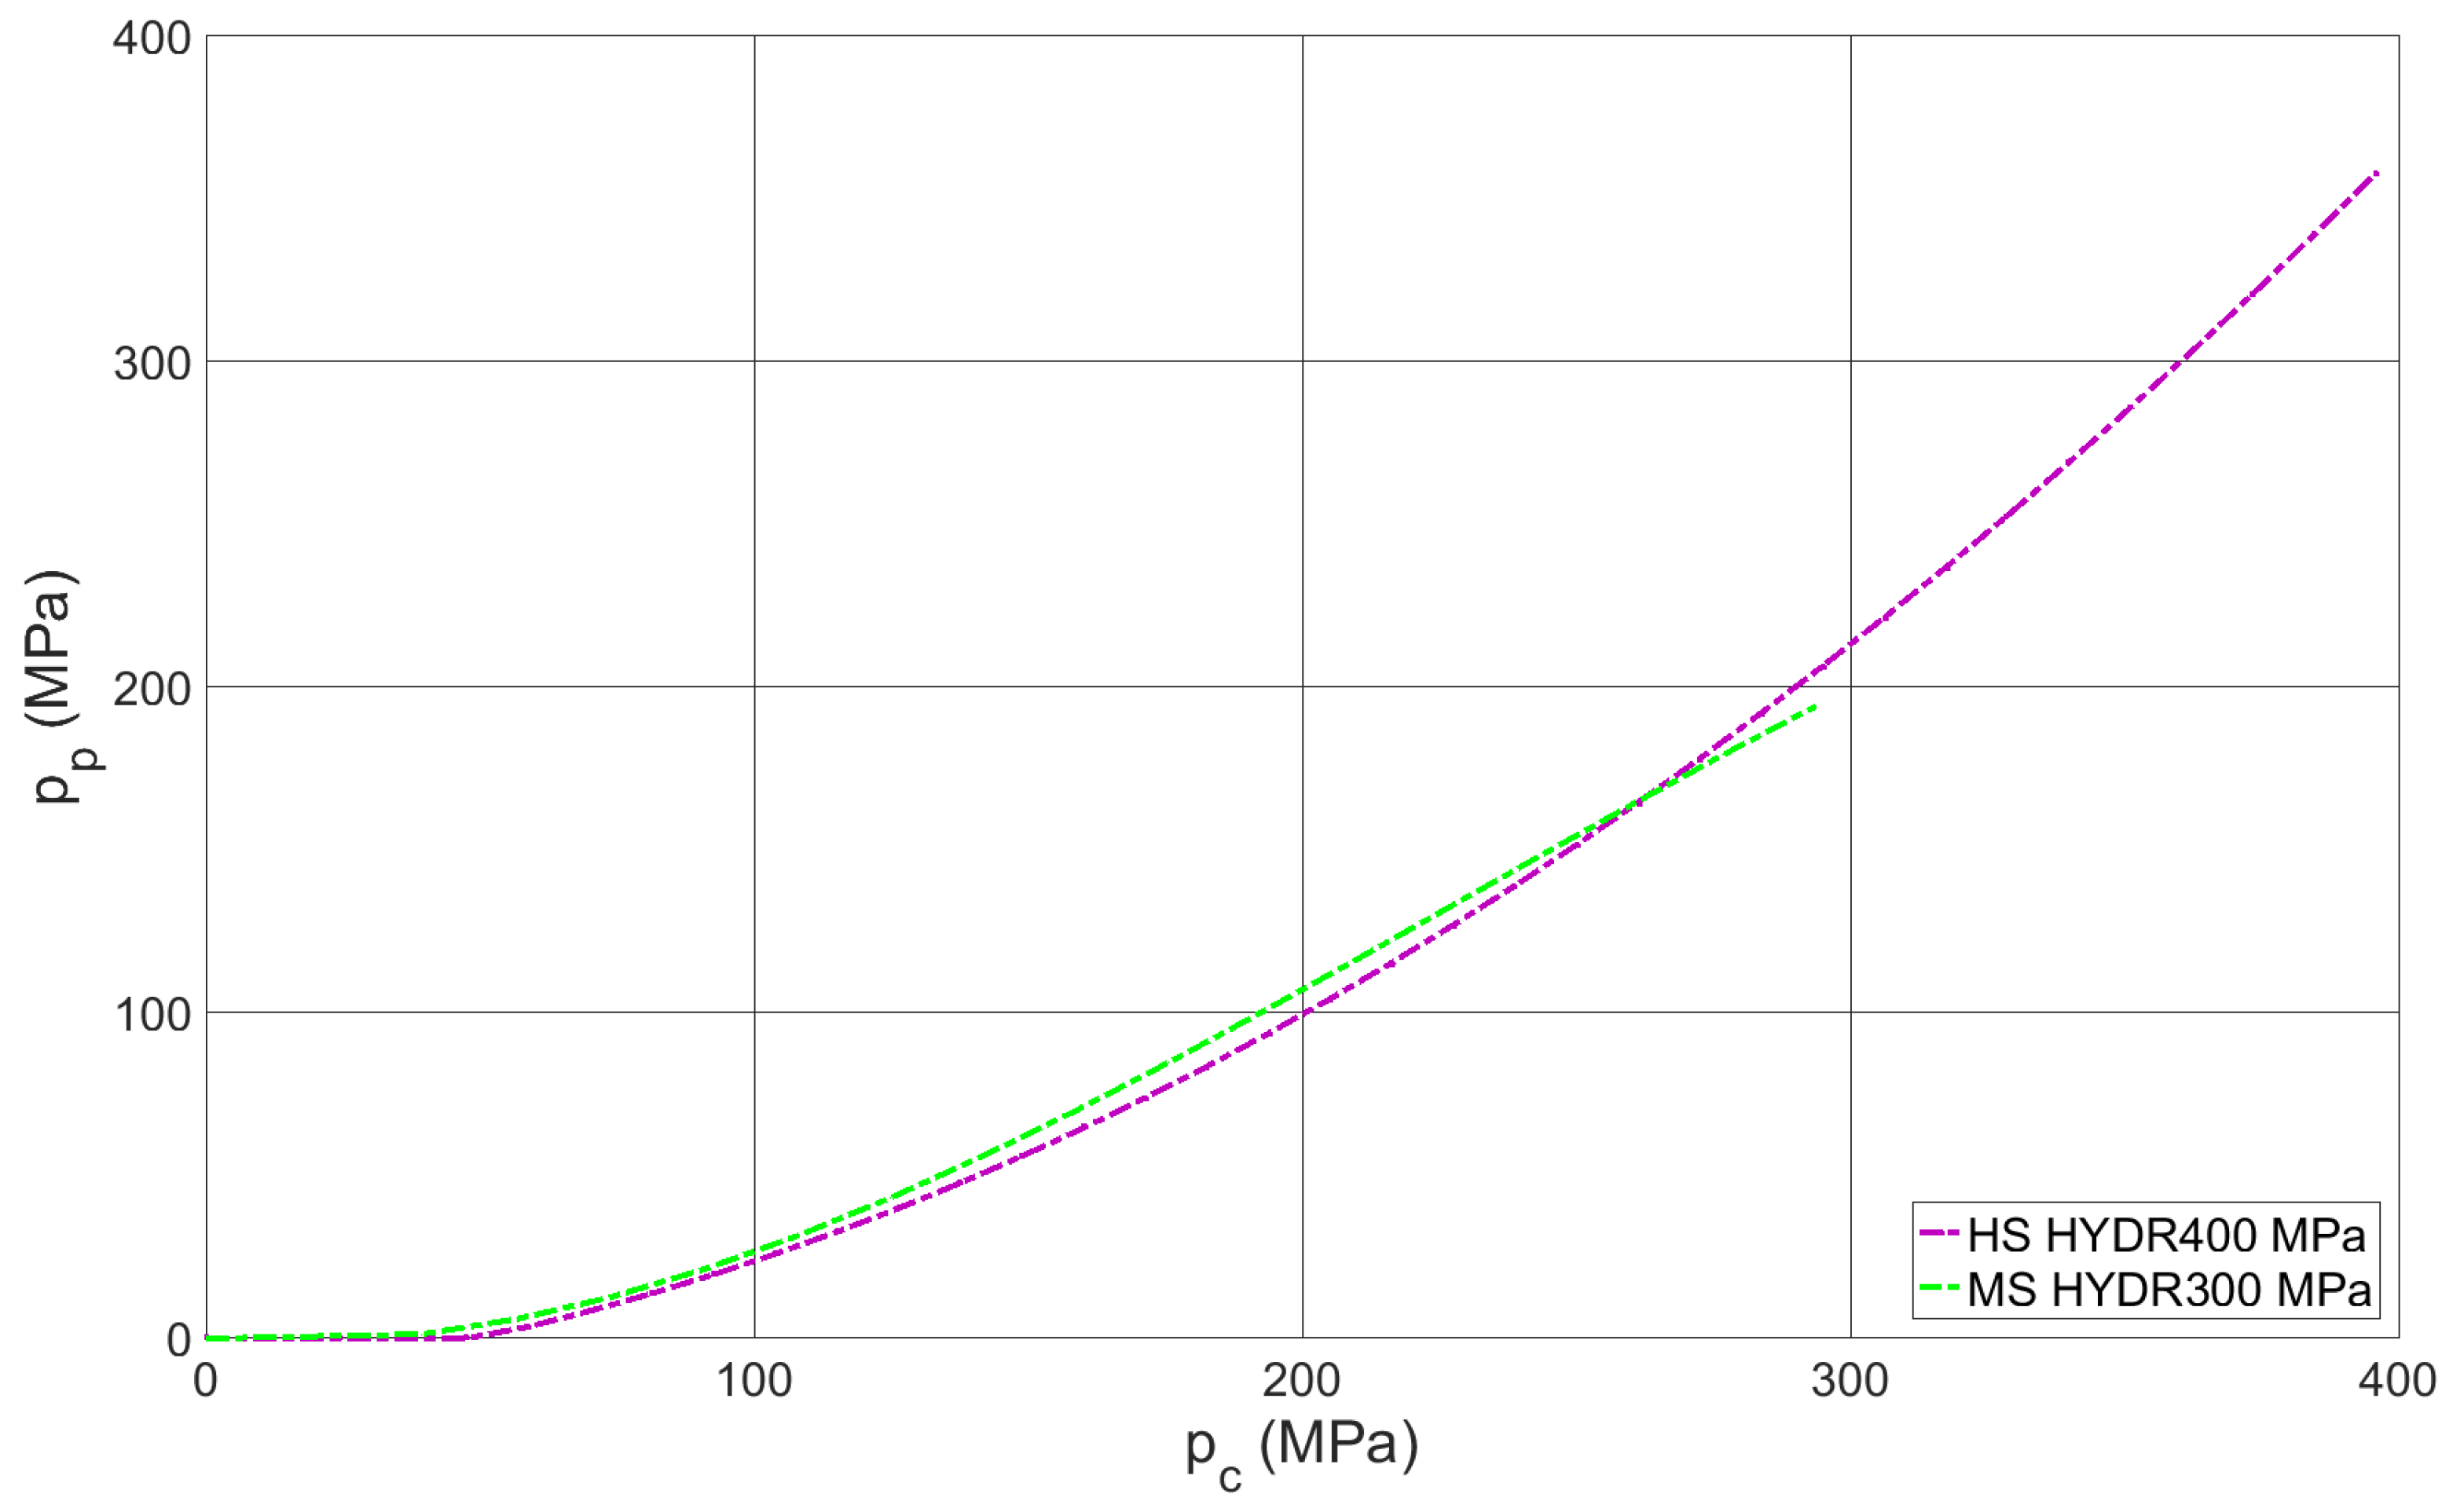
5. HS and MS Signals Comparison
6. Validation of Sensors for the Measurement of Concrete Pore Pressure
7. Conclusions and Outlooks
Author Contributions
Funding
Conflicts of Interest
References
- Daudeville, L.; Malecot, Y. Concrete structures under impact. Eur. J. Environ. Civ. Eng. 2011, 15, 101–140. [Google Scholar] [CrossRef]
- Gran, J.K.; Frew, D.J. In-target radial stress measurments from penetration experiments into concrete by ogive-nose steel projects. Int. J. Impact Eng. 1979, 19, 715–726. [Google Scholar] [CrossRef]
- Baroghel Bouny, V.; Mainguy, M.; Lassabatere, T.; Coussy, O. Characterization and identification of equilibrium and transfer moisture properties for ordinary and high performance cementitious materials. Cem. Concr. Res. 1999, 29, 1225–1238. [Google Scholar] [CrossRef]
- Piotrowska, E.; Forquin, P.; Malecot, Y. Experimental study of static and dynamic behavior of concrete under high confinement: Effect of coarse aggregate strength. Mech. Mater. 2016, 92, 164–174. [Google Scholar] [CrossRef]
- Vu, X.-H.; Malecot, Y.; Daudeville, L.; Buzaud, E. Effect of the water/cement ratio on concrete behavior under extreme loading. Int. J. Numer. Anal. Methods Geomech. 2009, 33, 1867–1888. [Google Scholar] [CrossRef]
- Vu, X.-H.; Malecot, Y.; Daudeville, L.; Buzaud, E. Experimental analysis of concrete behavior under high confinement: Effect of the saturation ratio. Int. J. Solids Struct. 2009, 46, 1105–1120. [Google Scholar] [CrossRef]
- Piotrowska, E.; Malecot, Y.; Ke, Y. Experimental investigation of the effect of coarse aggregate shape and composition on concrete triaxial behavior. Mech. Mater. 2014, 79, 45–57. [Google Scholar] [CrossRef]
- Zingg, L.; Baroth, J.; Malecot, Y. Influence of cement matrix porosity on the triaxial behavior of concrete. Cem. Concr. Res. 2016, 80, 52–59. [Google Scholar] [CrossRef]
- Malecot, Y.; Zingg, L.; Briffaut, M.; Baroth, J. Influence of free water on concrete triaxial behavior: The effect of porosity. Cem. Concr. Res. 2019, 120, 207–216. [Google Scholar] [CrossRef]
- Zhutovsky, S.; Karinski, Y.S.; Yankelevsky, D.Z.; Feldung, V.R. Multiscale model for the prediction of equation of state for cement paste and mortar. Int. J. Solids Struct. 2018, 152, 324–335. [Google Scholar] [CrossRef]
- Wang, H.; Wanga, L.; Song, Y.; Wang, J. Influence of free water on dynamic behavior of dam concrete under biaxial compression. Constr. Build. Mater. 2016, 112, 222–231. [Google Scholar] [CrossRef]
- Zhou, J.; Chen, X.; Wu, L.; Kan, X. Influence of free water content on the compressive mechanical behaviour of cement mortar under high strain rate. Sadhana 2011, 36, 357. [Google Scholar] [CrossRef]
- Mindeguia, J.C.; Pimienta, P.; Noumowé, A.; Kanema, M. Temperature, pore pressure and mass variation of concrete subjected to high temperature—Experimental and numerical discussion on spalling risk. Cem. Concr. Res. 2010, 40, 477–487. [Google Scholar] [CrossRef]
- Kalifa, P.; Menneteau, F.D.; Quenard, D. Spalling and pore pressure in HPC at high temperatures. Cem. Concr. Res. 2000, 30, 1915–1927. [Google Scholar] [CrossRef]
- Archambault, G.; Poirier, S.; Rouleau, A.; Gentier, S.; Riss, J. Pore pressure behavior in undrained triaxial shear tests on joints. In Proceedings of the 9th ISRM Congress, Paris, France, 25–28 August 1999; pp. 741–746. [Google Scholar]
- Sulem, J.; Ouffroukh, H. Shear banding in drained and undrained triaxial tests on saturated sandstone: Porosity and permeability evolution. Int. J. Rocks Mech. Min. 2012, 43, 292–310. [Google Scholar] [CrossRef]
- Nowakowski, A. The law of effective stress for rocks in light of results of laboratory experiments. Arch. Min. Sci. 2012, 57, 1027–1044. [Google Scholar]
- Hu, C.; Skoczylas, F. Poromechanical Properties of a Sandstone Under Different Stress. Rock Mech. Rock Eng. 2018, 51, 3699–3717. [Google Scholar] [CrossRef]
- Ling, K.; He, J.; Peng, P. Comparisons of Biot’s Coefficients of Bakken Core Samples Measured by Three Methods. In Proceedings of the 50th US Rock Mechanics/Geomechanics Symposium, Houston, TX, USA, 26–29 June 2016. [Google Scholar]
- Ling, K.; He, J.; Peng, P.; Han, G.; Zhang, H. Determining the permeability of tight rock with gas transient flow. J. Nat. Gas Sci. Eng. 2013, 15, 1–7. [Google Scholar] [CrossRef]
- Hart, D.J.; Wang, H.F. Laboratory measurements of a complete set of poroelastic moduli for Berea Sandstone and Indiana Limestone. J. Geophys. Res. 1995, 100, 17741–17751. [Google Scholar] [CrossRef]
- Vu, X.-H.; Malecot, Y.; Daudeville, L. Strain measurements on porous concrete samples for triaxial compression and extension tests under very high confinement. J. Strain Anal. Eng. Des. 2008, 44, 633–657. [Google Scholar]
- Malecot, Y.; Daudeville, L.; Dupray, F.; Poinard, C.; Buzaud, E. Strength and damage of concrete under high triaxial loading. Eur. J. Environ. Civ. Eng. 2010, 14, 777–803. [Google Scholar] [CrossRef]


| Sensor | (Thickness) | d | |||
|---|---|---|---|---|---|
| 7 | 2.5 | 4.5 | 14 | 35 | |
| 5 | 4.5 | 4.5 | 14 | 35 | |
| 2.5 | 7 | 4.5 | 14 | 35 |
| Sensor Type | (MPa) | (%) | (MPa) | (%) |
|---|---|---|---|---|
| Boundary Conditions | All Nodes (Figure 5a) | Half Nodes (Figure 5b) | ||
| 2600 | 9300 | 2800 | 10,300 | |
| 1000 | 4040 | 1240 | 4700 | |
| 590 | 2300 | 860 | 3320 | |
| Test No. | Position | Protective Mastic | p (MPa) | Slope K (MPa) |
|---|---|---|---|---|
| HS-calib-1 | reversed | No | 500 | 940 |
| HS-calib-2 | reversed | No | 500 | 920 |
| HS-calib-3 | normal | No | 400 | 930 |
| HS-calib-4 | reversed | Yes | 400 | 930 |
| Theoretical | — | — | 500 | 900 |
| Test Name | Purpose | Position | p (MPa) | Slope K (GPa) |
|---|---|---|---|---|
| MS-calib | Calibration | normal | 200 | = 73.5 |
| MS-mech | Mechanical effect | normal | 200 | = −573.1 |
| Concrete Mix Properties | Kg/m | Mechanical Properties | Values |
|---|---|---|---|
| Cement CEM I 52.5N | 263 | Compressive strength (MPa) | 30 |
| Sand ‘D’ 1.8 mm | 838 | Porosity accessible to water (%) | 12 |
| Gravel ‘D’ 0.5–8 mm | 1007 | Slump (cm) | 7 |
| Water | 169 | W/C ratio | 0.64 |
© 2019 by the authors. Licensee MDPI, Basel, Switzerland. This article is an open access article distributed under the terms and conditions of the Creative Commons Attribution (CC BY) license (http://creativecommons.org/licenses/by/4.0/).
Share and Cite
Accary, A.; Malecot, Y.; Daudeville, L. Design and Evaluation of a Deformable Sensor for Interstitial Pore Pressure Measurement in Concrete under Very High Stress Level. Appl. Sci. 2019, 9, 2610. https://doi.org/10.3390/app9132610
Accary A, Malecot Y, Daudeville L. Design and Evaluation of a Deformable Sensor for Interstitial Pore Pressure Measurement in Concrete under Very High Stress Level. Applied Sciences. 2019; 9(13):2610. https://doi.org/10.3390/app9132610
Chicago/Turabian StyleAccary, Abdallah, Yann Malecot, and Laurent Daudeville. 2019. "Design and Evaluation of a Deformable Sensor for Interstitial Pore Pressure Measurement in Concrete under Very High Stress Level" Applied Sciences 9, no. 13: 2610. https://doi.org/10.3390/app9132610
APA StyleAccary, A., Malecot, Y., & Daudeville, L. (2019). Design and Evaluation of a Deformable Sensor for Interstitial Pore Pressure Measurement in Concrete under Very High Stress Level. Applied Sciences, 9(13), 2610. https://doi.org/10.3390/app9132610