Article

Research on Multi-Energy Coordinated Intelligent Management Technology of Urban Power Grid Under the Environment of Energy Internet

1
Key Laboratory of Smart Grid of Ministry of Education, Tianjin University, Tianjin 300072, China
2
State Grid Tianjin Electric Power Company, Tianjin 300010, China
3
State Grid Tianjin Electric Power Research Institute, Tianjin 300384, China
1
*
Author to whom correspondence should be addressed.
Appl. Sci. 2019, 9(13), 2608; https://doi.org/10.3390/app9132608
Submission received: 7 June 2019 / Accepted: 20 June 2019 / Published: 27 June 2019
(This article belongs to the Special Issue Renewable Energy Systems 2019)

Abstract

:
Integrated energy systems (IES) are an important physical carrier of the energy Internet, which undertakes the tasks of energy conversion, distribution, and storage of electricity, heat and cold. From the perspective of energy Internet, this paper studies the optimal operation scheduling of an urban power grid with a high proportion of clean energy and proposes a multi-energy coordinated intelligent management method for the urban power grid. Firstly, the structure and typical characteristics of urban energy Internet are researched. On this basis, the regulatory capacity of the adjustable generator set and the regenerative equipment is used to offset the volatility of renewable energy, the internal operating system, and network stable operation constraints are considered. To solve the model, alternating direction method of multipliers (ADMM) is used. Finally, a real-time power grid example is given to verify the effectiveness of the proposed method.

1. Introduction

The current energy structure is dominated by primary energy, which brings great challenges to the sustainability of the world’s energy supply, as well as huge environmental problems [1]. With the development of society and the continuing growth of energy consumption, it is very important to vigorously develop renewable energy and build a centralized energy supply network. The network is coupled with distributed terminal integrated energy units through reasonable planning and operation optimization to realize the coordinated control of power, gas, heat and other integrated energy systems [2,3]. Cascade utilization of various energy forms can help reduce the impact of distributed energy fluctuations on the power grid and promote the development and application of renewable energy [4,5]. From the perspective of energy utilization, multiple energy systems are correlated and complementary in different time scales, and the storage and transformation of energy can be carried out in multiple time scales [6]. In recent years, the development of urban integrated energy systems (IES) provide a new idea for the efficient utilization of clean energy: power supply and heating are closely combined through the “Energy Internet” [7], and the capacity of absorption and utilization of renewable energy is effectively improved through heat storage (such as heat pump, heat storage boiler, etc.).
According to geographical factors and energy generation, transmission, distribution, and utilization characteristics, IES can be divided into trans-regional, regional and user levels [8]. The trans-regional IES take centralized power sources such as large-scale wind farms and hydropower plants as the main energy sources. The large-scale power transmission and gas transmission networks are the backbone network frame, which mainly play the role of long-distance energy transmission. With the development of distributed generation technology, most scholars focus their research on IES at the regional level, but there is lack of targeted research on the multi-energy coordination and the integrated management of urban power grids in the context of large-scale clean energy applications. Urban integrated energy systems are clean, distributed, interconnected, intelligent, flexible and open [9,10]. It is of great significance to realize the vertical connection of a single energy source and the horizontal integration of a variety of energy sources in the region.
Power researchers have carried out more studies on the regulation of integrated energy systems. The challenges are mainly brought by the increased penetration of renewable energy and the diversity of the load. Bejestani et al. [11] pointed out that the interactive energy mechanism can be applied at multiple levels, including the resident side low-voltage network system, the medium-low voltage micro-grid system, the local area network system and the regional network system. Wan et al. [12] proposed an individual-based model (IBM) for the modeling of large-scale heterogeneous complex systems. The IBM decouples the complex systems into independent individuals based on physical characteristics, which is applied to the modeling of heterogeneous integrated energy systems (IES) and the simulation of the multi-time-scale dynamics of the IES under conditions of disturbances and faults. In Reference [13], a modeling and optimization method, aimed at minimizing the overall costs of the net acquisition for heat and power in a deregulated power market, is developed for CHP (combined heat and power)-DH (district heating) systems. A planning model consisting of energy balances and constraints for system control and operation is built and an efficient algorithm is developed. For the urban energy Internet with large-scale access to renewable energy, the energy storage system plays a role in stabilizing the volatility of renewable energy. Chen et al. [14] used a fixed threshold and dynamic threshold method to calculate the discharge threshold power to control the discharge power of the storage system. However, due to the high cost of the electric energy storage system, it is difficult to use it on a large scale. The systematic charge and discharge control of electric vehicles can make up for the shortcomings of the electric energy storage system. Fazel et al. [15] introduced the basic models of the charging and discharging process of electric vehicles, and Mu et al., [16] put forward two charging and discharging control strategies based on the spatial–temporal model. Martinezmares et al. [17] studied the optimal power flow of the power-natural gas hybrid system. Considering the volatility of renewable energy sources, how to optimize and coordinate the natural gas and power systems is researched in reference [18]. In reference [19], a method of equipment selection and capacity planning for the IES is presented with the consideration of the coupling among power, heat and gas. Aiming at the problems in equipment selection and capacity planning, an optimization model is set up with the minimum annual comprehensive cost as the objective function, and the mixed integer linear programming (MILP) algorithm is adopted to optimize the types and capacities of the equipment simultaneously.
The goal of energy Internet operation scheduling is to reduce the total generation cost of distributed power supply while ensuring the overall real-time power balance of the energy Internet [9], which is equivalent to converting the economic scheduling problem into the consistency of incremental cost in the power distribution process [20,21]. Therefore, it is of great significance to study the real-time power allocation in the operation scheduling of energy Internet. Modeling and solving of IES optimization scheduling problems are two closely related processes. Generally, the solving methods of optimization problems are divided into two categories: heuristic methods and mathematical optimization methods. The typical heuristic method is the intelligent algorithm, such as particle swarm optimization (PSO), genetic algorithm (GA) [22] and simulated annealing algorithm. The mathematical optimization method is the most widely used mathematical programming method, such as interior point method [23], the simplex method [24], recursive least squares method [25] and so on.
Based on the above background, from the perspective of energy Internet, the optimal operation scheduling of an urban power grid with high clean energy penetrance is studied. A multi-energy coordinated intelligent management method which takes an internal equipment operation system and network stable operation constraints into consideration is also proposed. Based on load forecasting and renewable energy output forecasting data, an urban multi-energy day-ahead scheduling optimization model is established. After that, this paper used alternating direction method of multipliers (ADMM) to solve the model. Finally, the validity of the method is verified by a real-time power grid example. The main contributions of this paper are as follows:
(1) To solve the scheduling and the grid connection problems of multi-type new energy, this paper presented a coordinated scheduling method for urban multi-time scale heat–electricity systems. The method ensured the robustness of the scheduling scheme through coordinating the output of controllable generators, electric boilers, storage devices, etc., as well as using multiple time scales (day-ahead, days, real-time) to gradually reduce the impact of renewable energy forecast deviation on the grid.
(2) Considering the coupling and complementarity between different energy systems, the quasi-steady-state model of the equipment is modified and the balance between electrical energy and thermal energy is ensured.
(3) The model solving method of ADMM was proposed. Through the process of decomposition-coordination, the complex optimization decision problem was decomposed into several smaller and easier-to-solve problems. By iterating among sub-problems, the global optimal solution of multi-energy dispatching of the urban power grid is realized.
The remaining of this paper is organized as follows: Section 2 describes the management structure and typical characteristics of an urban power grid under the background of energy Internet. Section 3 describes the coordination and optimization dispatching model of urban IES and its solution. Section 4 describes a specific case study and the results analysis. Conclusions are drawn in Section 5.

2. Structure and Typical Characteristics of Urban Energy Internet

Urban energy Internet is a regional energy platform that utilizes advanced measurement systems, automatic devices, internet systems and new management modes to connect and integrate various energy sources vertically and horizontally to form a regional energy platform featuring energy complementary and information interconnection [26,27]. Various forms of energy are coupled through cooling systems, thermal systems, electric systems, fuel systems and transportation systems, forming the basic framework of urban energy Internet. Different systems represent different kinds of characteristics. This paper takes the thermal system and the electric system as an example to analyze the operation of integrated energy systems.
The system described in this paper, as shown in Figure 1, is mainly composed of the following subsystems: (1) Thermal system: it is composed of a thermal pipe network, which is connected with CCHP (Combined Cooling, Heating and Power) units, photovoltaic-thermal units, boilers and heat storage devices to realize the unified collection and deployment of heat energy. (2) Electric system: the electric system can connect various generator units and power conversion devices to realize the transmission, collection, distribution and consumption of electric energy, it can also realize the conversion of electric energy and other types of energy through various conversion devices. (3) The interaction between thermal and power systems: regenerative electric boilers are widely used in accommodation of renewable energy, peak load regulation of thermal power units and replacement of heating energy due to their good electric heat transfer efficiency and flexible running time. Figure 1 shows the multi-energy coordination system architecture of the urban power grid. The power grid dispatching center serves as the information transfer station for producers and consumers, distribution companies, power energy market, and auxiliary energy market, providing information services, including electricity price information, power plans, and so on. It is linked with several related subjects, making them relate to each other, ensuring the economic, safe and stable operation of the power grid, and allowing the subjects to make independent decisions, in case the decisions of one party or several parties affect the overall situation.
It can be concluded from the analysis that: (1) From the perspective of energy flow, the urban energy Internet realizes the bidirectional or multi-directional flow of energy in the region through a variety of energy conversion devices. (2) From the perspective of information flow, the operation information of various energy sources in the urban energy Internet can be shared in real-time, and the distribution of energy flows in the region can be optimized through the analysis of information flow and data flow, so as to meet diversified energy demands. (3) From the perspective of value flow, based on the impact of the price mechanism, each role participating in the energy transaction takes the initiative to conduct the transaction, so as to obtain the optimal economic benefits, risk benefits and environmental benefits [28].

3. Multi-Energy Coordination and Optimization Dispatching Strategy of Urban Power Grid

3.1. Integrated Day-Ahead Coordination and Dispatching Model with Large-Scale Intermittent Energy

In the coordinated operation of the power system with large-scale intermittent renewable energy generators, the inherent uncertainty of renewable energy cannot be eliminated, which means other power sources have to make up for it [29,30]. When the intermittent power supply with a high proportion is suddenly increased or absent, the operating cost and efficiency of other units will be affected [31,32]. Under the current development of a new energy power situation, it is generally believed that renewable energy should be prioritized during system operation. Due to its good adjustability, the hydropower can balance the random fluctuation of intermittent energy power and undertake the task of peak shifting and valley filling, and the residual capacity bears part of the load. Conventional thermal power generating units should avoid frequent output adjustment (daily generation scheme does not consider start–stop) and maintain high efficiency of power generation. The energy storage device is charged at the load trough period and discharged at the load peak period and when the load increases sharply [28]. Heat pump, heat storage boiler and other devices can also achieve the regulation of electricity through heat storage [33]. Different from the traditional method of simply increasing the rotary reserve capacity to absorb the fluctuation of new energy, the method proposed in this paper will make full use of the regulating capacity of adjustable generator set and heat storage equipment to absorb the fluctuation of renewable new energy, and meet the robustness requirements of various extreme scenarios through reasonable resource allocation.
(1) Objective function
The optimization scheduling model of IES considering multi-energy complementarity constructed in this paper takes the minimum cost of the system as the objective function, which is as follows:
min   L ( Q PB t , Q HB t , Q PG t , Q HG t ) = C PB + C PG + C HB + C HG
where, Q PB t and Q HB t are respectively the quantities of electricity and heat purchased outside the system in time period t. Q PG t and Q HG t are respectively the quantities of electricity and heat produced by the equipment in the system in time period t. C PB is the purchase cost of the power grid. C PG is the power generation cost of its own equipment. C HB is the heat purchase cost of the system. C HG is the heating cost of its own equipment. Each cost is a function of Q PB t , Q HB t , Q PG t and Q HG t .
(1) Power and heat purchase costs of the system:
C PB = t = 1 T ρ PB t Q PB t
C HB = t = 1 T ρ HB t Q HB t
where ρ PB t and ρ HB t are the prices of electricity and heat purchased outside the system in time period t. Under normal circumstances, the price of electricity varies due to the imbalance between the supply and demand of renewable energy and load. T is the number of time periods in the scheduling cycle. For day-ahead scheduling, 60 min is usually taken as one time period, what is more, T = 24.
(2) Costs for power and heat generation
C PG = i = 1 m t = 1 T ( a i ( Q PG , i t ) 2 + b i Q PG , i t + c i + C Pss , i | u HG , i t u HG , i t 1 | )
where, m is the number of power generation equipment, including thermal power generators, gas power generators, renewable energy power generators and other types of equipment. Q PG , i t is the generation capacity of the ith power generation equipment in time period t. ai, bi and ci are the generation cost coefficients of the ith generation equipment, and the model is expressed by a quadratic function. C Pss , i is the starting and stopping cost of the ith power generation equipment, and for power generation equipment such as renewable energy, its value is 0. u PG , i t is the starting and stopping state of power generation equipment i in time period t, and its value of 0 represents the stopping state and 1 represents the starting state.
C HG = i = 1 n t = 1 T ( d i ( Q HG , i t ) 2 + e i Q HG , i t + f i + C Hss , i | u HG , i t u HG , i t 1 | )
where, n is the number of heating equipment, including micro-gas turbine, heat pump, heat storage boiler, gas boiler and other types of equipment; Q HG , i t is the calorific value of the ith heating device at time period t; di, ei, and fi are the heating cost coefficients of the ith heating equipment respectively; C Hss , i is the starting and stopping cost of the ith heating equipment; u HG , i t is the start and stop state of heating equipment ith in time period t, and its value of 0 represents the stop state and 1 represents the starting state.
(2) Model constraints
The cascade utilization of energy is not considered in the model, but the coupling and complementarity between different energy systems are considered. Therefore, the quasi-steady state model and electrical and thermal energy balance of the equipment are modified as follows.
(1) Constraints for the balance of heat and power in any time periods of the system.
Q PB t + i = 1 m Q PG , i t = Q PS t
Q HB t + i = 1 n Q HG , i t = Q HS t
where Q PS t is the predicted load power value of the system in time period t; Q HS t is the predicted thermal load of the system in time period t; the output of the power storage system under the discharge state is recorded as a negative value. The heat pump and the heat storage boiler are taken as the load of the system in the heat storage state.
(2) Considering the full utilization of renewable energy, certain rotation reserve constraints are required.
g G con I g t Q g max t + g G ren I g t Q g t + P GB D t + R t
where G c o n represents all units except renewable energy, G r e n is wind turbine and PV (photovoltaic), andis rotation reserve demand in tth period.
(3) Line safety constraint:
| g G d i γ g j Q g t | L j
where G a l l is all units, γgj is the power distribution factor of unit g output on line j, and Lj is the line flow limit.
(4) Unit output and climbing constraints:
Q g min Q g t Q g max
r g , down Q g t Q g t 1 r g , up
where Q n min and Q n max are respectively the minimum and maximum output of thermal power unit g; r g , up is the upward climbing rate of thermal power units g and r g , down is the downward climbing rate of thermal power units g.
(5) Most large-capacity electric regenerative boilers are composed of electrode boilers and water storage tanks. Some of the generated heat is used directly for heating, and the other part can be stored in the regenerative device as a movable time load. The heat storage capacity of the heat storage tank should be within its limit, that is:
Q HS , min Q HS t Q HS , max
where Q HS t is the heat storage capacity of the heat storage tank in time period t; Q HS , max and Q HS , min are respectively the maximum and minimum heat storage capacity of the heat storage tank.
(6) Power constraint of electric boilers:
0 P HS t P HS , max
where P HS t is the electric power of the regenerative boiler in time period t; P HS , max is the upper limit of power of section regenerative electric boiler.
(7) The SOC (State of Charge) of the energy storage system should also be within the appropriate range, that is:
S O C min S O C S O C max
where S O C max and S O C min are the upper and lower limits of the charged state, respectively. In general, the upper limit is 0.8 and the lower limit is 0.2.
(8) The SOC of the energy storage system after the last time period should be equal to that before the first period of time:
S O C 0 = S O C T
where SOC0 is the SOC of the energy storage system at the beginning of the scheduling cycle and SOCT is the SOC of the energy storage system at the time of the end of the scheduling cycle.
(9) Many devices in urban energy system such as solar power plants, wind farms, PHEVs (plug in hybrid electric vehicle), and HEVs (Hybrid Electric Vehicle) can’t get connected to power grid without an AC/DC (Alternating Current/Direct Current) or DC/DC (Direct Current/Direct Current) converter. In order to ensure the stability of grid voltage, the converters are in constant voltage control mode [34]. The output constraint of converters is:
P c o n , min i P c o n i P c o n , max i
where P c o n t is the output of the converter i; P c o n , min t and P c o n , max t are the output ranges of the converter i. The power loss of the converter is 1.5% of the output [34].

3.2. Robust Dispatching Method of Renewable Energy

By traditional scheduling method, renewable energy for the power grid is equivalent to “negative load”, which means active power consumption is negative. Its value depends on the day-ahead renewable energy output prediction [35]. The deviation of renewable energy output prediction is balanced by the AGC (Automatic Generation Control) unit in the system. When the proportion of renewable energy is high, the AGC unit regulation capacity is not enough to balance the prediction error caused by the uncertainty of renewable energy. This will lead to a large amount of wind/light curtailment and load curtailment. Therefore, the risk cost of this scheduling method is high.
In order to reduce wind/light curtailment and load curtailment caused by the volatility of renewable energy and reduce the risk cost of the system, the concept of uncertainty set of renewable energy unit output is introduced. The details are as follows:
( 1 β ) p r , t f p r , t ( 1 + β ) p r , t f
where p r , t f is the prediction of the output of renewable energy unit at time period t. β is a coefficient between 0 and 1, used to represent the size of the uncertainty set. pr,t is the actual output of renewable energy units at time period t. When it is within the range demonstrated in the above equation, it can be considered that the output of renewable energy units is concentrated in the uncertainty of the system.
For the output of renewable energy units located in the uncertainty set, the system can realize the full absorption of renewable energy through the preset rotary reserve. When the volatility of the renewable energy units is large and located outside of the uncertainty set of the system, wind/light curtailment or load curtailment may occur. Therefore, when the range of uncertainty set is large, the power grid has strong absorption capacity for renewable energy and low risk cost. However, the power grid should reserve a large amount of spare capacity, and a large number of generator units cannot be operated under the optimal output, resulting in low power generation efficiency and high operation cost. On the contrary, when the range of uncertainty set is small, the system has high risk cost but low operation cost. To calculate the best range of uncertainty set, an effective method is to calculate the sum of risk cost and operation cost of the system with a different value of β and choose the uncertainty set with minimum overall cost as the optimal uncertainty set. The calculation method of risk cost and operation cost is shown in [28].

3.3. The Solution of the Model Based on ADMM

ADMM is a kind of algorithm for solving complex optimization problems. It can be applied to solve the multi-agent decision of a convex optimization problem. This method decomposes a relatively complex optimization decision problem into several small and easy-to-solve different sub-problems through the decomposition-coordination process, and through the iterative solution between sub-problems until the global convergence, so as to obtain the global optimal solution of the original problem. The ADMM method is used to solve the optimal scheduling model.
The optimization problem of the IES of power–heat interconnection based on the ADMM is divided into two sub-problems: power network optimization and heating system optimization. After decomposition, the optimization goal is to minimize the total operating cost of the Internet system. The IES can be regarded as the operation under the condition of a limited number of information exchanges, while the power grid dispatching agency and heating network dispatching agency can be regarded as two separate decision-making bodies to form the collaborative optimization of power supply energy flow and heating energy flow through the communication of a limited number of times.
In the power network optimization sub-problem, the coupling constraint conditions of electrothermal should be considered. Hence, the electric–gas coupling relation based on the gas turbine is selected and substituted into the objective function. The objective function of the grid optimization sub-problem can be expressed as:
min   f ( Q PB t , Q PG t ) = C PB + C PG
In the natural gas network optimization sub-problem, the electric–gas coupling relation based on the gas turbine is also selected and substituted into the objective function. Then, the objective function of the natural gas optimization sub-problem can be expressed as:
min   g ( Q HB t , Q HG t ) = C HB + C HG
The above optimization problem can be converted into an ADMM optimization problem in the form of:
min   f ( x ) + g ( y )   s . t .   A x + B y = C
where for any time period, x = ( Q PB t , Q PG t ) and y = ( Q HB t , Q HG t ) is the optimization variable.
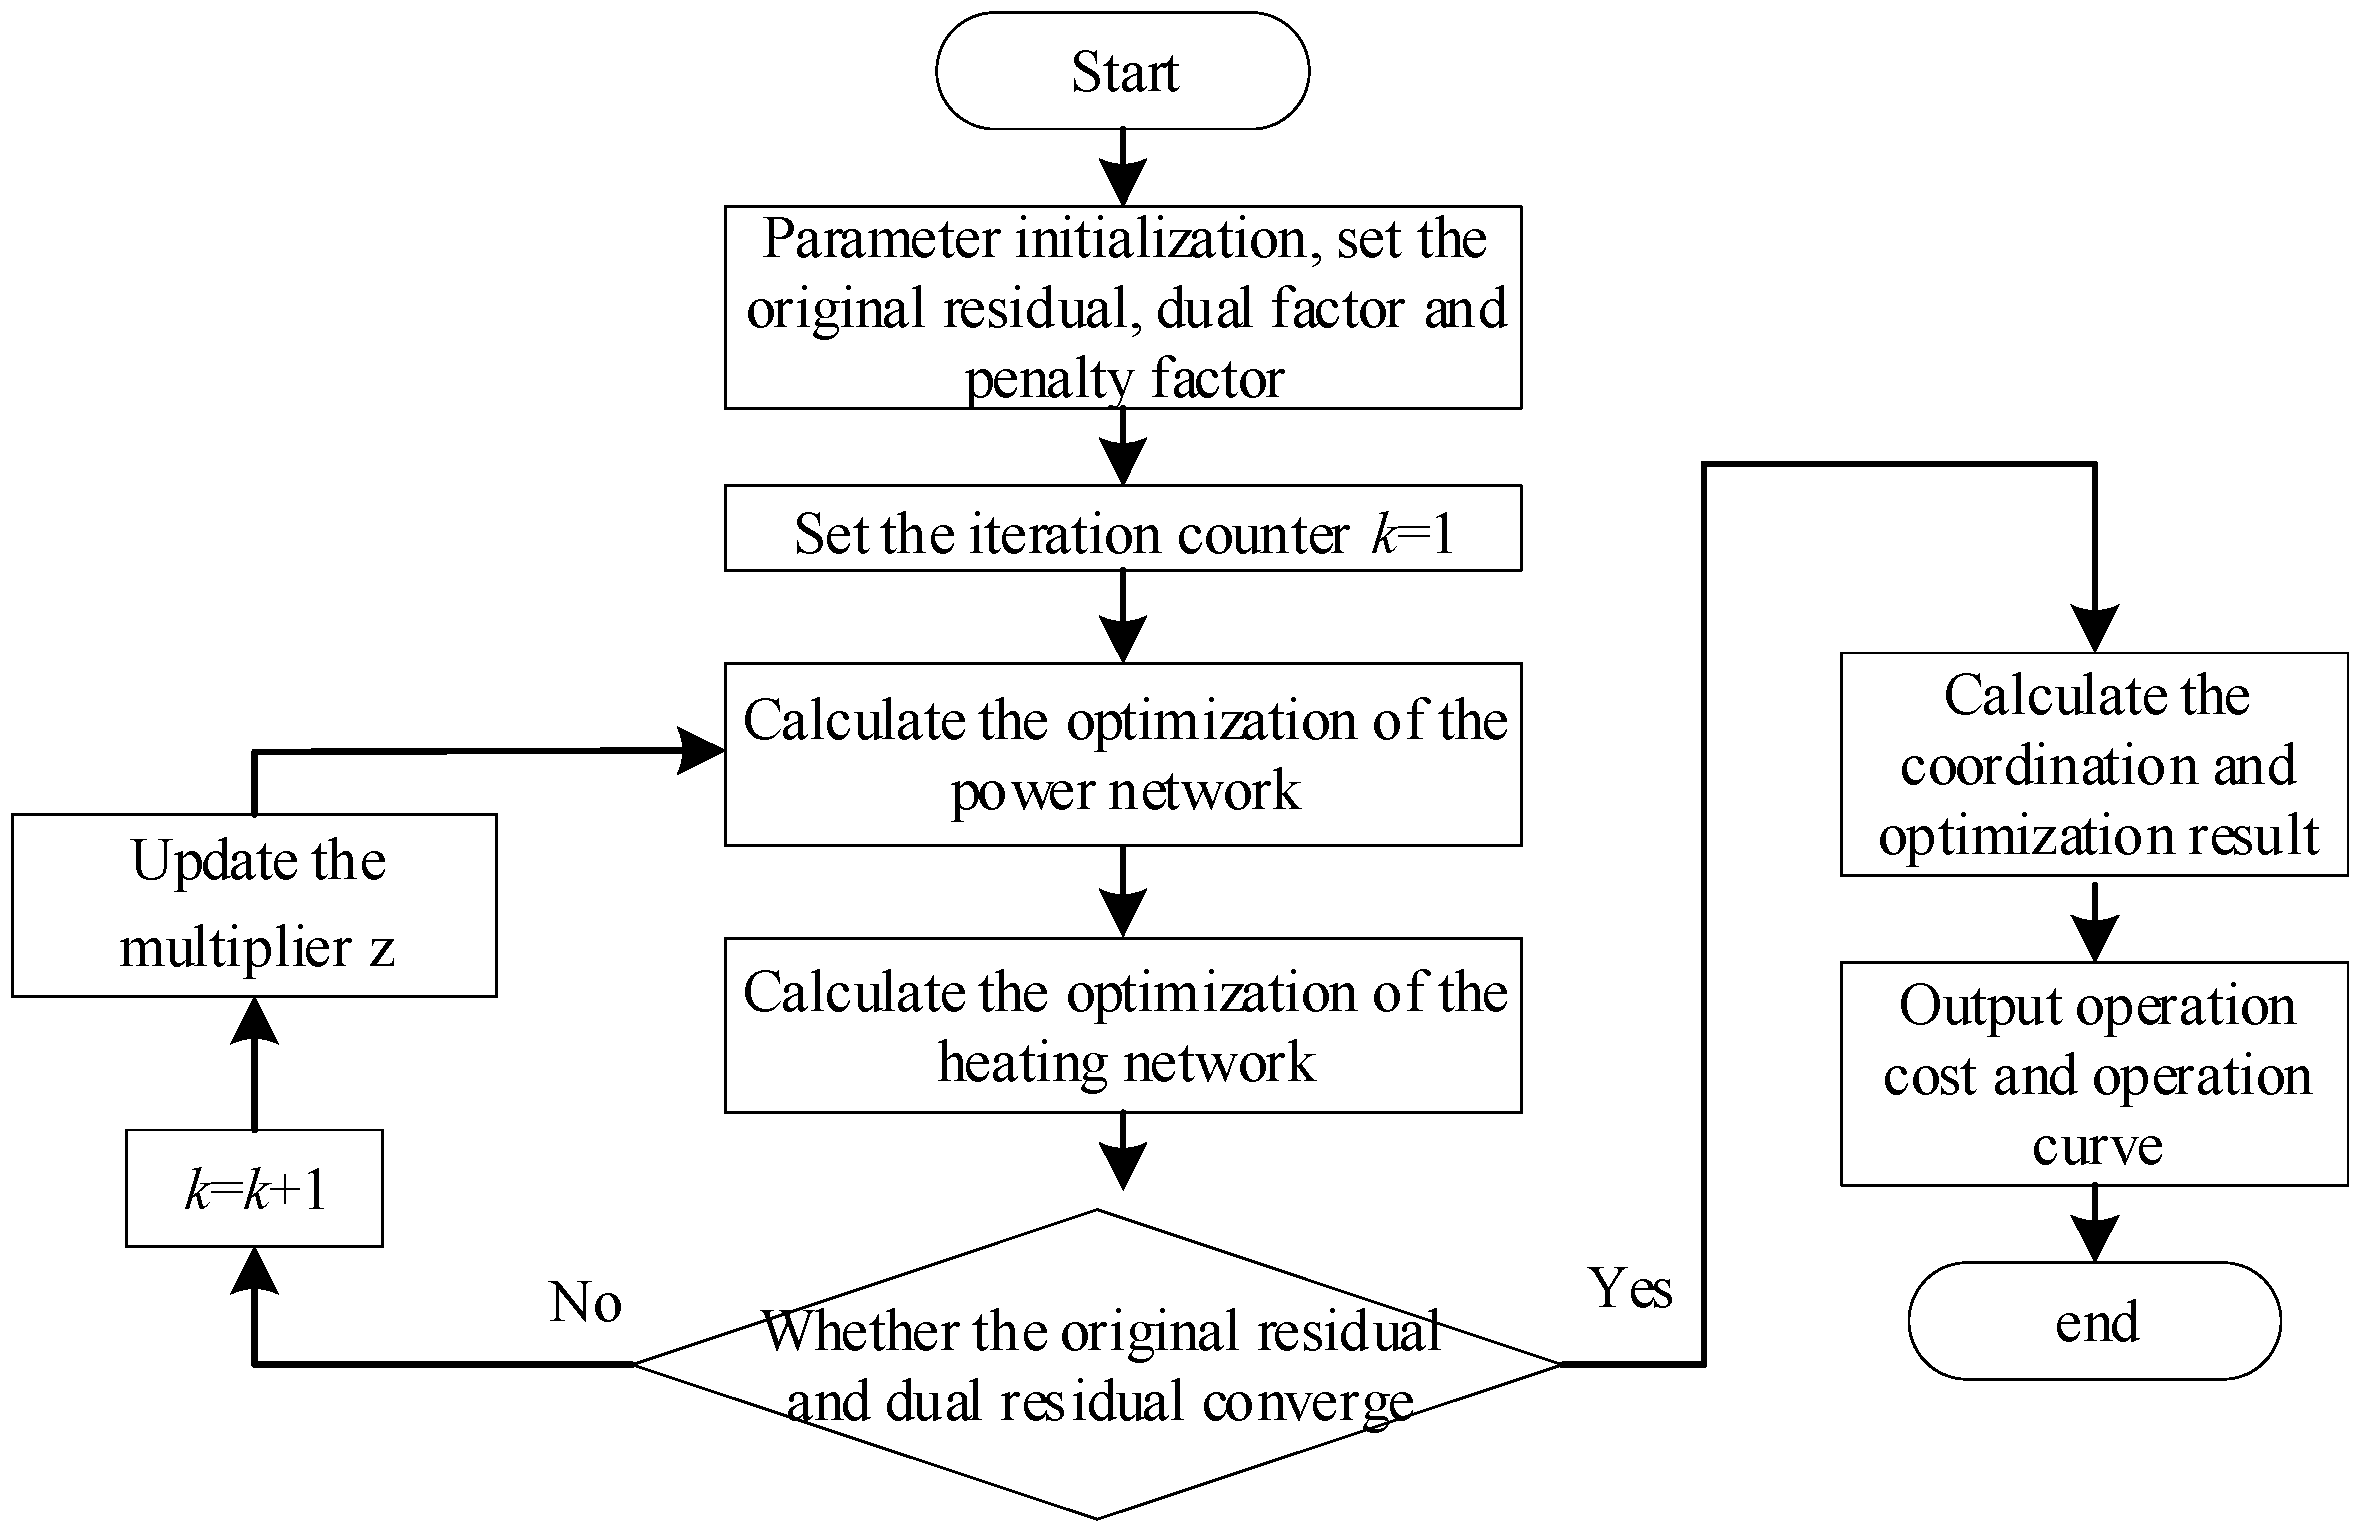
The ADMM algorithm can be solved by Gauss–Seidel iteration method. In the solving process, only one of the two sub-problems is in the calculation state. When the value of the coupling variable is obtained, it will be substituted back into the other sub-problem for solving. Wait for another sub-problem to update the value of the coupling variable, and then substitute it back into the previous sub-problem for the next round of iterative calculation. At the end of each iteration and the moment into the next iteration, the multiplier must be updated. The flow chart of solving a multi-energy coordination problem based on ADMM is shown in Figure 2. The solution method can be expressed as follows:
{ x k + 1 = arg   min x L λ ( x ,   y k ,   z k ) y k + 1 = arg   min y L λ ( x k + 1 ,   y ,   z k ) z k + 1 = y k + λ ( A x k + 1 + B y k + 1 C )
In each iteration, there are three steps in total: namely, solve the minimization problem related to x and update x; solve the minimization problem related to y and update y; update the multiplier z.
The convergence standard of ADMM is:
{ r ( r + 1 ) 2 2 = A x k + 1 + B y k + 1 C 2 2 ε p r i s ( r + 1 ) 2 2 = λ A T B ( y k + 1 + y k ) 2 2 ε d u a l
where r ( r + 1 ) 2 2 and s ( r + 1 ) 2 2 is the original residual and dual residual after the k + 1th iteration calculation; εpri and εdual are the tolerance upper limit of the original residual error and dual residual error, respectively.
In essence, power grid dispatching is a large-scale dispatching problem, with various and complex constraints. From the perspective of energy Internet, the coupling of electric with other sources further increases the difficulty of optimal scheduling. For the traditional grid dispatching calculation method, the general procedure is determining the objective function and the constraints and then solving the problem directly by existing software (such as CPLE, etc.) [35]. Although this solution method is simple, when the number of units increases and the coupling relationships between electric and other energy sources becomes complex, the solution speed will be greatly reduced. The advantage of the ADMM algorithm is that the power network and heating network can be solved separately and the interaction between the heating network and the power network can be carried out through the thermoelectric coupling elements. In this way, the complexity of each iteration can be greatly reduced, and the computing time can be reduced.

4. Example Analysis

4.1. Basic Parameters of Power Grid

A case study of a city power grid in 2019 was carried out to verify the effects of different penetrance on the benefits of the multi-energy coordinated control strategy, as well as the effects of different energy structures on the benefits. The power supply capacity proportion of the power grid is shown in Table 1.
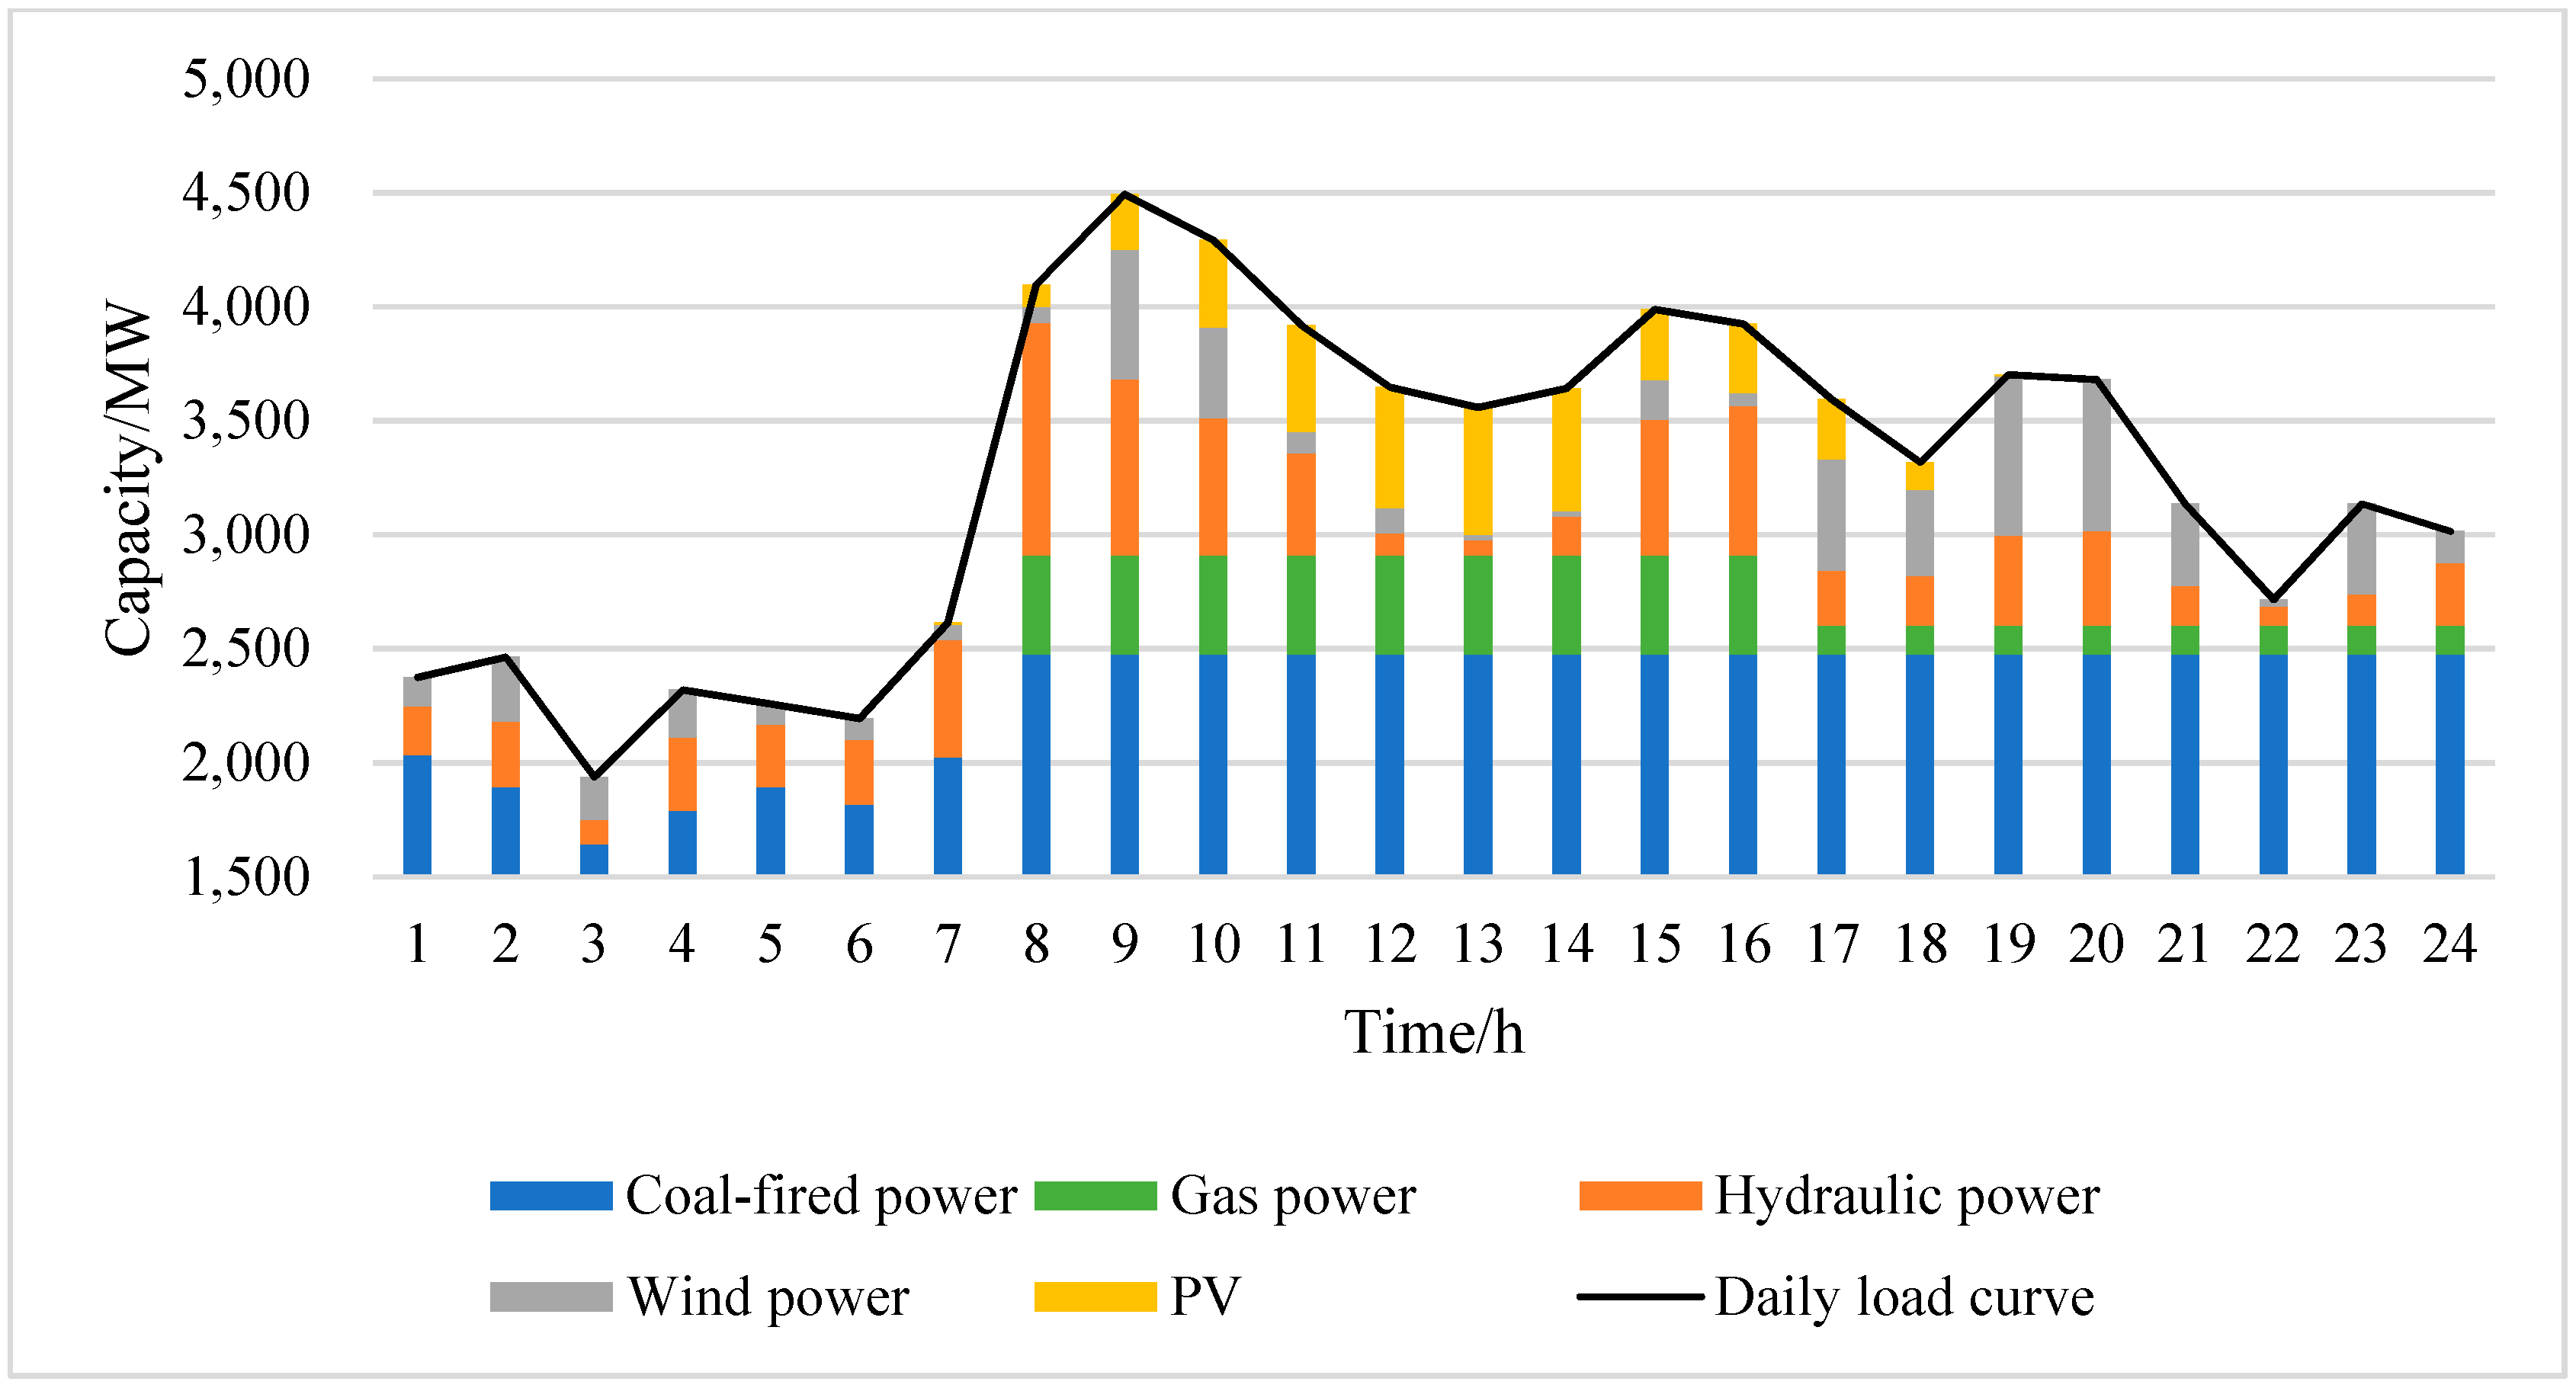
New energy output and new energy penetration rate are shown in Figure 3. The new energy penetration rate (total new energy generation installed capacity/total installed generation capacity) is 18.4%.
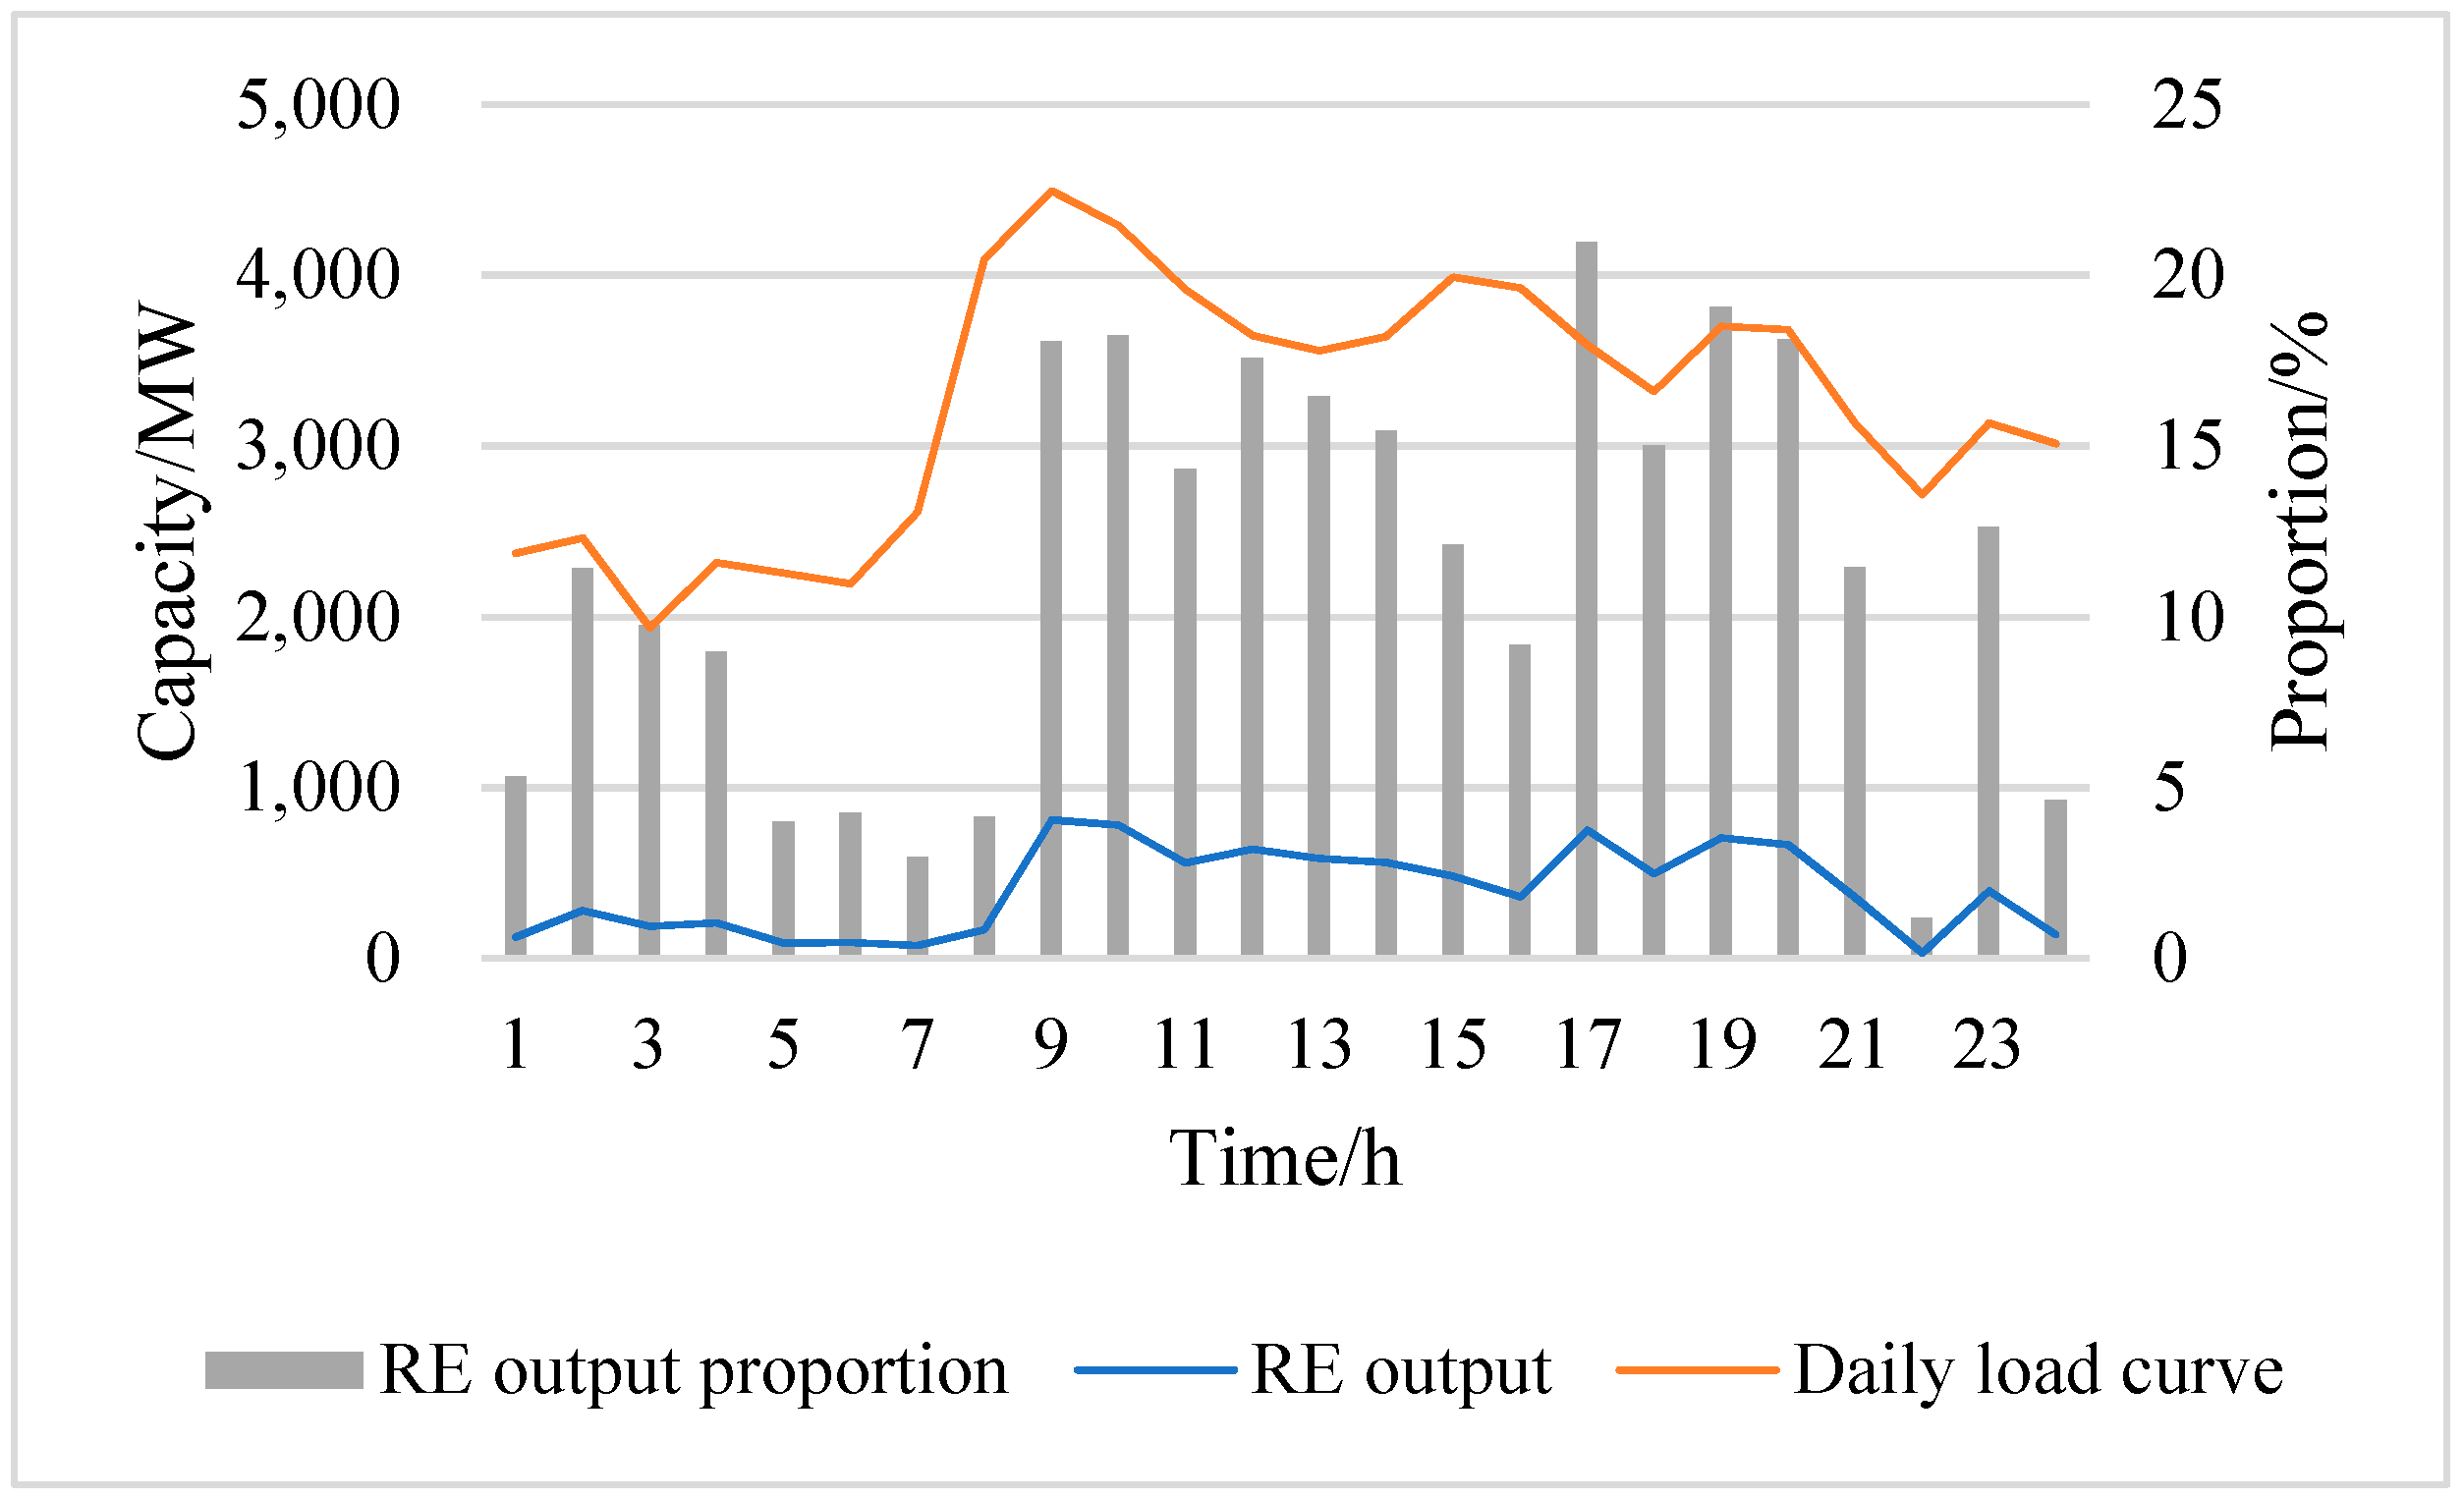
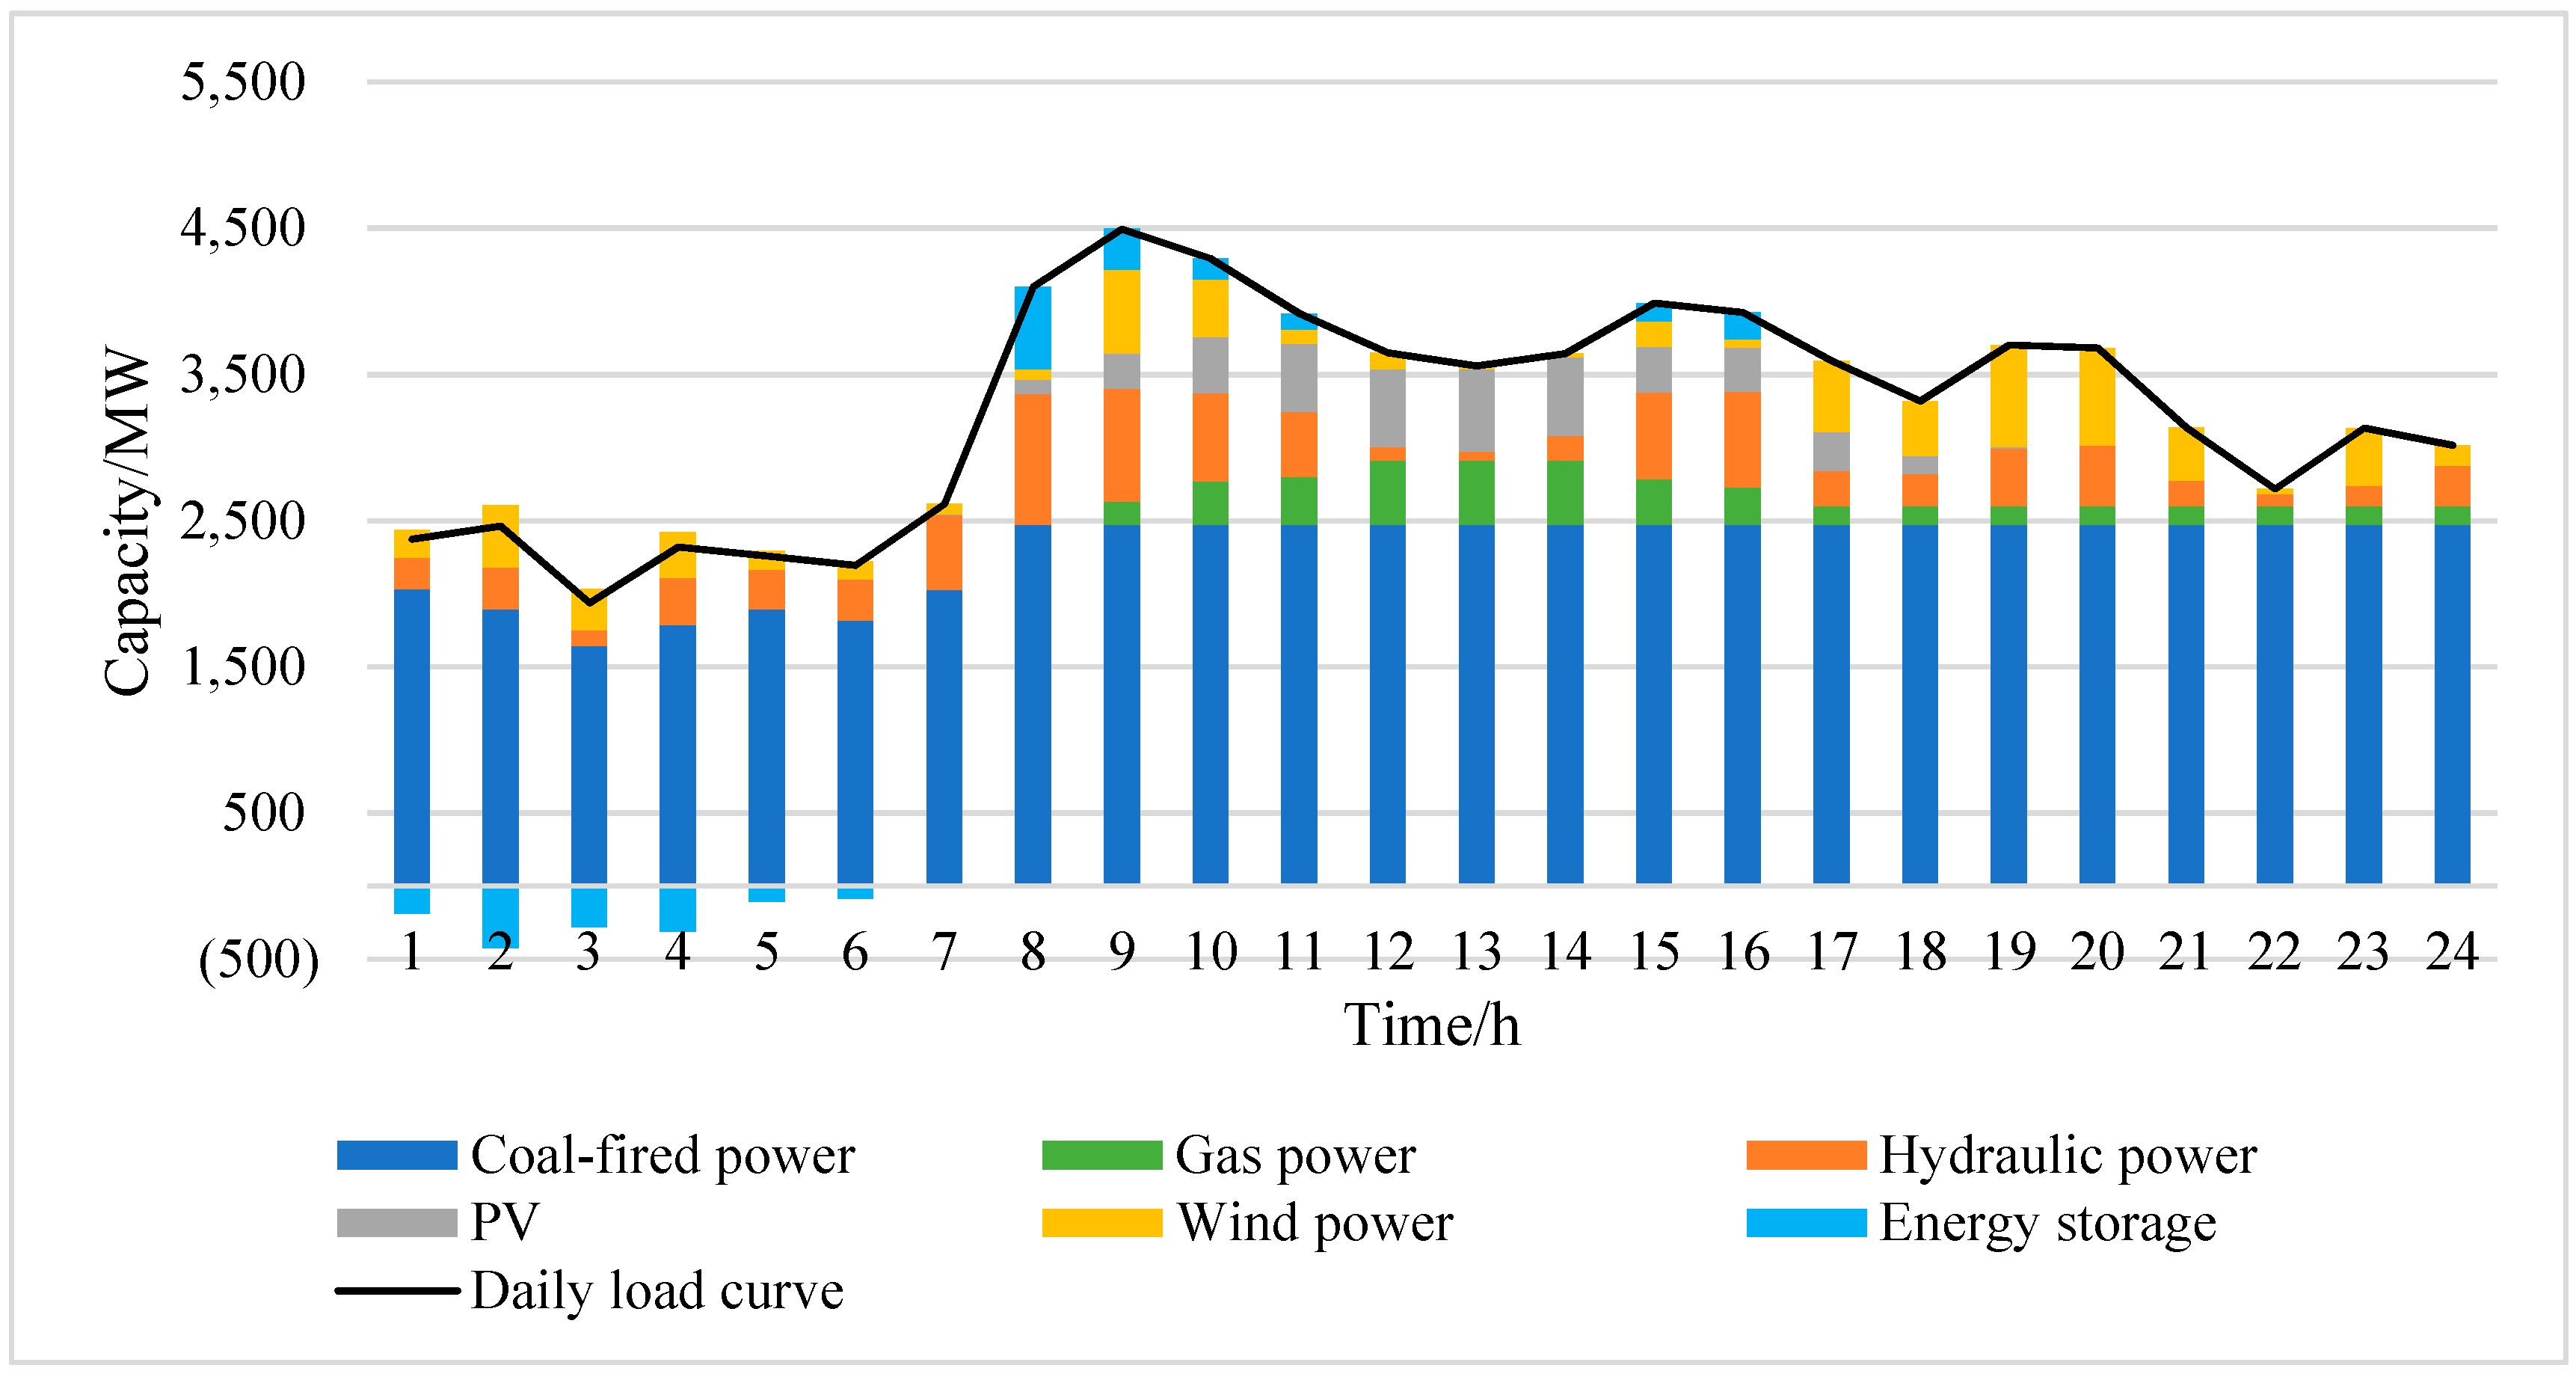
Output analysis of each type of unit is shown in Figure 6.
As is shown in Figure 4, thermal power units are the main power units of the power grid, and their output accounts for more than half of the total load. The regular changes in load are mainly borne by thermal power units. After 8:00 a.m., the load gradually climbs to the peak and stays at a high level. At this time, all eight thermal power units are started up, and all of them reach the rated output at 9:00 a.m. Considering the flexibility of hydropower generation, the hydropower units cannot always maintain a high output level; hydropower closely follows the load change after 10:00 a.m. Therefore, its main function is to respond to the immediate change of load after the thermal power units reach the rated output, and according to the calculation results each hydropower plant has completed the power limit during the dispatching period, which is determined by the economic optimization as the objective function of the model.

4.2. Benefit Analysis of Multi-Energy Coordinated Control

Take the uncertainty set as 25%, calculate the scheduling cost of the proposed robust method and the traditional method, and compare the advantages of the proposed method with the traditional method [28,35].
The difference in Table 2 is obtained by the traditional method minus the robust method, so the positive value represents the cost advantage of the robust method, and the negative value represents the cost disadvantage of the robust method.
Compared with the traditional method, the method proposed in this paper has an economic advantage of 15,945.3Ұ, and the comprehensive cost is the sum of risk, environment and power generation cost, so the reasons can be described from the above three aspects:
(A) Risk cost: the core idea of the multi-energy coordinated dispatching method proposed in this paper is to deal with the fluctuation of new energy by setting uncertain sets, which leads to the dispatch plan having obvious advantages in risk cost, which is reflected in the fact that the cutting load is much lower than the traditional method. Wind/light curtailment volume is slightly larger than the traditional method, but this is because the load cutting cost is very high and the wind/light curtailment cost is low.
(B) Environmental cost: environmental cost is caused by coal-fired power, while the environmental cost of coal-fired power is much higher than that of gas power. The traditional law does not consider the fluctuation of new energy but pursues the economy of power generation cost. Due to the high cost of gas and electricity output, the traditional scheduling scheme stops the gas and electricity output, and more of it is coal-fired power output, so its environmental cost is higher.
(C) Power generation cost: as described in the environmental cost, the traditional method does not consider the fluctuation of new energy, but pursues the economy of power generation cost. Therefore, most of its units operate at the economic operation point of rated output, and the high-energy consuming units (gas power) are not started, so the traditional method has advantages in power generation cost.
The economic advantage of the method proposed in this paper is the results of combining the above three kinds of cost, and it can be predicted that the advantage of multi-energy coordinated scheduling method in risk cost will be more obvious with the increase of new energy penetrance.

4.3. The Effect of Increased Penetration on Economic Performance

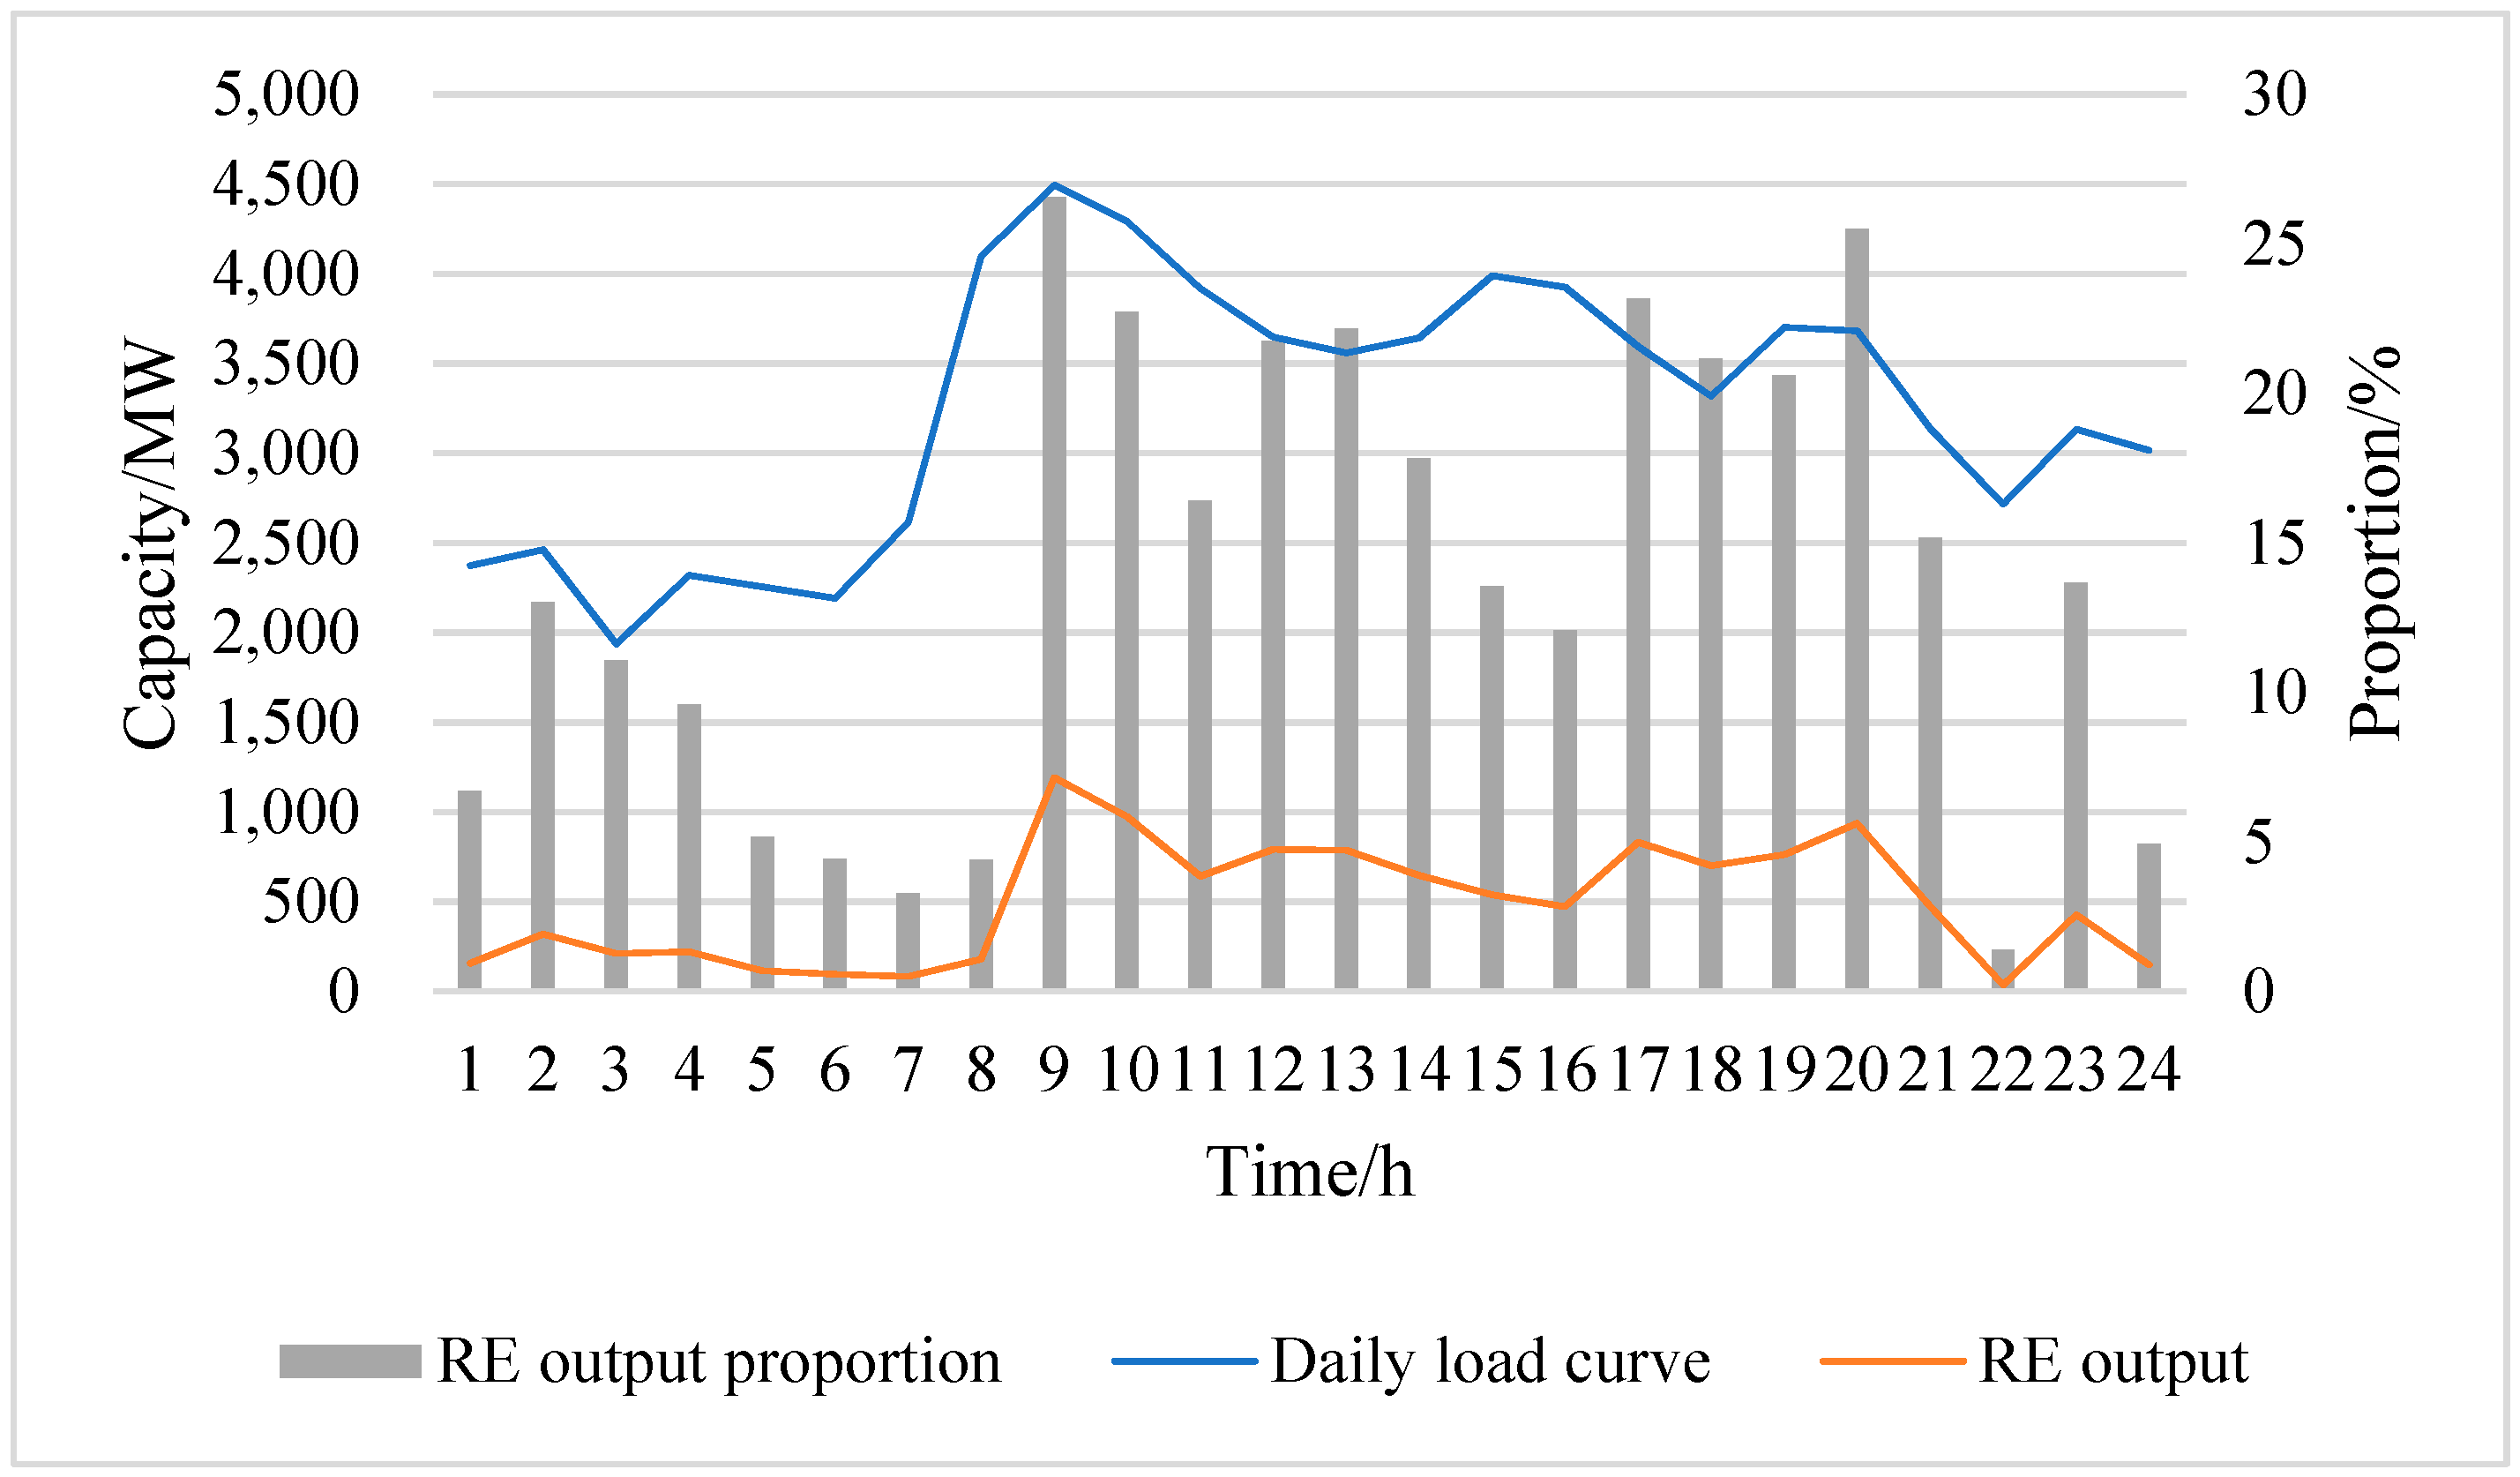
As shown in Figure 5, the number of new energy installations are expanded to increase the new energy penetration rate (total new energy installed units’ capacity/total installed units’ capacity) to 36.8%.
First, the optimal uncertainty set is rediscovered. It can be seen from Figure 6 that the proportion of the optimal uncertainty set is between 25% and 35% when the new energy penetration increases. The optimal uncertainty set, as shown in Table 3, is determined by binary search.
Taking 27% as the optimal uncertainty set, the benefits of the multi-energy coordination strategy are calculated and compared according to the steps above.
Table 4 shows the comparison of robust reserve rate and various benefits under different penetrance, and illustrates the following issues:
(a) Increased penetration, greater fluctuations in new energy, and higher system reserve requirements.
(b) The cost-effectiveness of risk increases significantly with increased penetration. This is because the fluctuation of new energy is stronger with the increase of penetration. Since the traditional method does not consider the fluctuation of new energy, its wind/light curtailment volume and cutting load increase greatly, so the risk cost increases sharply, and the risk–benefit of the corresponding robust method also increases sharply.
(c) The reduction of environmental benefit and operation benefit is caused by the reason that the increase of new energy penetration results in the increase of new energy output, on the other hand, the load is constant. Consequently, all this leads to the decrease of conventional unit output and the synchronous decrease of coal and gas consumption.
(d) The comprehensive benefit increases significantly with the increase of the penetration, which is caused by the sharp increase of the risk–benefit, which is the core benefit of the robust method. It can be shown that the comprehensive benefit of the robust method increases rapidly with the increase of penetrance.

4.4. The Influence of Energy Storage System on the Benefit of the Robust Method

Considering the fluctuation of renewable energy, in order to increase the consumption capacity of the power grid for distributed energy and reduce wind/light curtailment, the energy storage device with a capacity of 500 MW is introduced on the original system. The output of various types of energy is shown in Figure 7.
As can be seen from the above Figure 7, the introduction of the energy storage system effectively improves the output of the wind turbine during the period from 2:00 a.m. to 6:00 a.m., and reduces wind curtailment. At the same time, the discharge of the energy storage system occurs during the two periods with the highest load from 8:00 a.m. to 10:00 a.m. and from 15:00 p.m. to 16:00 p.m. Considering that the two periods are the periods when the output of the natural gas turbine rapidly increases and decreases, and the natural gas turbine is not very efficient and the operation cost is large, the discharge of the energy storage system mainly replaces the output of the natural gas turbine.
The benefit changes after the introduction of energy storage is shown in Table 5.
From Table 5, we can get the following results.
(a) Although the introduction of the energy storage systems can reduce wind curtailment and increase the proportion of distributed energy, the energy storage system itself is relatively expensive and will generate high operating costs, as a result, the benefits are not obvious from these two perspectives
(b) The introduction of the energy storage systems can effectively reduce the output of each generator set in the period with high load, and its peak load cutting, and valley filling function can effectively reduce the pressure of the grid and increase the risk–benefit of the system, which is the main source of income from the introduction of the energy storage systems.

4.5. Influence of Changes of Power Structure on Benefits of the Robust Method

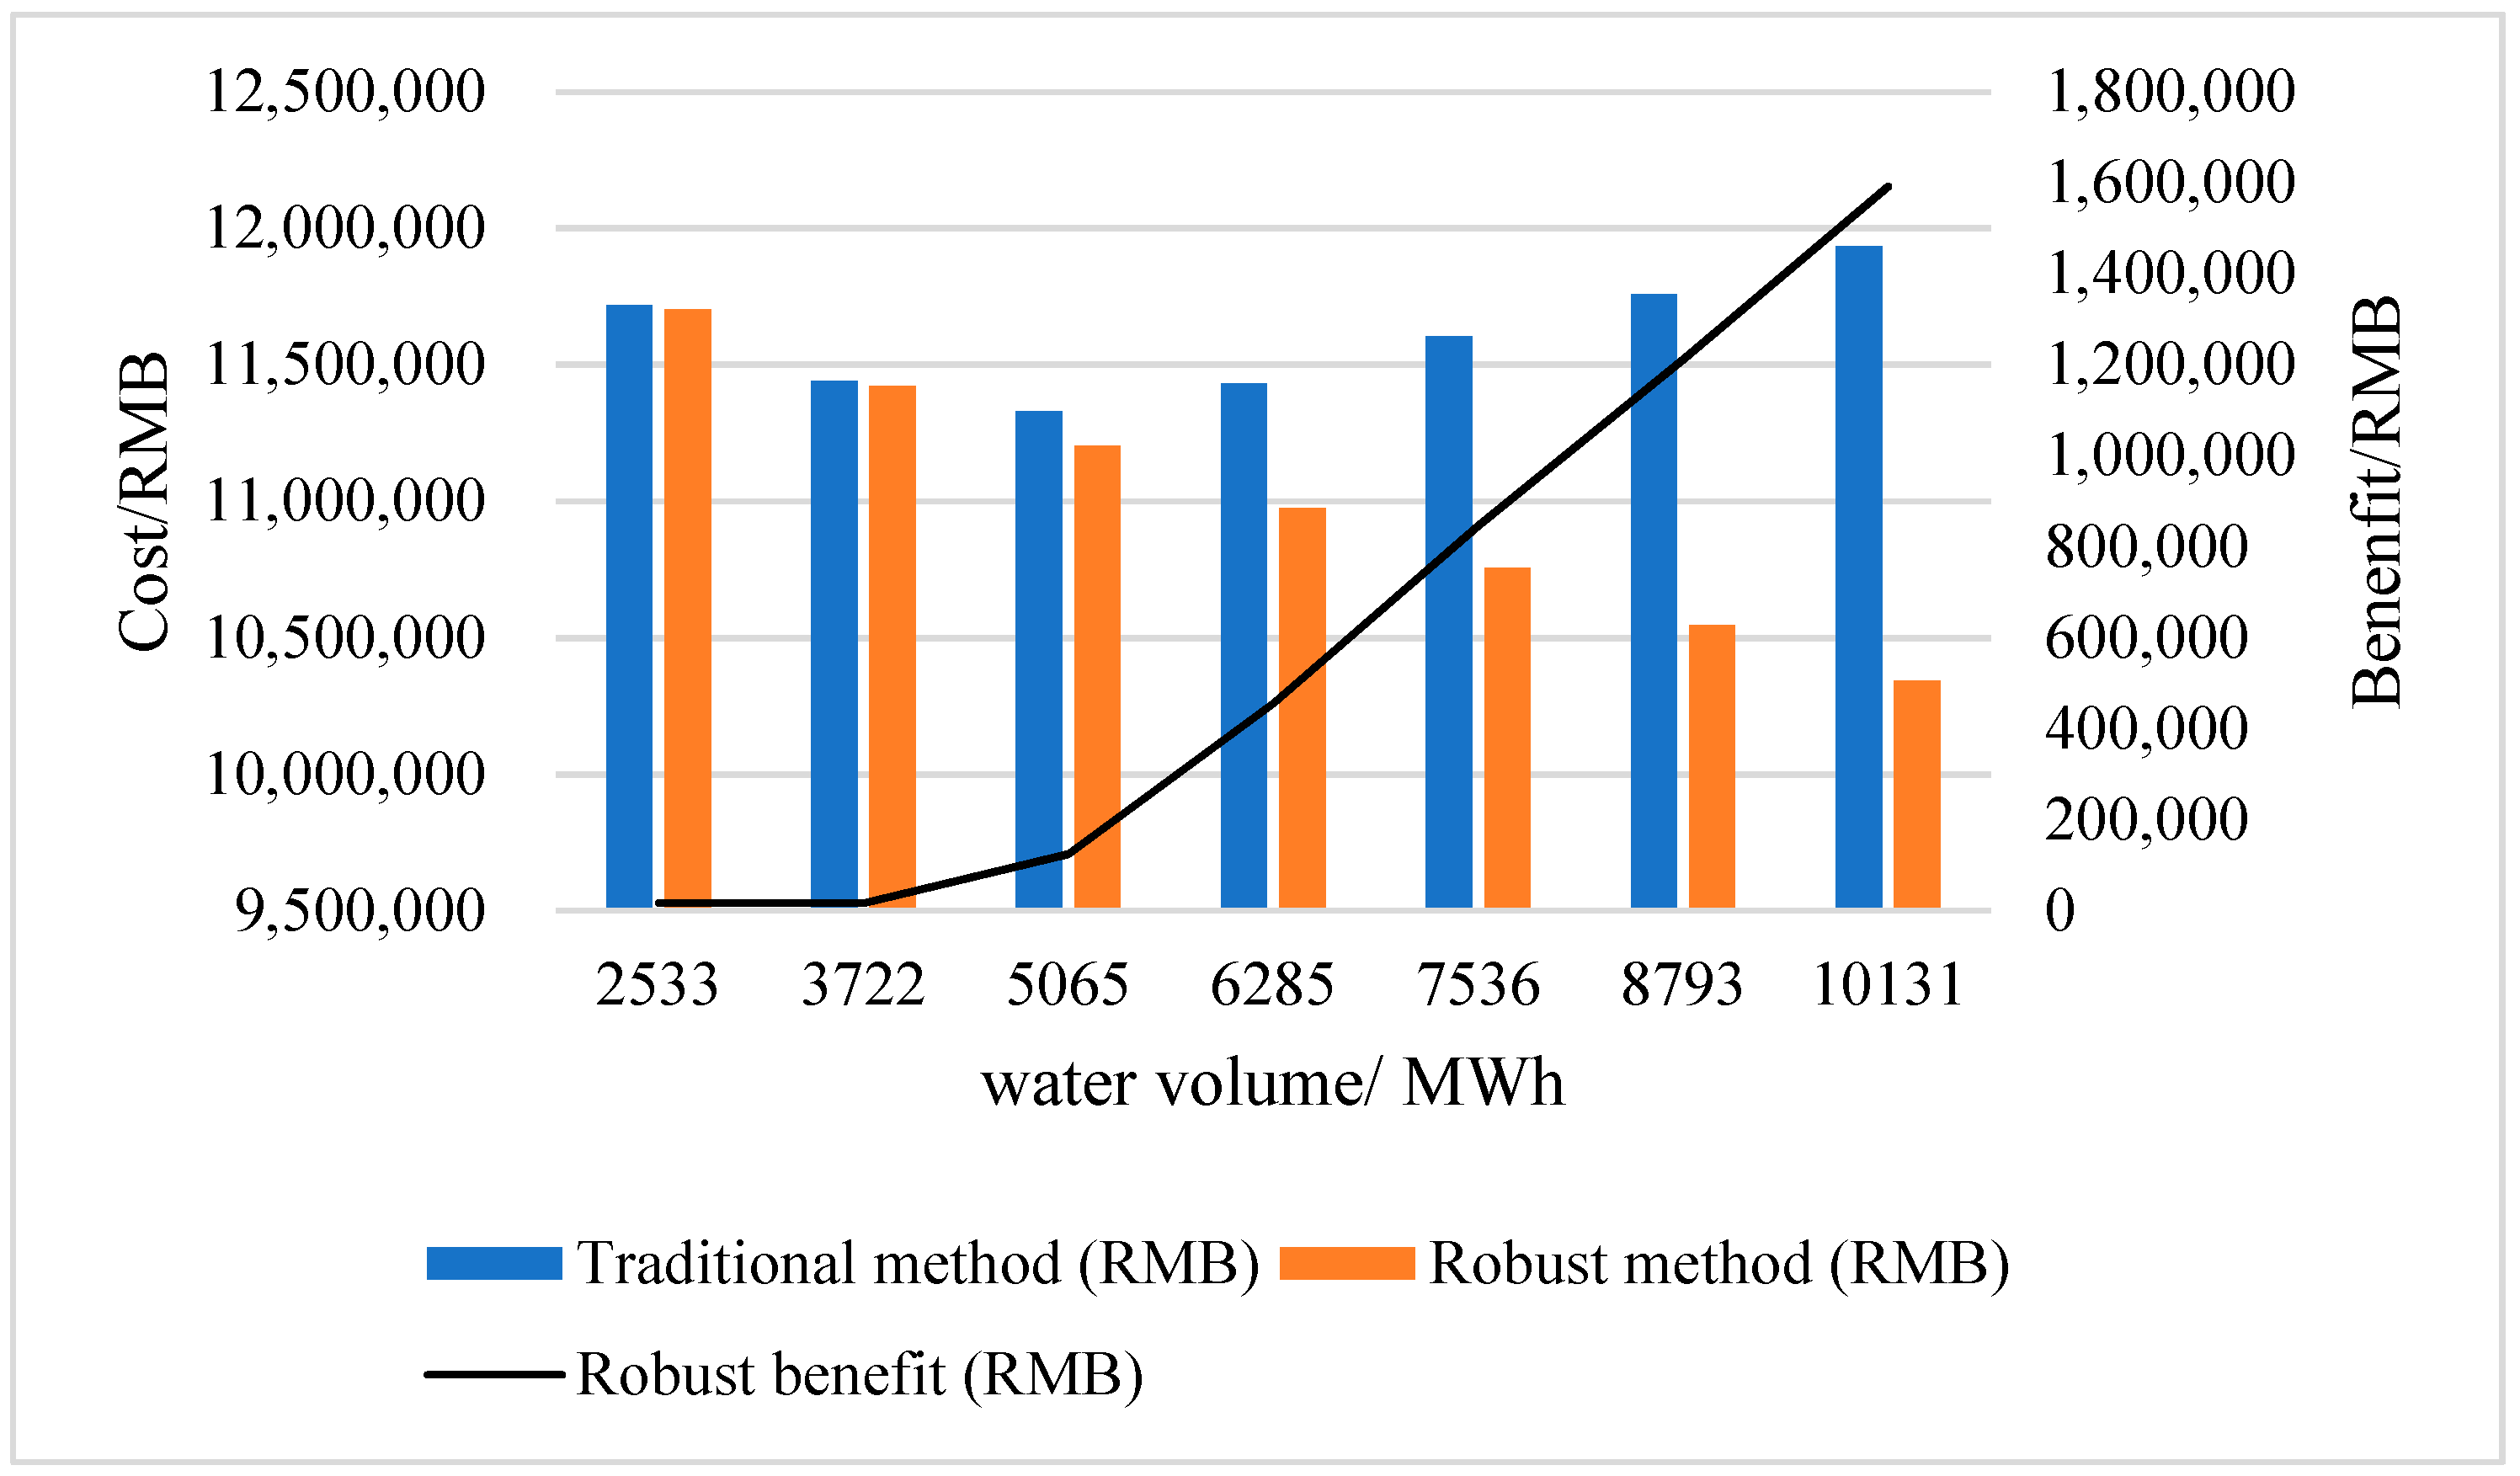
In this case, based on the initial calculation example (penetrance 18.4%, water volume 2533 MW∙h), the water limit was expanded to 10,131 MW∙h, and the ratio of hydropower output was increased to observe the benefit change of the robust method.
As can be seen from Table 6 and Figure 8, after the water limit is expanded, the robust cost decreases obviously, but the traditional cost first decreases and then increases. After the water volume is doubled, the robust benefit starts to increase obviously.
In principle, after the water limit is expanded, the output ratio of hydropower units becomes larger and larger. Since hydropower has almost no power generation cost, the total cost should be reduced, which has been clearly shown in the robust cost. However, the cost of the traditional method increases with the output of hydropower units. The reasons are as follows:
(a) After the water volume is expanded, the traditional method makes full use of the cost-free advantage of hydropower and increases the hydropower output. When the water volume is increased by four times, the hydropower has been in the rated output state of all units at full time, which makes the hydropower units lose the ability for peak regulation and standby capacity. All peak regulation and standby tasks of the system are undertaken by the primary energy unit with poor regulation ability. The consequence of the poor regulation ability of the system is that when the new energy fluctuates, more wind/light curtailment volume and cutting load will inevitably be generated, which leads to the sharp increase of risk cost and the final comprehensive cost will rise instead of falling.
(b) After the increase of hydropower output in the traditional method, the load pressure assumed by other units will decrease, the number of thermal coal-fired units will be reduced, and all gas units will be shut down, which further reduces the peak load regulation and reserve capacity of the system. As a result, the risk cost caused by the fluctuation of new energy will be increased.
After the above two reasons jointly lead to the increase of hydropower output, the cost of the traditional method increases instead of decreases, and the cost of the robust method gradually decreases, and the robust benefit becomes more and more obvious.

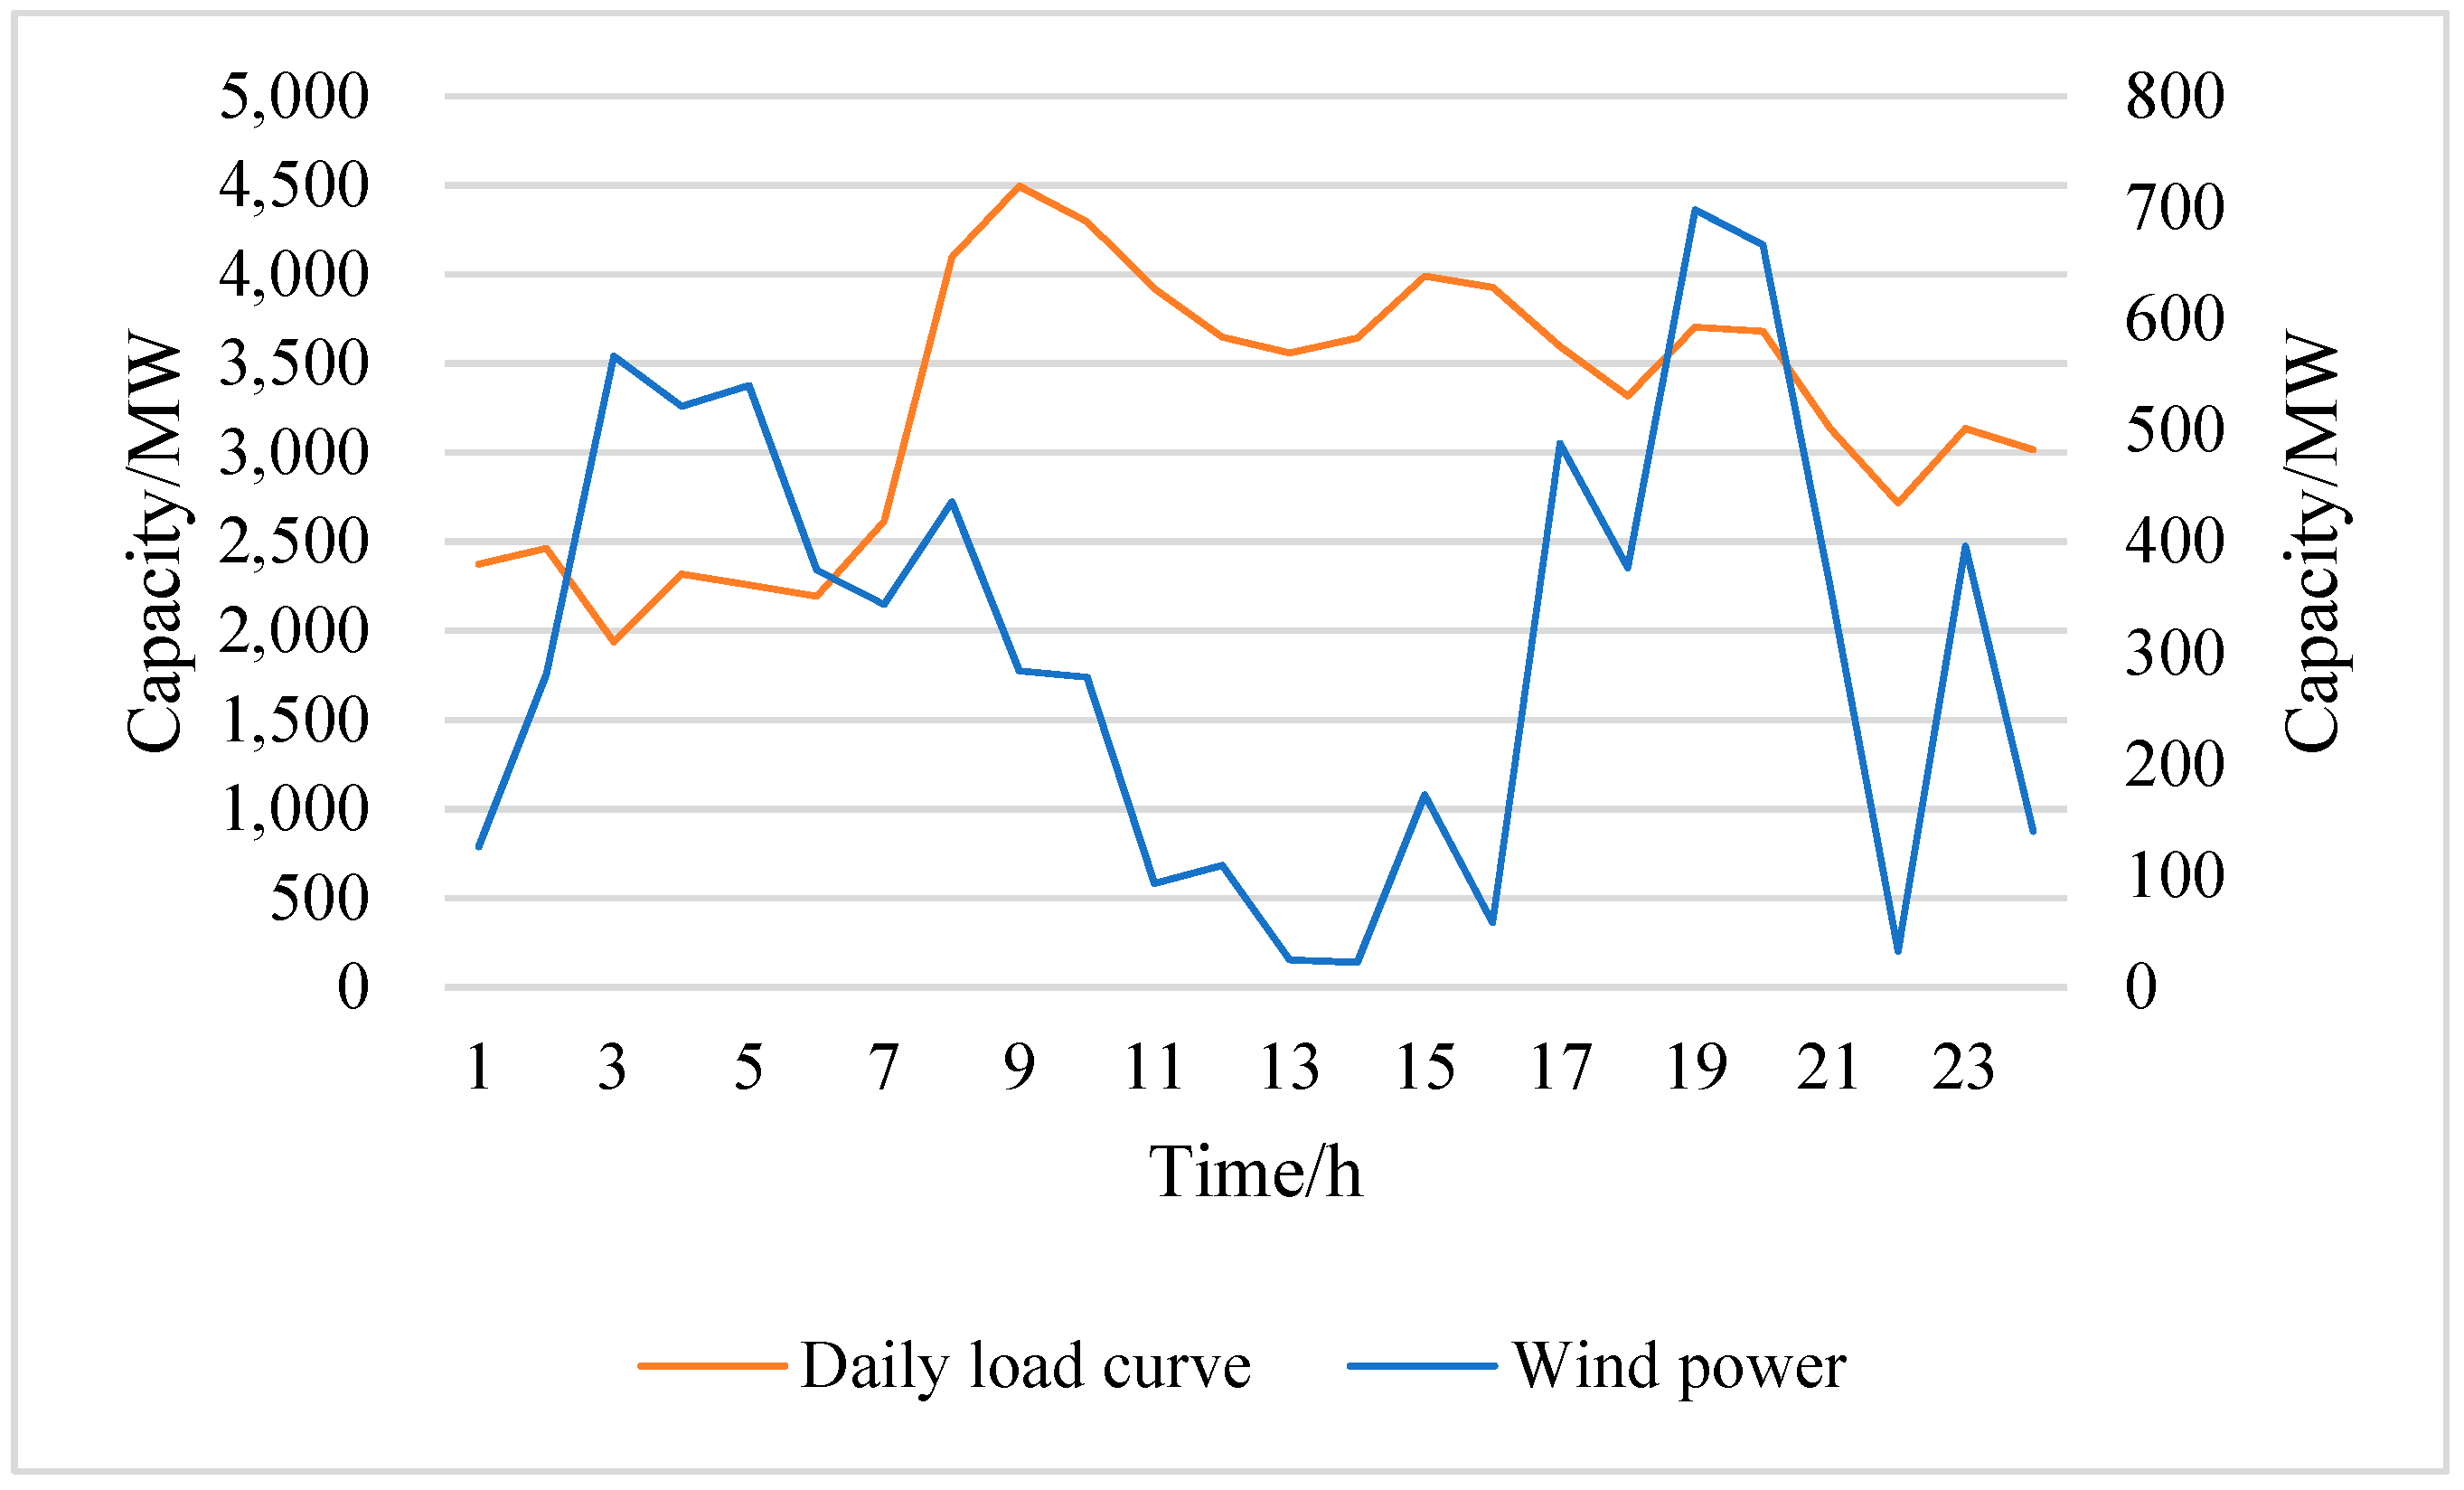
4.6. Influence of New Energy Inverse Peak Regulation on Robust Performance

At present, the new energy output curve of the calculation example is similar to the pro-peak regulation, but the new energy is capricious, and the occurrence of new energy inverse peak regulation is quite common. Therefore, it is necessary to set a new energy inverse peak regulation example to verify whether the robust method under the inverse peak regulation can be applied and how its benefits will change.
The initial calculation example is the new energy pro-peak regulation, on which new energy output is modified to replace the peak and trough of new energy output. In this way, the total output of new energy can be guaranteed unchanged, and the situation of new energy inverse peak regulation can be simulated, as shown in Figure 9.
By calculation, the comparison of costs and robustness benefits under the two conditions are shown in the following Table 7. It can be seen from Table 7 that the robust comprehensive benefits are higher under the adverse peak regulation. When the environmental and operational benefits are similar, the substantial increase of risk benefits under the adverse peak regulation results in the increase of comprehensive benefits. In Table 7, “wind/light curtailment reduction” refers to the wind/light curtailment reduction of the robust method compared to the traditional method, and “load cutting reduction” refers to the cutting load reduction of the robust method compared to the traditional method. These two terms are the key points. Obviously, in the case of inverse peak regulation, the robust method has a greater advantage in reducing wind/light curtailment and load cutting, which directly leads to a higher risk–benefit and a higher comprehensive benefit.
These examples can prove that the under the situation of inverse peak regulation, peak regulation and standby capacity pressure are larger, and if the traditional method of scheduling is applied, the execution plan will produce more wind/light curtailment and cutting load. Then, the robust method, in this case, is still able to make the scheduling plan to maintain full peak regulation and standby capacity, which leads to a better response to new energy fluctuation and gains higher comprehensive benefit.

5. Conclusions

IES are important physical carriers of the energy Internet, which undertakes the tasks of energy conversion, distribution, and storage of electricity, heat and cold. From the perspective of energy Internet, this paper proposed a multi-energy coordinated intelligent management method for the urban power grid, which considers the internal equipment operation system and network stable operation constraints. In the case of energy interconnection, the day-ahead plan obtained by the robust method can meet the backup and peak load regulation needs of the system’s two key points, peak load and valley load. It is a safe and reliable day-ahead scheduling algorithm. As the generation capacity of new energy with uncertainty increases, scheduling by the robust method can not only reduce the generation cost and environmental cost but also reduce wind/light curtailment and load cutting, thus greatly increasing the risk benefit. Since this paper did not consider the constraints of the power grid and the impact of electric vehicles on energy management in the research process, it is necessary to combine large-scale energy storage technology for future work.

Author Contributions

X.K. and X.W conceived the idea of the study and conducted the research. X.W. and F.S. analyzed most of the data and wrote the initial draft of the paper. Z.E. and C.Z. provided data for the study and contributed to finalizing this paper.

Funding

This research was funded by the science and technology project of state grid Tianjin electric power company (KJ19-1-20) “The intelligent management research and application of sources coordination for large scale urban power network”.

Conflicts of Interest

The authors declare no conflict of interest.

References

  1. Challenge for the Future Society: Smart Energy Network. Available online: http://www.Tokyo-gas.Co.jp/techno/challenge/002_e.html (accessed on 9 October 2014).
  2. Huang, A.Q.; Crow, M.L.; Heydt, G.T. The future renewable electric energy delivery and management (FREEDM) system: The energy internet. Proc. IEEE 2011, 99, 133–148. [Google Scholar] [CrossRef]
  3. Jiang, X.S.; Jing, Z.X.; Li, Y.Z. Modeling and operation optimization of an integrated energy based direct district water-heating system. Energy 2014, 64, 375–388. [Google Scholar] [CrossRef]
  4. Yu, X.D.; Xu, X.D.; Chen, S.Y. A brief review to integrated energy system and energy internet. Trans. China Electrotech. Soc. 2016, 31, 1–13. [Google Scholar]
  5. Wang, C.S.; Wang, S.X. Study on some key problems related to distributed generation systems. Autom. Electr. Power Syst. 2008, 32, 32–41. [Google Scholar]
  6. Xu, X.D. Modeling, Simulation, and Energy Management Research for Electricity, Gas, and Heat Based Micro Energy System. Ph.D. Thesis, Tianjin University, Tianjin, China, November 2014. [Google Scholar]
  7. Wang, W.L.; Wang, D.; Jia, H.J. Review of Steady-state Analysis of Typical Regional Integrated Energy System Under the Background of Energy Interne. Proc. CSEE 2016, 36, 3292–3305. [Google Scholar]
  8. GRID2030-a National Vision for Electricity’s Second 100 Years [EB/OL]. Available online: http://www.ferc.gov/eventcalendar/files/20050608125055-grid-2030.pdf (accessed on 9 October 2014).
  9. Dong, Z.; Zhao, J.; Wen, F. From smart grid to energy internet: Basic concept and research framework. Autom. Electr. Power Syst. 2014, 38, 1–11. [Google Scholar]
  10. Han, X.Y.; Chai, Y.F.; Zhang, Y. Analysis of Several Key Issues in Construction of the Urban Energy Internet. Electr. Power Constr. 2018, 39, 138–146. [Google Scholar]
  11. Bejestani, A.K.; Annaswamy, A.; Samad, T. A hierarchical transactive control architecture for renewables integration in smart grids: Analytical modeling and stability. IEEE Trans. Smart Grid 2014, 5, 2054–2065. [Google Scholar] [CrossRef]
  12. Wang, L.X.; Zheng, J.H.; Li, M.S. Multi-time scale dynamic analysis of integrated energy systems: An individual-based model. Appl. Energy 2019, 237, 848–861. [Google Scholar] [CrossRef]
  13. Wang, H.; Yin, W.; Abdollahi, E. Modelling and optimization of CHP based district heating system with renewable energy production and energy storage. Appl. Energy 2015, 159, 401–421. [Google Scholar] [CrossRef]
  14. Chen, Y.; Jia, K.; Liu, B. Energy management method applying in integrated energy system. In Proceedings of the International Conference on Electric Utility Deregulation & Restructuring & Power Technologies, Changsha, China, 26–29 November 2015. [Google Scholar]
  15. Mohammadi, F. Design, Analysis, and Electrification of a Solar-Powered Electric Vehicle. J. Sol. Energy Res. 2018, 3, 293–299. [Google Scholar]
  16. Mu, Y.; Wu, J.; Jenkins, N. A Spatial-Temporal model for grid impact analysis of plug-in electric vehicles. Appl. Energy 2014, 114, 456–465. [Google Scholar] [CrossRef]
  17. Martinezmares, A.; Fuerteesquivel, C.R. A Unified Gas and Power Flow Analysis in Natural Gas and Electricity Coupled Networks. IEEE Trans. Power Syst. 2012, 27, 2156–2166. [Google Scholar] [CrossRef]
  18. Duenas, P.; Leung, T.; Gil, M. Gas–Electricity Coordination in Competitive Markets Under Renewable Energy Uncertainty. IEEE Trans. Power Syst. 2015, 30, 123–131. [Google Scholar] [CrossRef]
  19. Lei, J.Y.; Yu, L.; Guo, X.B. Planning Method for Integrated Energy System with the Consideration of Coupling among Power, Heat, and Gas. Proc. Csu-Epsa 2019, 1, 19–24. [Google Scholar]
  20. Stanislav, P.; Bryan, K.; Tihomir, M. Smart Grids better with integrated energy system. In Proceedings of the Electrical Power & Energy Conference, Montreal, QC, Canada, 22–23 October 2009. [Google Scholar]
  21. Jia, H.J.; Wang, D.; Wang, X.D. Research on Some Key Problems Related to Integrated Energy Systems. Autom. Electr. Power Syst. 2015, 39, 198–207. [Google Scholar]
  22. Kenji. Reactive power optimization by genetic algorithm. IEEE Trans. Power Syst. 1994, 9, 685–692. [Google Scholar] [CrossRef]
  23. Pakazad, S.K.; Hansson, A.; Annergren, M.S. Distributed primal-dual interior-point methods for solving loosely coupled problems using message passing. Optim. Methods Softw. 2015, 32, 401–435. [Google Scholar] [CrossRef]
  24. Jones, C.N.; Kerrigan, E.C.; Maciejowski, J.M. Lexicographic perturbation for multiparametric linear programming with applications to control. Automatic 2007, 43, 1808–1816. [Google Scholar] [CrossRef] [Green Version]
  25. Kong, X.Y.; Ma, Y.Y.; Zhao, X.; Li, Y.; Teng, Y.X. A Recursive Least Squares Method with Double-Parameter for Online Estimation of Electric Meter Errors. Energies 2019, 12, 805. [Google Scholar] [CrossRef]
  26. Jun, Z.; Yan, W.; Dan, W. Research Progress in Energy Internet: Definition, Indicator and Research Method. Proc. Csu-Epsa 2018, 10, 1–14. [Google Scholar]
  27. Kong, X.; Bai, L.; Hu, Q. Day-ahead optimal scheduling method for grid-connected microgrid based on energy storage control strategy. J. Mod. Power Syst. Clean Energy 2016, 4, 648–658. [Google Scholar] [CrossRef] [Green Version]
  28. Wang, Y.C.; Chen, H.Y.; Xuan, P.Z. A Robust Scheduling with Multiple Types of Power Sources Based on Optimal Scenario Set. Power Syst. Technol. 2016, 40, 354–362. [Google Scholar]
  29. Bai, L.; Li, F.; Cui, H. Interval optimization based operating strategy for gas-electricity integrated energy systems considering demand response and wind uncertainty. Appl. Energy 2016, 167, 270–279. [Google Scholar] [CrossRef] [Green Version]
  30. Yong, C.S.; Kong, X.Y.; Chen, Y. Multi-objective Scheduling of an Active Distribution Network Based on Coordinated Optimization of Source Network Load. Appl. Sci. 2018, 8, 1888. [Google Scholar] [CrossRef]
  31. Gao, H.; Xue, L.Y. Back Propagation Neural Network Based on Improved Genetic Algorithm Fitting LED Spectral Model. Laser Optoelectron. Prog. 2017, 54, 294–302. [Google Scholar]
  32. Bai, L.; Wang, J.; Wang, C. Distribution Locational Marginal Pricing (DLMP) for Congestion Management and Voltage Support. IEEE Trans. Power Syst. 2017. [Google Scholar] [CrossRef]
  33. Jambagi, A.; Kramer, M.; Cheng, V. Electricity and Heat Sector Coupling for Domestic Energy Systems: Benefits of Integrated Energy System Modelling. In Proceedings of the 4th International Conference on Smart Cities & Green Ice Systems, Lisbon, Portugal, 15 October 2015. [Google Scholar]
  34. Mohammadi, F. Power Management Strategy in Multi-Terminal VSC-HVDC System. In Proceedings of the 4th National Conference on Applied Research in Electrical, Mechanical, Computer and IT Engineering, Tehran, Iran, 4 October 2018. [Google Scholar]
  35. Wu, H.Y.; Guan, X.H.; Zhai, Q.Z. Short-term Hydrothermal Scheduling Using Mixed-integer Linear Programming. Proc. CSEE 2009, 29, 82–88. [Google Scholar]
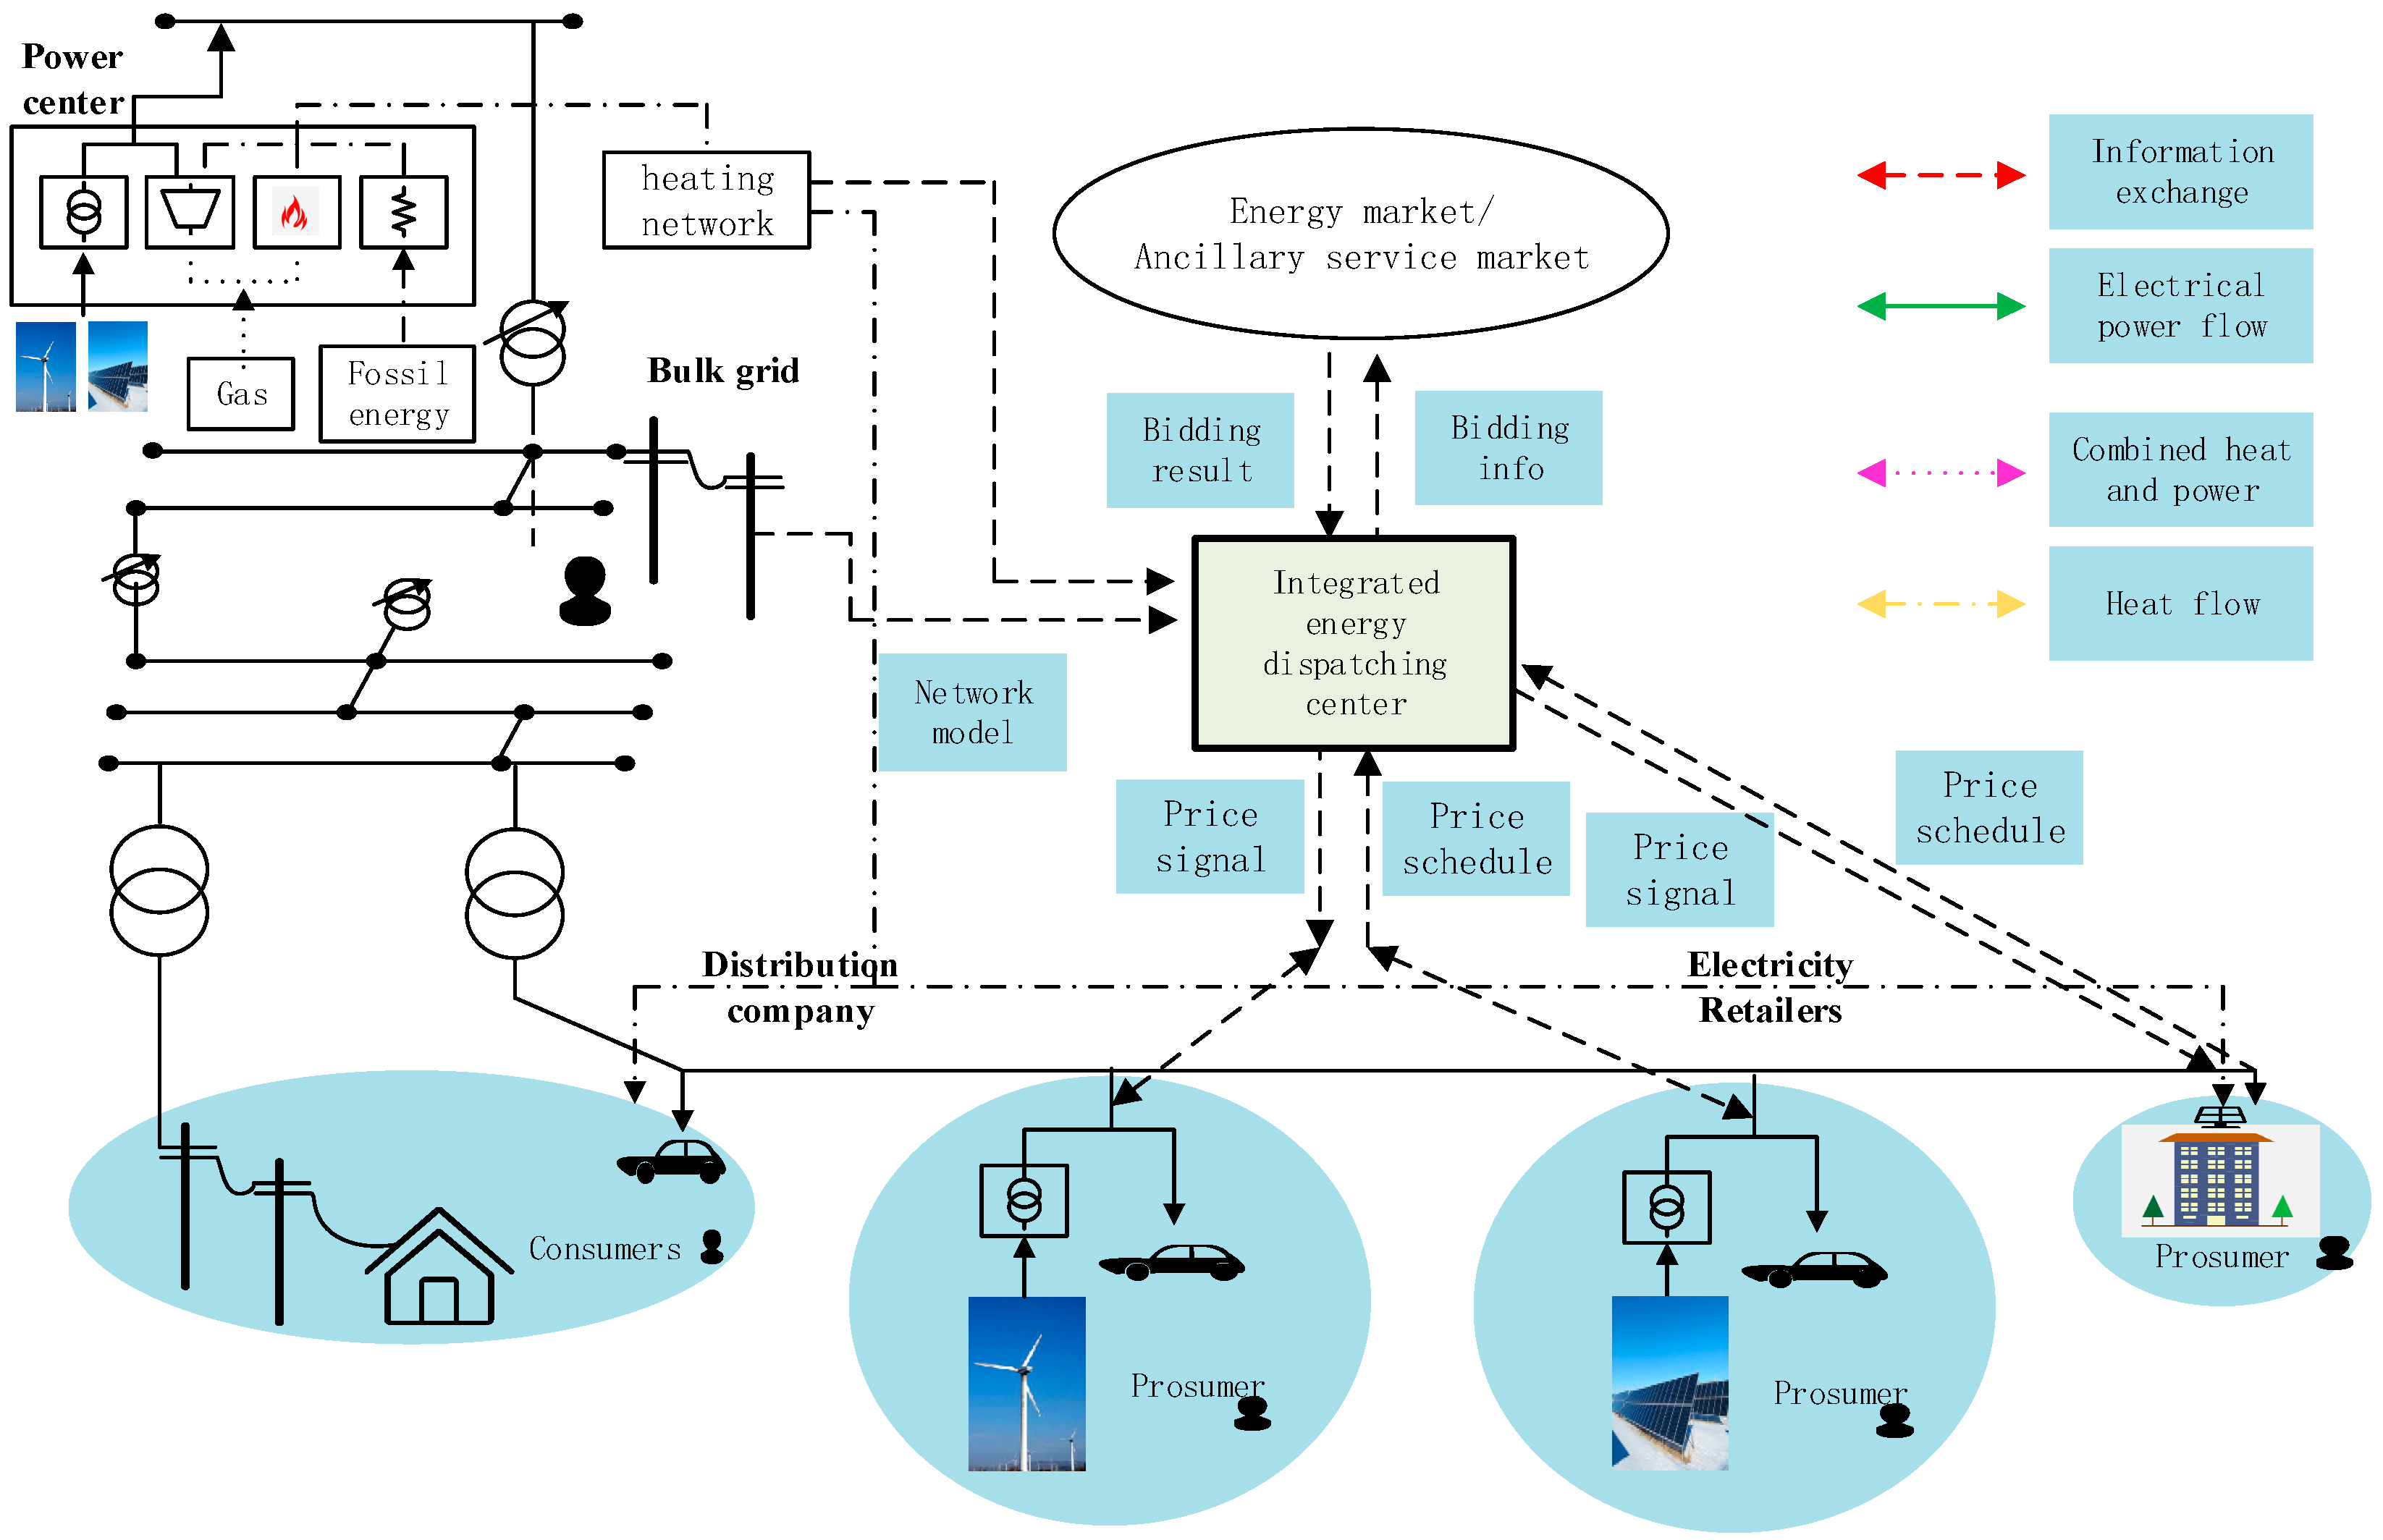
Figure 1. The multi-energy coordination system architecture of an urban power grid.
Applsci 09 02608 g001
Figure 2. Flow chart of a solving multi-energy coordination problem based on the alternating direction multiplier algorithm.
Applsci 09 02608 g002
Figure 3. Urban power grid load and new energy prediction curve.
Applsci 09 02608 g003
Figure 4. Energy output diagram of each type on a typical day.
Applsci 09 02608 g004
Figure 5. Modified load and new energy forecast curve.
Applsci 09 02608 g005
Figure 6. Comprehensive costs under different uncertainty sets.
Applsci 09 02608 g006
Figure 7. Energy output diagram of each type.
Applsci 09 02608 g007
Figure 8. Robustness benefit after increasing water quantity.
Applsci 09 02608 g008
Figure 9. New energy reverse peak adjustment output.
Applsci 09 02608 g009
Table 1. Power supply capacity ratio of the power grid.
Power Source TypeWind PowerPVCoalGasHydraulicTotal
Capacity (MW)976.0700.02474.0497.6800.05447.6
The percentage17.92%12.85%45.41%9.13%14.69%100%
Table 2. Comparison between different methods when the uncertainty set is 25%.
Wind/Light Curtailment
(MWh)
Cutting Load
(MWh)
The Cost of Risk
(RMB)
Environmental Costs
(RMB)
Power Generation Cost
(RMB)
Comprehensive Cost
(RMB)
The traditional method141.60.68566,889.81,999,128.18,202,832.410,268,850.3
The robust method141.60.07836,682.11,988,924.18,227,298.810,252,905
Difference0.0230.60630,207.710,204−24,466.415,945.3
Table 3. Optimization results of uncertain sets.
The Proportion20%25%30%35%45%55%
Comprehensive cost (RMB)10,559,895.110,049,988.810,019,681.410,056,537.710,475,301.111,576,782.2
Table 4. Comparison of two penetrance robustness methods.
PenetranceThe Fluctuation of Peak-Load New Energy (MW)Rotational ReserveRisk–Benefit (RMB)Environmental Benefits (RMB)Operation Efficiency (RMB)Comprehensive Benefits (RMB)
18.4%179.713.8%29,315.710,325.9−24,702.614,939
36.8%323.529.2%490,167.78128.4−78,763.6419,532.5
Difference143.815.4%460,852−2197.5−54,061404,593.5
Table 5. Comparison of benefits before and after the introduction of the energy storage systems.
The Fluctuation of Peak-Load New Energy (MW)Rotational ReserveRisk–Benefit (RMB)Environmental Benefits (RMB)Operation Efficiency (RMB)Comprehensive Benefits (RMB)
No energy storage system209.916.1%34,42211,963−28,61717,768
With energy storage system162.612.3%96,48256,891−68,28585,088
Difference−47.3−3.7%62,06044,928−39,66867,320
Table 6. Robustness benefits after water volume increases.
Water volume (MW∙h)25333722506562857536879310,131
Traditional method (kRMB)11,60011,32411,21311,31611,48611,64111,814
Robust method (kRMB)11,58411,30711,08910,86510,64910,44010,238
Robust benefit (RMB)16,72516,600123,841451,610838,3161,200,5011,575,818
Table 7. Comparison of the robust benefits of clockwise and inverse peak regulation.
Wind/Light Curtailment Reduction (MWh)Load Cutting Reduction (MWh)Risk–Benefit (RMB)Environmental Benefits (RMB)Operation Benefit (RMB)Comprehensive Benefits (RMB)
Down load4.5610.63630,616.6610,597.26−25,622.7915,591.13
Inverse peak shaving127.5482.686162,635.35926.7−31,936.46136,625.59
Difference value (inverse-cis)132.1092.050132,018.6−4670.56−6313.67121,034.46