Communication

A Prototype of a Portable Gas Analyzer for Exhaled Acetone Detection

Department of Electronics, AGH University of Science and Technology, 30-059 Krakow, Poland
*
Author to whom correspondence should be addressed.
Appl. Sci. 2019, 9(13), 2605; https://doi.org/10.3390/app9132605
Submission received: 1 June 2019 / Revised: 21 June 2019 / Accepted: 25 June 2019 / Published: 27 June 2019

Abstract

:

Featured Application

Exhaled breath analysis with special emphasis on diabetes. Patients with diabetes (mostly type-1) tend to have higher acetone levels in their breath than healthy people, therefore, the exhaled acetone is considered to be one of the biomarkers of this disease.

Abstract

The paper presents the development of a portable gas analyzer prototype for exhaled acetone detection, employing an application-suited gas sensor array and 3D printing technology. The device provides the functionality to monitor exhaled acetone levels, which could be used as a potential tool for non-invasive diabetes monitoring. The relationship between exhaled acetone concentrations and glucose in blood is confirmed in the literature, including research carried out by the authors. The design process is presented including a general consideration for the sensor array construction, which is the core for sensing gases, as well as requirements for the measurement chamber it is to be placed in. Moreover, the mechanical design of the 3D-printed housing is discussed to ensure the ergonomics of use as a hand-held device while keeping the hardware integrity. Also, the processing hardware is discussed to provide sufficient computing power to handle the stand-alone operation while being energy efficient, enabling long battery-powered operation. Finally, calibration and measurement, as well as the analyzer operation, are shown, validating the proposed class of exhaled acetone-detection capable meters.

1. Introduction

Exhaled human breath consists of several different compounds, including volatile organic compounds (VOCs), which are continuously generated in the human body and are partially emitted via exhaled breath, through the skin, and by urine and feces [1,2,3]. VOCs are mainly in the ppm–ppt (part per million to part per trillion) range, thus, laboratory methods are used for their detection in breath, such as GC-MS (gas chromatography–mass spectrometry) [4,5], PTR-MS (proton transfer reaction–mass spectrometry) [6,7], IMS-MS (ion-mobility spectrometry–mass spectrometry) [8,9], and SIFT-MS (selected ion flow tube–mass spectrometry) [10,11]. Over the last 40 years, almost 3500 different VOCs have been detected in the human breath [12], and a single breath consists of around 500 various VOCs [13]. The biomarkers present in the exhaled breath are used to indicate several diseases, including lung cancer [14,15], asthma [16,17], chronic obstructive pulmonary disease [18,19], breast cancer [20,21], diabetes [22,23], etc. The total number of diseases that can be detected or controlled by exhaled breath analysis is still unknown [24]. Exhaled human breath analysis has been developing for many years with the utilization of several different methods and techniques, for example, exhaled nitric oxide (FeNO) is currently used in clinical practice. However, it took 12 years from when the first report [25] about an increased level of NO in bronchial asthma was published until the first medical use of FeNO analysis in routine clinical practice. Another example is exhaled breath condensate (EBC) measurements. EBC is a promising source of biomarkers of lung disease; however, it is not a biomarker, but rather a matrix in which biomarkers may be identified [26]. The first papers concerning possible medical applications for EBC were published in early 1980, but a publication boom started in 2006, and the number of papers has increased in each subsequent year. After the American Thoracic Society (ATS) and the European Respiratory Society (ERS) developed guidelines for EBC collection and measurement, such measurements started to be commonly applied in asthma and COPD (Chronic obstructive pulmonary disease) diagnoses. One of the global diseases that is the cause of millions of deaths per year is diabetes. This is a chronic disease that occurs either when the pancreas does not produce enough insulin or when the body cannot effectively use the insulin it produces. Insulin is a hormone that regulates blood sugar. Hyperglycemia, or raised blood sugar, is a common effect of uncontrolled diabetes and, over time, leads to serious damage to many of the body’s systems, especially the nerves and blood vessels. Based on actual data provided by the World Health Organization (WHO), 422 million adults have diabetes, and it is projected that diabetes will be the seventh leading cause of death by 2030 [27]. The conventional method for glucose monitoring is based on blood glucose measurements, and it has been used in clinical practice for at least 50 years. Moreover, it has been observed that patients with diabetes tend to have higher acetone levels in their breath than non-diabetics [28]. Due to its increased levels, acetone can be regarded as a biomarker of this disease. The number of people with diabetes increases every year. The exhaled acetone is usually within the range of 0.2–0.9 ppm for non-diabetics, and in the range of 1.25–2.5 ppm for people with diabetes [29]. Some references show that the acetone level can increase up to 25 ppm for type-1 diabetes [30]. The development of gas sensors technology has enabled the possibility to fabricate acetone sensors with sensitivities in the ppm range. The latest achievements in this field are reviewed and discussed in [31,32,33].
In this paper, we present for the first time, to the best of our knowledge, a prototype of a portable gas analyzer for exhaled acetone detection. By taking advantage of gas sensor technology on one hand and the design freedom offered by the 3D printing technology on the other, a dedicated device with the potential for non-invasive continuous glucose level monitoring is developed. In contrast to the commercially available devices [34,35,36], the proposed device is highly-selective and highly-sensitive due to its multi-sensor setup and processing. The presented design process includes a general proposal for the sensor array construction, the properties for the gas-sensing layer, and the requirements for the dedicated measurement chamber the gas-sensing layer is to be placed in. Moreover, the mechanical design of the 3D-printed housing is discussed to ensure the ergonomics of its use as a hand-held device while maintaining hardware integrity. Additionally, the processing hardware is discussed to provide sufficient computing power to handle the stand-alone operation while being energy efficient, thus enabling long battery-powered operation. Finally, calibration and measurement techniques as well as the analyzer operation are shown, validating the proposed exhaled acetone-detection meter.

2. Development of the Portable Gas Analyzer

This section presents and discusses the development and construction of the portable breath analyzer. The device is constructed upon an electrochemical gas sensor array placed in a dedicated measurement chamber. When the array is exposed to the exhaled breath sample, the resistance of each sensor is dependent upon three factors: gas concentration, humidity, and temperature. In addition to acetone, which is the most important biomarker, other gases, including ethanol, can also be found in exhaled breath. The use of many sensors with different sensitivities to gases in the exhaled air provides excessive information that, after some processing, enables the system to precisely determine the concentration of acetone despite other gases being present. The prototype analyzer was assembled using a custom 3D-printed housing and dedicated PCBs (printed circuit boards) with control electronics. Detailed descriptions of the individual components are presented in the following subsections.

2.1. Gas Sensor Array

The prototype is currently patent pending in the European Patent Office as well as specified within a non-disclosure agreement between the designers and investors; therefore, the presented description gives a general overview. The proposed gas sensor array was realized in an arrangement where a sensor that is highly sensitive to acetone is accompanied by a set of sensors sensitive to other exhaled breath constituents with little to no sensitivity to acetone. In the presented study, the gas sensor array is based on four various sensors named S1–S4. Such a configuration allows for the reduction of uncertainty and for an improvement in the selectivity of the exhaled acetone detection. In the presence of a detectable gas, the conductivity of each of the sensors increases depending on the concentration of gas in the air, thus, the sensor acts as a resistor of variable resistance. A simple electrical circuit can translate the change in conductivity into an output signal that corresponds to the gas concentration. The sensor requires two voltage inputs: heater voltage VH and circuit voltage VCC. The heater voltage is applied to the integrated heater in order to maintain the sensing element at a specific temperature that is optimal for sensing. Circuit voltage is applied to allow measurement of voltage VRL across a load resistor RL, which is connected in series with the sensor; this creates a voltage divider, and the voltage can be adapted to the signal processing circuit. The voltage VRL increases when the resistance of the sensor RS decreases in proportion to the gas concentration. The resistance RS can be calculated from the formula:
R S = R L ( V C C V R L 1 )
It should be noted that the above relation leads to uneven measurement resolution as VRL is measured in quantized increments of VLSB (Analog Digital Converter Least Significant Bit in terms of voltage) while the calculated sensor resistance is an inverse function. Therefore, special care must be taken when selecting RL to yield a maximum measurement resolution that is centered around the desired range of detectable concentrations.
Sensors used to construct the sensing array have four main unfavorable properties that should be taken into account: First, sensors require a relatively long pre-heating time using the built-in heater, extending the required time before the first measurement from 1 h to 7 days to burn out any pollution and stabilize the working temperature. Secondly, the sensors‘ responses are relatively slow, and an appropriate time between measurements is required for sensors to return to their original state. Thirdly, sensors are sensitive to changes in the temperature and humidity of the gas volume being tested, for example, a slight blast of cold air causes a change in temperature and humidity, and thus a change in the resistance RS. Lastly, like most of these types of sensors, the main sensor is not only selective for acetone but also for other gases, including ethanol, which means that the measurement of acetone content in the exhaled air is influenced by activities such as, for example, drinking alcohol. The influence of these phenomena can be minimized by means of appropriate heating and calibration of the system to ensure appropriate measurement conditions, in other words, isolating of the sensor from undesirable gases as well as correcting the measurements with respect to the humidity and temperature of the gas volume being tested.

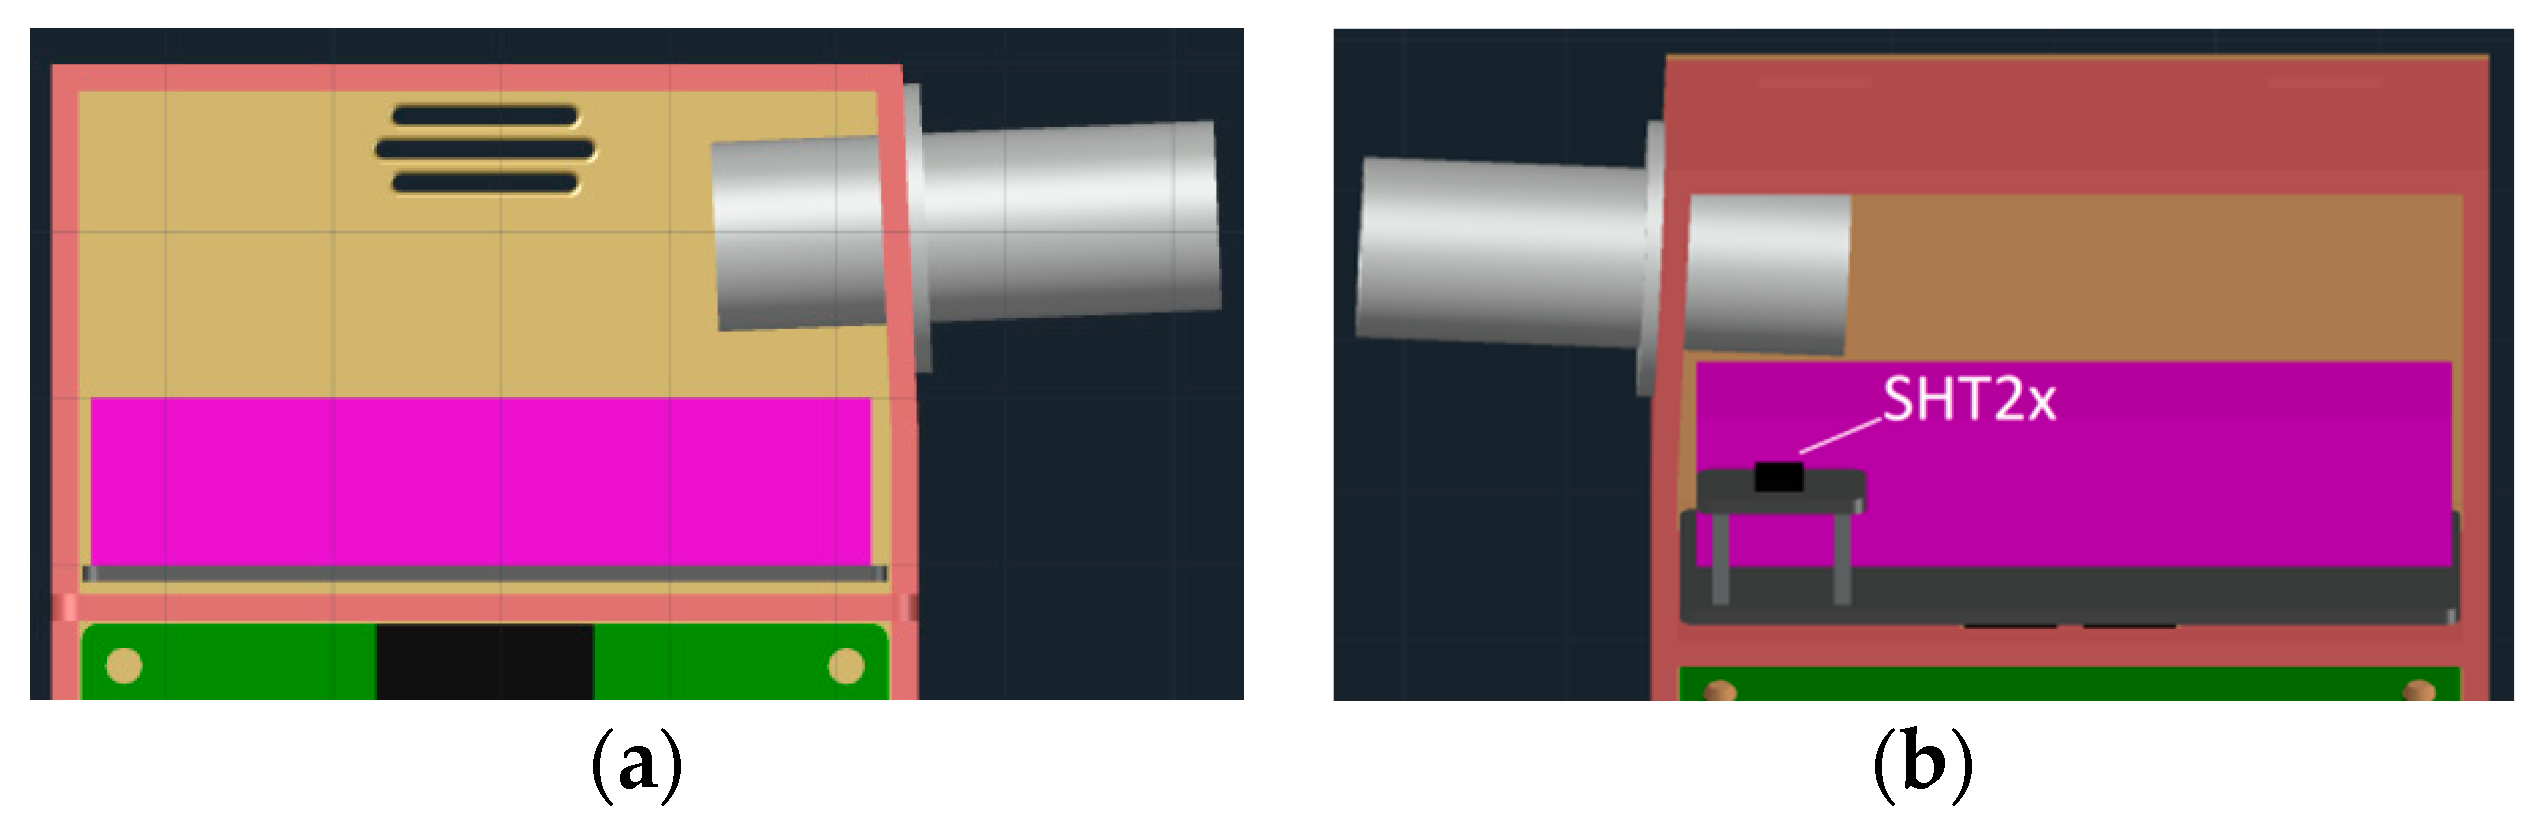
2.2. Gas Chamber Design

Operation of the device is based on the measurement of a sample of exhaled breath blown into the measurement chamber of the device through a removable mouthpiece. To achieve an accurate reading of the gas concentration in the exhaled air, the sensor needs time to set and reach the maximum value. This means that the sensor must be exposed to the gas sample to be tested in an isolated environment for a given time. The mechanical construction of such a chamber should, therefore, meet several requirements.
First of all, it is good if the mouthpiece is equipped with a one-way valve that does not allow the air volume to escape, ensures tightness, minimizes the presence of other gases with which the sensor could react, and ensures that the air blown in will have relatively constant pressure.
Secondly, the sensors array should not be located in the direct path of the air blown through the mouthpiece as it could lead to overloading of the sensors and would require a long recovery time. However, the mouthpiece should be at a slightly tilted angle from the perpendicular position to direct the gas stream through reflection from the back wall to the sensor array area.
Thirdly, the tightness of the chamber during the measurement is important, but after the measurement is completed and before proceeding to the next measurement, the chamber must be easily ventilated. This is required so the sensor can return to its original state, and the previously tested volume of air does not affect the next measurement.
Finally, breath is relatively warm and humid, which affects the sensors‘ response and may lead to a false measurement of gas concentrations. Therefore, a hygro-thermometer is needed to correct for that. To obtain a relatively accurate measurement of the humidity and temperature of the exhaled air sample, a free flow of air must be ensured. Moreover, the meter should not be located too close to the sensors as the integrated heaters heat and dry the air around sensors‘ housings nor should it be located in a direct path of the air blown through the mouthpiece as the increased pressure may alter the readout.
The gas chamber in the developed analyzer was designed by taking into account the above requirements. The gas chamber is a dedicated compartment in the device housing. The intake is designed in a way that accepts a disposable breathalyzer mouthpiece featuring a one-way valve for blowing the exhaled breath. On the other hand, a small grate opening located perpendicularly to the direct sample path is introduced to expose the chamber to ambient air. Such construction allows the sensing array to be exposed to the breath sample long enough for sensors to produce a stable response while enabling the chamber to be ventilated slowly through convection; blowing in the sample increases pressure in the chamber while the sample is slowly dried and heated due to heaters within the sensor structure. An opening forces pressure equalization to the ambient pressure, thus leading to the sample being vented out. In this way, sensor array can return to its initial state. All of the TGS sensors are attached to a dedicated PCB that connects to the motherboard through an opening in the divider. Moreover, the PCB hosts a daughterboard with a digital humidity and temperature sensor, Sensirion SHT21 in a DFN (Dual Flat No Leads) package, that provides calibrated, linearized signals in digital, I2C format with the accuracy of ±2% RH and ±0.3 °C with minimal power consumption. A drawing of the chamber is provided in Figure 1. The total volume of the chamber equals 48.4 mm × 30 mm × 20.4 mm (29.6 mL).

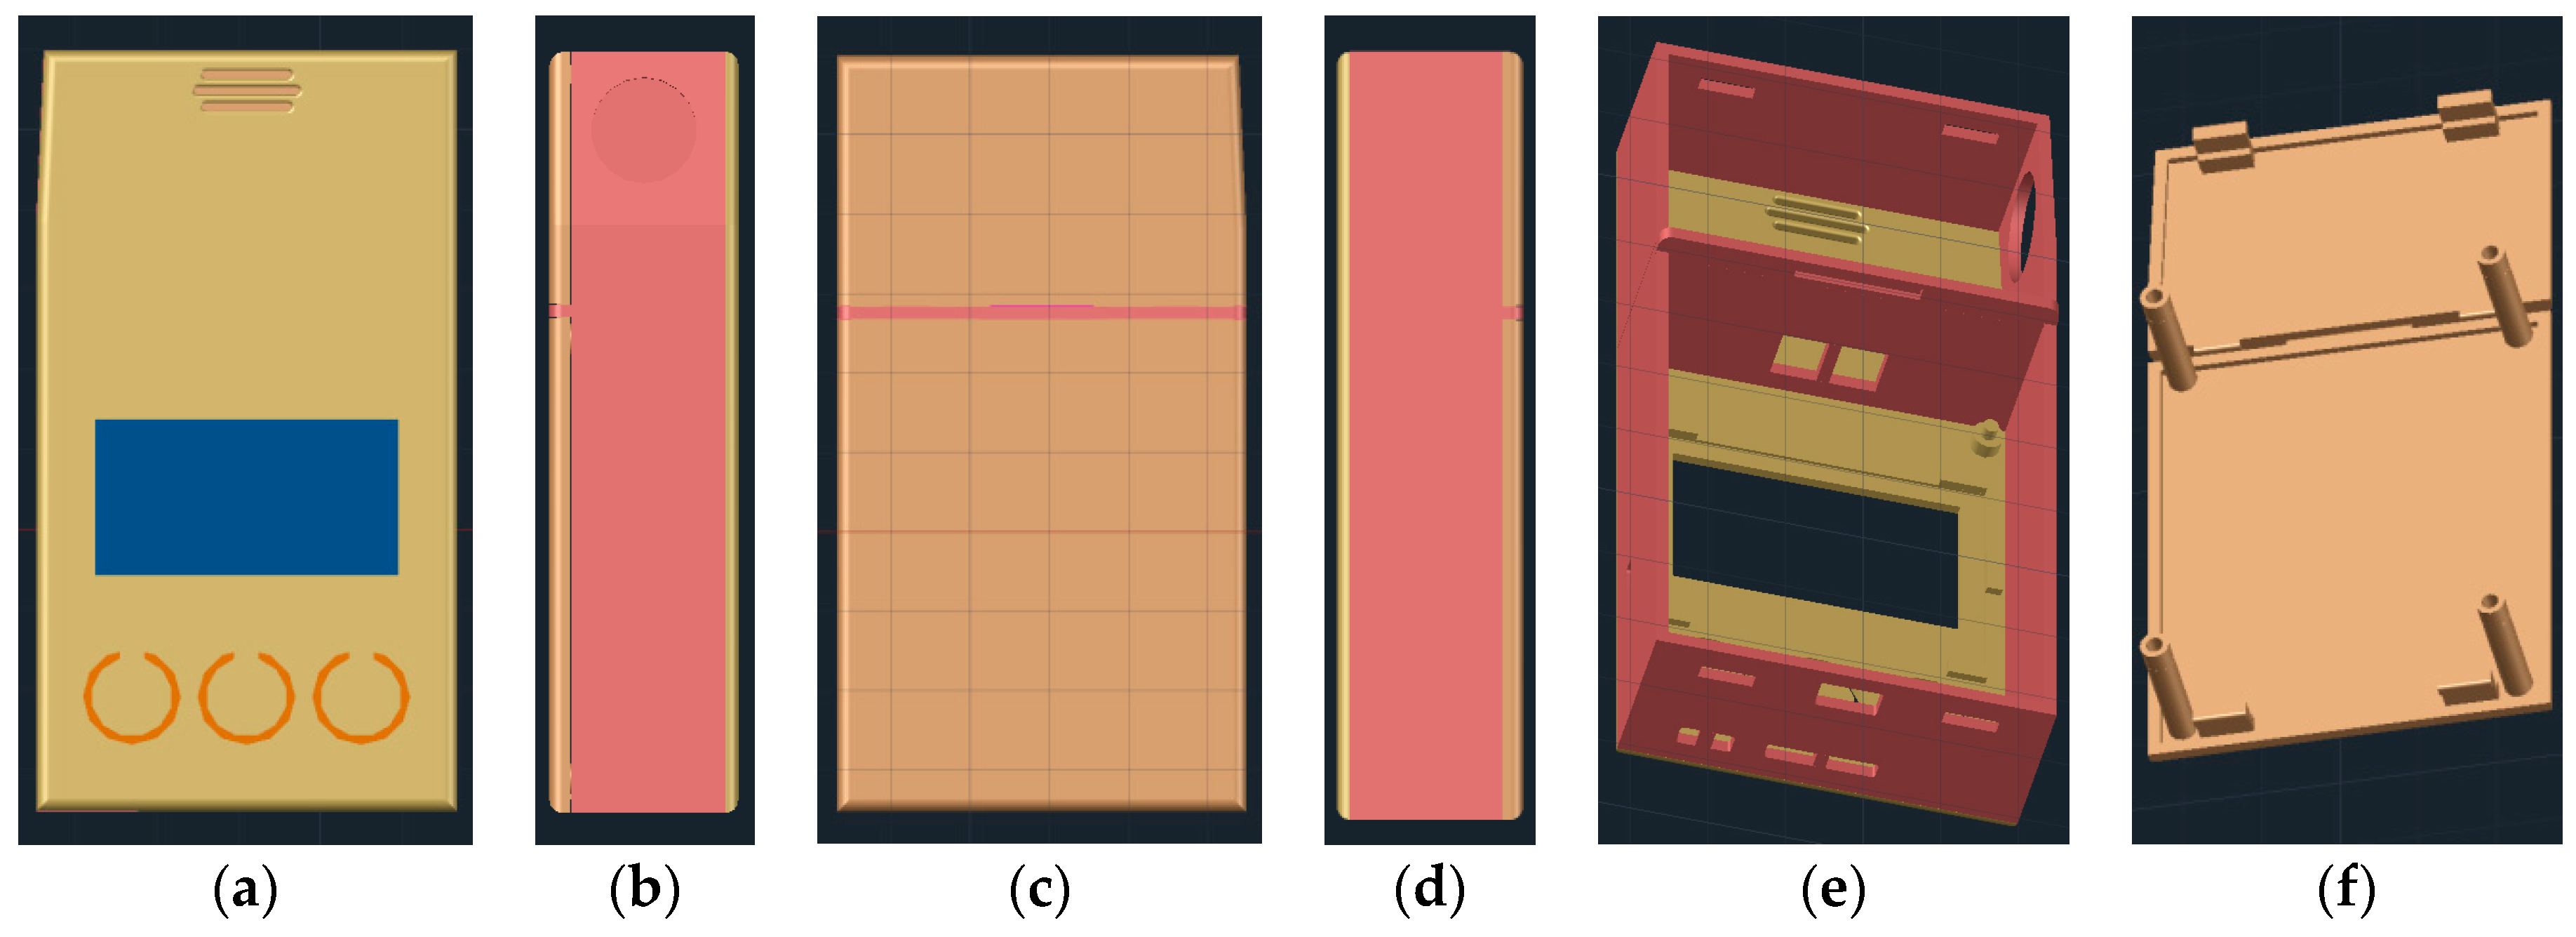
2.3. 3D Printable Housing Design

The housing of the device was designed in a way to accommodate the gas chamber described in Section 2.2 as well as the motherboard PCB described in Section 2.4. As the developed analyzer is a portable device, its size and ergonomics are of great importance. Therefore, a 3D printing technology was employed offering a high degree of design freedom. The design was an iterative process. The first iteration was evaluated in terms of ergonomics of use, in other words, the legibility of the display, the positioning of the buttons with regard to the possibility of one-hand operation, and the grip in the hand. When the design met the above requirements, the second iteration was carried out to position I/O ports (including openings in the housing), ensuring the convenience of use and avoiding interference when the analyzer is held. The final design is shown in Figure 2. The housing is comprised of two parts: front and back pieces. The front piece has the user interface panel and the back piece has two separated compartments: the gas chamber and the electronics compartment. To close the housing, a set of latches on the back panels snap into indents in the front piece allowing for easy and tool-free access. In the electronics compartment, a shallow indentation the size of the display was added for ease of alignment and mounting along with properly spaced mounting posts for the motherboard PCB. The housing size was designed so that there is sufficient space for the electronics and sensors while providing a compact body of the device. The overall external dimensions of the device are 95.2 mm × 23.7 mm × 51.6 mm.

2.4. Hardware Design

The designed device provides three main functionalities: signals measurement; data analysis; and communication and interaction with the user and data presentation. Control electronics were designed accordingly to provide appropriate hardware resources. As discussed earlier, the device’s housing needed to be divided into two compartments: one is the gas chamber and the other accommodates the control electronics. Therefore, two separate PCBs were designed, the layout of both are shown in Figure 3. The sensor array PCB located in the gas chamber hosts all the sensors for which heater supply, circuit supply, and signal outputs are routed via a pin header connector to the motherboard PCB located in the second compartment, which contains the control electronics of the analyzer. The header pinout is described in Table 1.
The main module on the motherboard PCB is the Adafruit Feather M0 Bluefruit LE development board as it is an excellent compromise between computing power, number, type of peripherals, size, and price. The board is powerful enough to handle the stand-alone operation of the analyzer, including the future implementation of a neural network (raw measurement, pre-processing, feature extraction, pattern recognition, classification, and decision making). Importantly, due to compatibility with Arduino Zero, the firmware can be written in C++ using the Arduino Development Environment which includes a wide range of libraries. The heart of the Feather M0 board is a 32-bit ATSAMD21G18 microcontroller with an ARM Cortex M0 core, clocked at 48 MHz, supporting logic in the 3.3 V standard. The chip has 256K FLASH memory and 32K RAM. It is equipped with built-in USB support giving it the ability to program and debug USB-to-serial without the need for an additional chip. The board is equipped with a dedicated connector for 3.7 V lithium-polymer batteries and a built-in battery charging system via a micro USB connector and available battery voltage monitoring functionality. In addition, it is possible to power it directly through the micro USB connector. The board has an automatic selector of the power source depending on whether it is powered by a battery or via the USB connector. In addition, the board is equipped with a Bluetooth Low Energy communication module. The user interface hardware is comprised of a 1.5‘ monochrome OLED display (SSD1305 driver) with a resolution of 128 × 64 pixels, a buzzer, and three tack-switches: up, OK, and down. Alternatively, a command-line interface is available. Analog signals from the sensor array are measured as a voltage drop across a 0.1% tolerant load resistor RLx located on the motherboard using a 12-bit microcontroller built-in ADC (VCC = VADCref = +3.3 VDC). To ensure a stable heater supply VH to sensors, a high-efficiency step-up DC-DC converter was used providing +5 VDC and up to 250 mADC from either the Li-Po battery or the USB line. It is also possible to disable the converter and thus implement the sleep mode. In addition, there is a μSD card slot on the board that allows local acquisition of measurement data, a USB interface for data acquisition from the PC level, and a BLE (Bluetooth Low Energy) modem for wireless acquisition.
Each of the components was chosen to take into account its power consumption as the analyzer is to be battery powered. Total power drawn by the device was estimated to be ~400 mA at 3.3 VDC where the majority of the power is consumed by the sensors‘ heaters (~380 mA). Therefore, a mid-size Li-po battery having 1500 mAh capacity would allow more than 3.5 h of operation. However, the array can be pre-heated overnight using a wall adapter and then using appropriate sensor-stabilization cycles, a full day of operation is possible.

2.5. Prototype Manufacturing and Assembly

Designed printed circuit boards were made by an external company offering production services of prototype series. The housing was printed in the in-house workshop using a Prusa Research Prusa i3 MK3 3D printer out of PET-G filament (Polyethylene terephthalate glycol-modifies). The printer uses a FFF (fused filament fabrication) process which in combination with the used filament leads to low-cost prototyping while providing satisfactory print resolution and mechanical strength. Finally, the components were assembled and the prototype of the device was tested for correctness. Photographs of the manufactured analyzer are shown in Figure 4.

3. Results and Discussion

In this section, calibration and measurements using the developed portable gas analyzer for exhaled acetone detection are presented and discussed. The calibration procedure is shown allowing for the determination of the reference (normalization) resistance R0x for each of the sensors in the array. Moreover, the influence of temperature and humidity of the gas sample on the response of the sensor is considered and appropriate corrections are proposed. Finally, the procedure to determine gas concentration based on the measured and corrected sensor’s response is presented.

3.1. Sensors Reference Resistance Calibration

Before proceeding with actual measurements, it is necessary to calibrate the sensors, in other words, determine the value of the reference resistance R0x. The procedure is described for an example of the main sensor, but it also applies for the other sensors used. The main sensor datasheet provides its typical sensitivity characteristics, in other words, the change of its resistance RS for different gas types in the measurable range of concentrations. The characteristic, however, is normalized to a reference resistance R0 being the sensor resistance in 300 ppm ethanol at 20 °C and 65% RH Knowing this value, it is possible to calculate the dependence between sensor resistance and the gas concentration for all other gas concentrations. Further, in the datasheet, it is stated that R0 is in the range of 1–10 kΩ, which is a relatively wide range, therefore, it is impossible to take a specific value from this range as R0. On the other hand, calibration using a reference gas sample having a proper concentration in a specific temperature and humidity would require a laboratory and reference measuring device. Such a calibration method is hardly possible to implement and very expensive for a portable analyzer. Therefore, it was important to find an alternative calibration technique.
The proposed approach relies on the fact that the sensor’s resistance ratio R0/RS is constant over the measurable concentration range when exposed to air. Reference resistance can be calculated as:
R 0 = R S a i r c r 0
where cr0 is a constant coefficient estimated based on the data provided in the datasheet while RSair is the sensor resistance in air corrected for temperature and humidity (see Section 3.2). The remaining sensors in the array can be calibrated in the same way. Such calibration is easy to implement and convenient from the user’s perspective. The disadvantage is higher measurement error when related to one using a dedicated calibration gas sample, however, it is sufficient for non-clinical applications. The measurement error associated with the described technique has three main sources: estimation of the cr0 coefficient based on graphical data and the sensor’s manufacturing tolerance; cleanness of the air when measured: and temperature and humidity of the calibration gas. The first source can hardly be minimized and is considered as a systematic error. The impact of the former two can be minimized when sensors are placed in an enclosed environment and pre-heated using embedded heaters before measurements to allow the sensor to stabilize its response and to stabilize temperature and humidity in the gas chamber. In addition, any possible impurities or debris on the sensing element surface can be burned-out or evaporated at each sensor.

3.2. Correction for Temperature and Humidity

Having calibrated the system, the actual measurements can be carried out. However, since the response of the sensor is not only a function of a detectable gas concentration but also temperature and humidity, it is necessary to correct the measured resistance RS for the last two parameters. This dependence exists regardless of the gas being measured and its concentration. Unfortunately, the required data is presented in datasheets only in a graphical form, which hinders analysis and is a source of systematic error. To allow for calculating the correction, a linear polynomial regression of two variables was used to model the temperature–humidity dependence out of the collected data points. A linear function describes accurately enough the relation while being very computationally inexpensive. The general formula is:
c o r r ( t , h ) = c 00 + c 10 h + c 01 t
where t and h are the measured temperatures in °C and humidity in % at the time the sensor’s resistance is measured while cxx are constant coefficients estimated for a given sensor.

3.3. Gas Concentration Calculation

Having measured the raw sensor array response on the gas sample and corrected it for humidity and temperature, the gas concentration can be established. In order to determine the analytical relationship between the resistance ratio RS/R0 and the concentration of a given gas in the tested air volume, the sensitivity characteristics presented by the manufacturer in the datasheet expressed in log-log scale was analyzed. Therefore, the following variable is is introduced to simplify calculations:
r = l o g 10 ( R S R 0 · corr ( t , h ) )
Unfortunately, the required data is presented only in a graphical form, which hinders analysis and is a source of systematic error. Moreover, those relations are provided under the assumption that the sensor is exposed only to one particular gas. Square polynomial regression was used to derive the relation out of the collected data points. A quadratic function describes accurately enough the relation while being fairly computationally inexpensive. The general formula is:
g a s ( r ) = p 0 + p 1 r + p 2   r 2 [ p p m ]
where px are constant coefficients estimated based on the data provided in the datasheet. The polynomial relation coefficients are established based on data for a give a measurable range of gas concentrations, therefore, outside that range, it may not hold. However, since it is a continuous function and the relation appears to be monotonic, Equation (5) can be used to estimate the concentration outside the above-specified range.

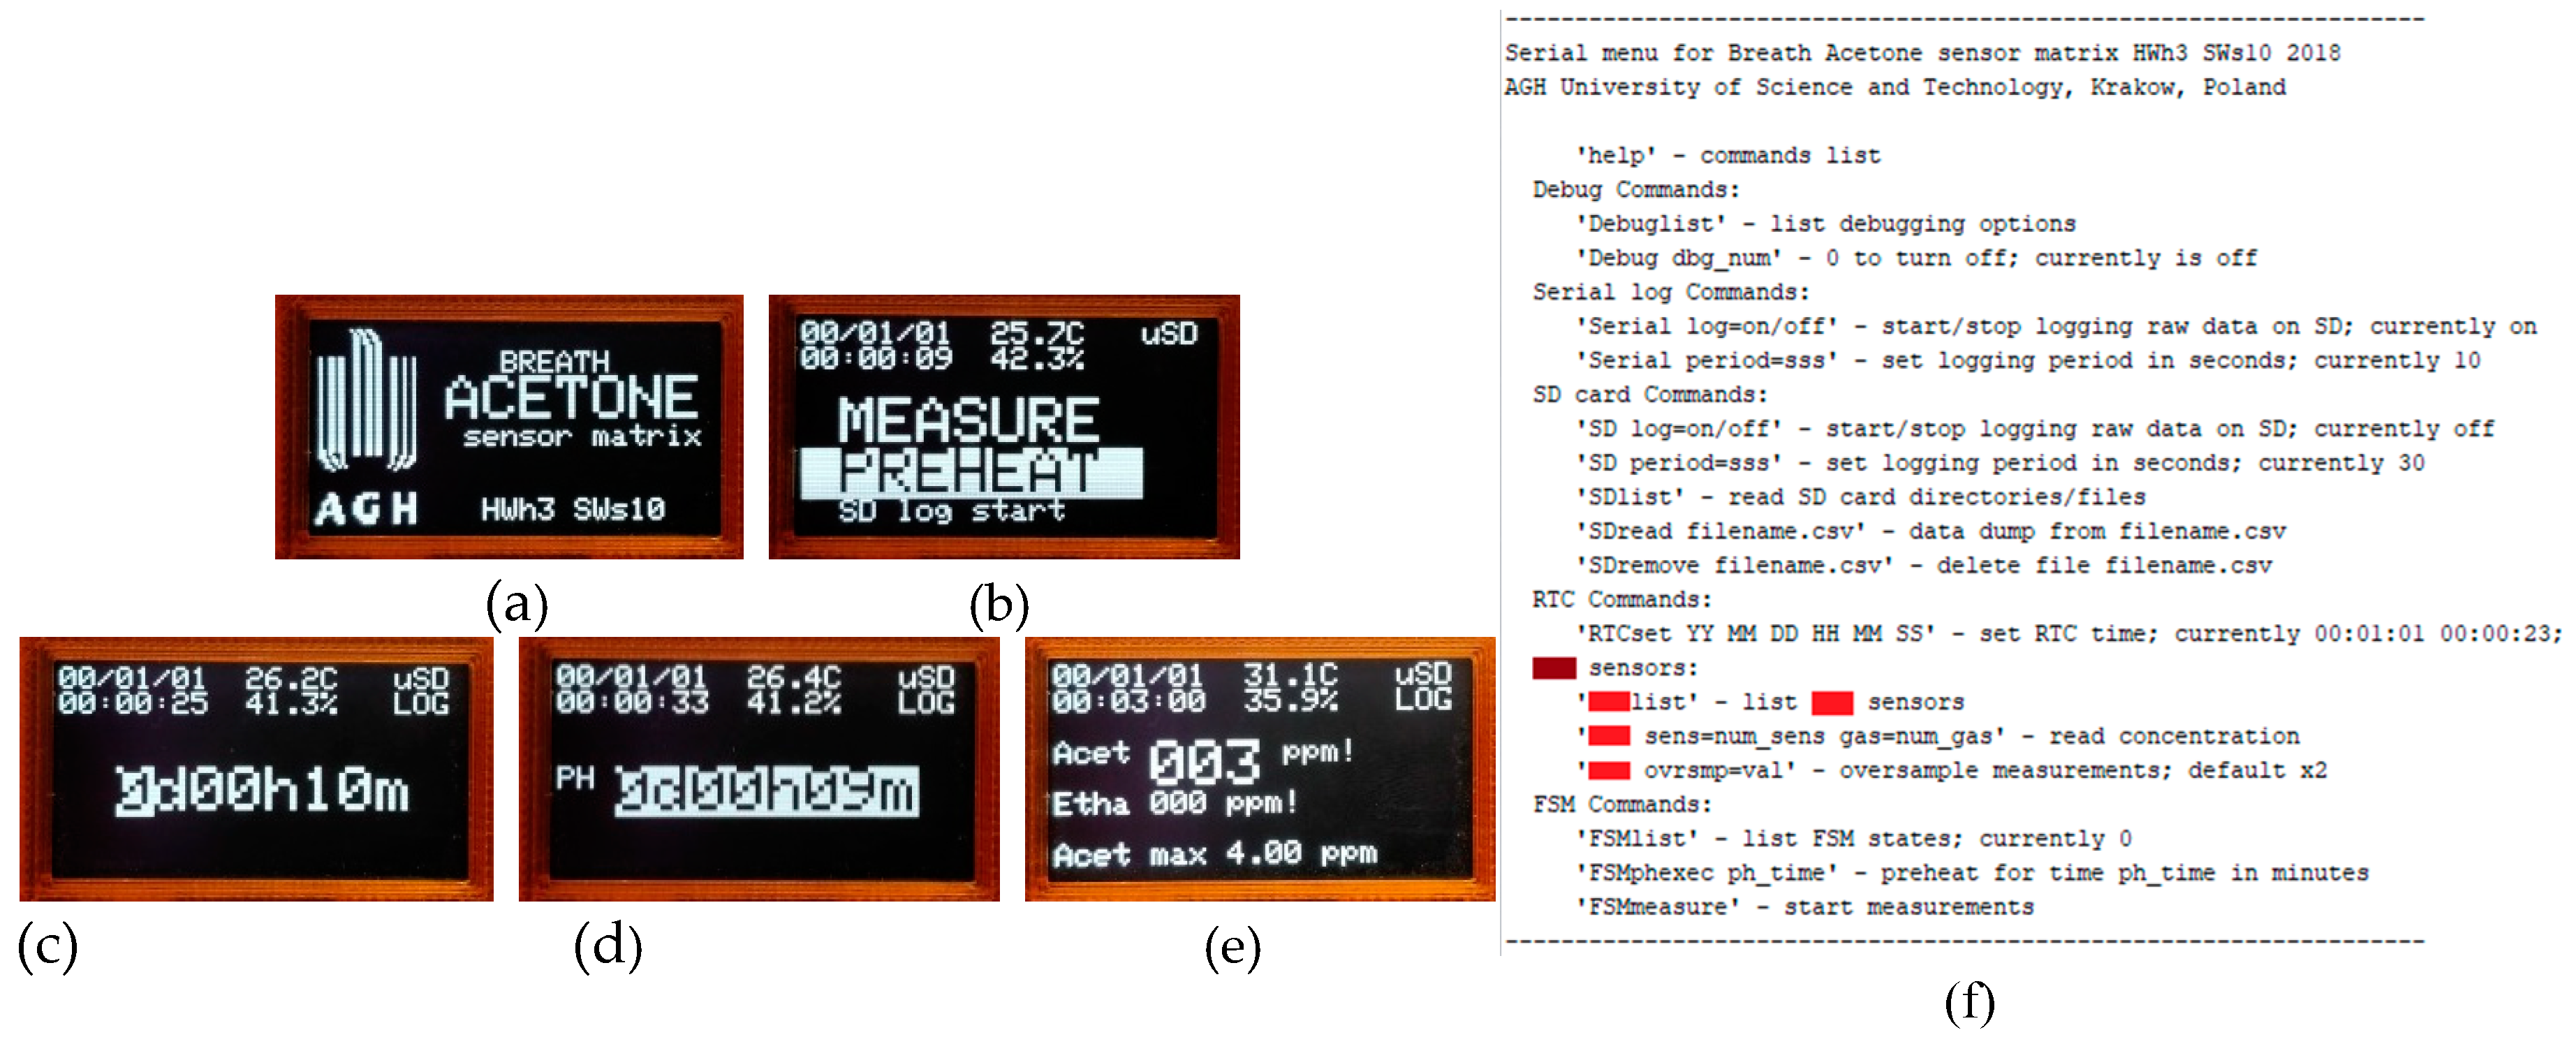
3.4. Portable Analyzer Operation and Measurements

The developed portable analyzer allows for breath acetone detection. The information from the main sensor is calculated to the acetone concentration while the information from the accompanying sensors is taken to check the validity of the measurement, in other words, to determine if other gases are deviating the response or not. The use of the device is intuitive and easy. The user menu and available functionalities presented on the screen (see Figure 5) are directly related to the state in which the device currently is as the firmware was written using a finite-state machine. When the device boots, the welcome screen appears briefly showing the information on the hardware and firmware version that is currently used/loaded into the device. The device then automatically changes to the main screen. The user can select either to go directly to measurements or to preheat the sensor array. At the moment of entering the measurement state, the device self-calibrates the array (measures each sensor‘ resistance in air and calculates the reference resistance). If preheating is selected, the user can define the preheating time or the device can preheat for as long as the sensor array response determines, the end of which in each case is signaled by the buzzer. When in the measure state, the array is sampled continuously to monitor its stability. To perform measurement of the exhaled breath, the user needs to blow constantly through the mouthpiece for a given time, the end of which is signaled by the buzzer. Then the readouts are processed and the acetone concentration is displayed along with the information if the concentration is within or outside sensor’s range as well as if it is valid and the maximum concentration measured. Before proceeding to the next measurement, the gas chamber needs to be properly ventilated and the sensor array needs to return to its default state. When the analyzer is ready, appropriate information is displayed and the device can be used again.

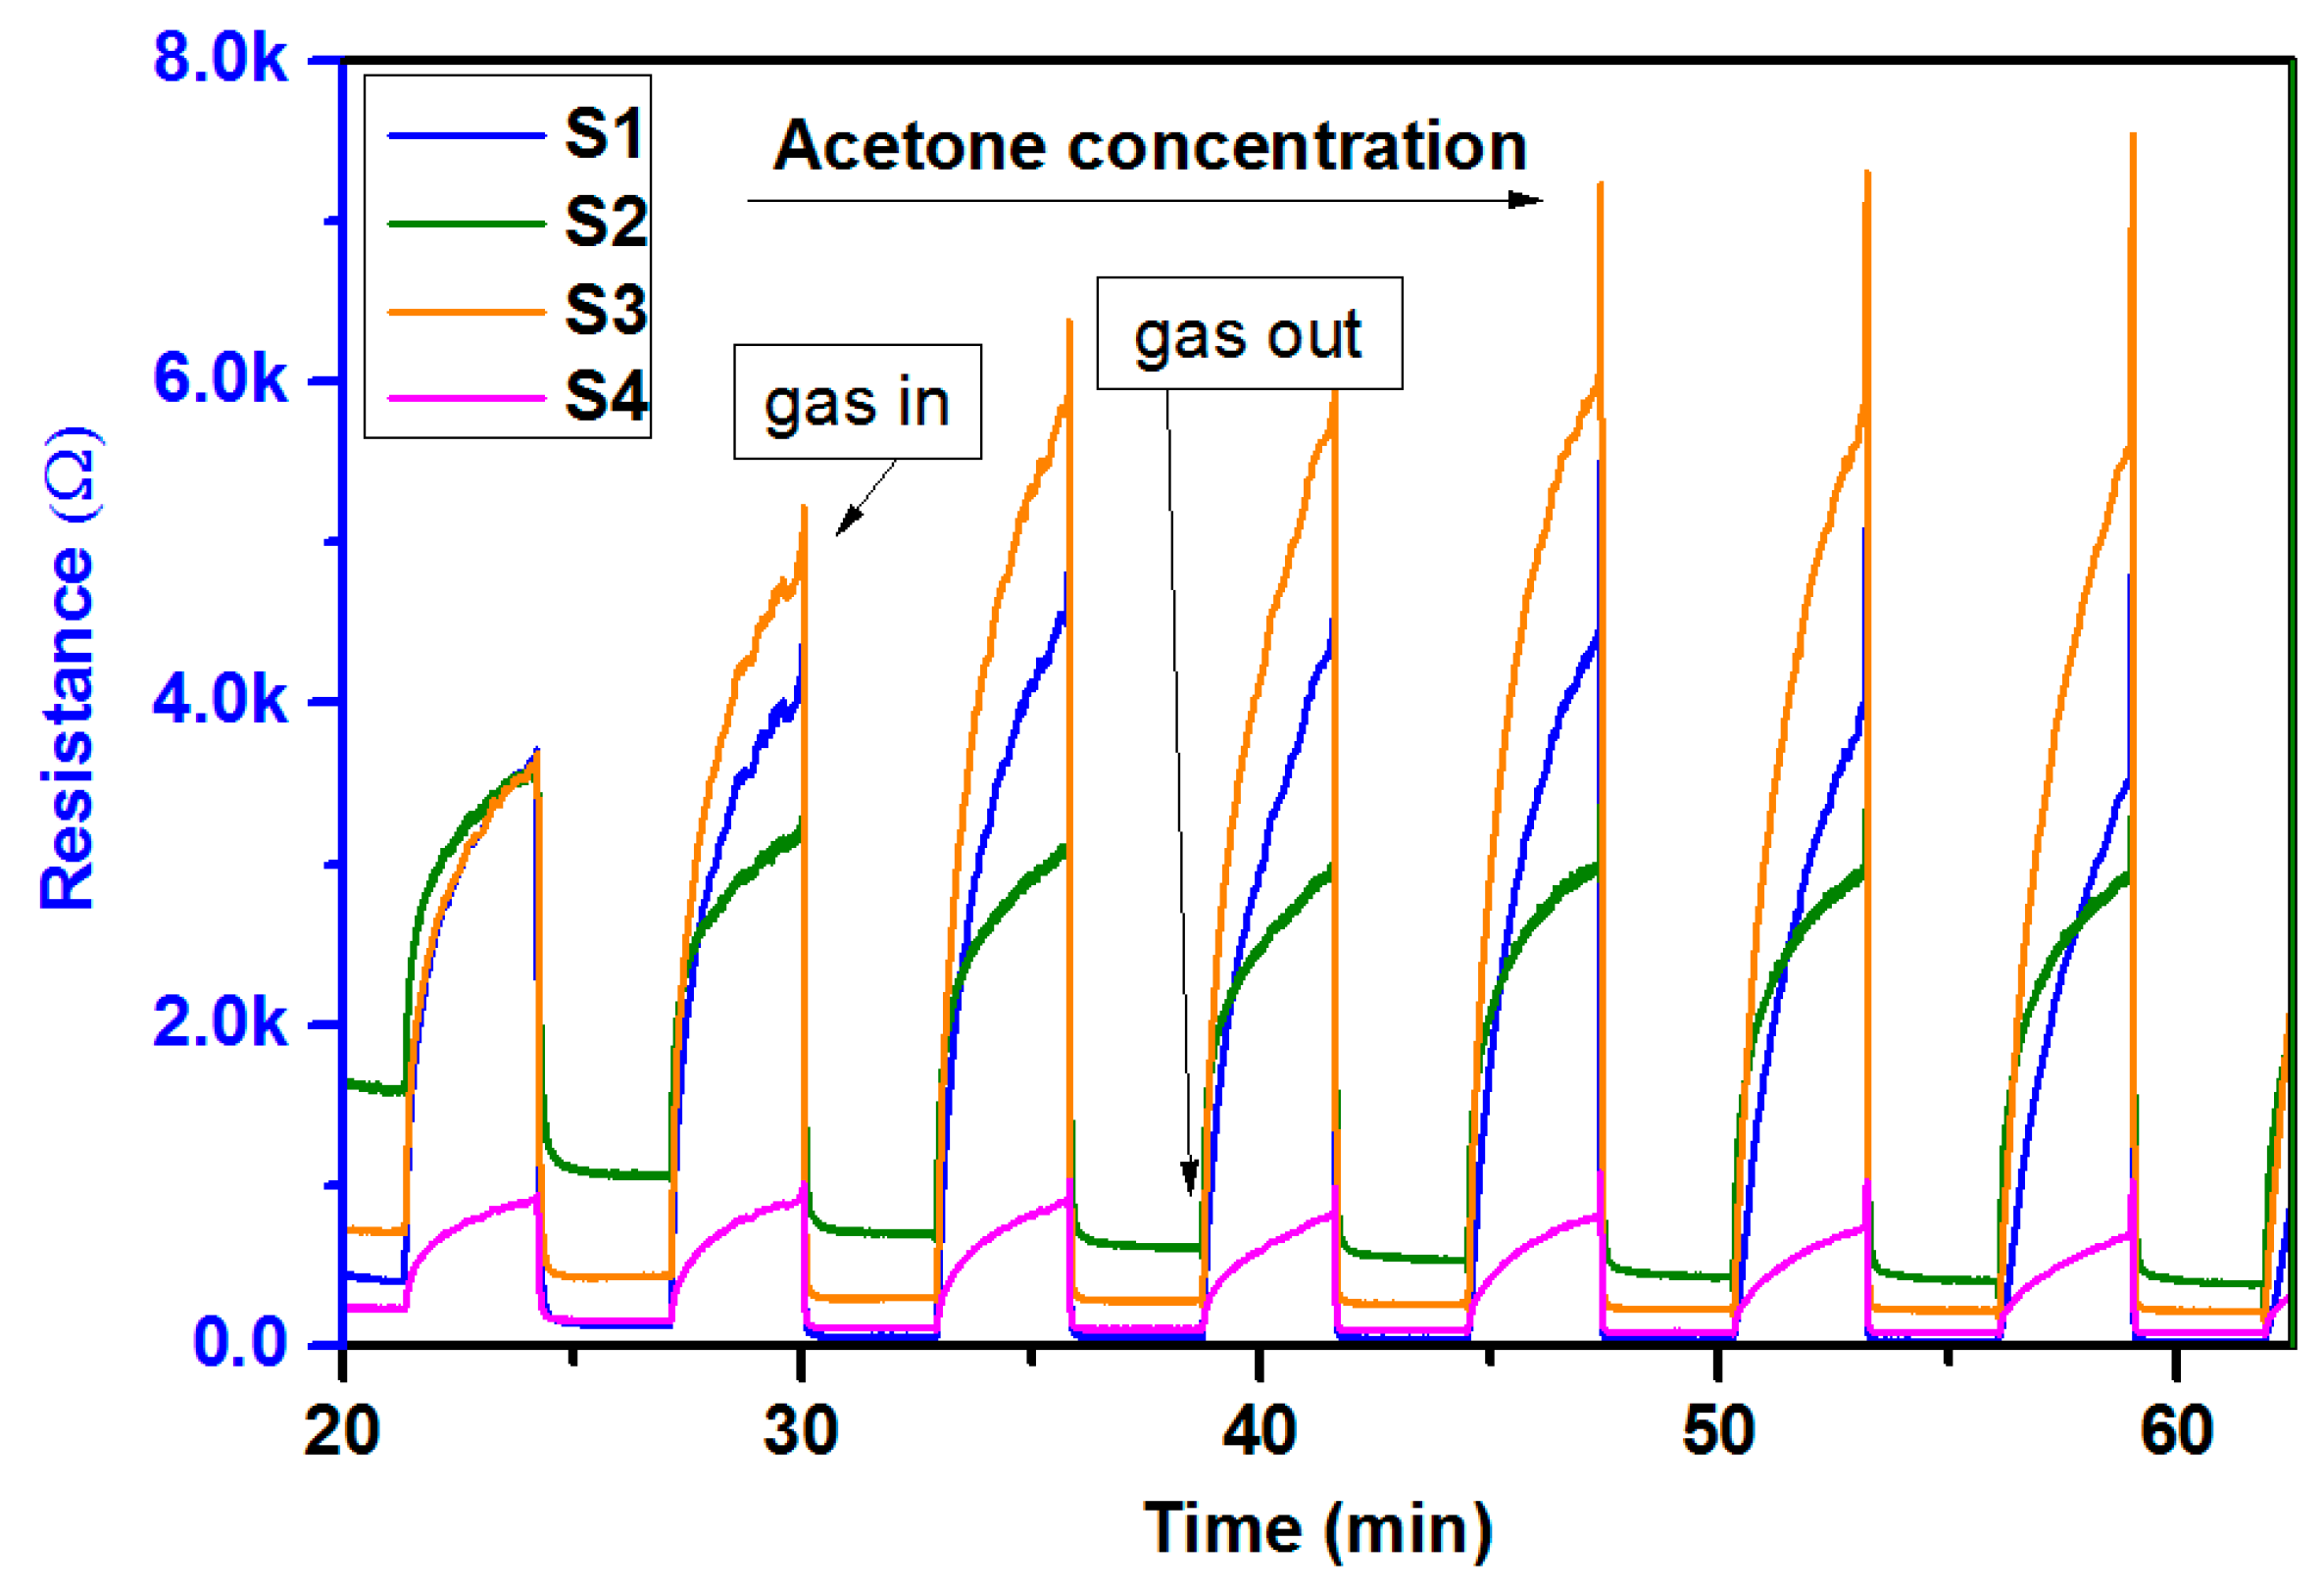
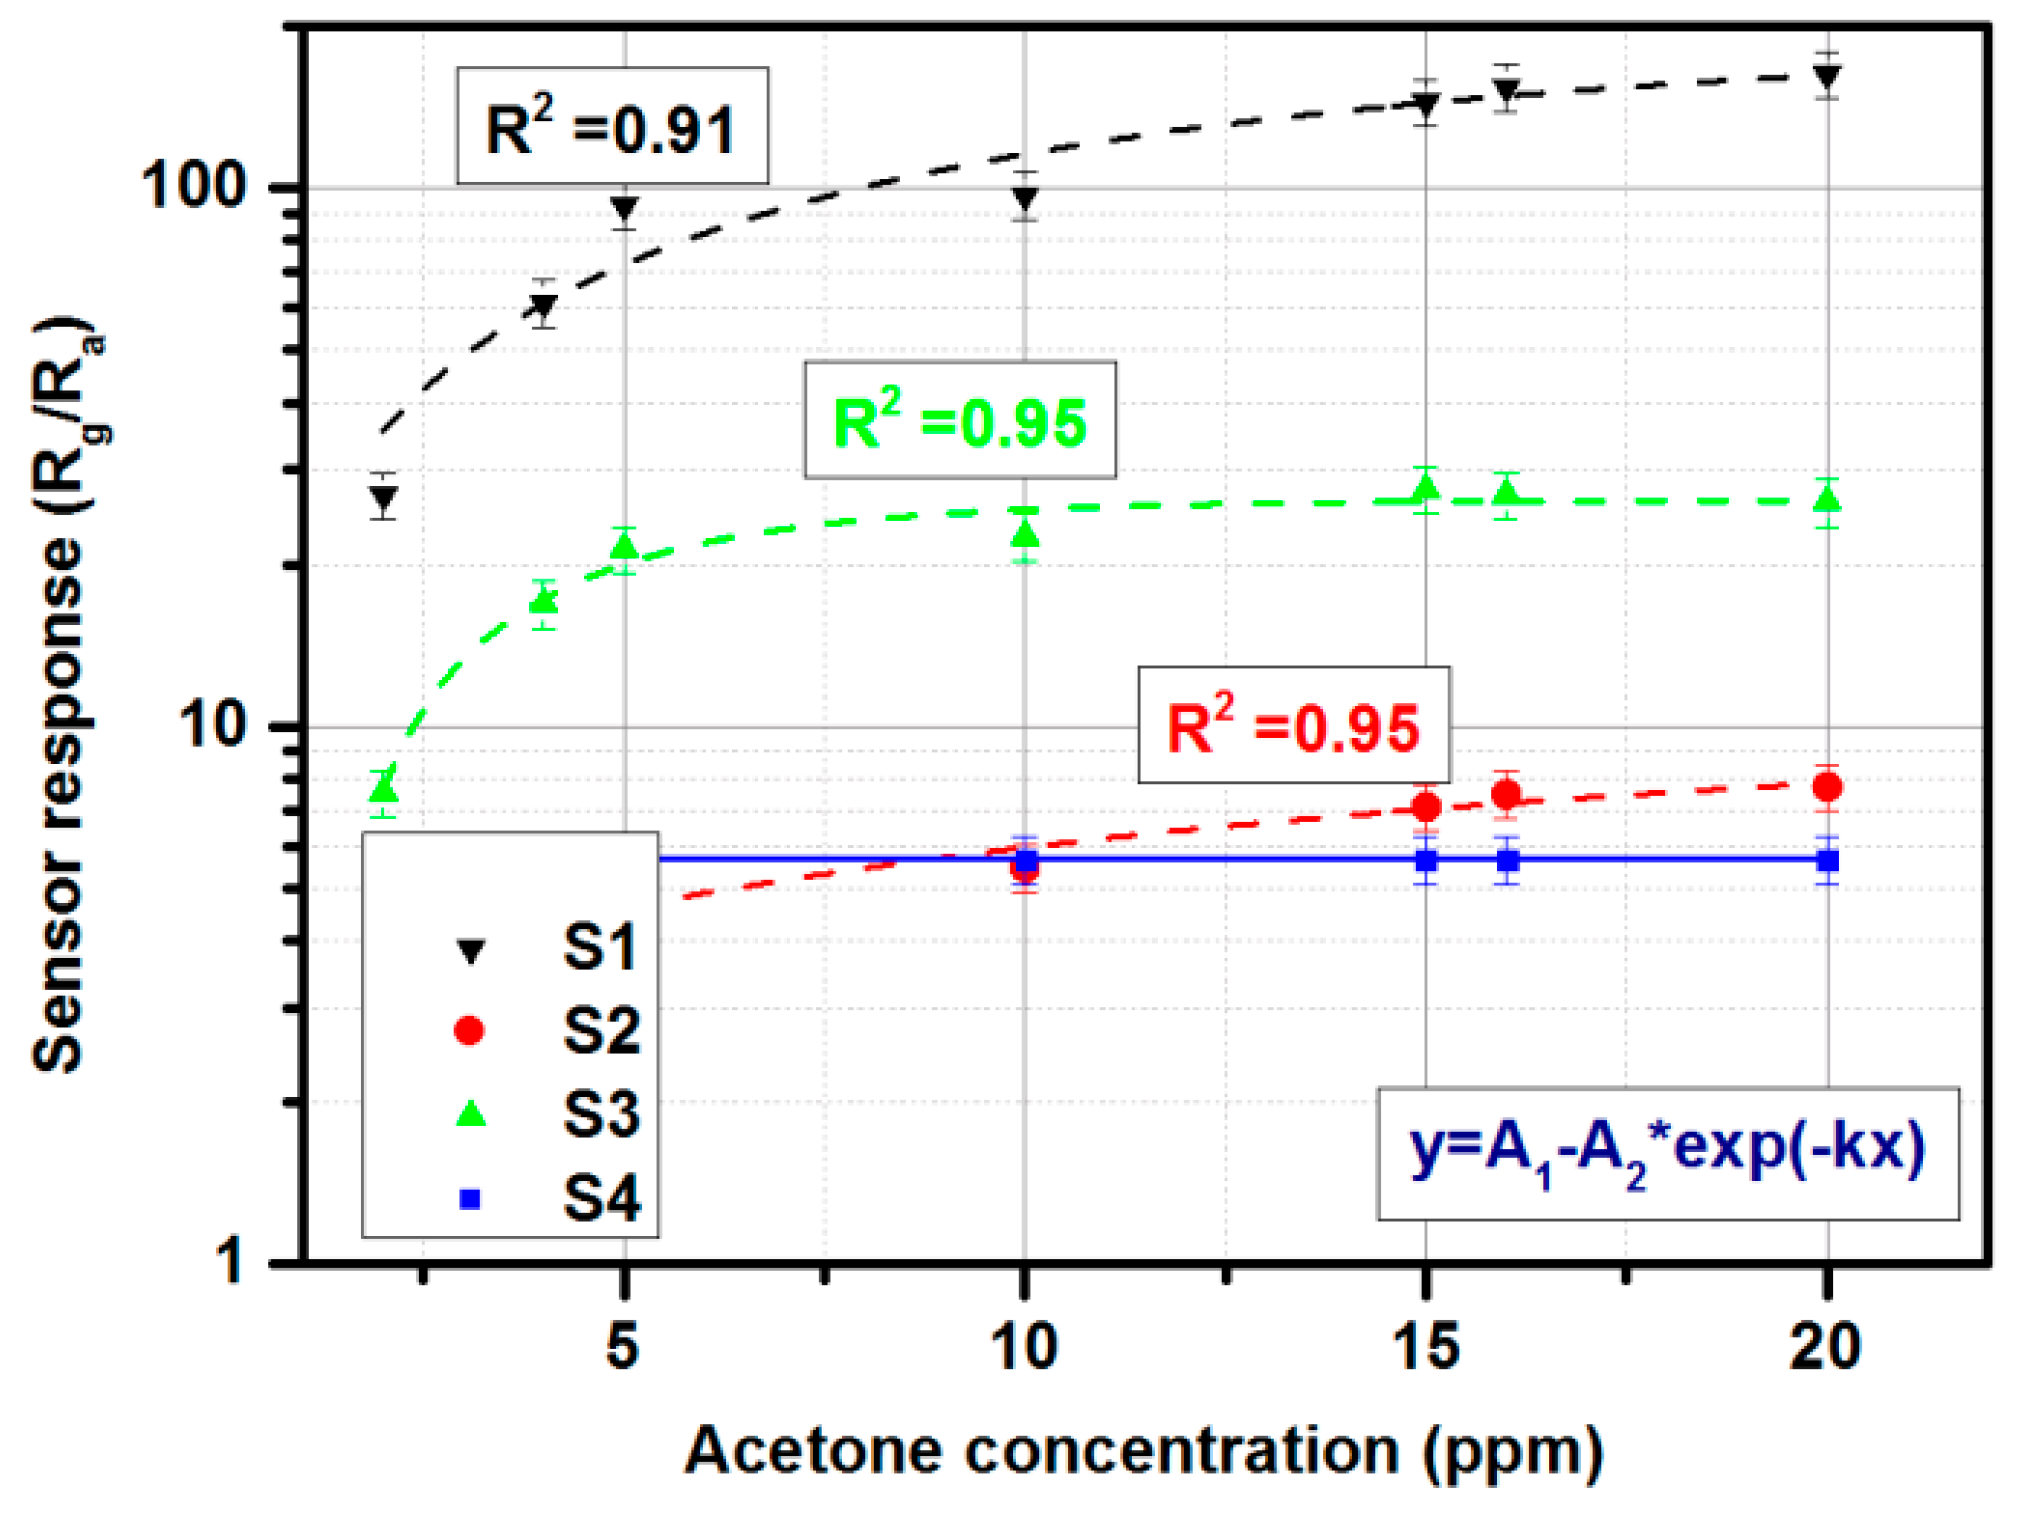
3.5. Gas-Sensing Setup Characterization

The developed sensing setup composed of a set of four different sensors located in the gas chamber of the device was characterized by conducting a series of measurements under exposure to diabetes biomarkers such as acetone and ethanol. Figure 6 shows the gas-sensing characteristics under exposure to various acetone concentration (20–200 ppm) of each of the gas sensor S1–S4 within the array. For a better perspective, all curves are shown on the same scale. As can be observed, the sensors exhibit a response to acetone, however, with a largely differentiated sensitivity as expected. Moreover, the relatively short recovery time is to be dealt with in the devices firmware. The sharp lines are the artifacts related to measurement conditions that switched the effect of the gas-dosing system.
Despite the S1 sensor being the one dedicated for acetone sensing due to its high sensitivity, there were others acting in a similar fashion. Figure 7 shows the gas-sensing responses of sensor S3, which was non-dedicated to acetone detection, however, as can be observed under exposure to acetone, it reacted with resistance changes. This cross-sensitivity effect is a disadvantage of metal-oxide based sensors and has to be taken into account within the firmware.
Finally, Figure 8 shows the calibration curves of all four sensors in the gas sensor array in the 2–20 ppm range of acetone. The sensors S1–S3 reacted with acetone in the measurement range and their response can be fitted using an exponential function with high R2 values of 0.91, 0.95, and 0.95, respectively. On the other hand, Sensor S4 exhibited a constant response (~5.5), which was related to the humidity level. Sensors S1 and S2 are dedicated to acetone measurement while S3 and S4 are not. Despite that, sensor S3 exhibits a cross-sensitivity issue.
It is important to note, however, that for the purpose of measurements the developed sensing array is to be considered as a whole, in other words, its multi-dimensional response characteristics can be characterized and calibrated into the firmware. Further processing blocks such as a neural network are to be trained beforehand and fed in with the measurement data. The key point is to select sensors in such a way that they exhibit variable (including high) sensitivity on the diabetes markers as well as on other breath constituents. Such a combination along with proper signal processing enables measurements of low acetone concentrations with a high level of confidence.

4. Conclusions and Further Perspectives

We developed a portable gas analyzer prototype for exhaled acetone detection employing an application-suited gas sensor array. The device was shown to be capable of serving as a tool for non-invasive diabetes monitoring with the additional advantage of having a hand-held form factor and battery powered operation. The prototype is currently patent pending in the European Patent Office and is specified within a non-disclosure agreement between the designers and investors, therefore, the presented description gives only a general overview of the system. However, all components have been widely discused, including the gas sensor array, gas chamber design, 3D printable housing design, hardware and software design, and correction for temperature and humidity. Finally, the calibration and measurement technique as well as the analyzer operation was shown, validating the proposed type of exhaled acetone-detection meters. After the certification process, the prototype will be validated in clinical tests in the University Hospital in Krakow, Poland.

Author Contributions

A.R. conceptualization; J.S. and A.R. methodology; J.S. software; A.R. validation; A.R. and J.S. investigations; J.S. and A.R. writing—original draft preparation and writing—review and editing; A.R. supervision; A.R. project administration.

Funding

The work was financially supported by the National Centre for Research and Development under LIDER/252/L-6/NCBR/2015.

Conflicts of Interest

The authors declare no conflict of interest.

References

  1. De Lacy Costello, B.; Amann, A.; Al-Kateb, H.; Flynn, C.; Filipiak, W.; Khalid, T.; Osborne, D.; Ratcliffe, N.M. A review of the volatiles from the healthy human body. J. Breath Res. 2014, 8, 014001. [Google Scholar] [CrossRef] [PubMed]
  2. Phillips, M.; Byrnes, R.; Cataneo, R.N.; Chaturvedi, A.; Kaplan, P.D.; Libardoni, M.; Mehta, V.; Mundada, M.; Patel1, U.; Ramakrishna, N.; et al. Detection of volatile biomarkers of therapeutic radiation in breath. J. Breath Res. 2013, 7. [Google Scholar] [CrossRef] [PubMed]
  3. Al-Kateb, H.; de Lacy Costello, B.; Ratcliffe, N. An investigation of volatile organic compounds from the saliva of healthy individuals using headspace-trap/GC-MS. J. Breath Res. 2013, 7, 036004. [Google Scholar] [CrossRef] [PubMed] [Green Version]
  4. Deng, C.; Zhang, J.; Yu, X.; Zhang, W.; Zhang, X. Determination of acetone in human breath by gas chromatography-mass spectrometry and solid-phase microextraction with on-fiber derivatization. J. Chromatogr. B 2004, 810, 269–275. [Google Scholar] [CrossRef]
  5. Lubes, G.; Goodarzi, M. GC-MS based metabolomics used for the identification of cancer volatile organic compounds as biomarkers. J. Phar. Biomed. Anal. 2018, 147, 313–322. [Google Scholar] [CrossRef] [PubMed]
  6. Fedrigo, M.; Hoeschen, Ch.; Oeh, U. Multidimensional statistical analysis of PTR-MS breath samples: A test study on irradiation detection. Int. J. Mass Spectrom. 2010, 295, 13–20. [Google Scholar] [CrossRef]
  7. Righettoni, M.; Schmid, A.; Amann, A.; Pratsinis, S.E. Correlations between blood glucose and breath components from portable gas sensors and PTR-TOF-MS. Breath Res. 2013, 7, 037110. [Google Scholar] [CrossRef] [PubMed]
  8. Lapthorn, C.; Pullen, F.; Chowdhry, B.Z. Ion mobility spectrometry-mass spectrometry (IMS-MS) of small molecules: Separating and assigning structures to ions. Mass Spectrom. Rev. 2013, 32, 43–71. [Google Scholar] [CrossRef] [PubMed]
  9. Szymanska, E.; Tinnevelt, G.H.; Brodrick, E.; Williams, M.; Davies, A.N.; van Manen, H.-J.; Buydens, L.M.C. The increasing conclusiveness of clinical breath analysis by improved baseline correction of the multi-capillary column—Ion mobility spectrometry (MCC-IMS) data. J. Pharm. Biomed. Anal. 2016, 127, 170175. [Google Scholar] [CrossRef] [PubMed]
  10. Michalcikova, R.B.; Dryahina, K.; Spanel, P. SIFT-MS quantification of several breath biomarkers of inflammatory bowel disease, IBD.; A detailed study of the ion chemistry. Int. J. Mass Spect. 2016, 396, 35–41. [Google Scholar] [CrossRef]
  11. Smith, D.; Spanel, P. Direct, rapid quantitative analyses of BVOCs using SIFT-MS and PTR-MS obviating sample collection. TrAC 2011, 30, 945–959. [Google Scholar] [CrossRef]
  12. Schmidt, K.; Podmore, I. Current challenges in volatile organic compounds analysis as potential biomarkers of cancer. J. Biomark. 2015, 2015, 981458. [Google Scholar] [CrossRef] [PubMed]
  13. Smolinska, A.; Klaassen, E.M.M.; Dallinga, J.W.; van de Kant, K.D.G.; Jobis, Q.; Moonen, E.J.C.; van Schayck, Q.P.; Dompeling, E.; van Schooten, F.J. Profiling of volatile organic compounds in exhaled breath as a strategy to find early predictive signatures of asthma in children. PLoS ONE 2014, 9, e95668. [Google Scholar] [CrossRef] [PubMed]
  14. Saalberg, Y.; Wolff, M. VOC breath biomarkers in lung cancer. Clin. Chim. Acta 2016, 459, 5–9. [Google Scholar] [CrossRef] [PubMed]
  15. Chang, J.-E.; Lee, D.-S.; Ban, S.-W.; Oh, J.; Jung, M.Y.; Kim, S.-H.; Park, S.J.; Persaud, K.; Jheon, S. Analysis of volatile organic compounds in exhaled human breath for lung cancer diagnosis using a sensor system. Sens. Actuators B 2018, 255, 800–807. [Google Scholar] [CrossRef]
  16. Bos, L.D.; Sterk, P.J.; Fowler, S.J. Breathomics in the setting of asthma and chronic obstructive pulmonary disease. J. Allergy Clin. Immunol. 2016, 138, 970–976. [Google Scholar] [CrossRef] [PubMed] [Green Version]
  17. Hanania, N.A.; Pharm, M.M.; Jain, N. Measurement of fractional exhaled nitric oxide in real-world clinical practice alters asthma treatment decisions. Ann. Allergy Asthma Immunol. 2018, 120, 414–418. [Google Scholar] [CrossRef] [PubMed]
  18. Anders, C.; Rømhild, D.J.; Ingrid, T.; Jørgen, V.; Jan, B. A systematic review of breath analysis and detection of volatile organic compounds in COPD. J. Breath Res. 2016, 10, 034002. [Google Scholar]
  19. Bregy, L.; Nussbaumer-Ochsner, Y.; Sinues, P.M.-L.; Garcia-Gomez, D.; Suter, Y.; Gaisl, T.; Stebler, N.; Gaugg, M.T.; Kohler, M.; Zenobi, R. Real-time mass spectrometric identification of metabolites characteristic of chronic obstructive pulmonary disease in exhaled breath. Clinic. Mass Spectr. 2018, 7, 29–35. [Google Scholar] [CrossRef]
  20. Herman-Saffar, O.; Boger, Z.; Libson, S.; Lieberman, D.; Gonen, R.; Zeiri, Y. Early non-invasive detection of breast cancer using exhaled breath and urine analysis. Comput. Biol. Med. 2018, 96, 227–232. [Google Scholar] [CrossRef]
  21. LI, H.; Peng, Y.; Duan, Y. Diagnosis of breast cancer based on breath analysis: An emerging method. Crit. Rev. Oncol. Hemat. 2013, 87, 28–40. [Google Scholar] [CrossRef] [PubMed]
  22. Minh, T.D.Ch.; Blake, D.R.; Galassetti, P.R. The clinical potential of exhaled breath analysis for diabetes mellitus. J. Diab. Res. 2012, 97, 195–205. [Google Scholar] [CrossRef] [Green Version]
  23. Karyakin, A.A.; Nikulina, S.V.; Vokhmyanina, D.V.; Karyakina, E.E.; Anaev, E.K.H.; Chuchalin, A.G. Non-invasive monitoring of diabetes through analysis of the exhaled breath condensate (aerosol). Electrochem. Commun. 2017, 83, 81–84. [Google Scholar] [CrossRef]
  24. Amann, A.; Smith, D. Volatile Biomarkers: Non-Invasive Diagnosis in Physiology and Medicine; Elsevier: Edinburgh, UK, 2013. [Google Scholar]
  25. Piacentini, G.L.; Cattazzo, E.; Tezz, G.; Peroni, D.G. Exhaled nitric oxide in pediatrics: What is new for ptracrive purposes and clinical research in children? J. Breath Res. 2012, 6, 027103. [Google Scholar] [CrossRef] [PubMed]
  26. Warwick, G.; Kotluar, E.; Chow, S.; Thomas, P.S.; Yate, D.H. Exhaled breath condensate in pulmonary arterial hypertension. J. Breath Res. 2012, 6, 036006. [Google Scholar] [CrossRef]
  27. Diabetes—World Health Organization. Available online: http://www.who.int/diabetes/en/ (accessed on 27 October 2018).
  28. Rydosz, A. A negative correlation between blood glucose and acetone measured in healthy and type-1 diabetes mellitus patient breath. J. Diabetes Sci. Technol. 2015, 9, 881–884. [Google Scholar] [CrossRef]
  29. Rydosz, A. Micropreconcentrator in LTCC technology with mass spectrometry for the detection of acetone in healthy and type-1 diabetes mellitus patient breath. Metabolites 2014, 4, 921–931. [Google Scholar] [CrossRef]
  30. Rydosz, A. Sensors for enhanced detection of acetone as a potential tool for noninvasive diabetes monitoring. Sensors 2018, 18, 2298. [Google Scholar] [CrossRef]
  31. Saasa, V.; Malwela, T.; Beukes, M.; Mokgotho, M.; Liu, Ch.-P.; Mwakikunga, B. Sensing technologies for detection of acetone in human breath for diabetes diagnosis and monitoring. Diagnostics 2018, 8, 12. [Google Scholar] [CrossRef]
  32. Todd, C.; Salvetti, P.; Naylor, K.; Albatat, M. Towards non-invasive extraction and determination of blood glucose levels. Bioengineering 2017, 4, 82. [Google Scholar] [CrossRef]
  33. Wang, Ch.; Sahay, P. Breath analysis using laser spectroscopic techniques: Breath biomarkers, spectral fingerprints, and detection limits. Sensors 2009, 9, 8230–8262. [Google Scholar] [CrossRef] [PubMed]
  34. KETONIX® Breath Ketone Analyzer. Available online: https://www.ketonix.com/ (accessed on 29 May 2019).
  35. KetoIQ Keto Breathalyzer. Available online: https://www.amazon.com/dp/B07BKTNWF7/?tag=ketoconcern-20 (accessed on 29 May 2019).
  36. Ketone Breath Analyzer. Available online: https://www.amazon.com/dp/B07CKW8HZQ/?tag=ketoconcern-20 (accessed on 29 May 2019).
Figure 1. Drawing of the designed gas chamber as a dedicated compartment in the device housing (in salmon). View of the mouthpiece (in light gray) and ventilation grate (in beige) (a). The SHT21 is soldered to a raised daughter board (in dark gray) allowing for indirect airflow as well as thermal separation from the gas sensor array (in violet) printed circuit boards (PCB) (b).
Applsci 09 02605 g001
Figure 2. 3D view and projections of the developed housing for the portable gas analyzer designed using CAD software. The housing is comprised of two parts: a front piece with user interface elements (a), mouthpice port (b), USB port and μSD card slots and back panels (c,d) allowing easy assembly (clips and slots) and access inside the device (e,f). Total dimensions are 95.2 mm × 23.7 mm × 51.6 mm.
Applsci 09 02605 g002
Figure 3. The layout of the motherboard and daughterboard PCBs. Dimensions in mm. Sensing array’s layout visibility is limited due to the patent pending.
Applsci 09 02605 g003
Figure 4. A photograph of the manufactured analyzer. Front panel (a), bottom view with connectors (b), side panel with a disposable mouthpiece (c), the gas chamber (d) and the electronics compartment (e).
Applsci 09 02605 g004
Figure 5. User interface screens of the developed portable gas analyzer. Splash screen (a), main menu (b), preheat setting (c), and executing (d) measurement screen presenting the acetone concentration and the raw data from each sensor (e). Alternatively, the analyzer can be controlled through a serial interface (f).
Applsci 09 02605 g005
Figure 6. The gas-sensing characteristics of each particular gas sensor in the gas-sensing chamber under exposure to acetone in the 20–200 ppm range. Optimal operating temperature (given by the manufacturer) was ensured and 50% relative humidity was stabilized.
Applsci 09 02605 g006
Figure 7. The resistance changes of sensor S3 (non-dedicated to acetone detection) in a gas sensor array under exposure to 2–20 ppm of acetone. Optimal operating temperature (given by the manufacturer) was ensured and 50% relative humidity was stabilized.
Applsci 09 02605 g007
Figure 8. The calibration curves of all four sensors (S1–S4) in the gas sensor array under exposure to 2–20 ppm of acetone. Optimal operating temperature (given by the manufacturer) was ensured and 50% relative humidity was stabilized.
Applsci 09 02605 g008
Table 1. List of the signals routed through the mother–daughter board the pin-header connector. Sensor signals are arranged to provide shielding from the digital bus by putting the power supply lines in-between.
J1
Heaters +5 VDC supply12GND
Sensor 2 signal output34Sensor 1 signal output
Sensor 3 signal output56Sensor 3 signal output
SHT +3.3 VDC supp78GND
I2C bus SCL910I2C bus SCA

