1. Introduction
It has been nearly 40 years since Hung and Leendertz introduced shearography [
1,
2]. As an important optical measurement method, shearography has been widely used in the fields of shape measurement [
3], vibration analysis [
4,
5], and strain detection [
6,
7,
8]. Generally, a basic shearographic measurement system uses a shearing device, such as a Michelson interferometer, a Wollaston Prism (WP), or an optical wedge [
9]. By passing through a shearing device, two identical but slightly misaligned images are generated and interfere with each other.
In a previous study, we introduced a shearographic measurement system based on the WP and the temporal wavelet transformation (TWT) [
10]. Compared with the classical shearing devices, such as the Michelson interferometer, WP has an advantage in terms of common optical path arrangement, which improves the measurement stability and repeatability. WP also does not require the shifting structure of the Michelson interferometer. In further experiments, we proved the feasibility of combining the polarization splitting effect with the electro-optical crystal materials in temporal heterodyne shearing speckle pattern interferometry [
11]. However, there are still some problems to be solved. For example, the polarization splitting effect of WP is not specially perfect under an illuminant of high intensity, and the lights emergent from the prism are not only an e-o light and an o-e light, but also a transmission light, which confuse the interference signals and reduce the signal-to-noise ratio (SNR) and the image contrast [
12].
To solve these problems, we introduced the Rochon Prism (RP) to replace the WP. RP is also a traditional optical beam splitter, but different from the WP, the o-light is transmitted without refraction angle passing through the RP. As such, only two kinds of interference light occur in the interference field generated by the RP. In this study, we analyzed the advantages of the shearography based on RP, and conducted relevant experiments to compare the errors between WP and RP. The experimental results show that the RP meets the shearographic requirements and improves the accuracy of the measurement system.
2. Principle of DSSPI
After subtraction, the fringe patterns are visible and can be described as [
11]:
where
is the light intensity of background,
is the amplitude of modulation,
is the random initial phase, and
is the phase variable quantity that depends on the small deformation of the measured object by the loading. Equation (1) means that a high-frequency carrier
is modulated by a low-frequency factor
.
The deformation derivative can be expressed by [
11]:
where
is the out-of-plane displacement derivative,
λ is the wavelength of the illuminant, and
is the shearing distance. This means the out-of-plane displacement derivative can be obtained if we acquire the distribution of the phase difference.
In our previous research, we introduced the TWT to determine the wrapped phase [
10]. The continuous wavelet coefficient can be expressed as:
where
is the scale parameter,
b is the shift parameter, and
is the mother wavelet. The phase and the amplitude are given by:
where
is the imaginary part of
and
is the real part. After unwrapping the phase,
can be solved using Equation (2).
3. Comparing RP with WP
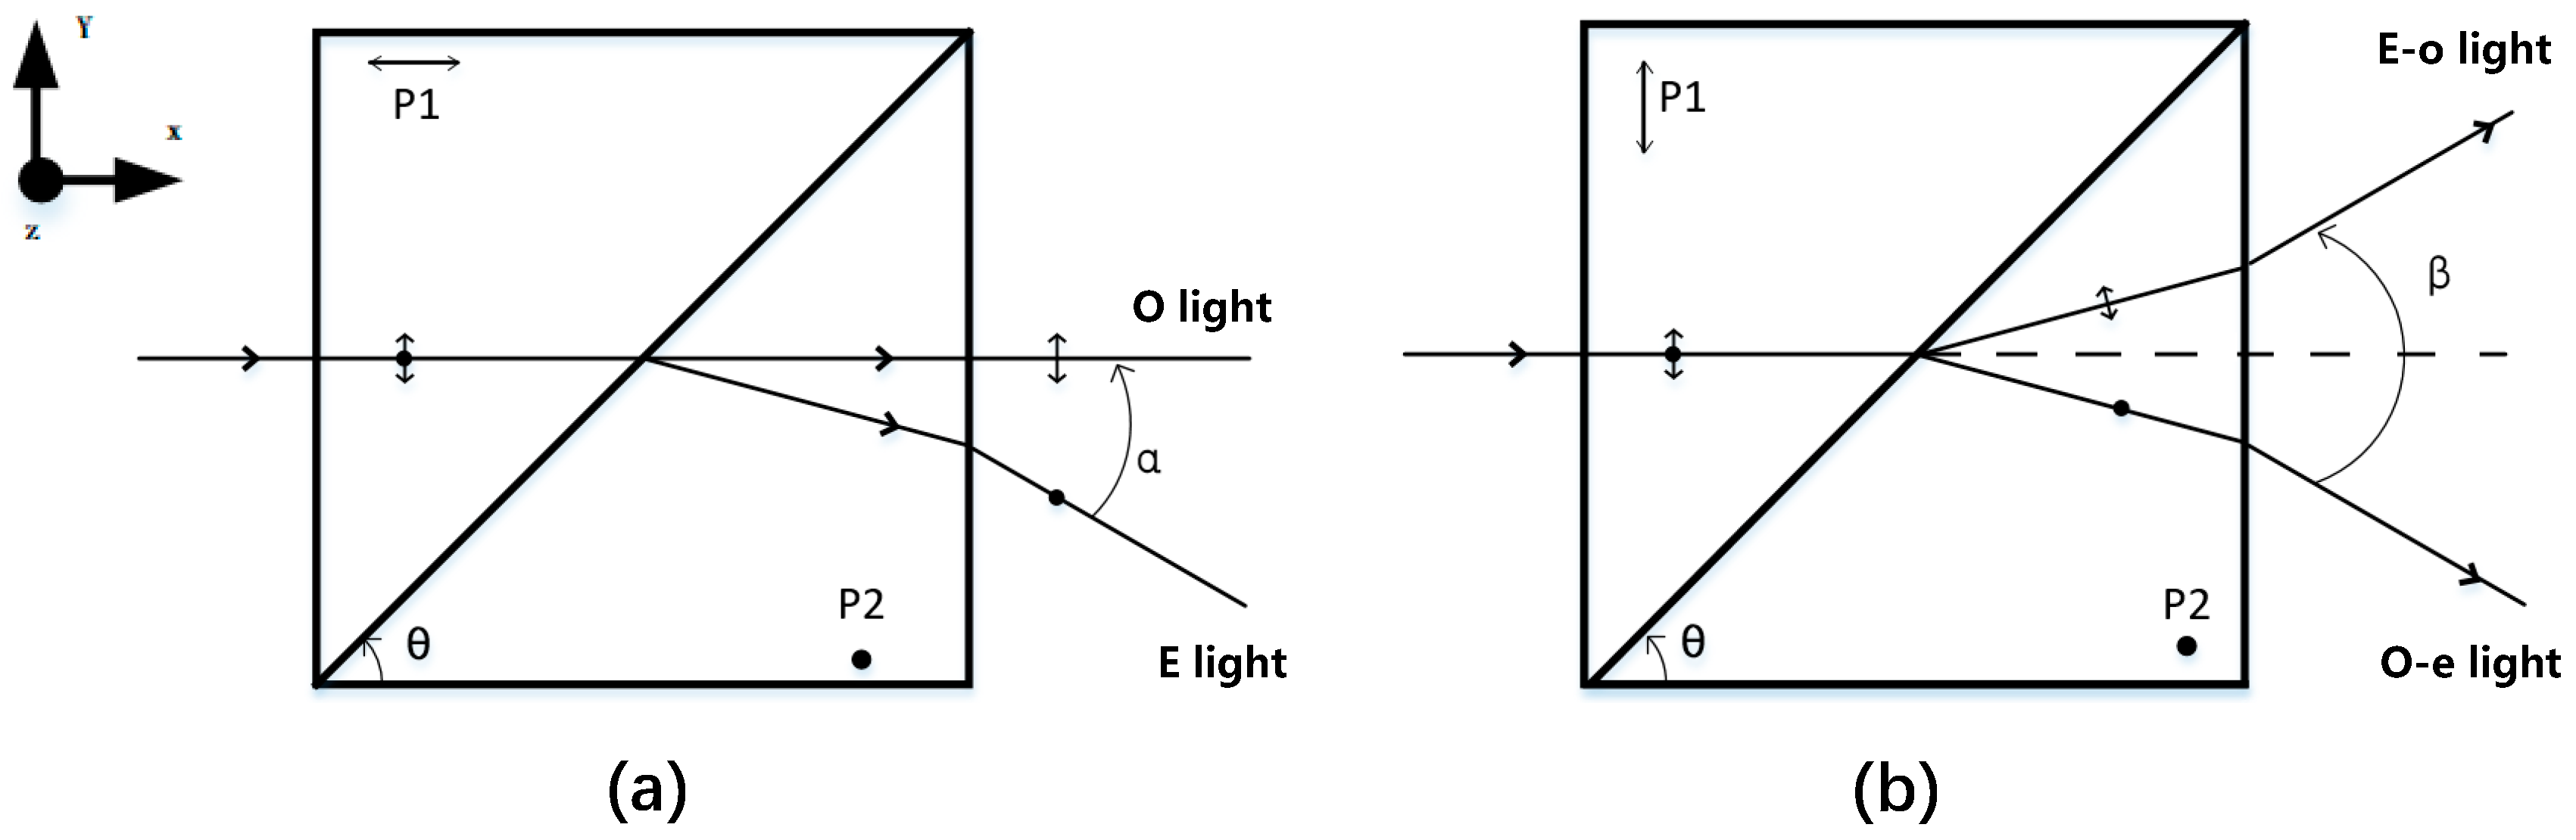
The RP and WP schemes are shown in
Figure 1. The difference between RP and WP is that their optical axes of the crystal in the first prism (P1) are mutually perpendicular. In
Figure 1a, the unpolarized incident beam is divided into o-light and e-light, where the o-light travels along the original optical axis of the measurement system (x-axis) without deviation and the e-light deviates from the optical axis with an angle of
α. However, in
Figure 1b, the incident beam is divided into o-e light and e-o light, neither of which remain along the x-axis.
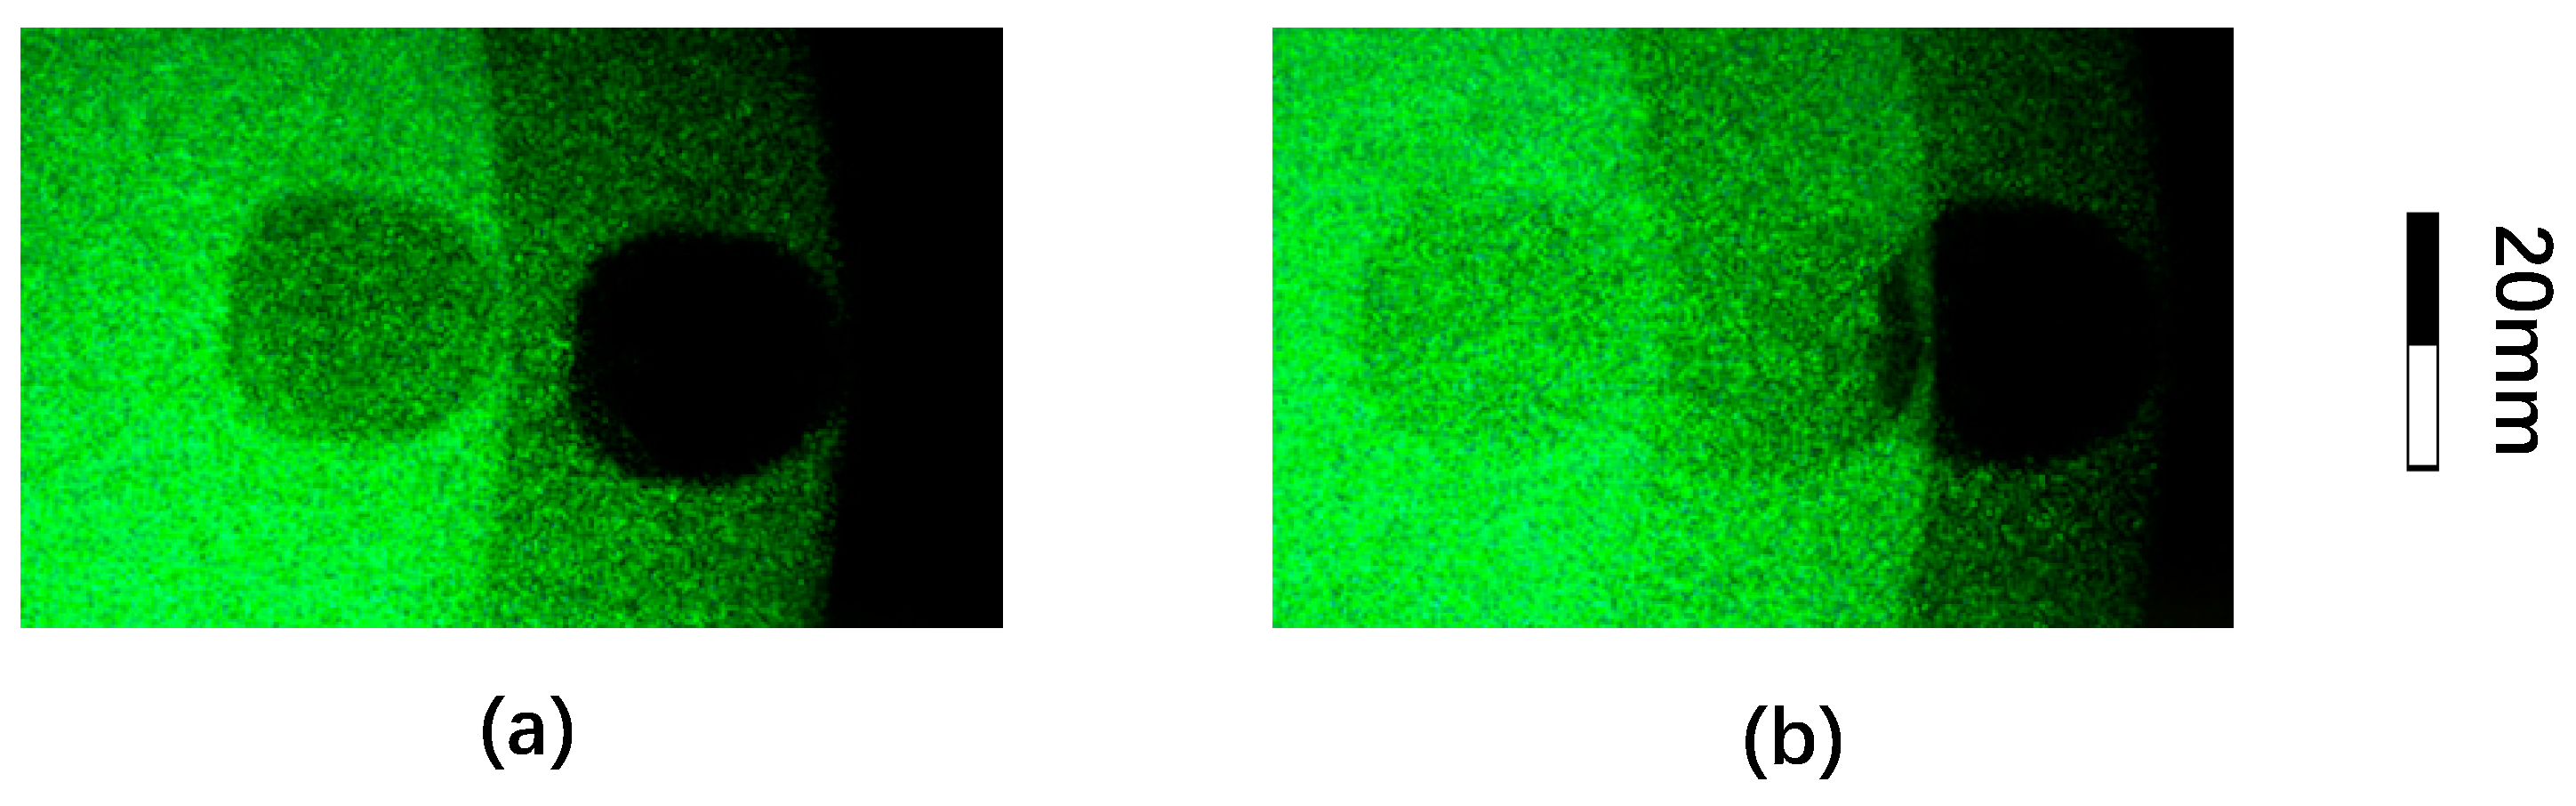
This difference produces RP’s two advantages. First, maintaining the o light along the optical axis improves the SNR. As shown in
Figure 2b, the sheared images generated by WP produce three overlapping images: the e-o light, the o-e light, and the transmission light, which is along the x-axis in
Figure 1b. Due to unexpected transmission light, there are three overlapping fringe patterns rather than one when the WP is applied in the shearography system. Contrary to WP, RP solves this problem automatically because of its optical path structure shown in
Figure 1a.
Figure 2a shows that there are only two sheared images (the o-light and the e-light) and no transmission light, which protects the fringe pattern from background noise.
Second, RP provides a more suitable angle of divergence. As shown in
Figure 1a, the optical path difference (OPD) is composed of the following two parts: the OPD in P2 where o-light and e-light are separated, and the optical path difference in the air caused by the angle of emergence between the o-light and e-light.
Next, we deduced the OPD in an RP. In the P1 of an RP, both the beams have the same refractive index and are not affected by the birefringence effect, which is different from the WP. When the beam enters the second prism (P2), the o-light has the same refractive index and is undeviated. The e-light has a different refractive index and bends away from the x-axis in
Figure 1a, causing the o-light and e-light to separate after their emergence. If the angle between the o-light and e-light is
, the OPD in P2 is:
where
is the distance that the o-light travels in P2, which can be described as:
where
is the distance to the geometric axis of the prism (positive above the central axis and negative below) and
is the prisms’ wedge angle. The relationship between
and
is:
After emergence, the angle of divergence between o- and e-light is
α. As o- and e-light have the same refractive index, the OPD in the air can be described as:
where
y is the distance between the prism and the CCD.
As most of the parameters are determined in a specific system, the general form of the phase difference can be obtained after combining the OPD of two parts, that is:
where
c is constant and
λ is the wavelength. In a particular measuring system, the phase difference at a certain point only depends on the distance from the axis of the prism.
If the shearing distance is
, which means that each point interferes with a corresponding point that is
away, the inherent phase difference of the interference system is:
An immobile phase difference means that RP would not introduce phase difference noise into the system, which is the same as WP. However, although the inherent phase difference of RP does not change due to the deformation of the object, the shearing distance of the prism is still reflected in the fringe distribution through Equation (10). The larger the shearing distance, the narrower the measured zone. The fringe pattern is sparser and the SNR is reduced with a large shearing distance. A smaller shearing distance, as shown in Equation (2), leads to a tighter pattern and lower contrast, which reduces the intensity and accuracy of the result [
9].
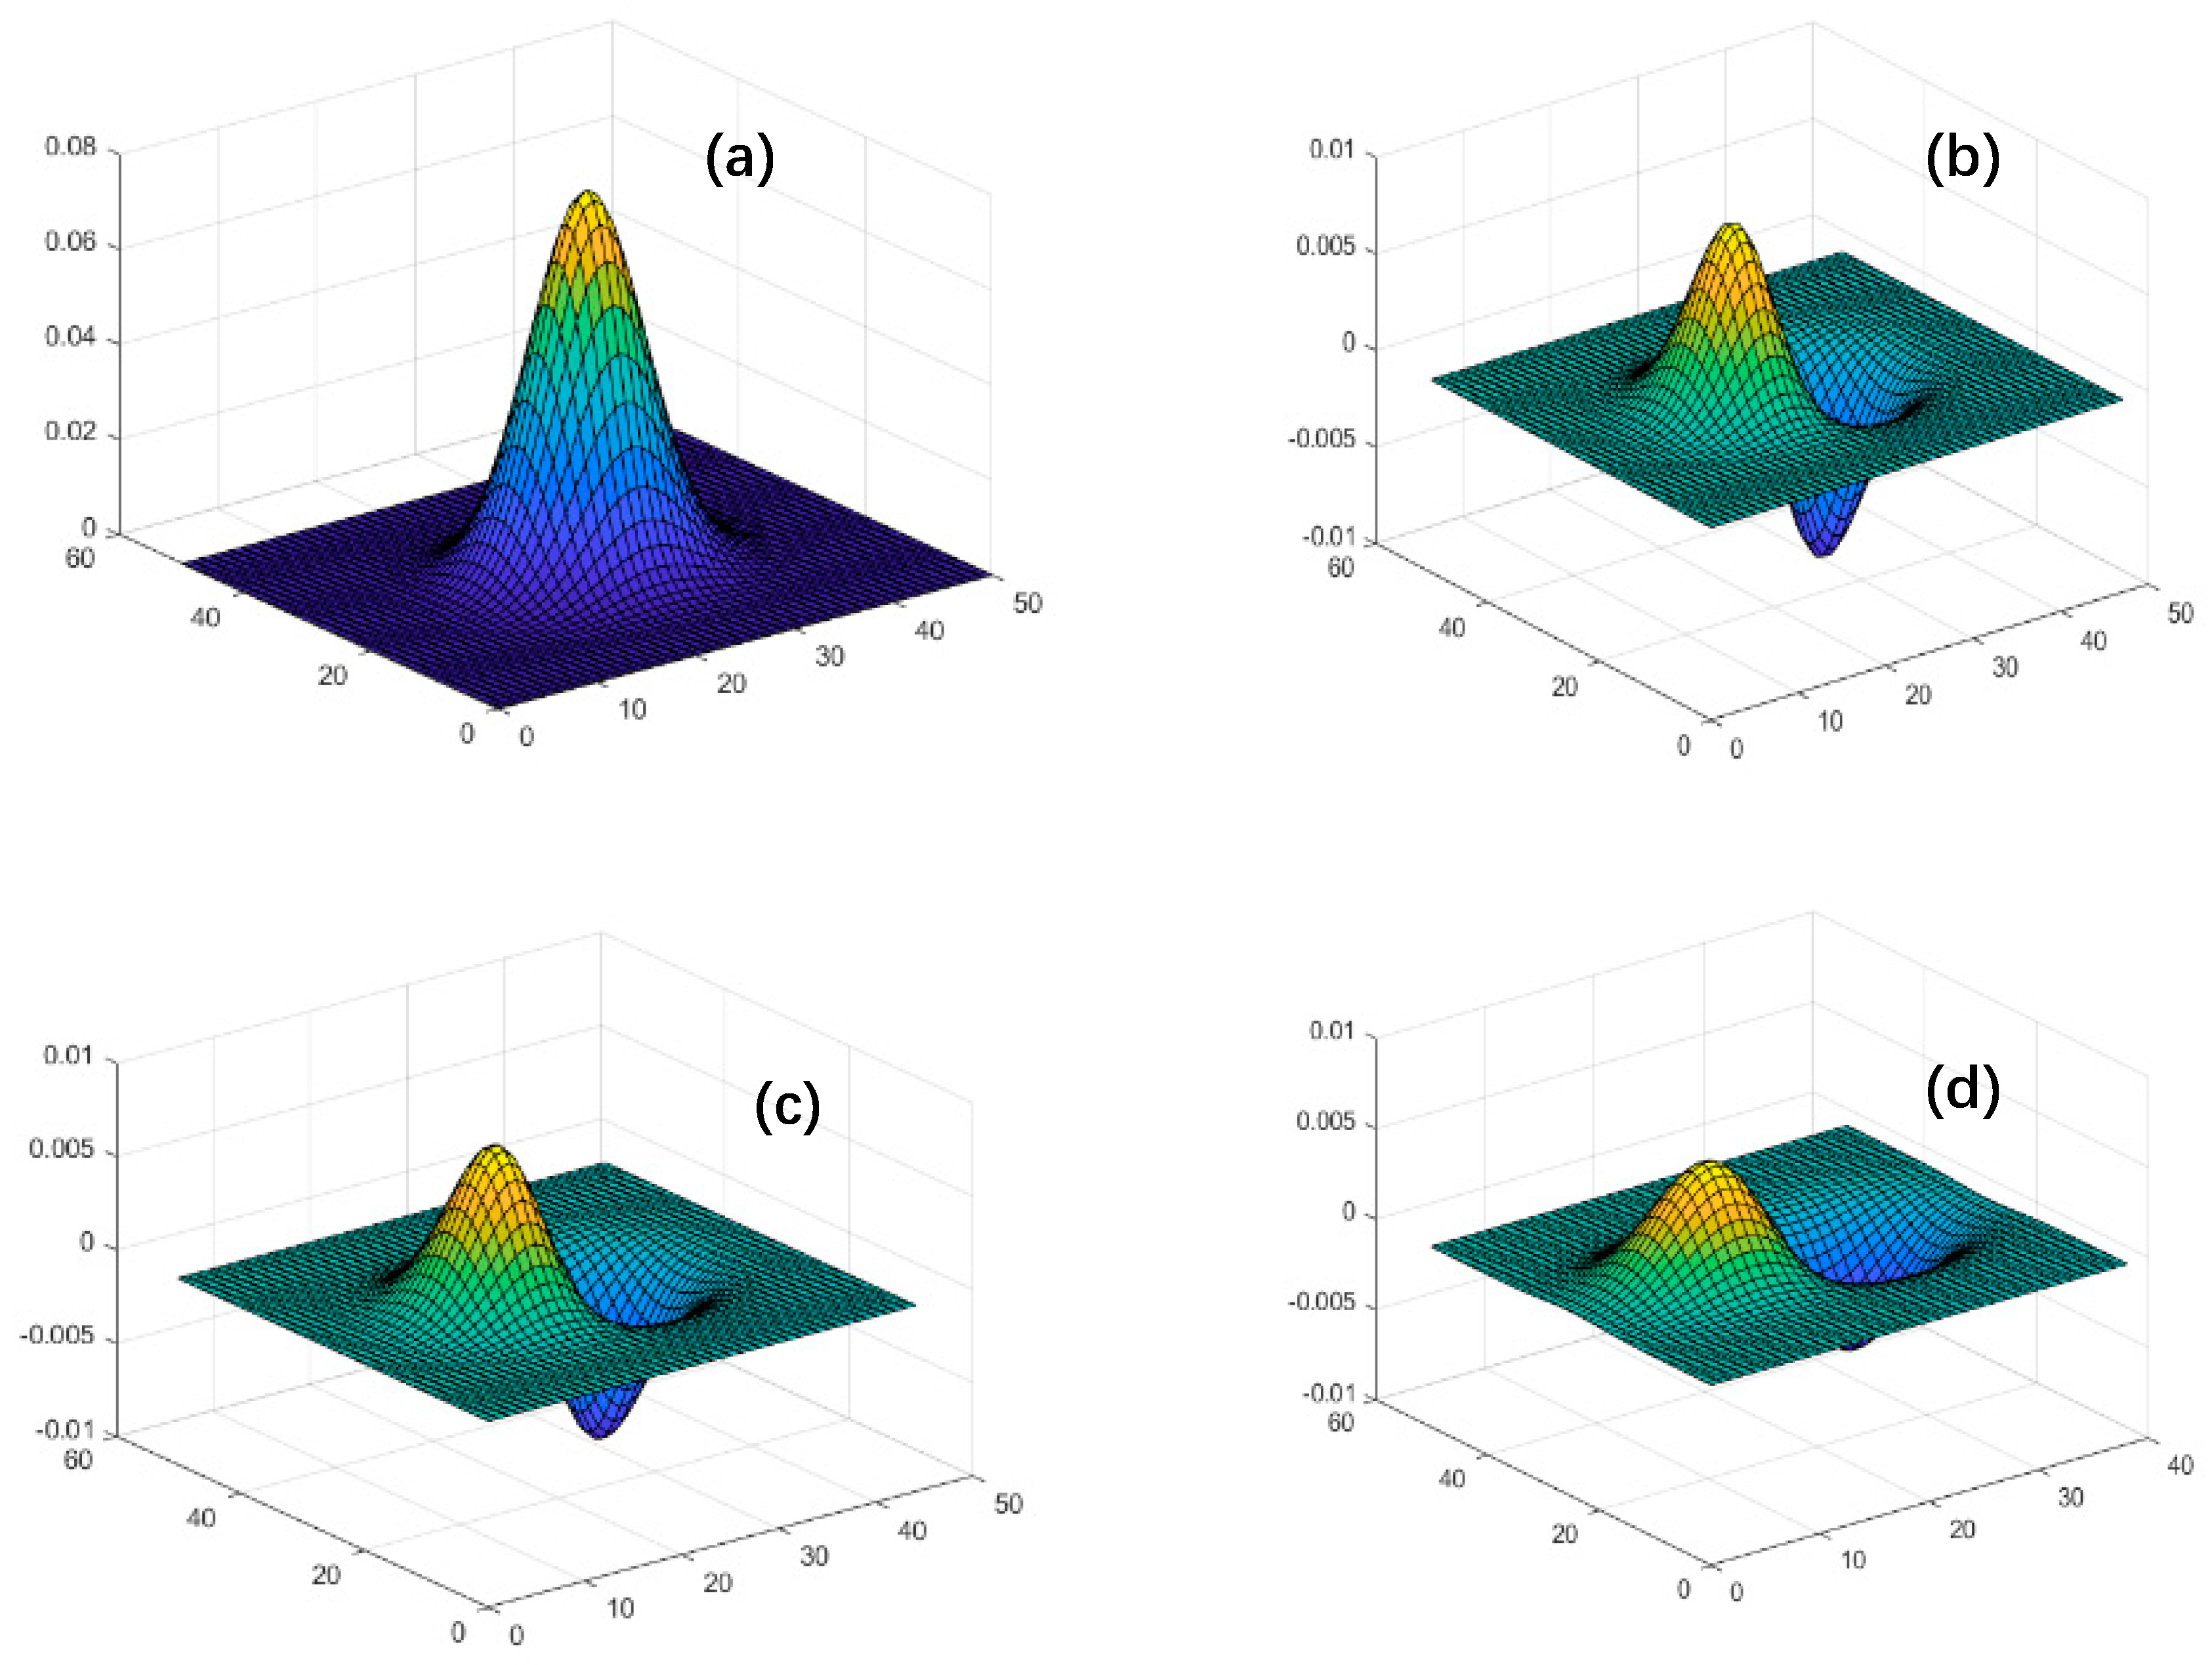
To verify the conclusion, we conducted a simulation, as shown in
Figure 3. Different shearing distances led to different distributions in the phase variety. In
Figure 3a, the surface after loaded is supposed to be Gaussian function. From
Figure 3b–d, the shearing distance was set from 3 to 12, which progressively lowered the peak of the difference distribution.
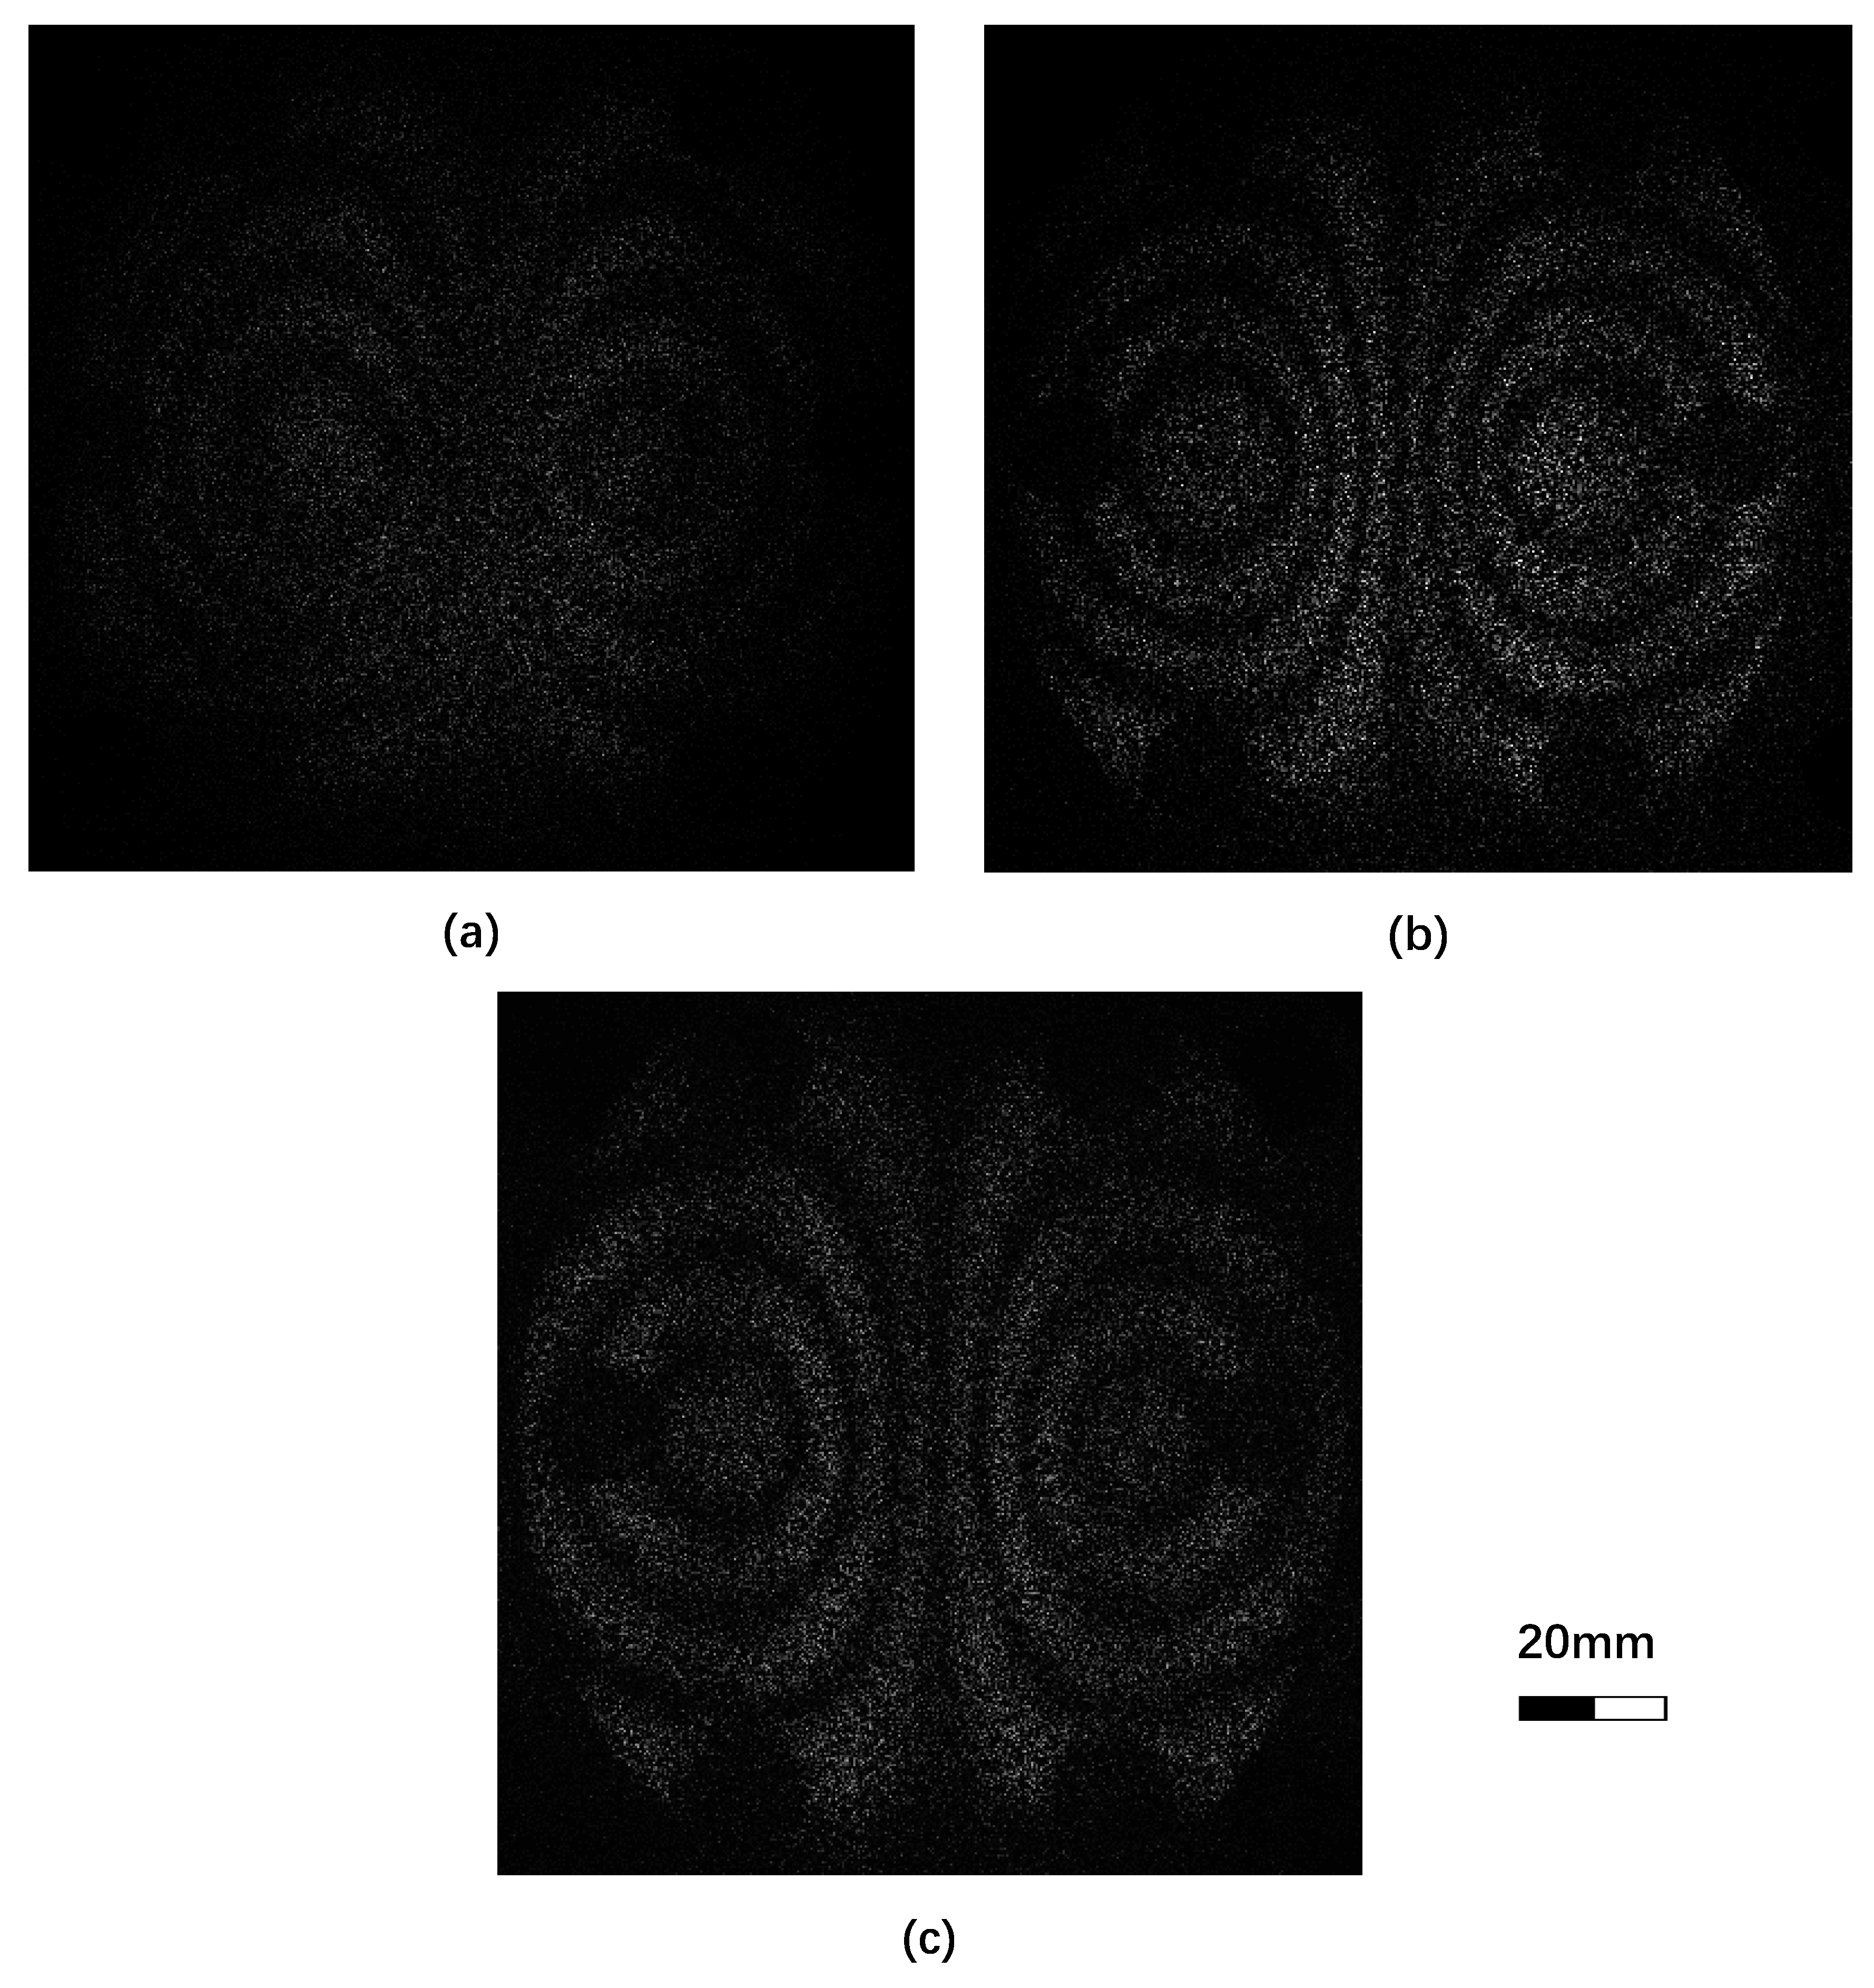
In reference [
13], the relationship mentioned above was analyzed and the fringe patterns under different shear were given, as shown in
Figure 4. The shearing distance is set to 10 mm in
Figure 4a, 20 mm in
Figure 4b, and 30 mm in
Figure 4c. When the shearing distance is too small, the stripes become dimmer and less visible because the phase difference between the interfered light sources is small and the overall phase changes is minimal, so the intensity at each pixel is not so different. As shown in
Figure 2, an excessive shearing distance reduces the maximum value of the displacement gradient, which also reduces the contrast of the interference pattern. Therefore, we should consider both when adjusting the shearing distance.
In some cases, the sensitivity is desired to be adjustable [
14,
15]. In Michelson interferometers with one of the mirrors tilted [
9], the shearing distance can be changed while the angle of the mirror is changed. As far as splitters such as WP and RP are concerned, their sensitivity, which depends on their shearing distance, is determined by their angles of divergence and their distance to the measured object. Under limited measuring conditions, such as a certain measuring distance and a fixed system resolution, we must choose a beam splitter with an appropriate emergent angle. Generally, the WP angle of divergence is larger than that of RP, which means that to maintain the proper shearing distance generated by WP, we have to reduce the measured distance and the measured area.
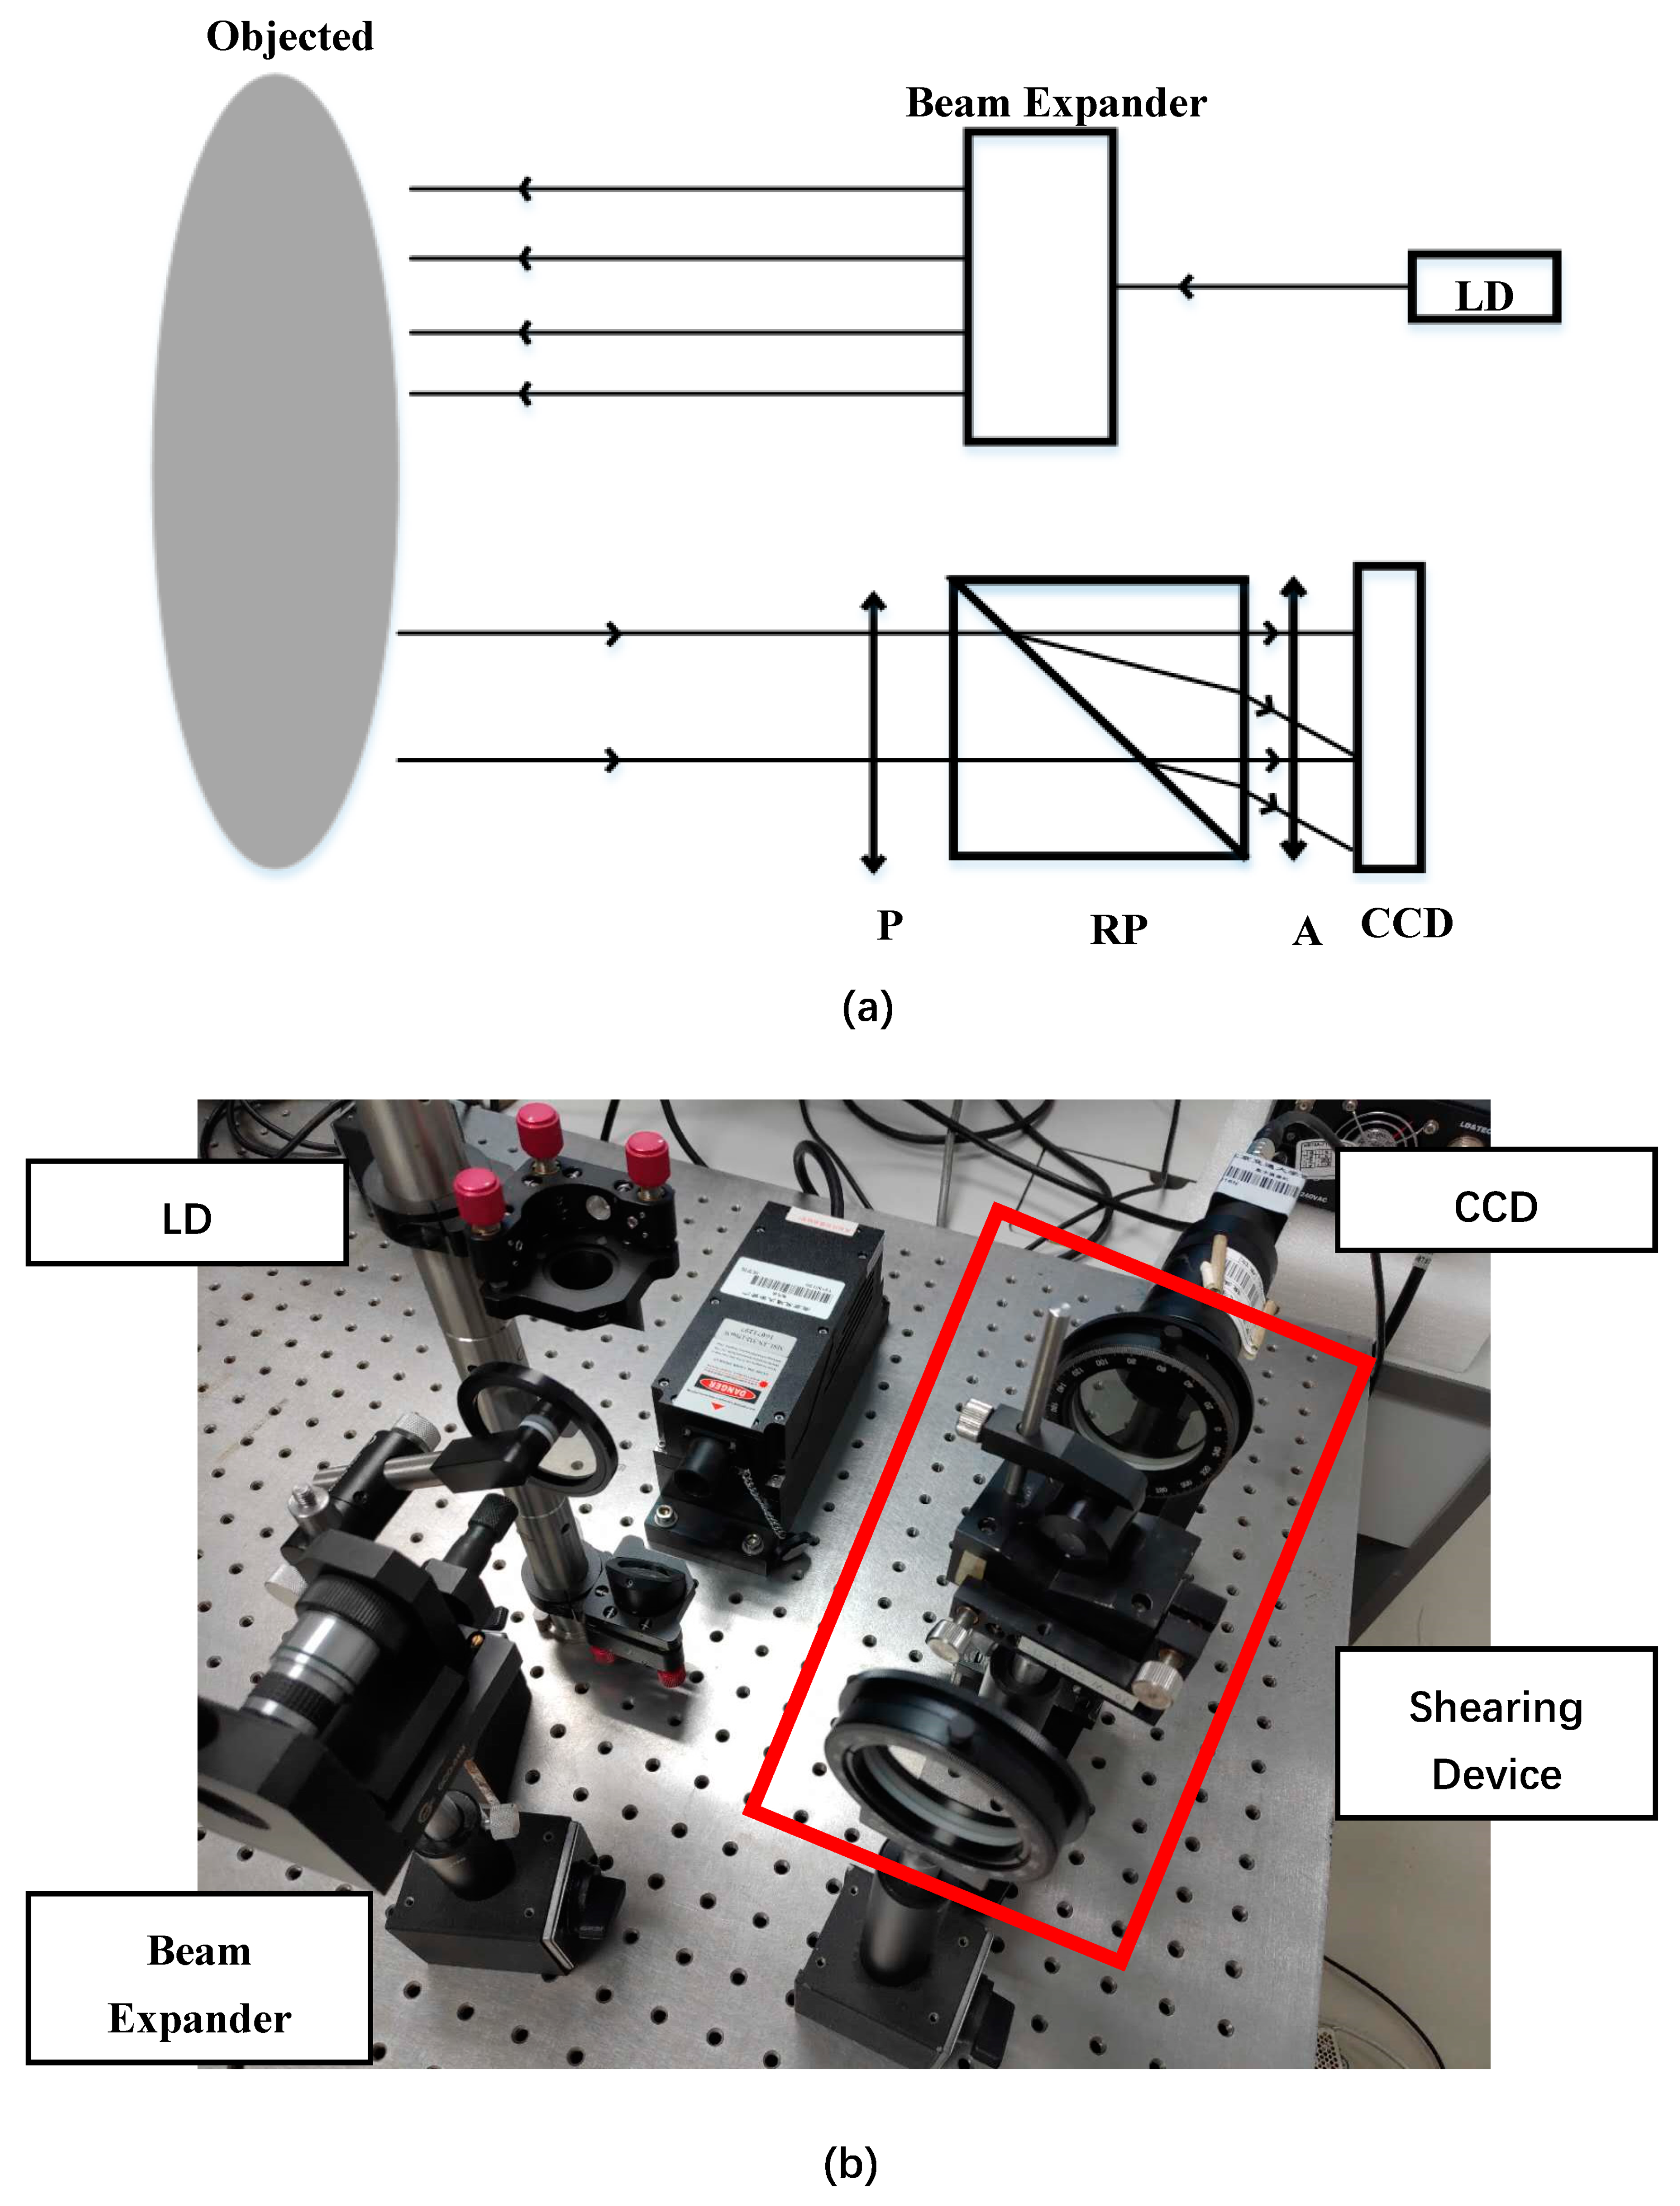
4. Experiments and Discussion
Here, we built a system to compare the performance of the two prisms under high power illumination. As shown in
Figure 5, the system is based on digital shearing speckle pattern interferometry (DSSPI). The illuminant was a 532 nm green single longitudinal mode laser (MSL-FN-532-150mW). The shearing devices were based on a WP and a RP respectively, the angles of divergence were 1.52° and 1.50°, respectively
In the experiment, a positive temperature coefficient (PTC) resistance was applied as the heat source to load the displacement. By associating the heat flux with the voltage applied to the PTC ceramics, we were able to quantify the load and ensure that the same amount of displacement was achieved in each experiment.
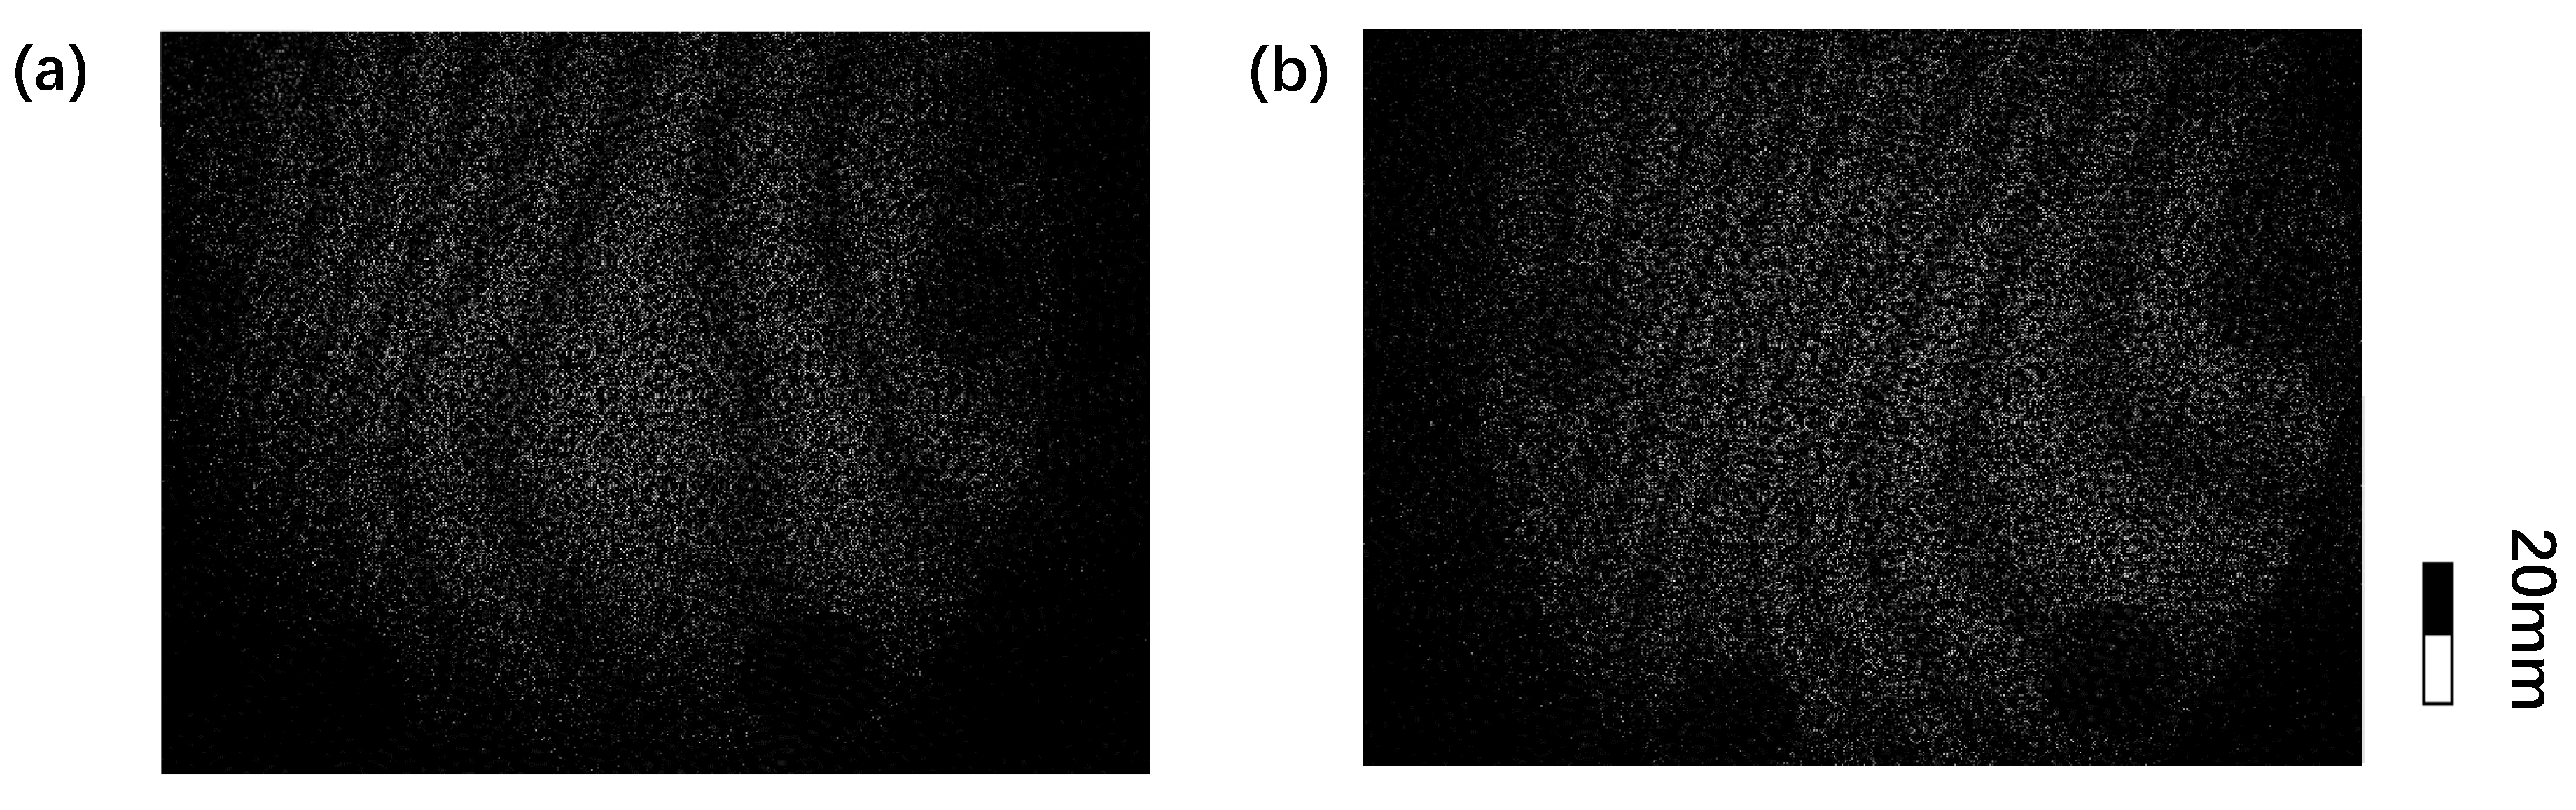
By changing the shearing device, we captured the speckle patterns under the same heating rate loaded, as shown in
Figure 6. With a laser of power 150 mW, the images acquired with RP and WP are shown in
Figure 6a,b, respectively.
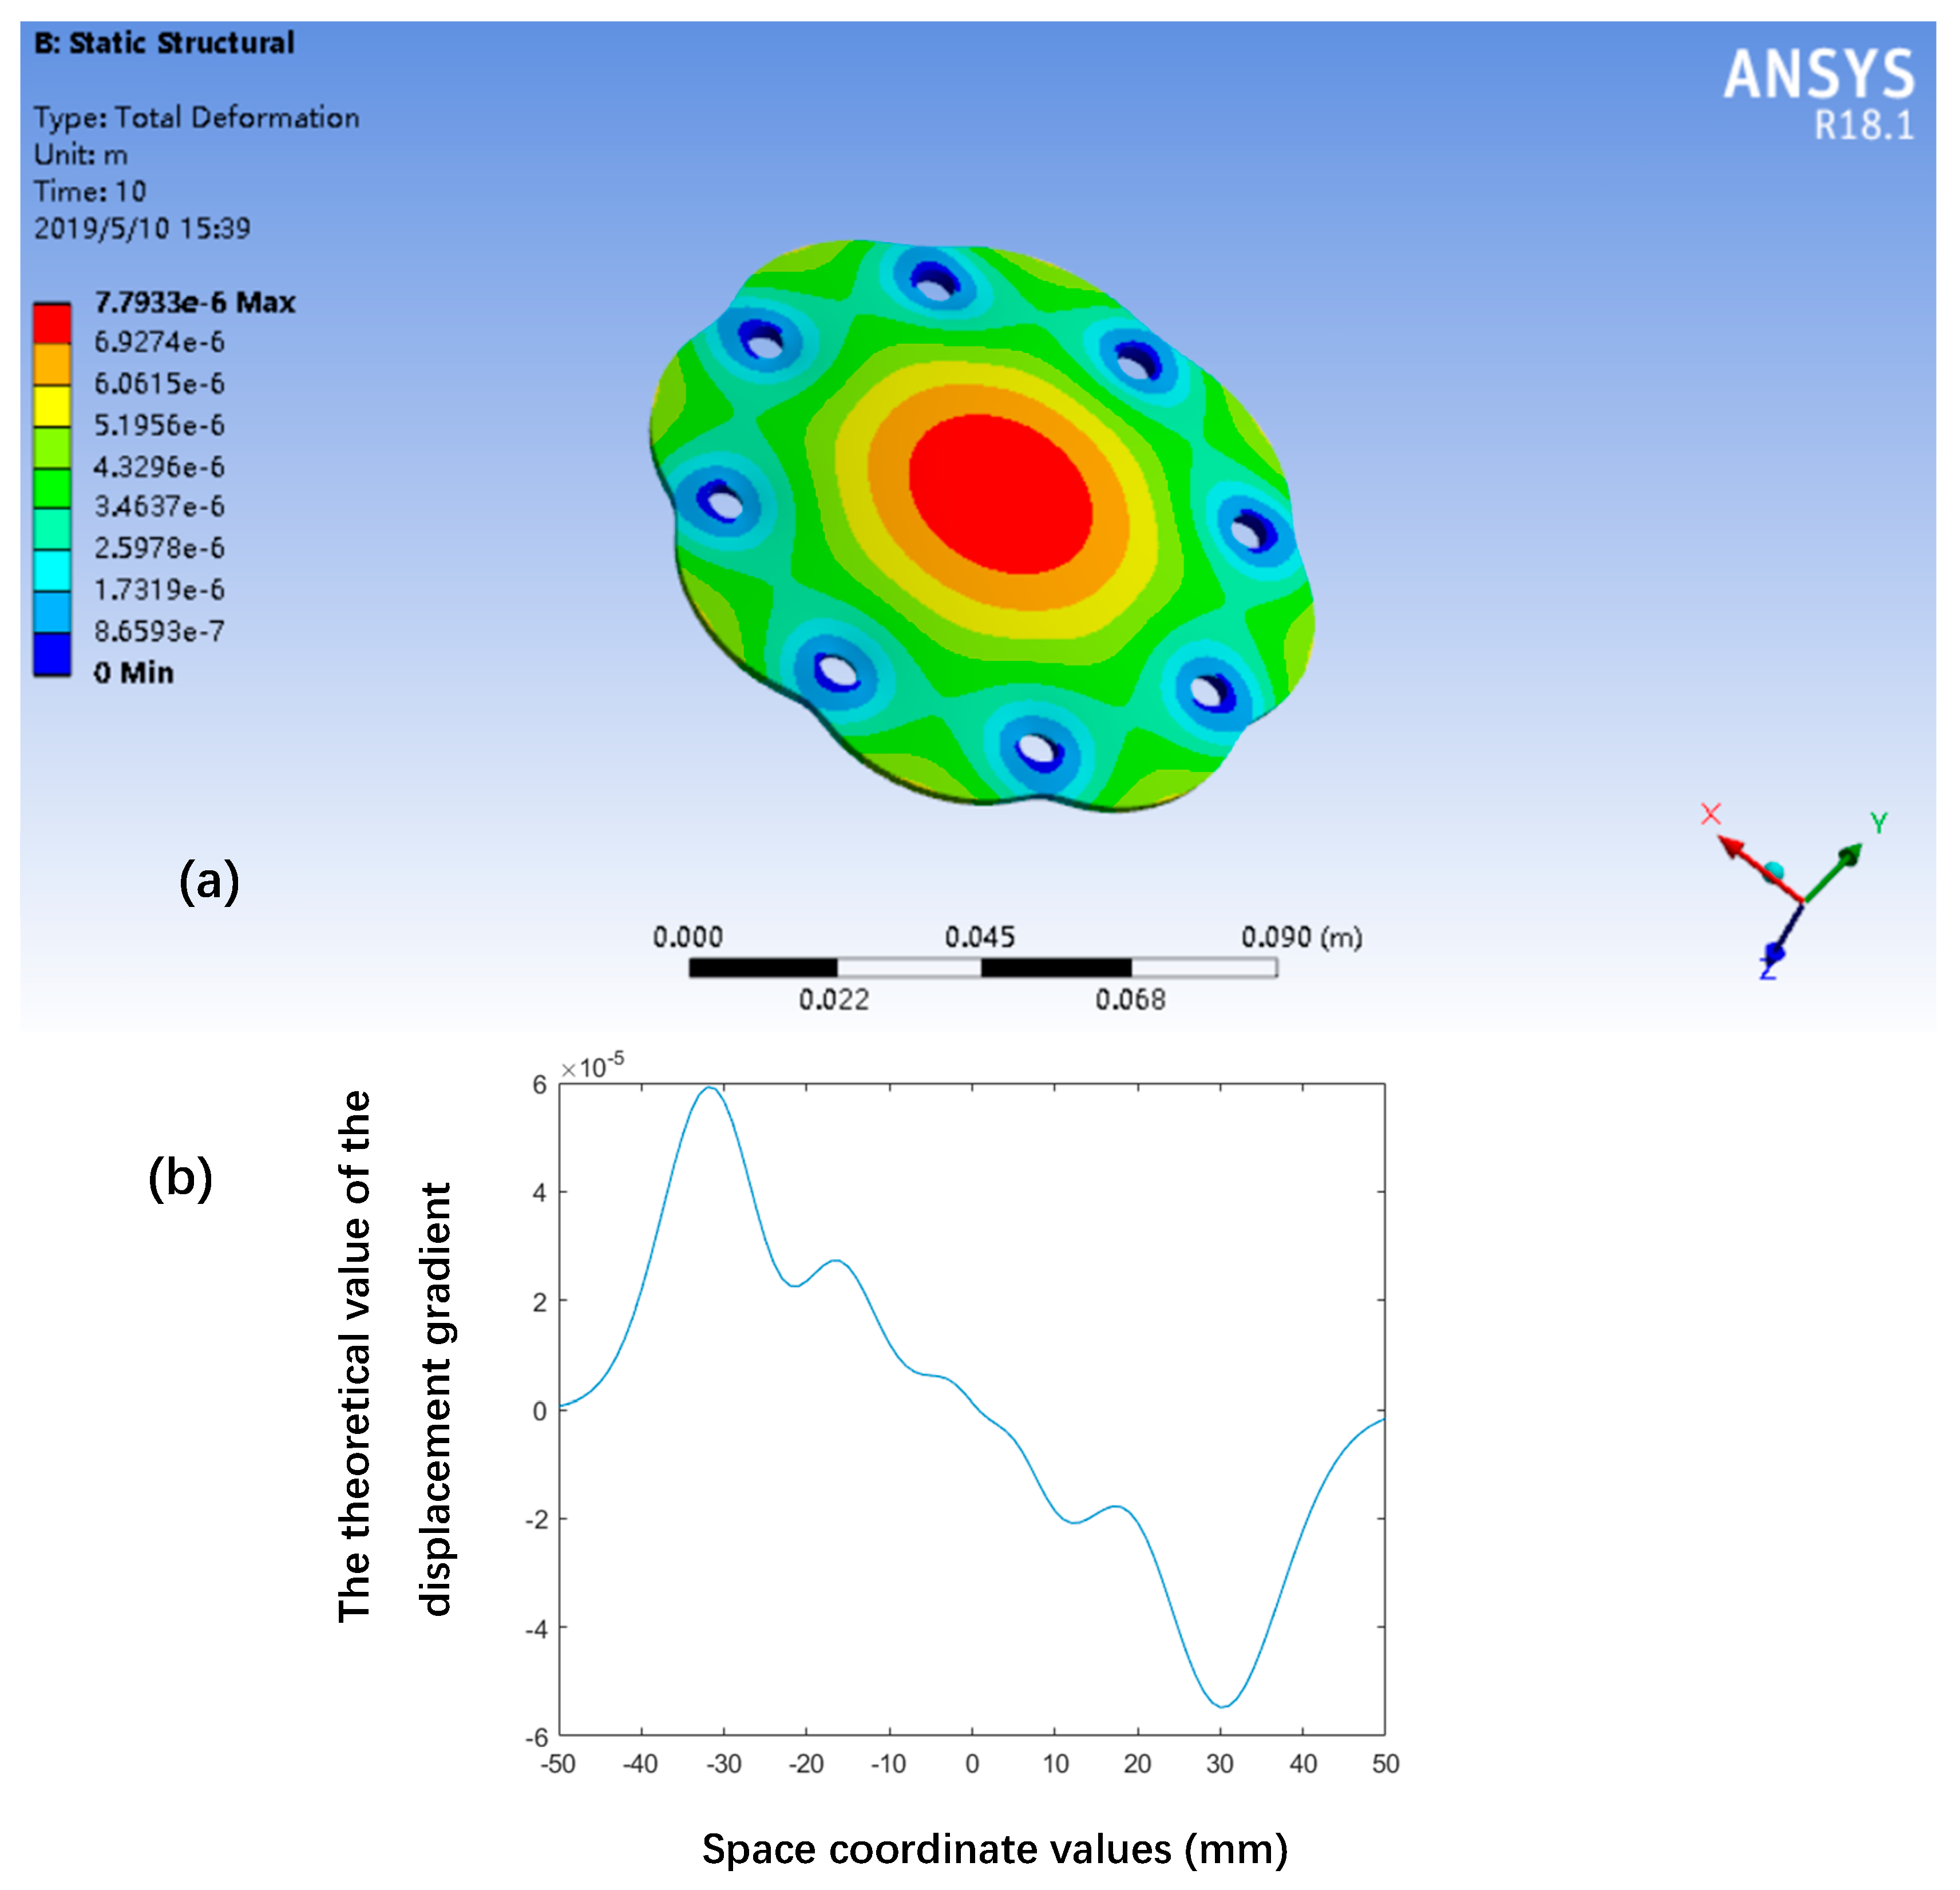
After ensuring that each experiment was loaded with the same amount of load, we established a model based on the finite element method (FEM) to simulate the theoretical value of the measured displacement, as shown in
Figure 7a. By dividing the surface of the measured object into many grid structures, we decomposed the overall changes of the measured object into the sum of local changes. The theoretical displacement gradient on the object surface should be distributed as shown in
Figure 7b.
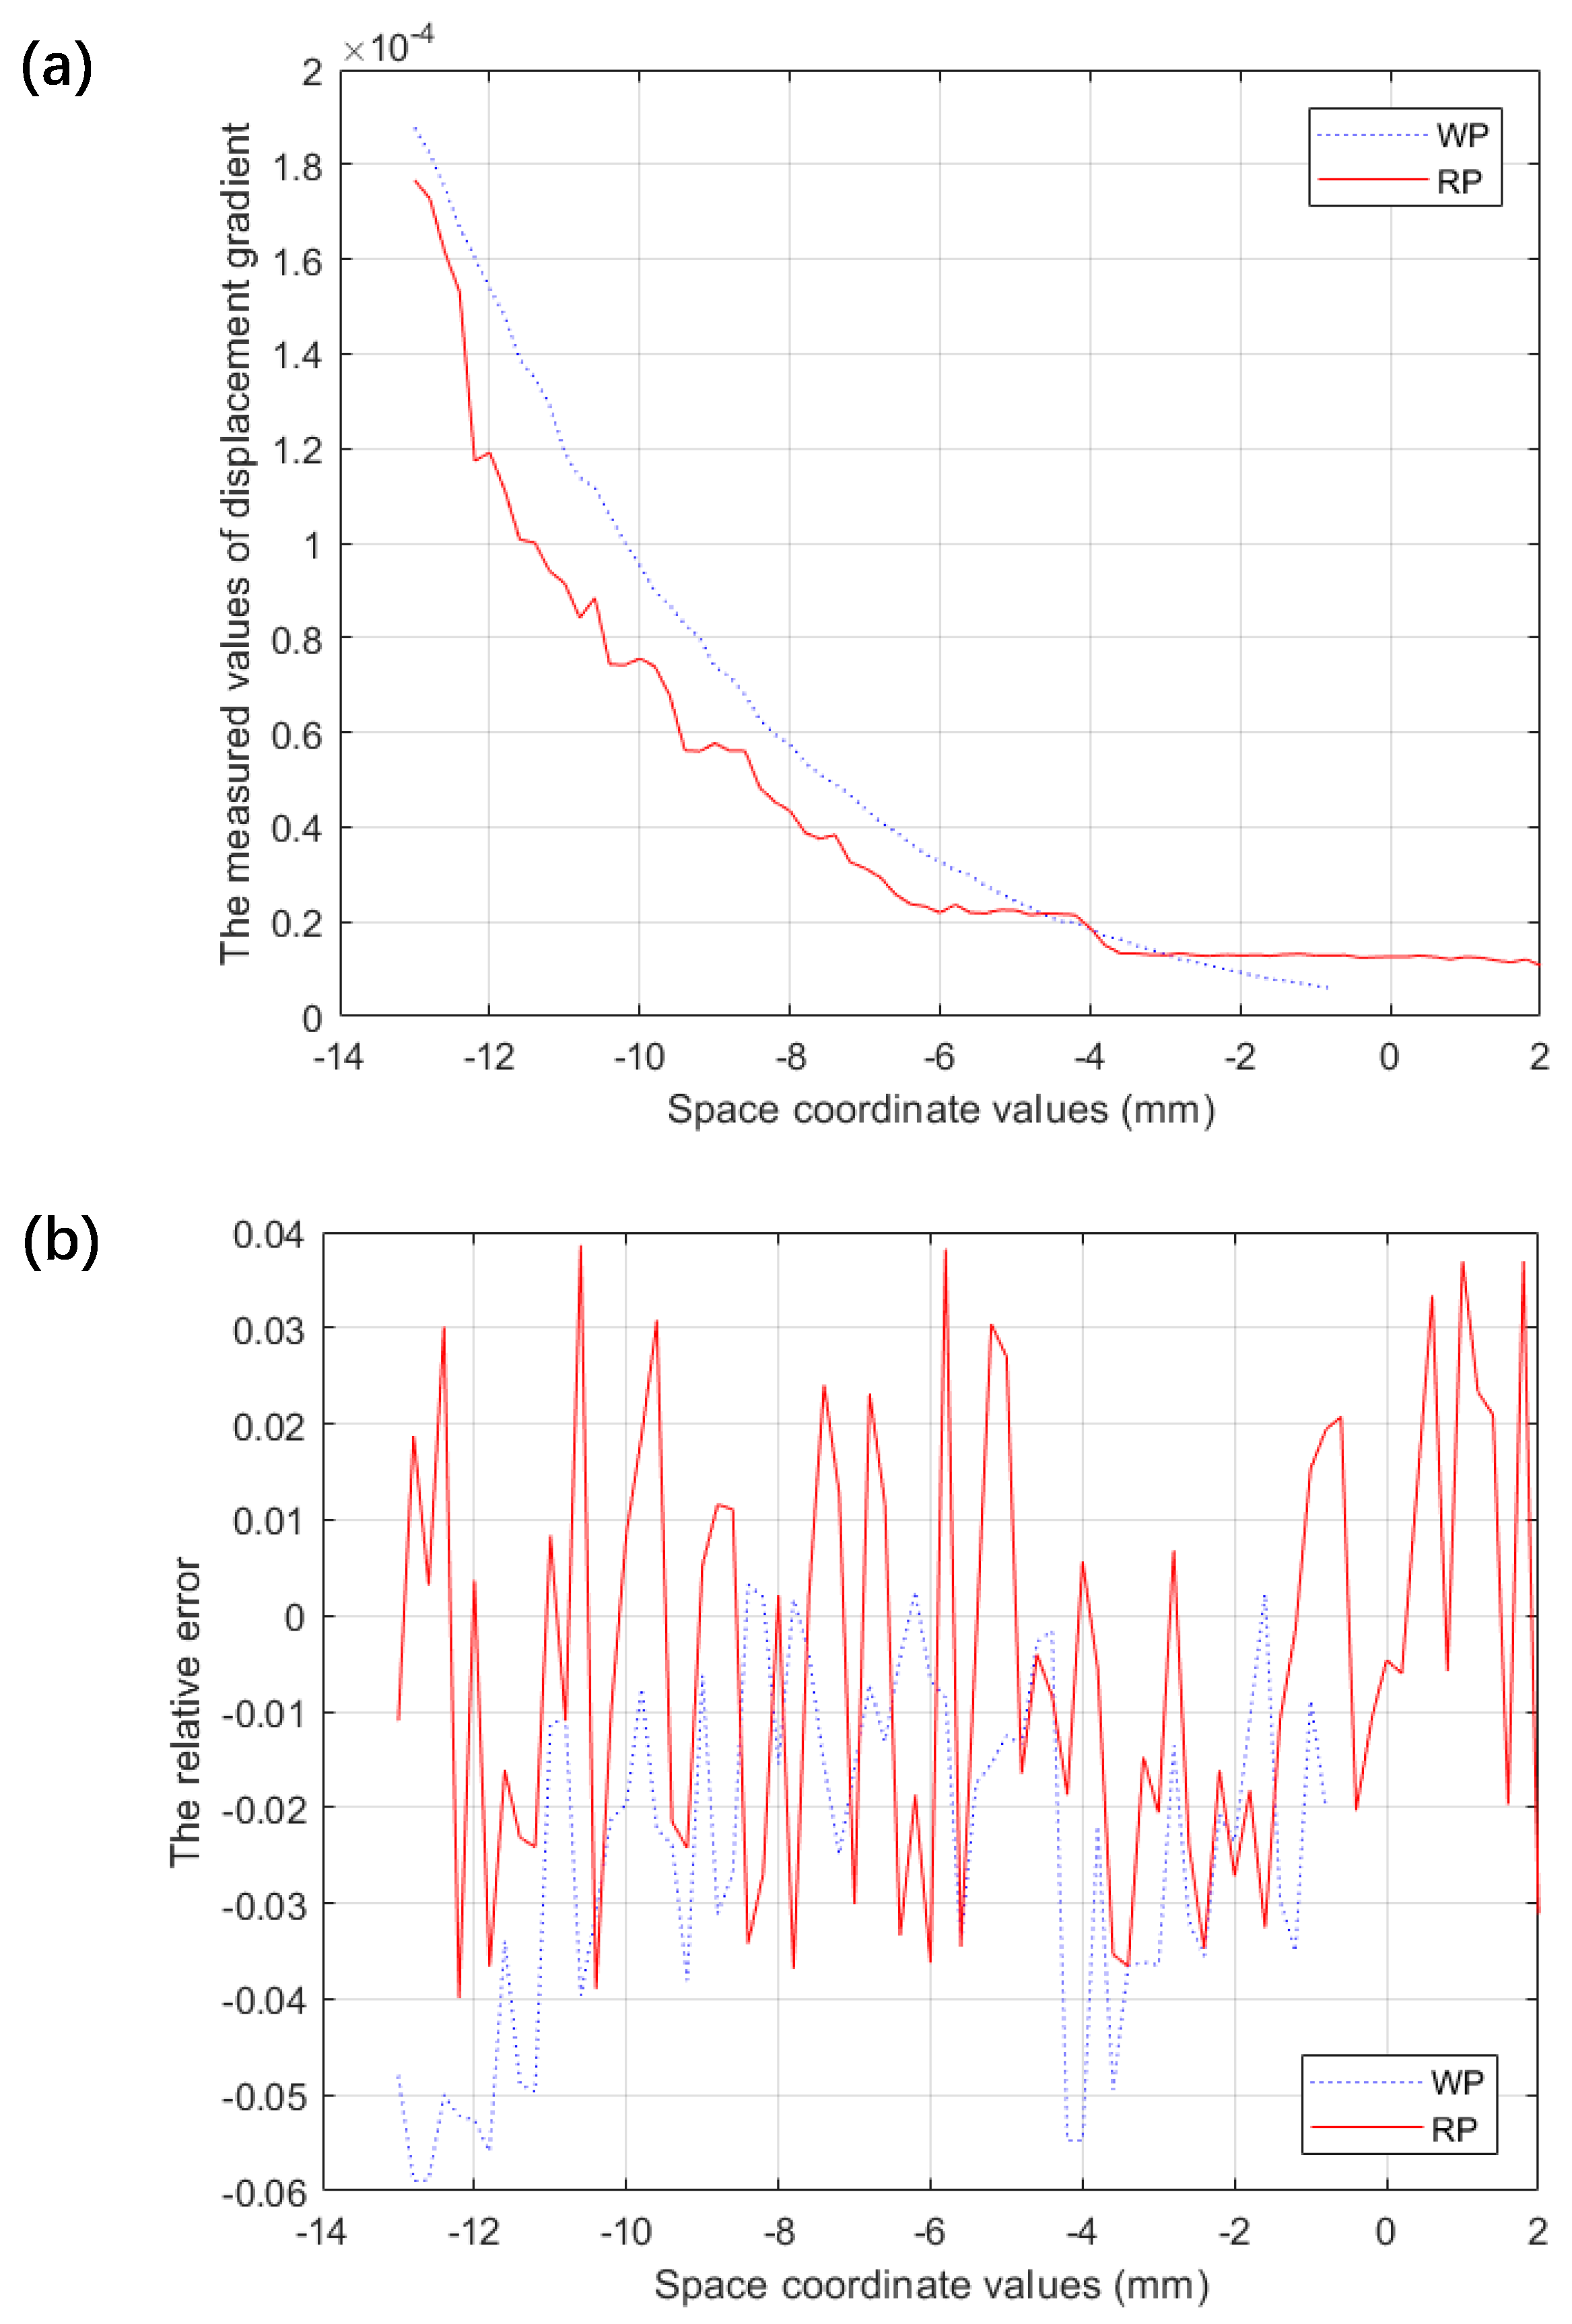
Using WP and RP as shearing devices, we measured the objects under the same FEM. As shown in
Figure 8, the measurement accuracies of the system with WP or RP as shear devices were different. The error distribution of WP had an obvious trend with the x-axis, and the overall error was larger than RP. In
Figure 8b, the maximum relative measurement error of RP is less than 4%; however, the maximum relative measurement error of WP is about 6% and has a systematic distribution trend.
The experiment proves that the RP can compensate for the system error caused by background noise. The accuracy of the system is limited by other factors, such as airflow and stray light. However, the improvements in the shearing device provides the possibility of using the shearographic measurement system outdoors, where the power of illumination is generally high.


