Transporting and Storing High-Level Nuclear Waste in the U.S.—Insights from a Mathematical Model


Abstract
:1. Introduction
2. Literature Review
3. Methodology
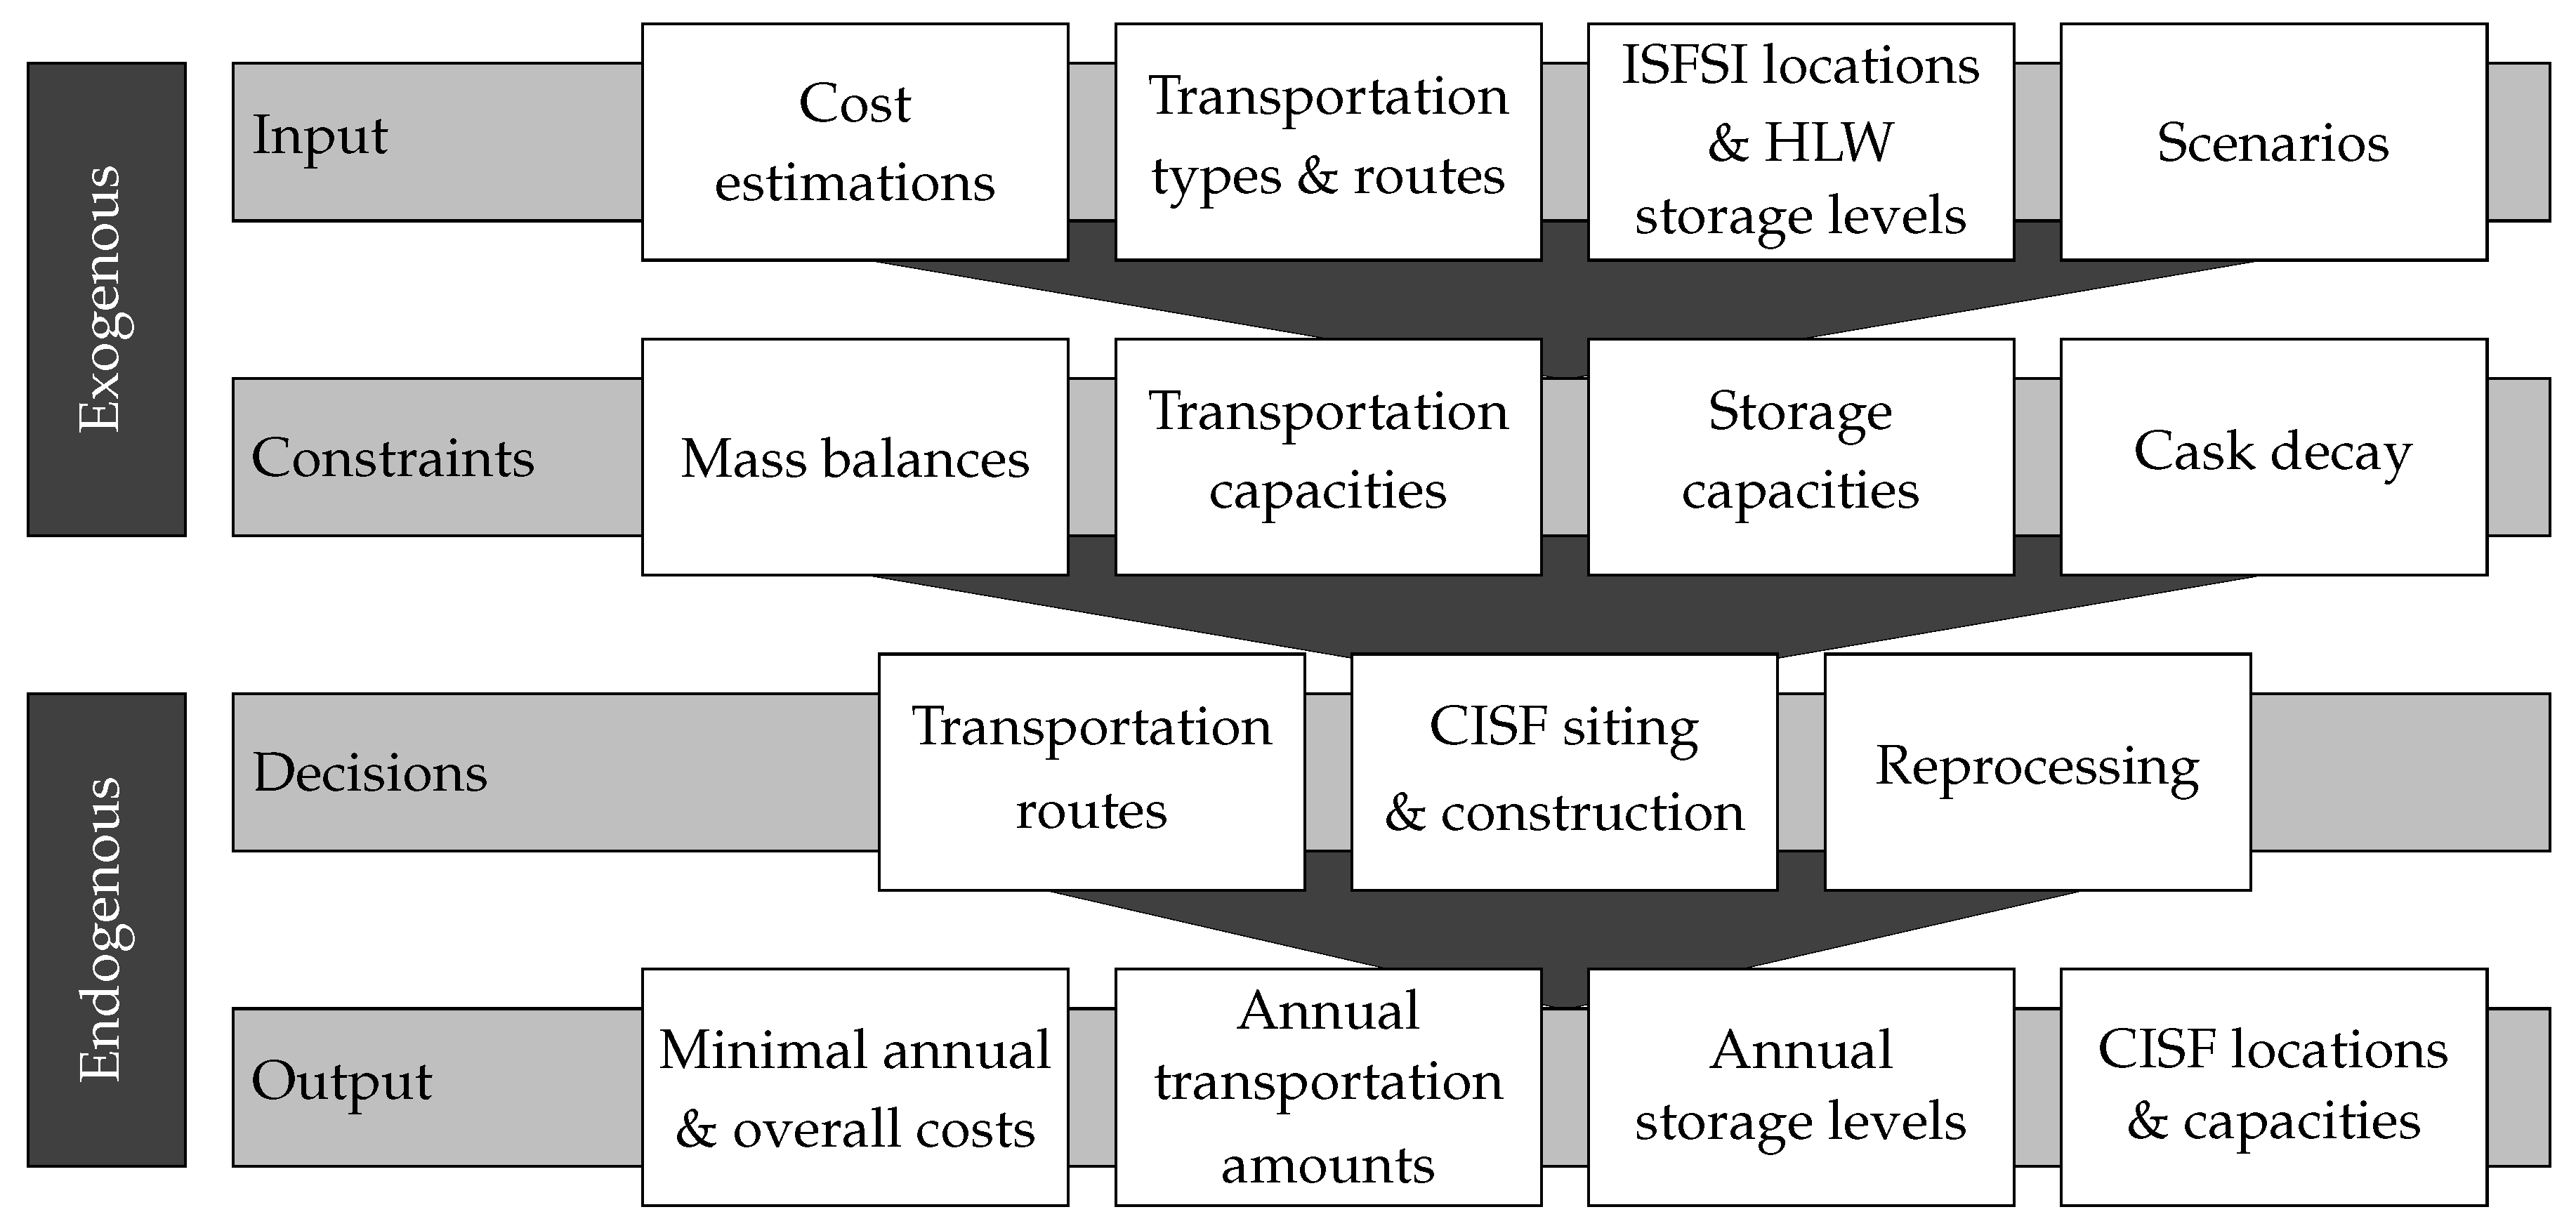
3.1. Model Overview
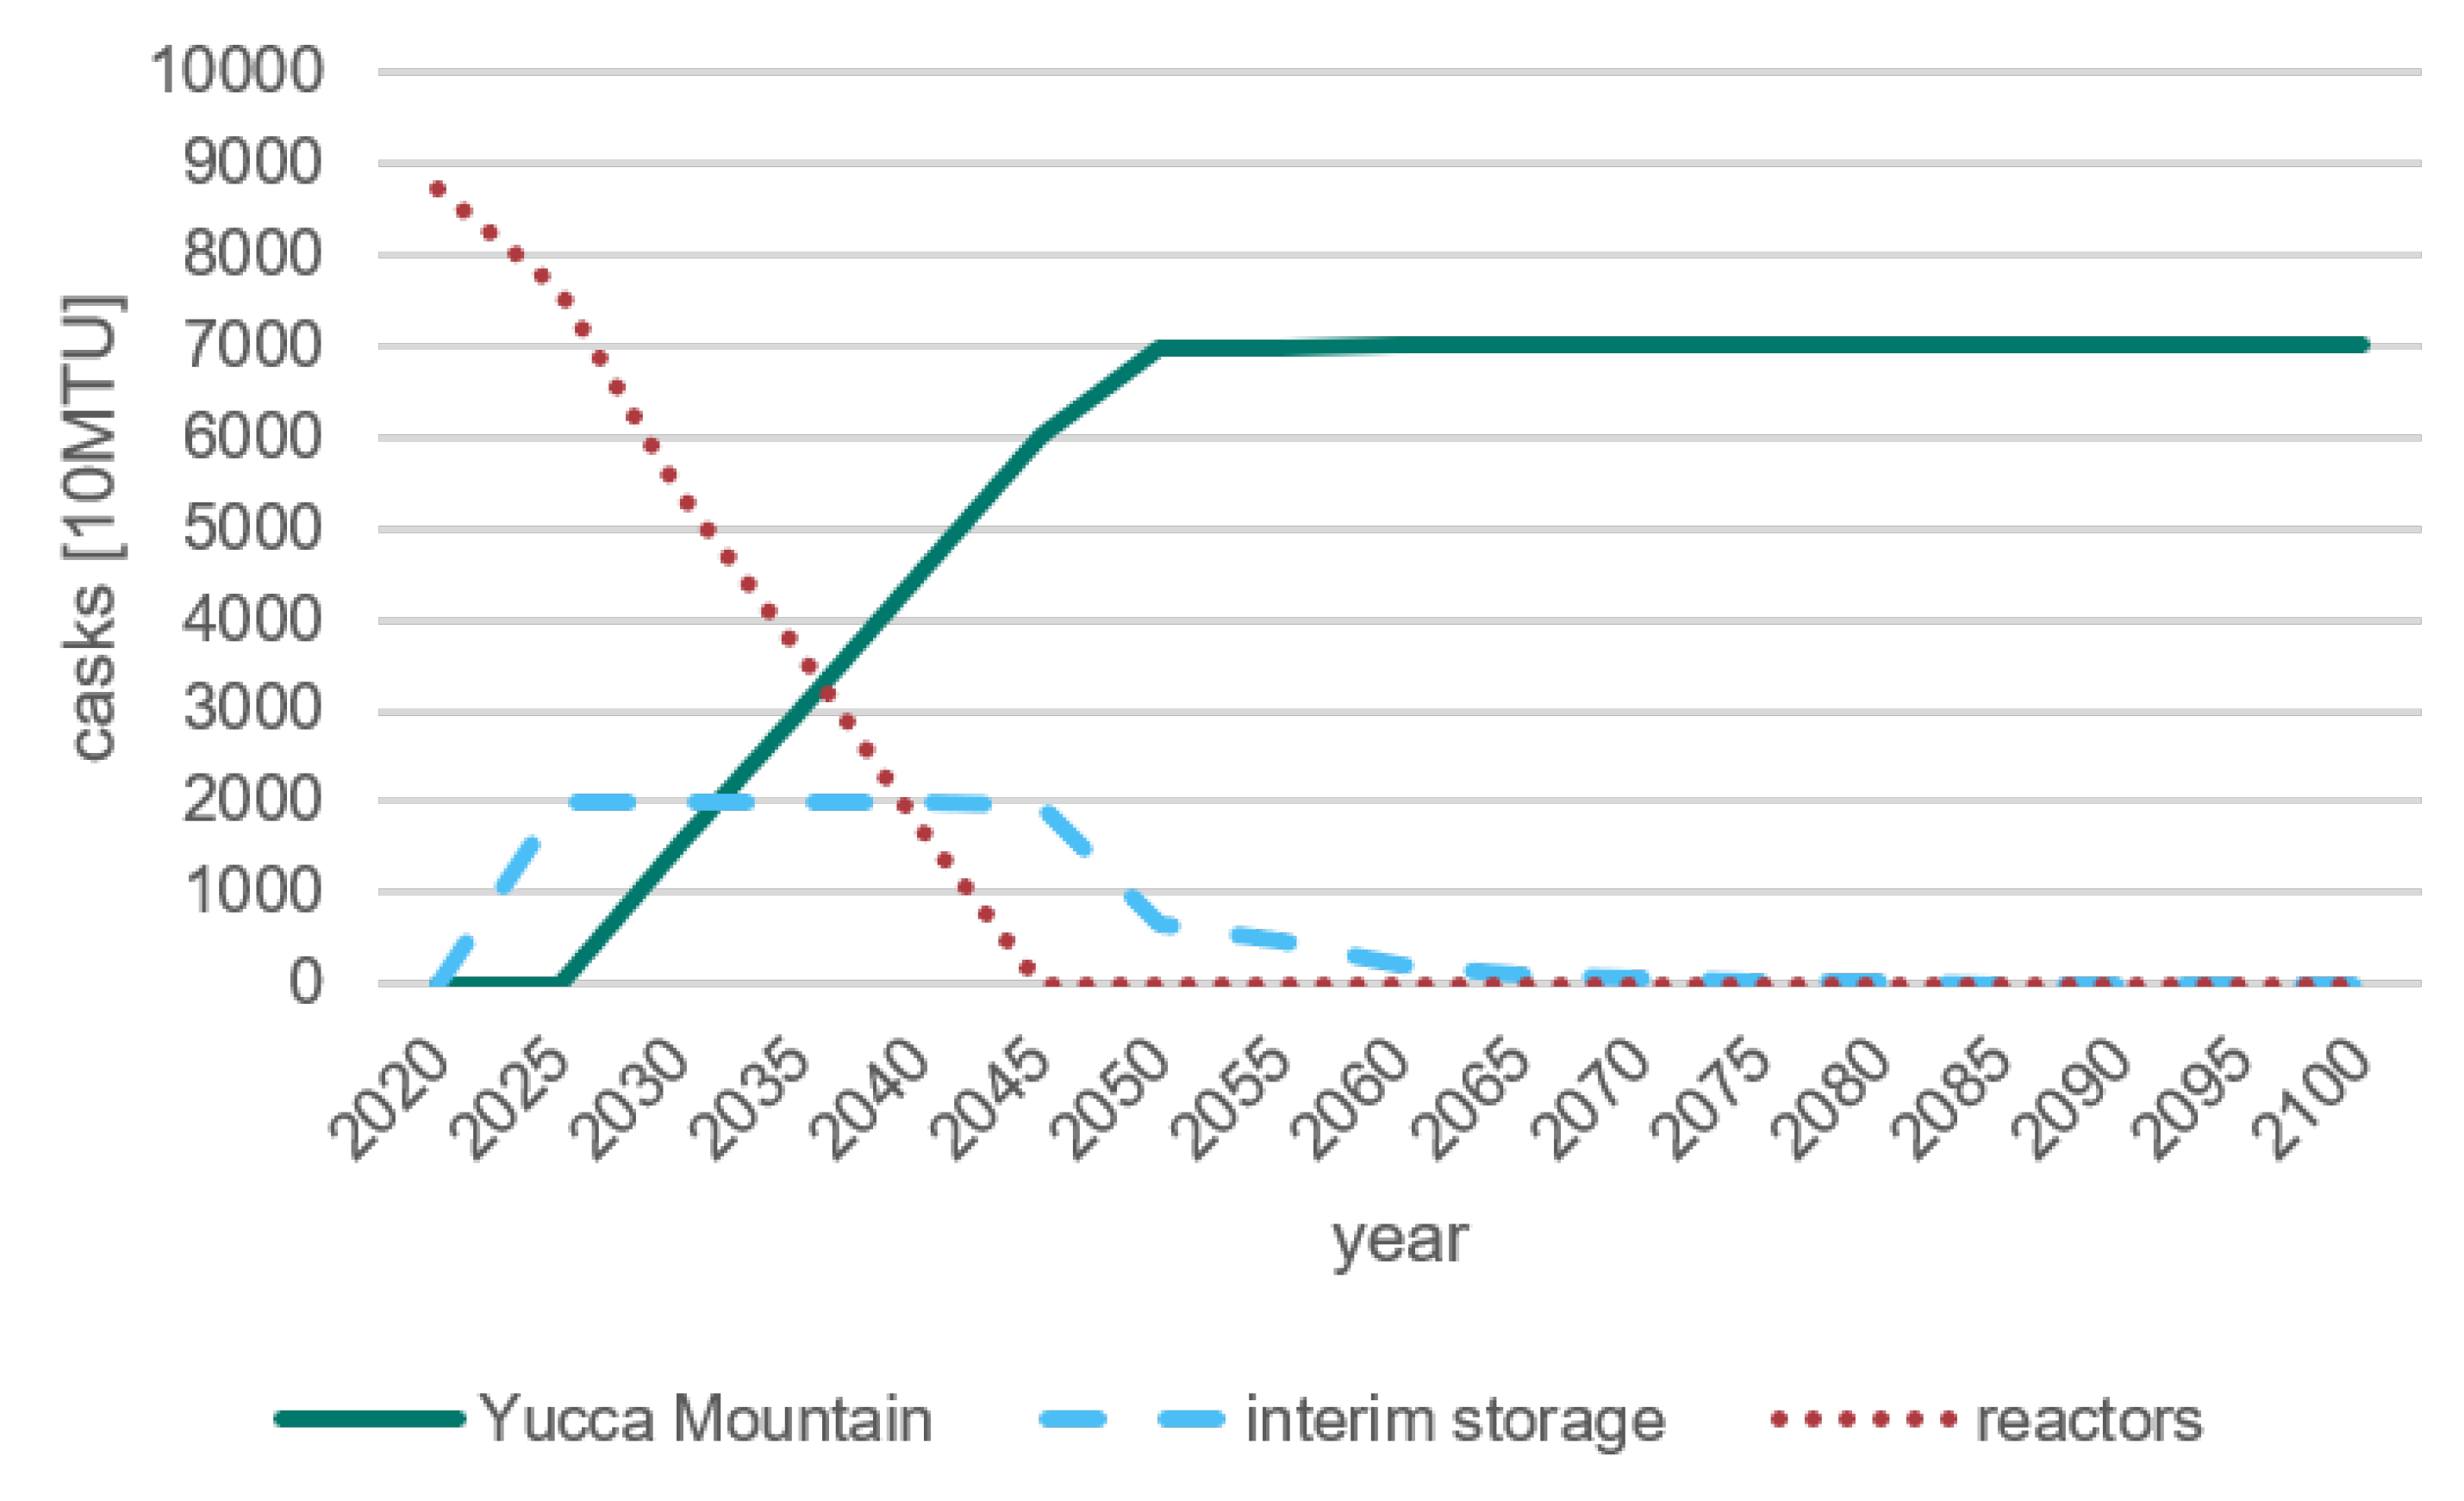
- The first kind are the NPPs that produce the HLW, which also store amounts of HLW in independent spent fuel storage installations (ISFSI) until further transportation.
- From here on, the waste can be transported either directly to the final repository or to an CISF. The model has the option to build these facilities when needed, at predefined locations.
- There are two nodes representing two hot cells (hot cells are shielded nuclear radiation containment chambers. They protect operators from radiation by providing a safe containment box in which they can open the casks containing SNF and either refill it into other casks or extract it for reprocessing purposes (Engineering360. Hot Cells Information, 2018. Accessed via the Internet on 29.01.2018 at http://www.globalspec.com/learnmore/lab_equipment_scientific_instruments/lab_safety/hot_cells), to which HLW can be transported either from the reactors or from the interim storages.
- Once in the final repository the waste can not be accessed again.
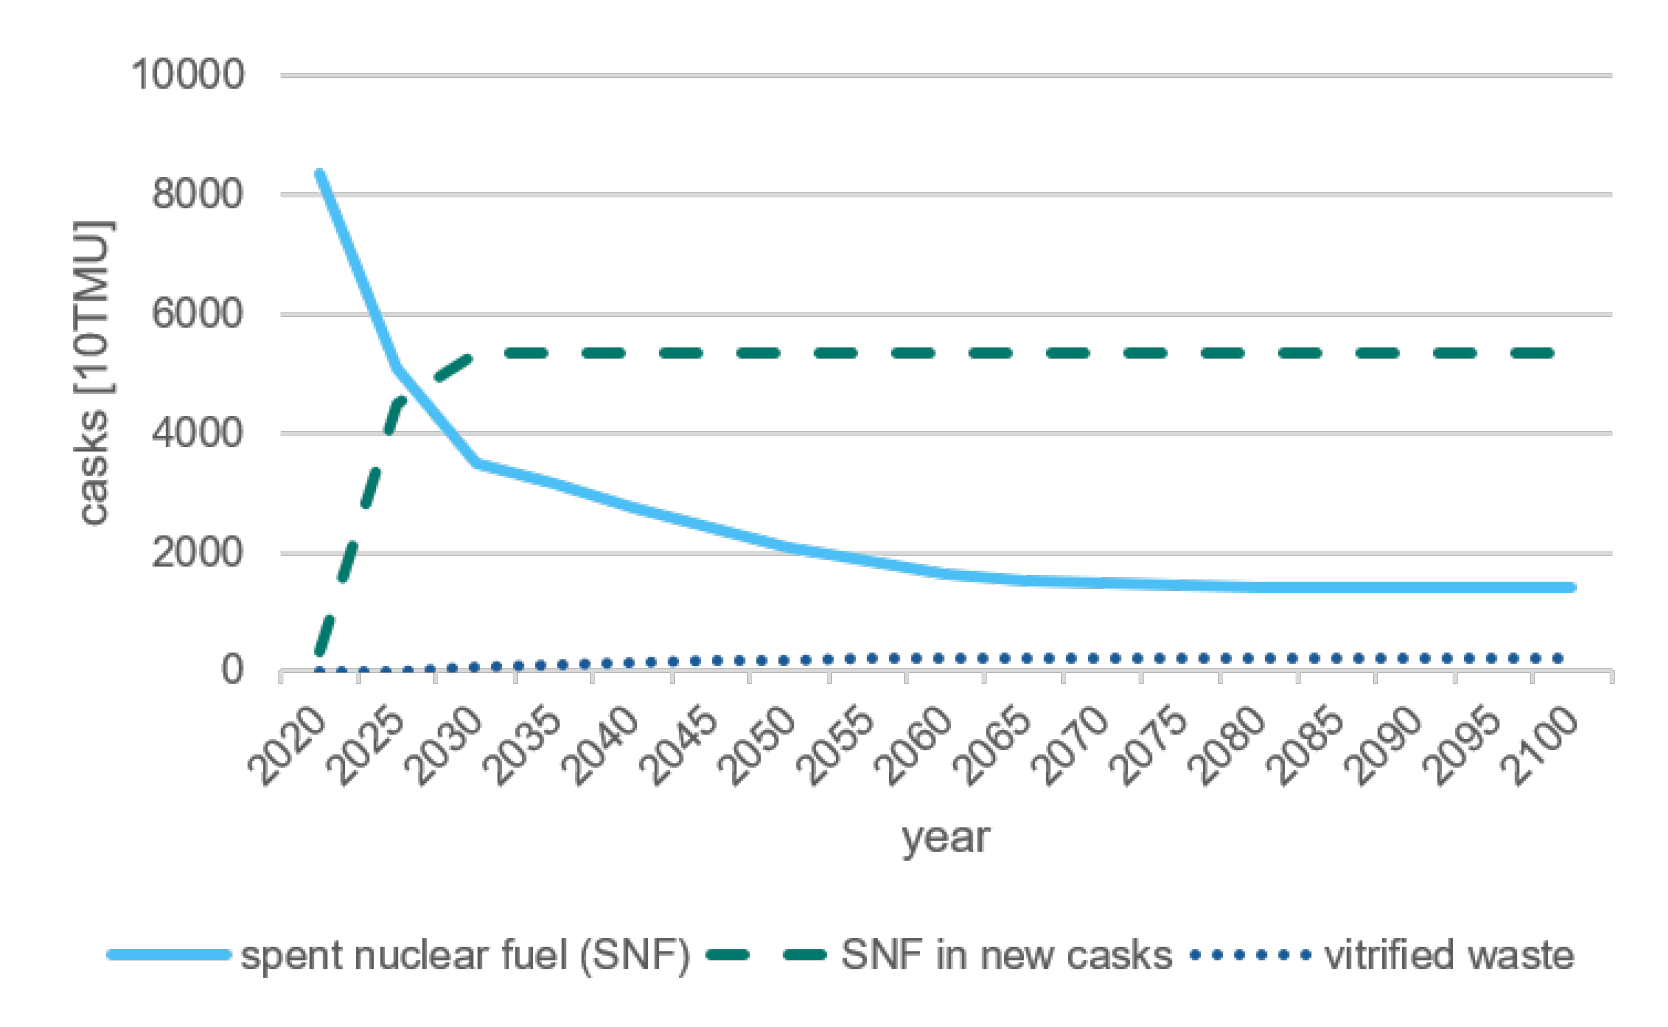
- First of all there was the SNF from the NPPs.
- The second type was waste that has been vitrified, after the original SNF has been reprocessed and thereby its volume has been decreased. It was important to mention that during the vitrification process, the waste has to be refilled into a new cask.
- Likewise, the third type was waste that had simply been refilled into a new cask within a hot cell as the casks containing the suffer from decay. Therefore the HLW had to be refilled into a new cask when the old casks expire after their lifetime.
3.2. Objective Function
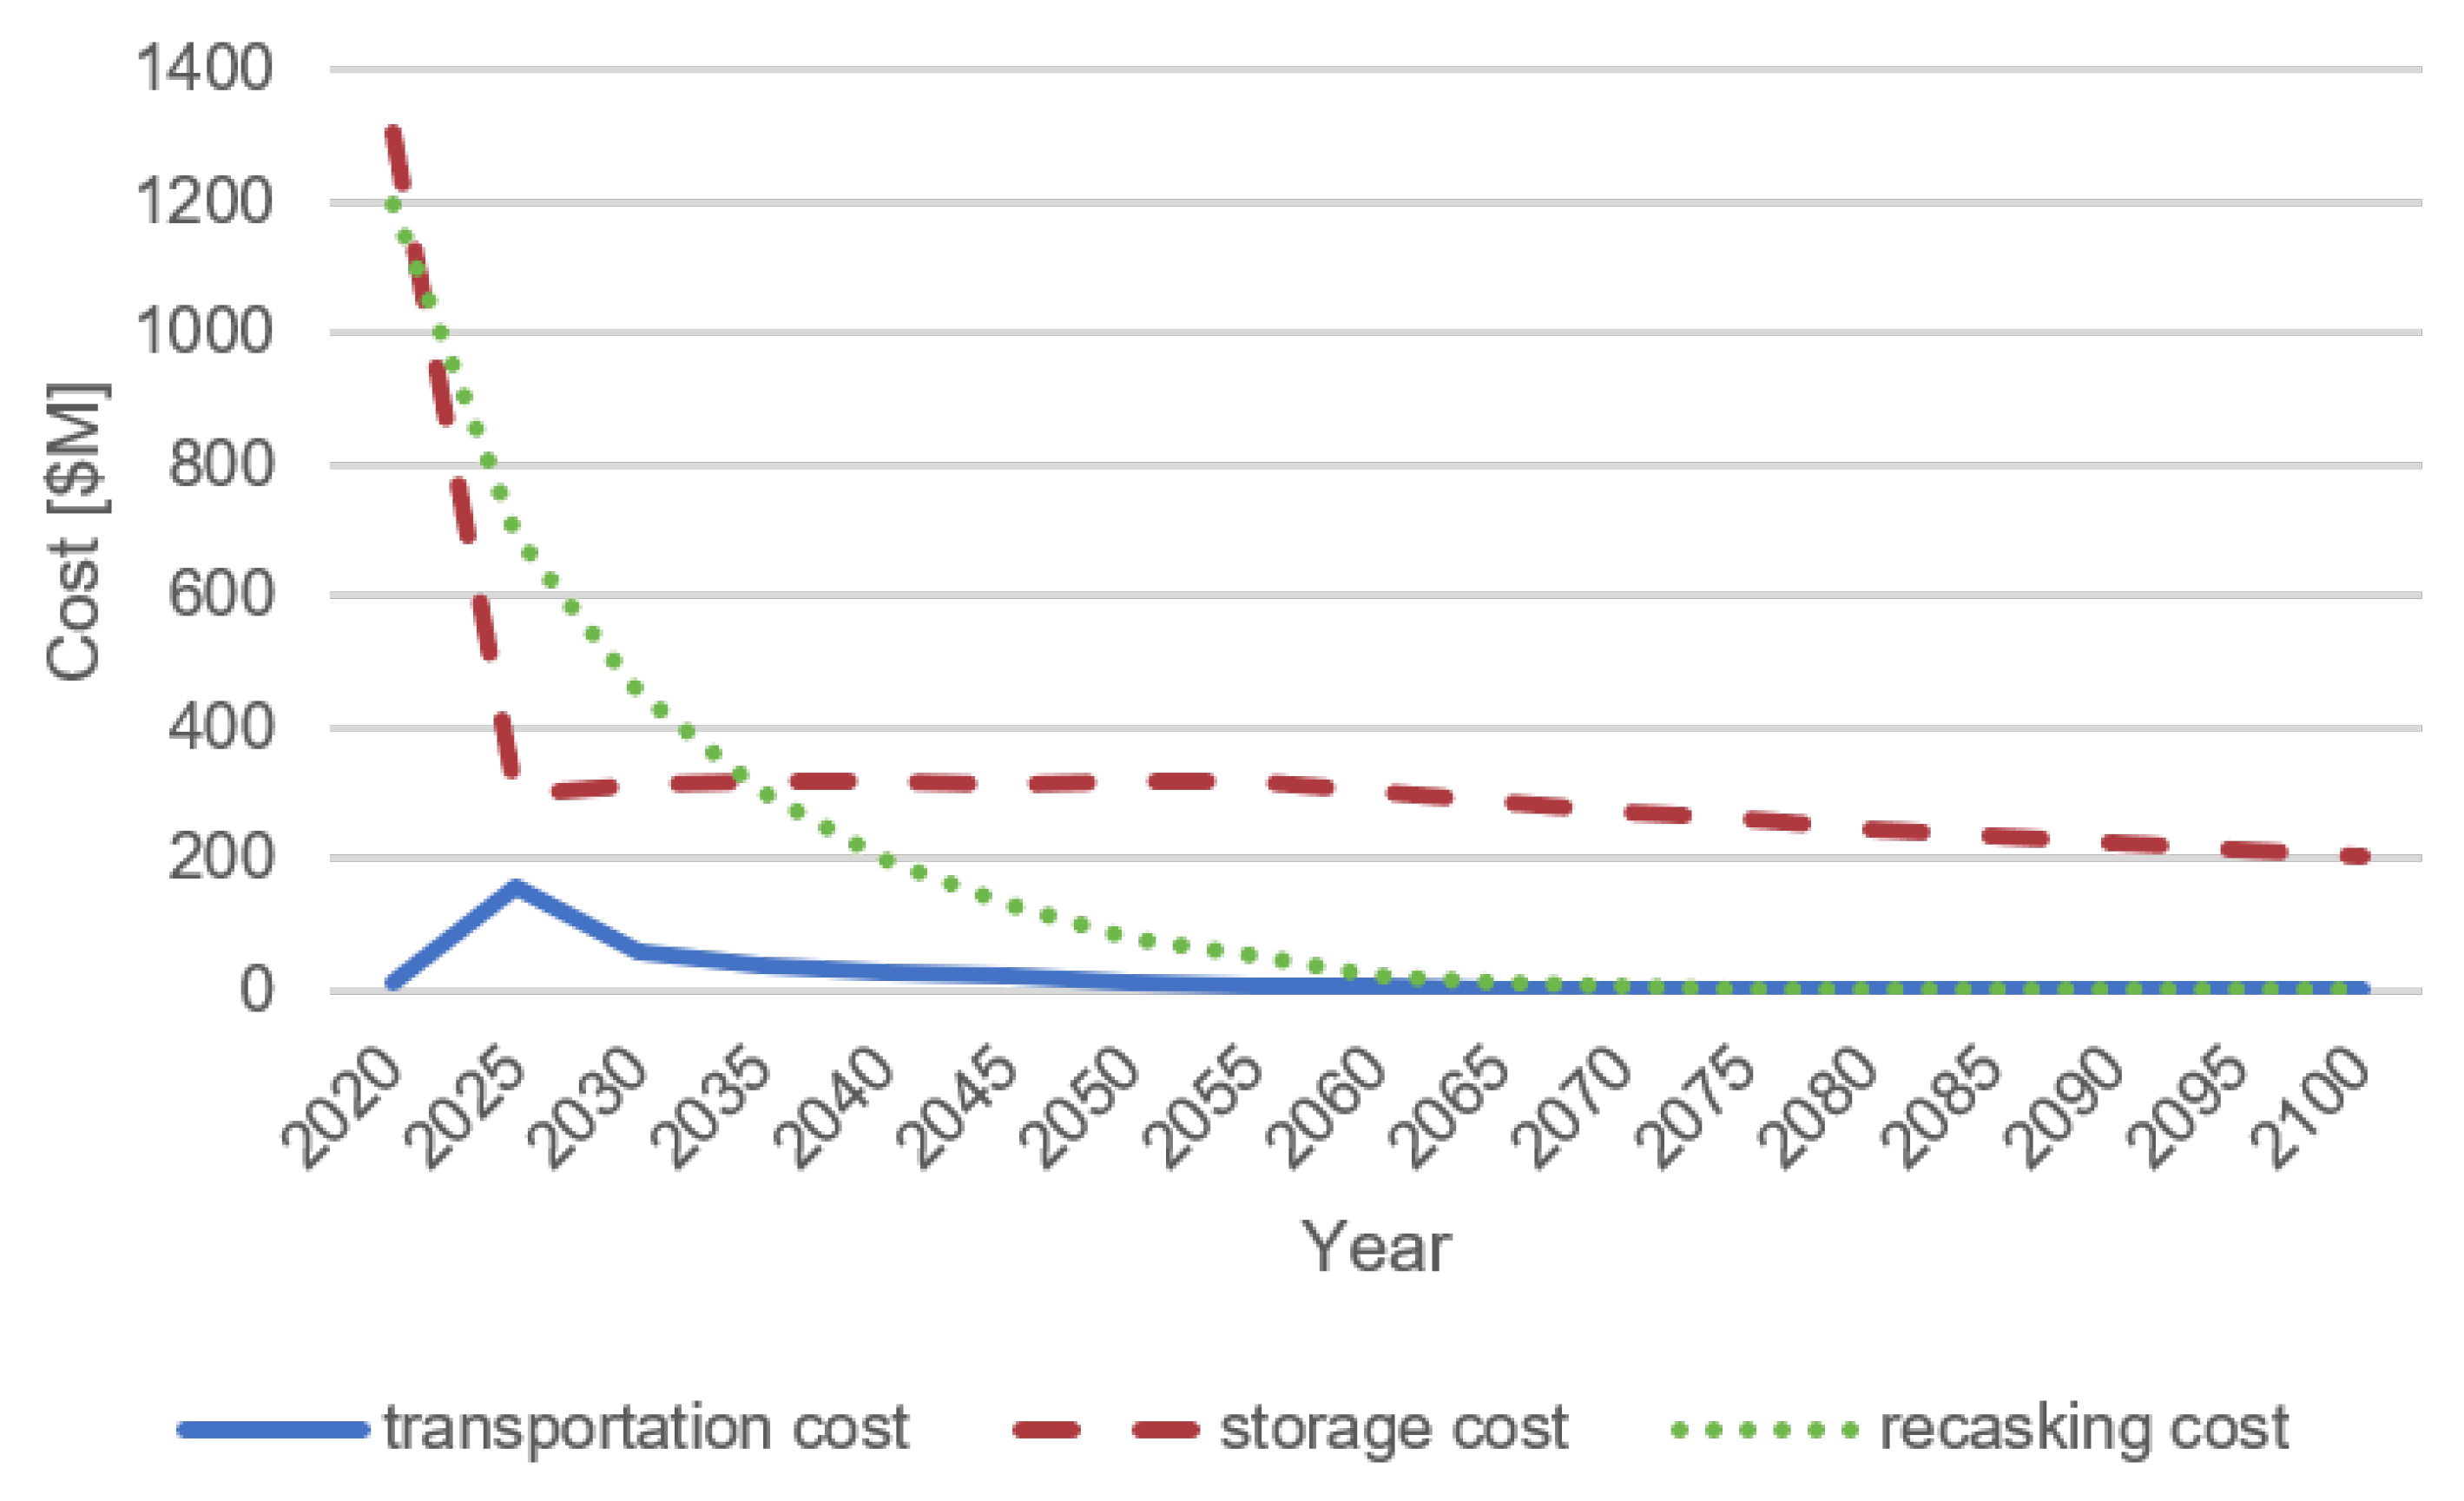
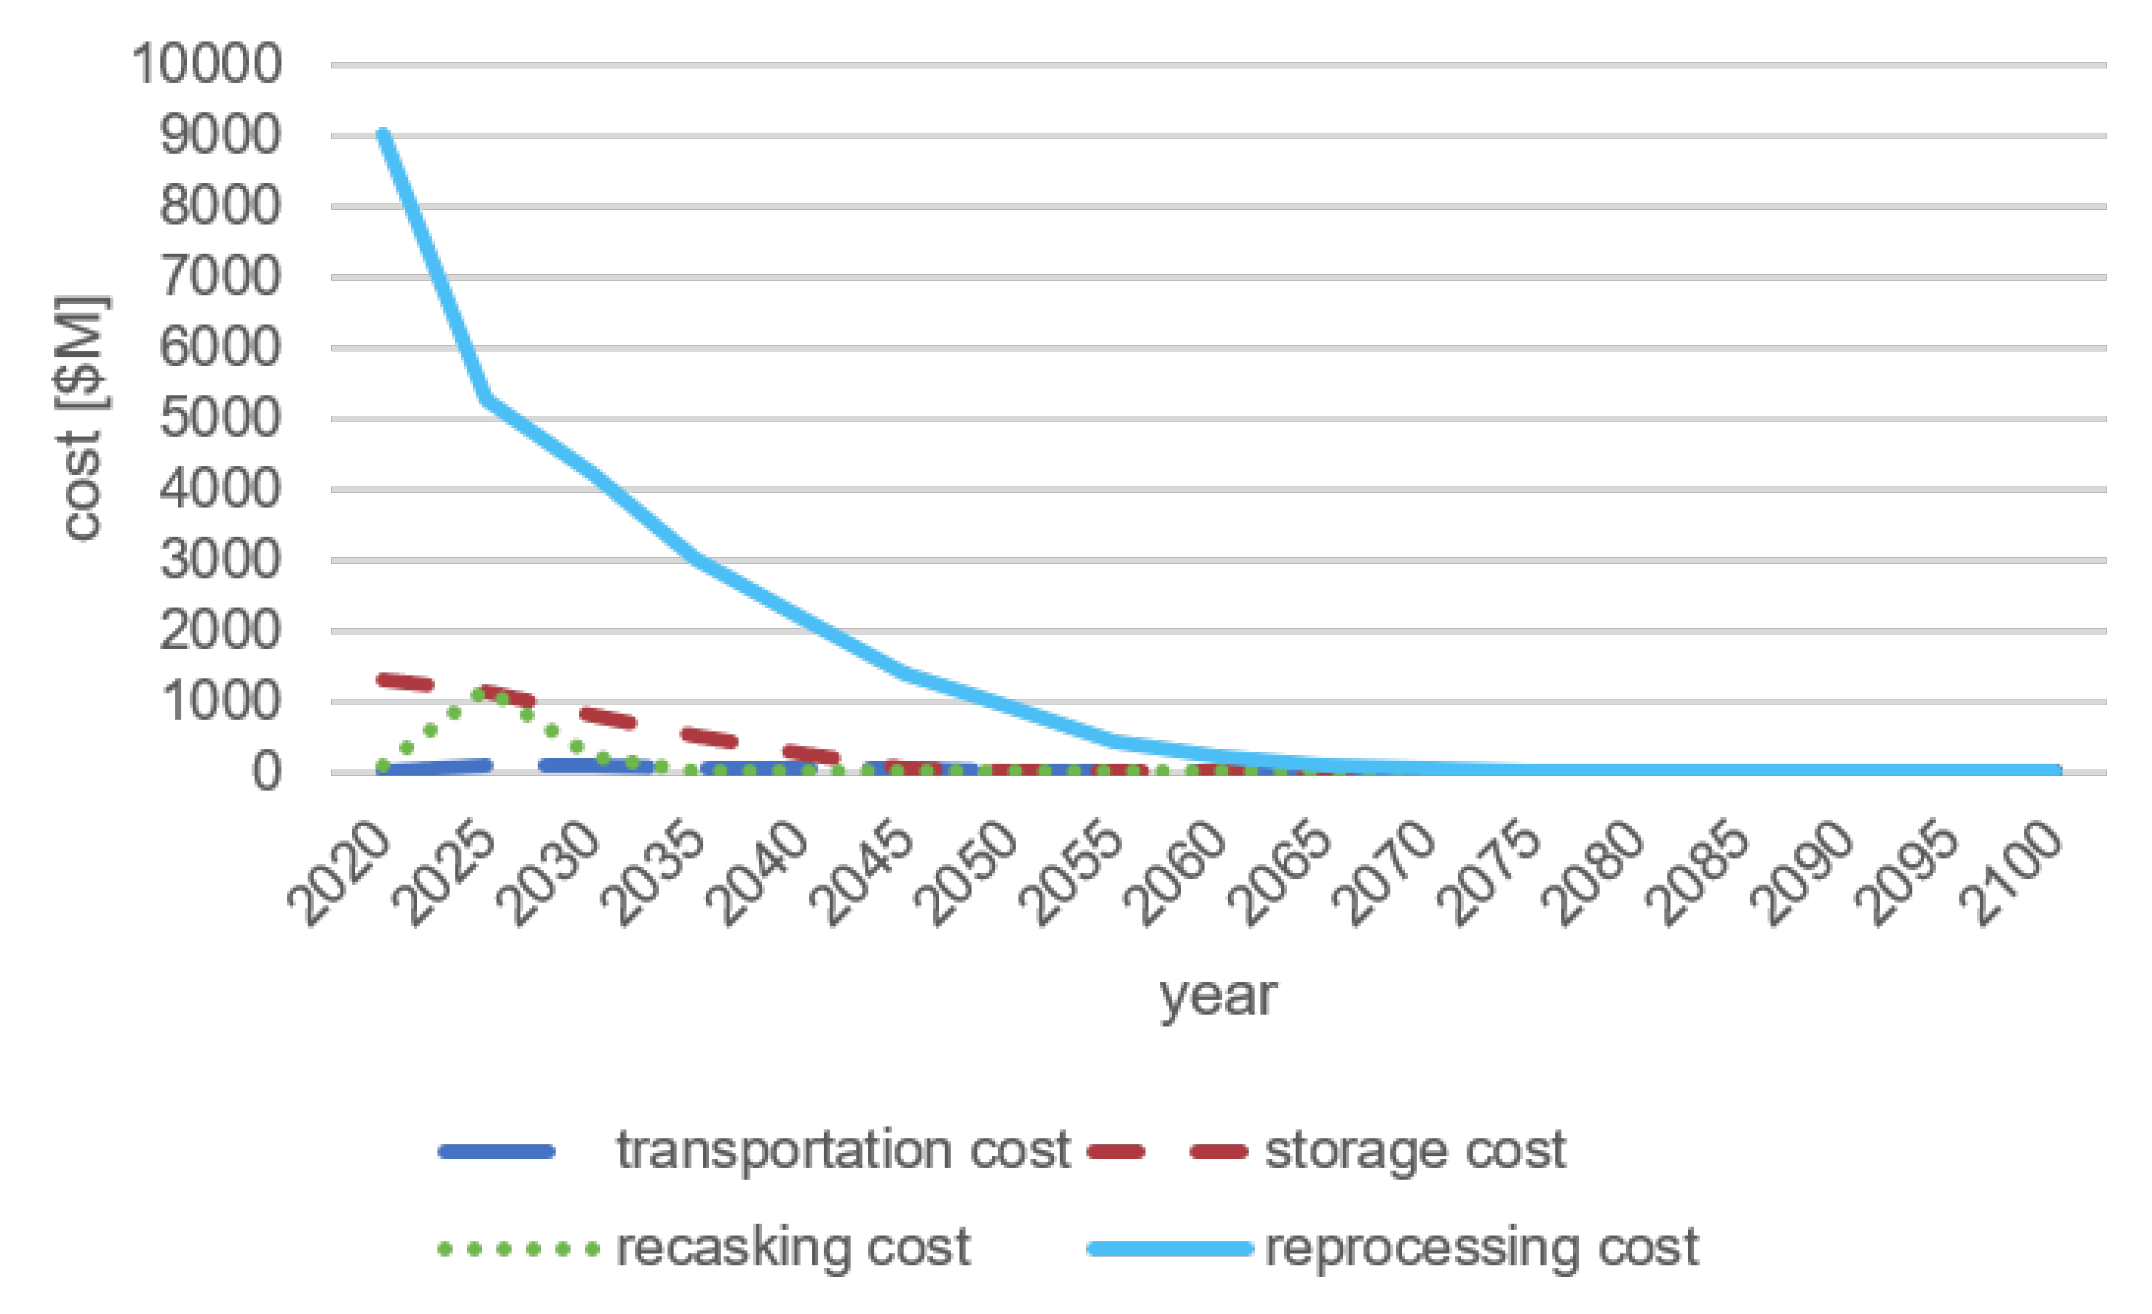
- Transportation costs result from each transport between two nodes n and and therefore depends on the distance , as well as on the transportation type allowed between those two nodes . The transportation cost was calculated cask-wise and did not depend on the different contents such as SNF or vitrified waste, yet each cask caused fixed transportation costs due to loading and unloading as well as variable transportation cost (although in reality only full casks were transported, we assumed that the high number of casks to be transported allowed modeling the number of casks as real numbers for the sake of a linear model).
- The storage cost depended on the amount of casks—independent of their content—stored in a single node per year and further depends on the local storage cost .
- The infrastructure cost refers to the optional cost which are caused by building new CISFs .
- The technology cost were the combination of both vitrification cost as well as cost due to cask decay which will require the waste to be refilled into a new cask . Although both these processes can only be conducted inside the hot cells, which requires further transportation, the technology cost refers only to the technological process.
3.3. Constraints
4. Data
4.1. At Nuclear Power Plants
4.2. Transportation and Processing
4.3. Interim and Final Storage
5. Results and Discussion
5.1. Business as Usual
5.2. Comparison of Scenarios
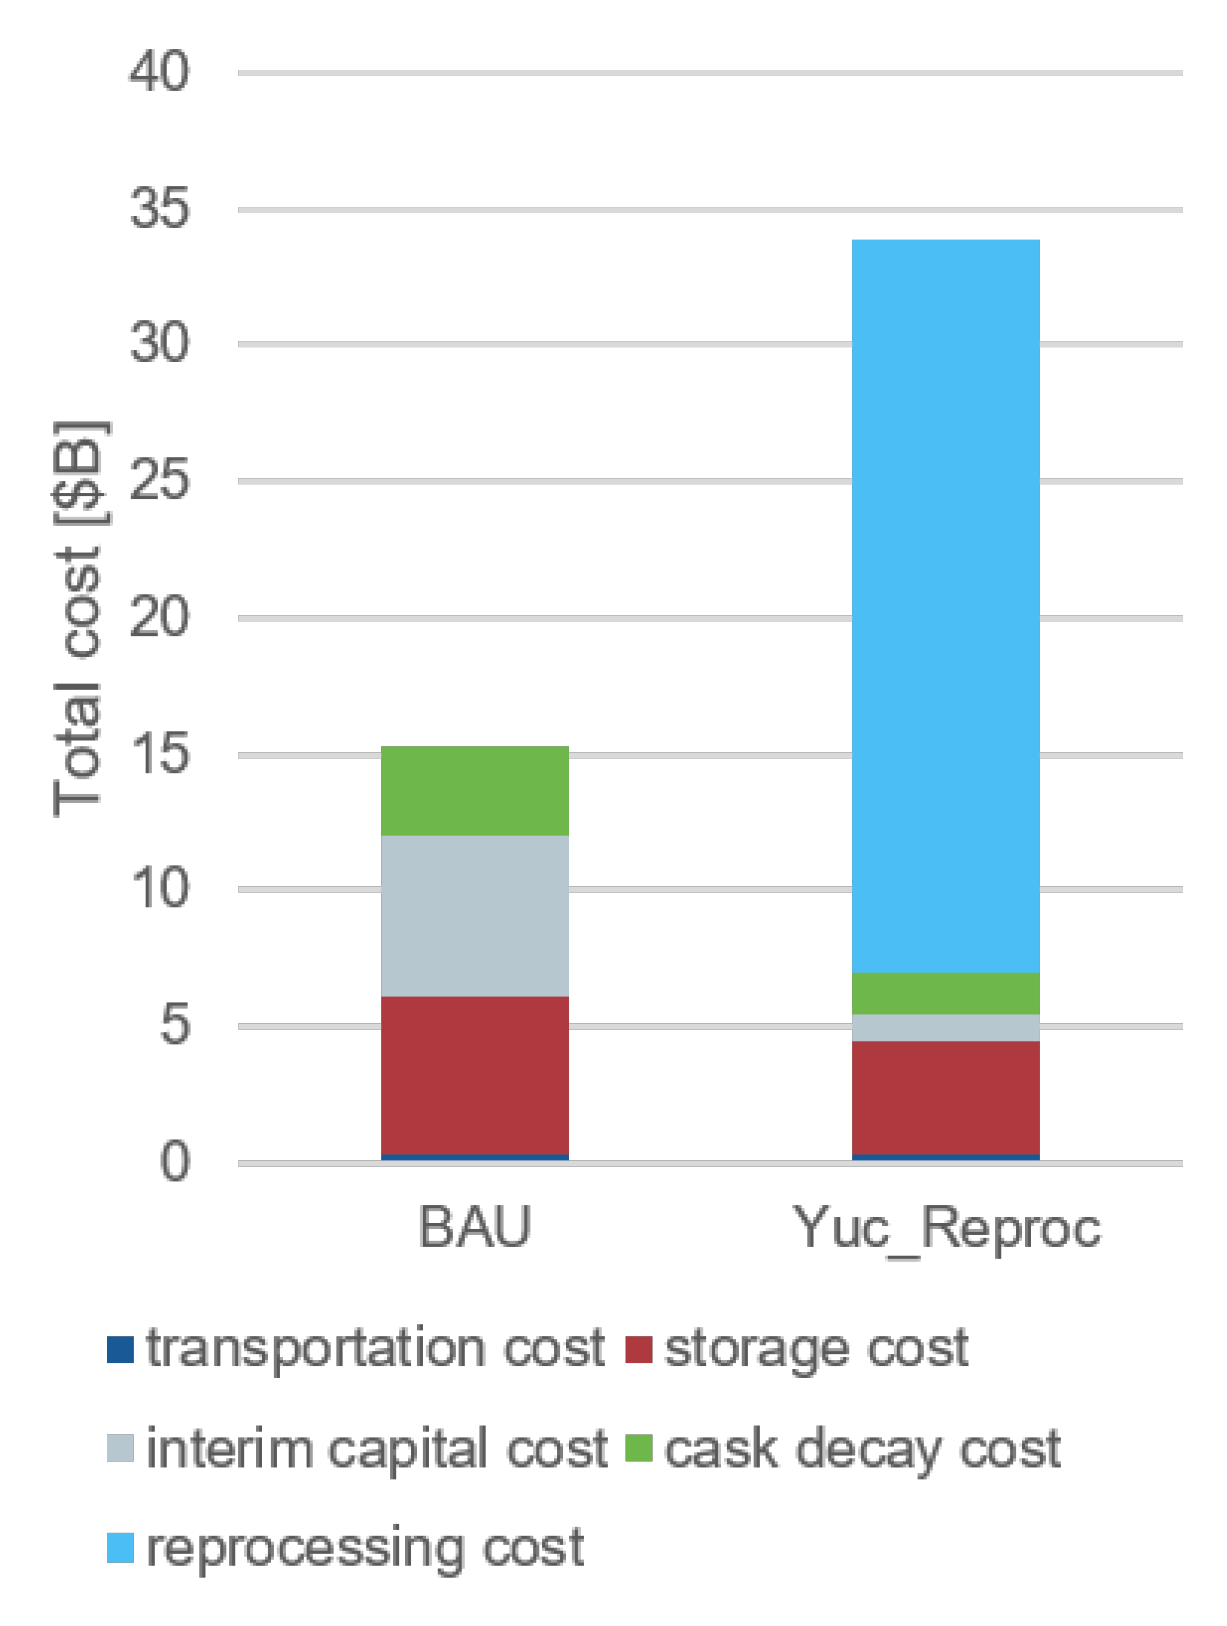
5.3. Reprocessing
6. Conclusions and Policy Implications
Author Contributions
Funding
Acknowledgments
Conflicts of Interest
Abbreviations
| BAU | Business as usual |
| BRC | Blue Ribbon Commission on America’s Nuclear Future |
| CISF | Consolidated interim storage facility |
| DOE | Department of Energy |
| GNEP | Global Nuclear Energy Partnership |
| HLW | High-level waste |
| IAEA | International Atomic Energy Agency |
| ILW | Intermediate-level waste |
| ISFSI | Independent spent fuel storage installations |
| LLW | Low-level waste |
| MIP | Mixed-integer problem |
| NPP | Nuclear power plant |
| NRC | Nuclear Regulatory Commission |
| NWPA | Nuclear Waste Policy Act |
| NWPAA | Nuclear Waste Policy Amendments Act |
| SNF | Spent nuclear fuel |
| WIPP | Waste Isolation Pilot Plant |
Appendix A

| Sets | Description |
| nodes (alias (n, nn)) | |
| potential new intermediate storages (CISF) | |
| reactors | |
| hot cells | |
| years (alias (y, yy)) | |
| nodes transportation types possible | |
| Scalars | Description |
| interest rate due to technological development | |
| cost of refilling HLW into a new cask | |
| vitrification cost per cask of SNF | |
| large number | |
| vitrification capacity per hot cell per year | |
| inverted change of volume decrease due to vitrification | |
| percentage of SNF casks which suffer decay and therefore must be refilled into a new cask | |
| Parameters | Description |
| amount of SNF casks generated at each reactor r in each year y | |
| storage capacity of node n in year y | |
| fixed transport cost of transportation type t | |
| variable transport cost of transportation type t | |
| distance between two nodes n and nn | |
| variable storage cost of node n | |
| fixed construction cost of a new intermediate repository (assumption: all newly to be build intermediate repositories are equally expensive) | |
| binary option whether transportation type t exists between n and nn | |
| binary option whether transportation type ‘rail’ exists between n and nn | |
| binary option whether transportation type ‘road’ exists between n and nn | |
| transportation capacity between n and nn |
| Positive Variables | Description |
| Amount of casks containing SNF transported between node n and node nn in year y | |
| Amount of casks containing either SNF or decommissioned waste—which have been filled into a new cask due to cask decay—transported between n and nn in year y | |
| Amount of casks containing the vitrified waste—remaining after SNF has been reprocessed—transported between n and nn in year y | |
| Amount of casks containing SNF stored in node n in year y | |
| Amount of casks containing either SNF or decommissioned waste—which have been filled into a new cask due to cask decay—stored in node n in year y | |
| Amount of casks containing SNF which has been vitrified—thereby reducing volume—stored in node n in year y | |
| Binary variables | Description |
| Option whether to build a new intermediate repository i in year y | |
| Free variables | Description |
| Decision variable for overall costs |
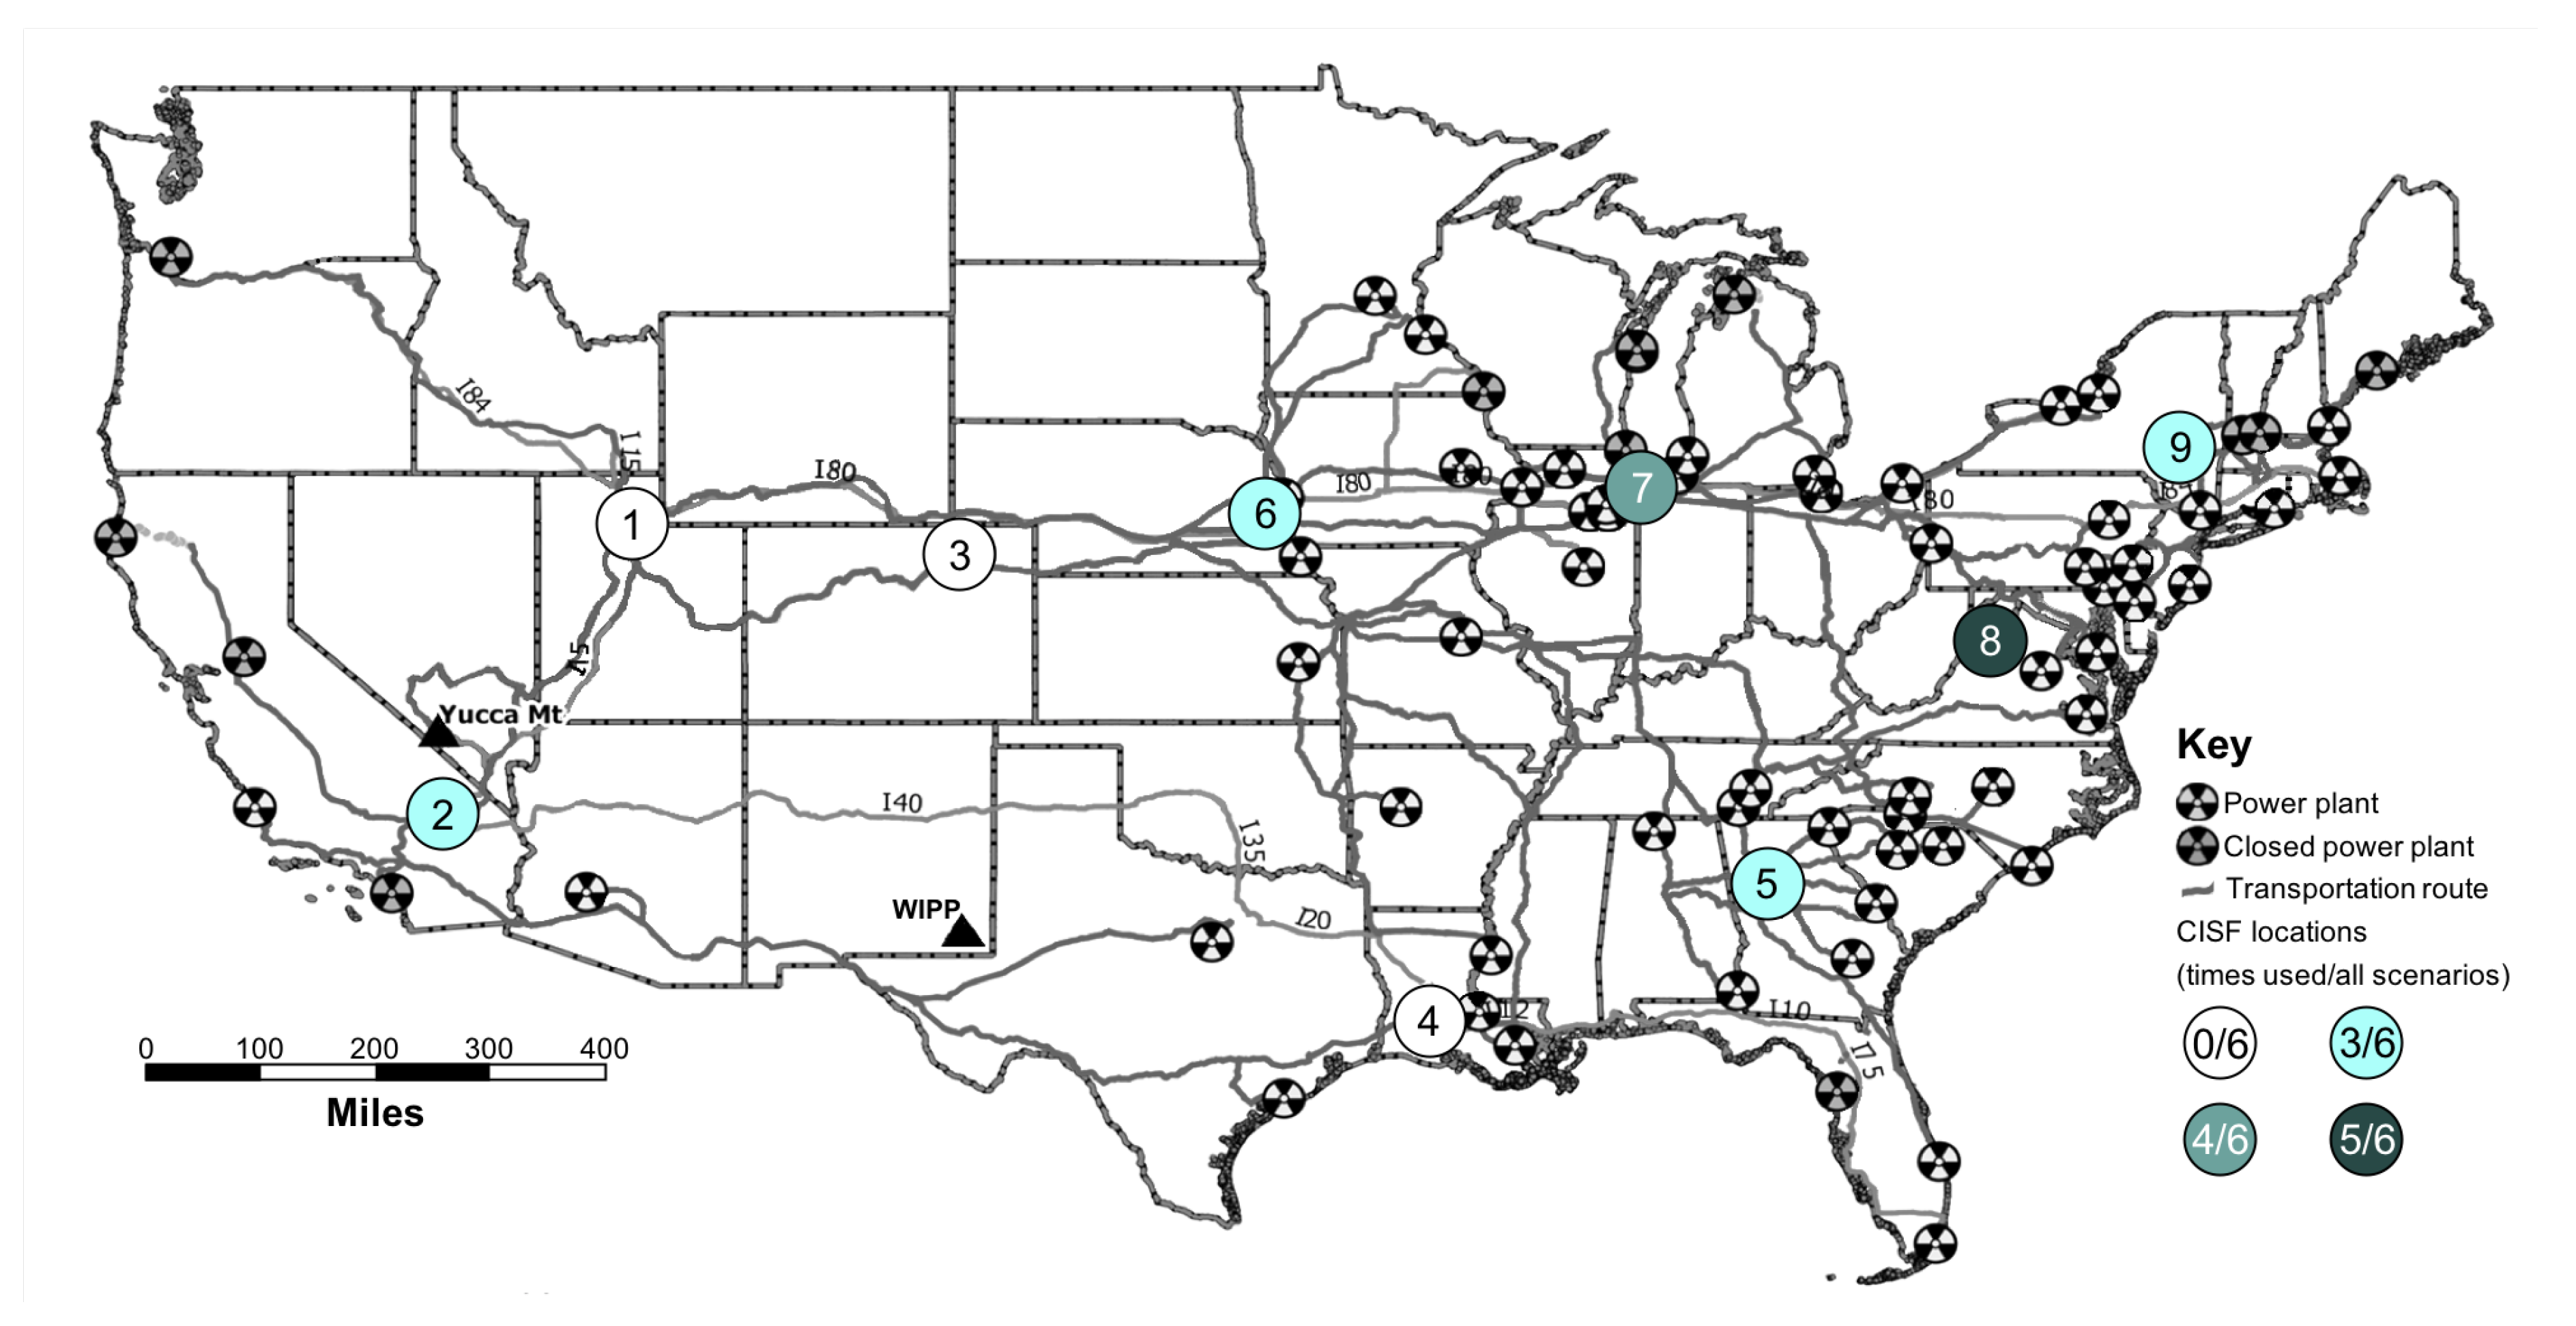
| Interim Storage Facility | Location Coordinates (Latitude, Longitude) | Name |
|---|---|---|
| 1 | 40.57, −112.39 | Grantsville, Utah |
| 2 | 34.81, −117.03 | Barstow, California |
| 3 | 39.75, −104.52 | Watkins, Colorado |
| 4 | 30.25, −92.22 | Rayne, Louisiana |
| 5 | 33.10, −84.08 | Barnesville, Georgia |
| 6 | 41.11, −93.51 | Lucas, Iowa |
| 7 | 41.36, −89.05 | Lasalle, Illinois |
| 8 | 40.16, −77.34 | Newville, Pennsylvania |
| 9 | 42.45, −73.58 | Old Chatham, New York |
References
- Wealer, B.; Czempinski, V.; von Hirschhausen, C.; Wegel, S. Nuclear Energy Policy in the United States: Between Rocks and Hard Places. IAEE Energy Forum Second Quarter 2017, Cleveland, USA. 2017; 67–78. [Google Scholar]
- NRC. Nuclear Regulatory Commission. 2018. Available online: https://www.nrc.gov (accessed on 15 March 2019).
- Sovacool, B.K.; Funk, A. Wrestling with the Hydra of Nuclear Waste Storage in the United States. Electr. J. 2013, 26, 67–78. [Google Scholar] [CrossRef]
- BRC. Blue Ribbon Commission on America’s Nuclear Future: Report to the Secretary of Energy. 2012. Available online: https://energy.gov/sites/prod/files/2013/04/f0/brc_finalreport_jan2012.pdf (accessed on 15 March 2019).
- Jänsch, E.; Möckel, C.; Zalm, J. Rückbau von Atomkraftwerken und Endlagerung Radioaktiver Abfälle in Deutschland—Eine Analyse potenzieller Organisationsmodelle. Seminar Thesis, Technische Universität Berlin, Berlin, Germany, 2016. [Google Scholar]
- North, D.W. Can Sisyphus Succeed? Getting U.S. High-Level Nuclear Waste into a Geological Repository. Risk Anal. 2013, 33, 2–14. [Google Scholar] [CrossRef] [PubMed]
- Fowler, C.S.; Hamby, M.; Rusco, E.; Rusco, M. Native Americans and Yucca Mountain. 1991. Available online: http://www.state.nv.us/nucwaste/library/se-039-91v1.pdf (accessed on 15 March 2019).
- Cochran, T.B.; Paine, C.E.; Fettus, G.; Norris, R.S.; McKinzie, M.G. Position Paper: Commercial Nuclear Power. 2005. Available online: https://fas.org/nuke/norris/power.pdf (accessed on 13 June 2019).
- Alley, W.M.; Alley, R. Too Hot to Touch: The Problem of High-Level Nuclear Waste; Cambridge University Press: Cambridge, UK, 2013. [Google Scholar]
- Rogers, K.A. Fire in the Hole: A Review of National Spent Nuclear Fuel Disposal Policy. Prog. Nuclear Energy 2009, 51, 281–289. [Google Scholar] [CrossRef]
- World Nuclear Association. Radioactive Waste Management. 2017. Available online: http://www.world-nuclear.org/information-library/nuclear-fuel-cycle/nuclear-wastes/radioactive-waste-management.aspx (accessed on 15 March 2019).
- Orszag, P.R. Costs of Reprocessing Versus Directly Disposing of Spent Nuclear Fuel. 2007. Available online: https://www.cbo.gov/sites/default/files/cbofiles/ftpdocs/88xx/doc8808/11-14-nuclearfuel.pdf (accessed on 15 March 2019).
- Högselius, P. Spent nuclear fuel policies in historical perspective: An international comparison. Energy Policy 2009, 37, 254–263. [Google Scholar] [CrossRef]
- Lovins, A.B.; Lovins, L.H.; Ross, L. Nuclear Power and Nuclear Bombs. Foreign Aff. 1980, 58. Available online: https://rmi.org/wp-content/uploads/2017/05/RMI_Document_Repository_Public-Reprts_Nuclear-Power-and-Nuclear-Bombs-Foreign-Affairs.pdf (accessed on 13 June 2019). [CrossRef]
- Jarrell, J.; Joseph, R., III; Howard, R.; Petersen, G.; Cumberland, R.; Nutt, M.; Carter, J.; Cotton, T. Cost Implications of an Interim Storage Facility in the Waste Management System. 2016. Available online: https://energy.gov/sites/prod/files/2017/03/f34/ISF%20Cost%20Implications_final_rev1.pdf (accessed on 15 March 2019).
- Werner, J.D. Spent Nuclear Fuel Storage; Congressional Research Service: Washington, DC, USA, 2012. [Google Scholar]
- NEI. Nuclear Energy Institute. 2018. Available online: https://www.nei.org (accessed on 15 March 2019).
- Schneider, M.; Froggatt, A.; Hazemann, J.; Katsuta, T.; Ramana, M.V.; Rodriguze, J.C.; Rüdinger, A.; Stienne, A. The World Nuclear Industry Status Report 2017; A Mycle Schneider Consulting Project: Paris, France, 2017. [Google Scholar]
- Lovins, A.B. The Economics of a US Civilian Nuclear Phase-Out. Bull. At. Sci. 2013, 69, 44–65. [Google Scholar] [CrossRef]
- Schneider, M.; Froggatt, A.; Hazemann, J.; Fairlie, I.; Katsuta, T.; Maltini, F.; Ramana, M.V. The World Nuclear Industry Status Report 2016; A Mycle Schneider Consulting Project: Paris, France; London, UK, 2016. [Google Scholar]
- Holt, M. Civilian Nuclear Waste Disposal; Congressional Research Service, 2018. Available online: https://www.google.com/url?sa=t&rct=j&q=&esrc=s&source=web&cd=9&ved=2ahUKEwjkltfSv-fiAhUE7aYKHSIKA54QFjAIegQIARAC&url=https%3A%2F%2Ffas.org%2Fsgp%2Fcrs%2Fmisc%2FRL33461.pdf&usg=AOvVaw0gSTd79S2wMfI80_36xiR6 (accessed on 13 June 2019).
- DOE. Department of Energy: Strategy for the Management and Disposal of Used Nuclear Fuel and High-Level Radioactive Waste. 2013. Available online: https://energy.gov/sites/prod/files/2013%201-15%20Nuclear_Waste_Report.pdf (accessed on 15 March 2019).
- Schaffer, M.B. Toward a viable nuclear waste disposal program. Energy Policy 2011, 39, 1382–1388. [Google Scholar] [CrossRef]
- Brunnengräber, A.; Di Nucci, M.; Isidoro Losada, A.; Mez, L.; Schreurs, M.E. Nuclear Waste Governance: An International Comparison; Springer: Berlin, Germany, 2015. [Google Scholar]
- Ramana, M.V. Shifting strategies and precarious progress: Nuclear waste management in Canada. Energy Policy 2013, 61, 196–206. [Google Scholar] [CrossRef]
- Neumann, W. Nuclear Waste Management in the European Union: Growing Volumes and No Solution; Intac, The Greens/EFA in the European Parliament: Hannover, Germany, 2010. [Google Scholar]
- Scherwath, T.; Wealer, B.; Mendelevitch, R. Nuclear Decommissioning after the German Nuclear Phase-Out An. Integrated View on New Regulations and Nuclear Logistics; DIW Discussion Paper; DIW: Berlin, Germany, 2019; p. 1779. [Google Scholar]
- Sanders, M.C.; Sanders, C.E. A world’s dilemma ‘upon which the sun never sets’—The nuclear waste management strategy (part I): Western European Nation States and the United States of America. Prog. Nuclear Energy 2016, 90, 69–97. [Google Scholar] [CrossRef]
- Kessides, I.N. Nuclear power: Understanding the economic risks and uncertainties. Energy Policy 2010, 38, 3849–3864. [Google Scholar] [CrossRef]
- Borges Silverio, L.; Lamas, W.D.Q. An Analysis of Development and Research on Spent Nuclear Fuel Reprocessing. Energy Policy 2011, 39, 281–289. [Google Scholar] [CrossRef]
- Briggs, T.; Kunsch, P.; Mareschal, B. Nuclear waste management: An application of the multicriteria PROMETHEE methods. Eur. J. Oper. Res. 1990, 44, 1–10. [Google Scholar] [CrossRef]
- Miaou, S.P.; Chin, S.M. Computing k-shortest path for nuclear spent fuel highway transportation. Eur. J. Oper. Res. 1991, 53, 64–80. [Google Scholar] [CrossRef]
- NRC. Nuclear Regulatory Commission: Final Generic Environmental Impact Statement on Handling and Storage of Spent Light Water Power Reactor Fuel. 1979. Available online: https://ac.els-cdn.com/S0195925582800097/1-s2.0-S0195925582800097-main.pdf?_tid=63ac58e8-042f-11e8-b0bc-00000aab0f02&acdnat=1517146402_22e7964e79c81b40fb1a9186eef181f0 (accessed on 15 March 2019).
- Kudryavtsev, E. Storage of Spent Nuclear Fuel. 2014. Available online: http://www-pub.iaea.org/MTCD/Meetings/PDFplus/2014/cn219/Presentations/12EKudryavtsev.pdf (accessed on 15 March 2019).
- Clemmer, S.; Richardson, J.; Sattler, S.; Lochbaum, D. The Nuclear Power Dilemma: Declining Profits, Plant Closures, and the Threat of Rising Carbon Emissions; Union of Concerned Scientists: Cambridge, MA, USA, 2018. [Google Scholar]
- Rachow, J.W. The Growing Problem of Spent Nuclear Fuel. 2012. Available online: http://www.psr.org/environment-and-health/environmental-health-policy-institute/responses/the-growing-problem-of-spent-nuclear-fuel.html (accessed on 28 January 2018).
- Eureka County Yucca Mountain Information Office. 2018. Available online: http://www.yuccamountain.org/index.htm (accessed on 15 March 2019).
- Feizollahi, F.; Shropshire, D.; Burton, D. Waste Management Facilities Cost Information for Transportation of Radioactive and Hazardous Materials. 1995. Available online: http://www.iaea.org/inis/collection/NCLCollectionStore/_Public/27/031/27031625.pdf (accessed on 15 March 2019).
- Bunn, M.; Fetter, S.; Holdren, J.P.; van der Zwaan, B. The Economics of Reprocessing versus Direct Disposal of Spent Nuclear Fuel. 2003. Available online: https://dash.harvard.edu/bitstream/handle/1/30209100/Bunn_The_Economics_of_Reprocessing_vs_Direct_Disposal_of_Spent_Nuclear_Fuel.pdf?sequence=1 (accessed on 15 March 2019).
- Aubert, G.; Billes-Garabedian, L.; Barracco, T.; Peters, R.; Seshadri, P. Economic Assesment of Used Nuclear Fuel Management in the United States. 2006. Available online: https://www.bcg.com/publications/2006/energy-environment-economic-assessment-used-nuclear-fuel.aspx (accessed on 15 March 2019).


| Scenarios | Final Repository | Need to Store all Waste in Yucca Mountain | |||
|---|---|---|---|---|---|
| Opening of Yucca Mountain | Opening of Second Final Repository | ||||
| 2030 | 2060 | 2030 | 2060 | ||
| BAU | |||||
| Yuc_2030 | ✓ | ||||
| Yuc_2060 | ✓ | ||||
| Yuc+_2030 | ✓ | ✓ | |||
| Yuc+_2060 | ✓ | ✓ | |||
| Yuc_reproc | ✓ | ✓ | |||
| Distance | Price Rail | Price Road |
|---|---|---|
| <200 miles | $20.5 per mile | $47.82 per mile |
| 200–1000 miles | $12.7 per mile | $16.70 per mile |
| >1000 miles | $10.3 per mile | $14.37 per mile |
| Scenarios | BAU | Yuc_2030 | Yuc_2060 | Yuc_2030+ | Yuc_2060+ | Yuc_reproc |
|---|---|---|---|---|---|---|
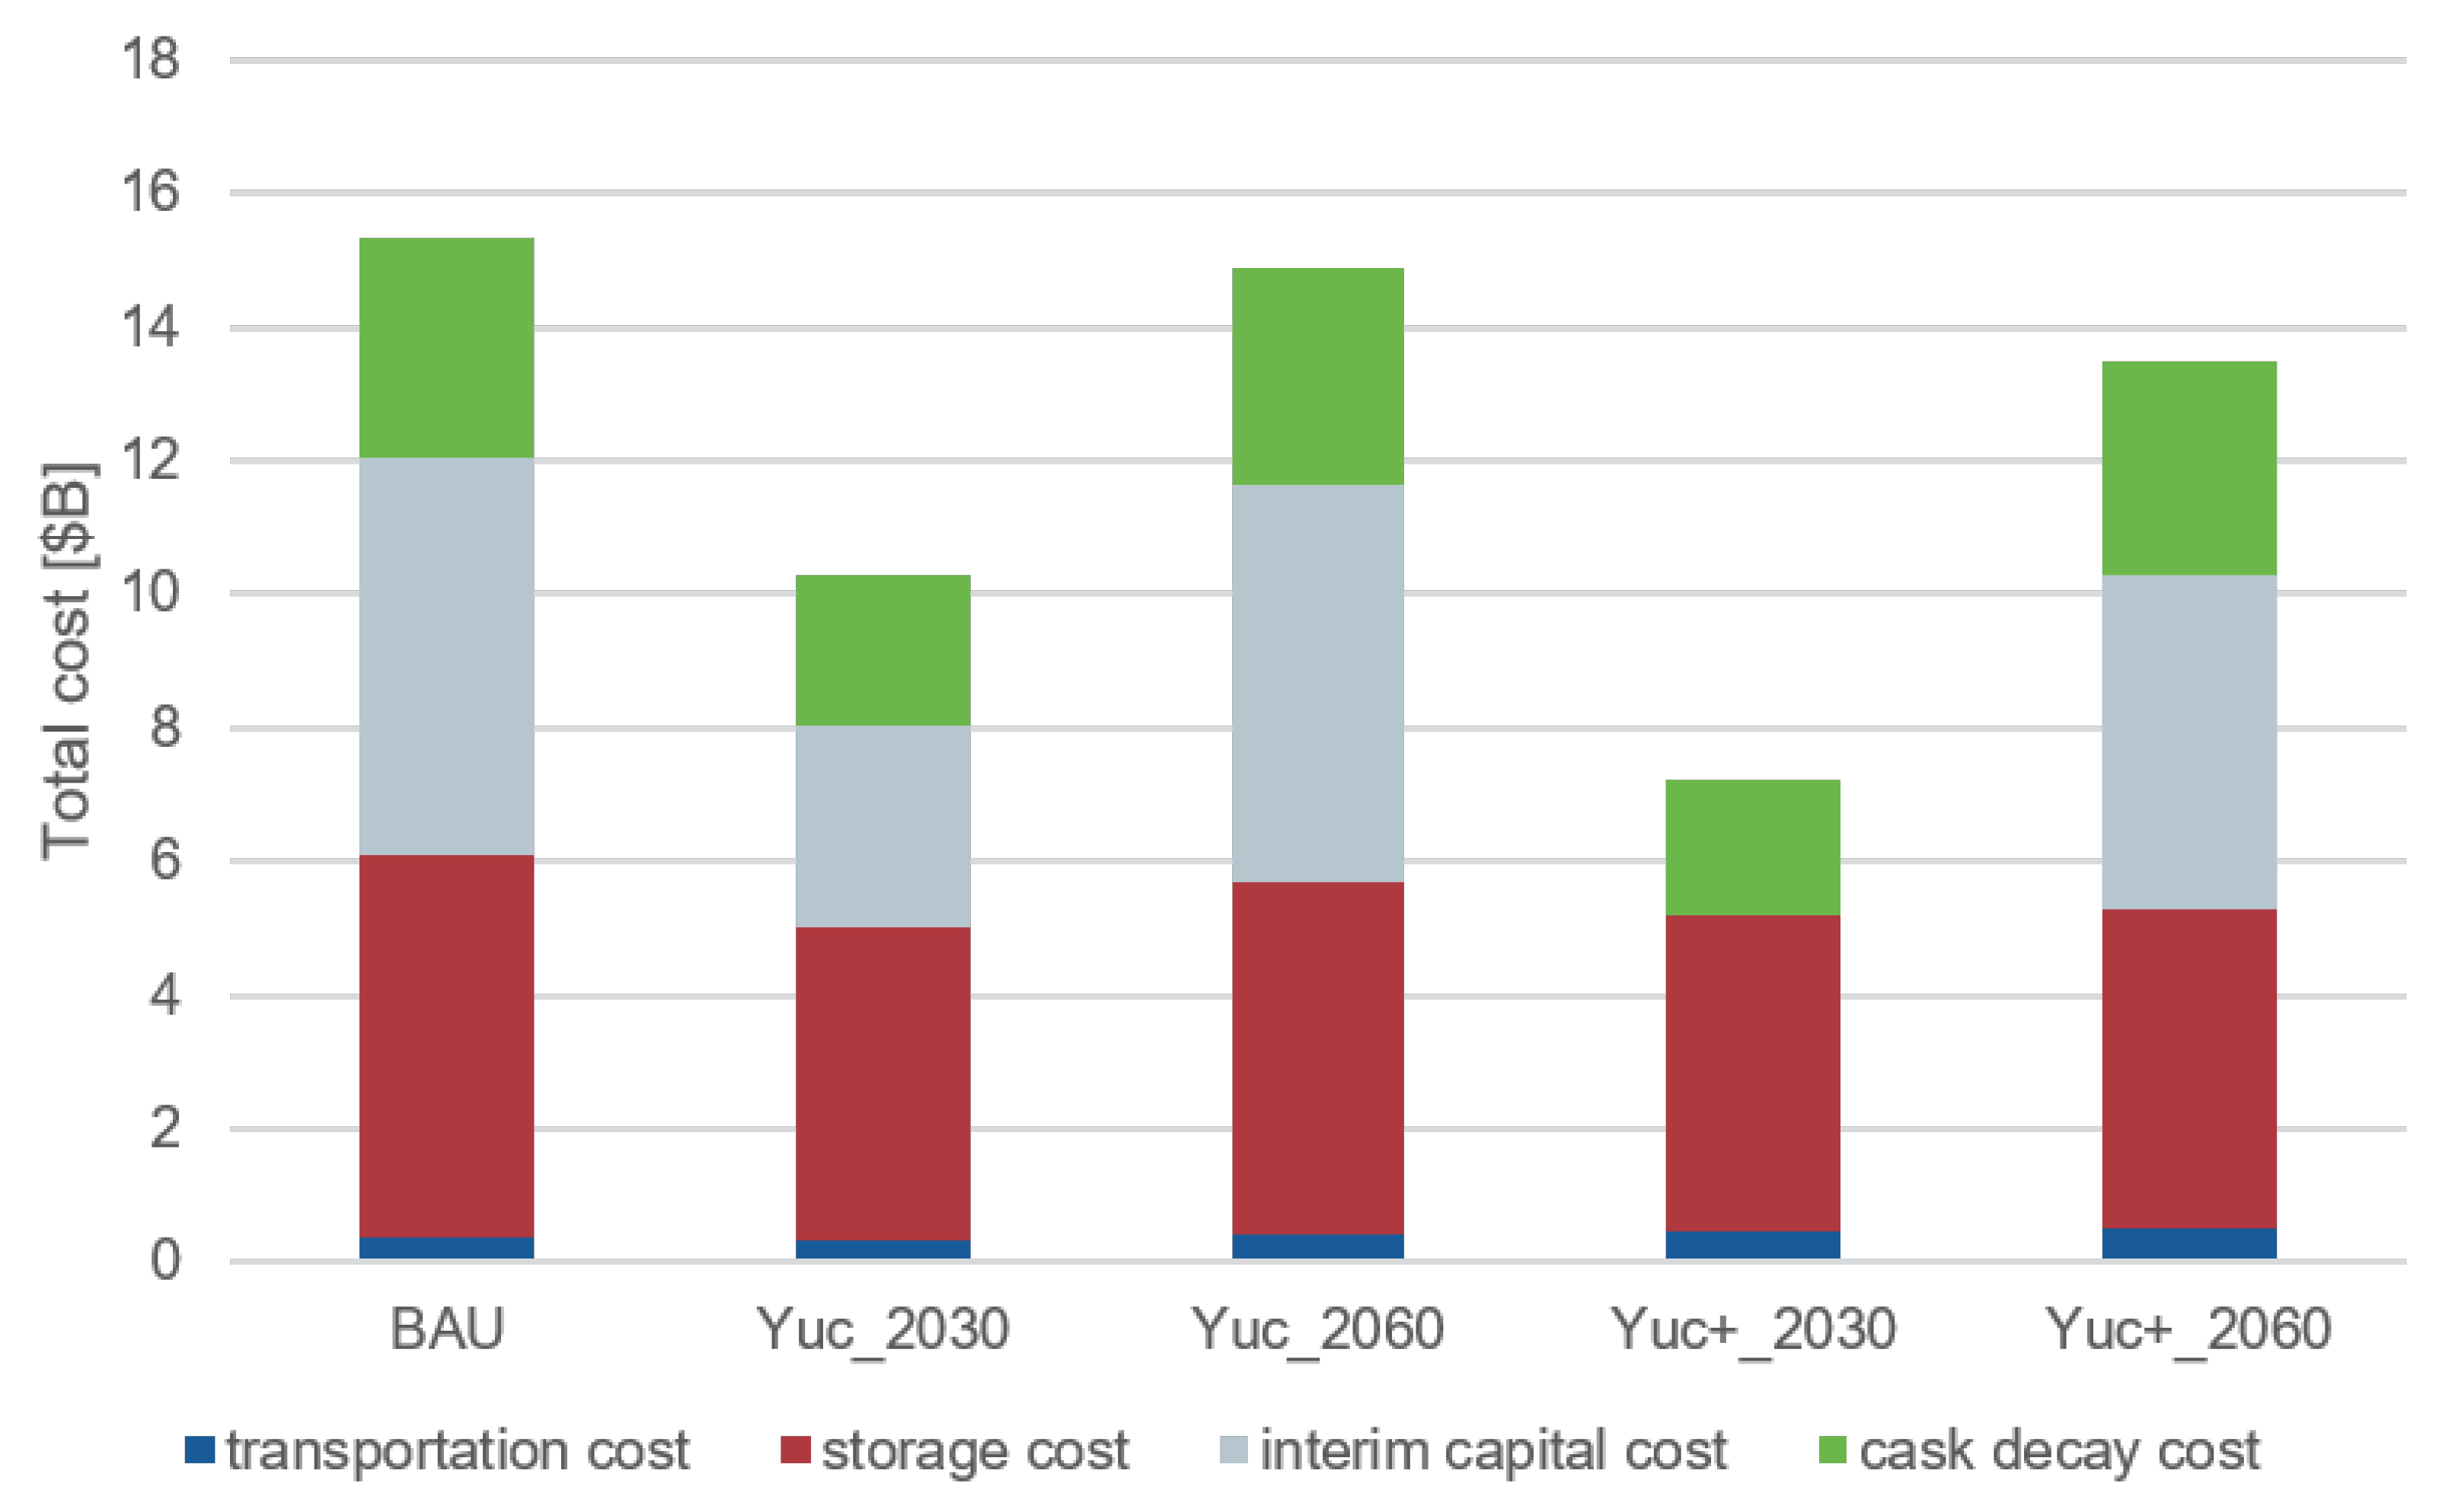
| Total costs [$B] in 80 years | 15.3 | 10.3 | 15 | 7.2 | 13.5 | 33.8 |
| Number of CISF built (needed capacity [MTU]) | 6 (120,000) | 3 (60,000) | 6 (120,000) | none | 5 (100,000) | 1 (20,000) |
| Number of CISF that can be shut down (after how many years) | none | none | 3 (65, 70, 80 years) | none | 5 (45, 50, 50, 55, 60 years) | 1 (80 years) |
| Locations of CISF (see Figure 6) | 2, 5, 6, 7, 8, 9 | 7, 8, 9 | 2, 5, 6, 7, 8, 9 | none | 2, 5, 6, 7, 8 | 8 |
| After how many years can the last ISFSI be closed? | never | 25 years | 60 years | 30 years | 40 years | 25 years |
| Percentage of casks that must be refilled | 100% | 66% | 100% | 59% | 98% | 2% |
| Overall amount of HLW in 2100 [MTU] | 124,000 | 124,000 | 124,000 | 124,000 | 124,000 | 70,000 |
© 2019 by the authors. Licensee MDPI, Basel, Switzerland. This article is an open access article distributed under the terms and conditions of the Creative Commons Attribution (CC BY) license (http://creativecommons.org/licenses/by/4.0/).
Share and Cite
Wegel, S.; Czempinski, V.; Oei, P.-Y.; Wealer, B. Transporting and Storing High-Level Nuclear Waste in the U.S.—Insights from a Mathematical Model. Appl. Sci. 2019, 9, 2437. https://doi.org/10.3390/app9122437
Wegel S, Czempinski V, Oei P-Y, Wealer B. Transporting and Storing High-Level Nuclear Waste in the U.S.—Insights from a Mathematical Model. Applied Sciences. 2019; 9(12):2437. https://doi.org/10.3390/app9122437
Chicago/Turabian StyleWegel, Sebastian, Victoria Czempinski, Pao-Yu Oei, and Ben Wealer. 2019. "Transporting and Storing High-Level Nuclear Waste in the U.S.—Insights from a Mathematical Model" Applied Sciences 9, no. 12: 2437. https://doi.org/10.3390/app9122437
APA StyleWegel, S., Czempinski, V., Oei, P.-Y., & Wealer, B. (2019). Transporting and Storing High-Level Nuclear Waste in the U.S.—Insights from a Mathematical Model. Applied Sciences, 9(12), 2437. https://doi.org/10.3390/app9122437