Article

Wake Flow Characteristics over an Articulated Lorry Model with/without AC-DBD Plasma Actuation

1
Department of Mechanical Engineering Sciences, Faculty of Engineering and Physical Sciences, University of Surrey, Guildford GU2 7XH, UK
2
Department of Aerospace Engineering, Indian Institute of Technology Madras, Chennai 600036, India
3
Division of Aerospace Sciences, School of Engineering, University of Glasgow, Glasgow G12 8QQ, UK
*
Author to whom correspondence should be addressed.
Appl. Sci. 2019, 9(12), 2426; https://doi.org/10.3390/app9122426
Submission received: 1 May 2019 / Revised: 23 May 2019 / Accepted: 10 June 2019 / Published: 14 June 2019
(This article belongs to the Section Mechanical Engineering)

Abstract

:
The wake flow characteristics of a 1:20 scale articulated lorry model with a linear Alternate Current Dielectric Barrier Discharge (AC-DBD) plasma actuation implemented was experimentally investigated. Time-averaged velocity, turbulence, and vorticity information along the centreline of the model were constructed using a two-component particle image velocimetry technique. In addition, force balance was used to measure the time-average drag force acting on the model with and without the use of AC-DBD plasma actuation. In general, the AC-DBD plasma actuation showed negligible effect in changing the drag coefficient of the test model. Moreover, implementing the AC-DBD plasma actuation around the rear end of the trailer model could neither alter the size nor the reverse flow velocity in the wake region. In contrast, the AC-DBD plasma actuation increased the levels of fluctuation in the flow turbulence kinetic energy and vorticity but showed no observable effect to alter the frequency response of the flow in the wake region. It is deduced that the use of AC-DBD plasma actuation indeed generated no flow control effect at the rear end of an articulated lorry trailer.

1. Introduction

Flow separation at the rear end of a square-back trailer contributes to approximately 25% of the overall drag that is encountered by an articulated lorry [1]. A project called <Aerodynamics and Flexible Truck> under the Horizon 2020 framework was recently established by the European Commission attempting to reduce 5 to 10% of fuel consumption in articulated lorries through aerodynamic efficiency improvement [2]. It is anticipated that significant drag reduction and fuel saving could be achieved if flow separation control could be effectively implemented to reduce the size and strength of the wake region downstream of the trailer rear end.
Effective flow separation control over the rear end of square-back articulated lorries could be achieved by installing boat tails [3,4,5,6,7,8] or flaps [9] at the trailer rear end. It was shown that these passive flow control devices could reduce the base drag by approximately 6–11%. However, as the vehicles need to be lengthened in order to accommodate these flow control devices, daily operation of the vehicle becomes illegal if the current legislation regarding the maximum length and width of articulated lorries remain unchanged [10]. Other than boat tails and flaps, flow separation control in articulated lorries using vortex generators have been investigated in several studies [11,12,13,14]. In general, no obvious effects in altering the wake size and drag reduction could be achieved using this passive flow control device on the trailer of an articulated lorry. It is interesting to note that a recent study conducted by Lo and Kontis [11] suggested that the size of the recirculating bubble might be reduced by installing a series of counter-rotating vane-type vortex generators on the roof near the front end of a square-back trailer. However, smoke visualisation images were used to measure the size of the recirculating bubble; therefore, the data shown in [11] should be treated qualitatively.
Flow separation control over square-back articulated lorries using base bleeding has been proven to be effective in several studies [15,16,17,18,19]. Similar to the effects provided by base cavities and flaps, approximately 10% of base drag reduction could be achieved using this active flow control technique. However, implementing this flow control strategy to achieve flow control in square-back articulated lorries is also uncommon. This is because the lorry itself needs to be significantly modified in order to accommodate the bulky and heavy air pump to generate the air jets. In the last decade, a novel active flow control technique known as the Alternate Current Dielectric Barrier Discharge (AC-DBD) plasma actuation was proposed and developed [20,21,22,23,24,25,26,27,28,29]. A linear single dielectric barrier discharge (SDBD) plasma actuator is composed of an embedded ground electrode and an exposed electrode separated by a dielectric material. A potential difference in the range between 10 and 40 kV AC (peak-to-peak) is maintained between the two electrodes which ionised the air adjacent to the exposed electrode. This results in plasma generation, and the flow control effect could be provided by the electromotive wind that is generated by the movement of the ionised air molecules around the exposed electrode. A promising flow control effect using the plasma induced jet has been achieved on inclined flat plates [20], aerofoils [21,22,23,24,25], circular cylinders [26,27], and bluff bodies [28].
In contrast, the effect of flow separation control and drag reduction on the trailer of articulated lorries using the AC-DBD plasma actuation has not yet been well-studied. In fact, to date, only one study on this topic could be found in the literature [29]. The experimental study conducted by Roy et al. [29] using a 1:60 scale articulated lorry model showed some interesting but contradictory results when applying the AC-DBD plasma actuation at the rear end of a square-back trailer model. The authors found that the drag encountered by the lorry model that had the linear AC-DBD plasma actuation being implemented at the trailer rear end was 5.1% higher than that encountered by the baseline trailer [29]. In contrast, 14.8% of drag reduction was achieved when the continuous serpentine AC-DBD plasma actuation was implemented at the rear end of the same trailer model. Since the authors in [29] did not investigate the flow physics downstream of the trailer rear end in both cases, the reasons causing the drag increase when implementing the linear AC-DBD plasma actuation at the rear end of a square-back trailer is unclear. The objective of the present experimental study is to investigate the flow physics along the wake region of a 1:20 scale square-back articulated lorry model, and in particular, to examine the alterations in wake flow field affected by the implementation of AC-DBD plasma actuator at the end of the trailer. Results obtained could provide an insight into the flow pattern along the wake region of such a lorry trailer with and without the linear AC-DBD plasma actuation being implemented. The data shown could also be used for validating Computational Fluid Dynamics (CFD) codes.

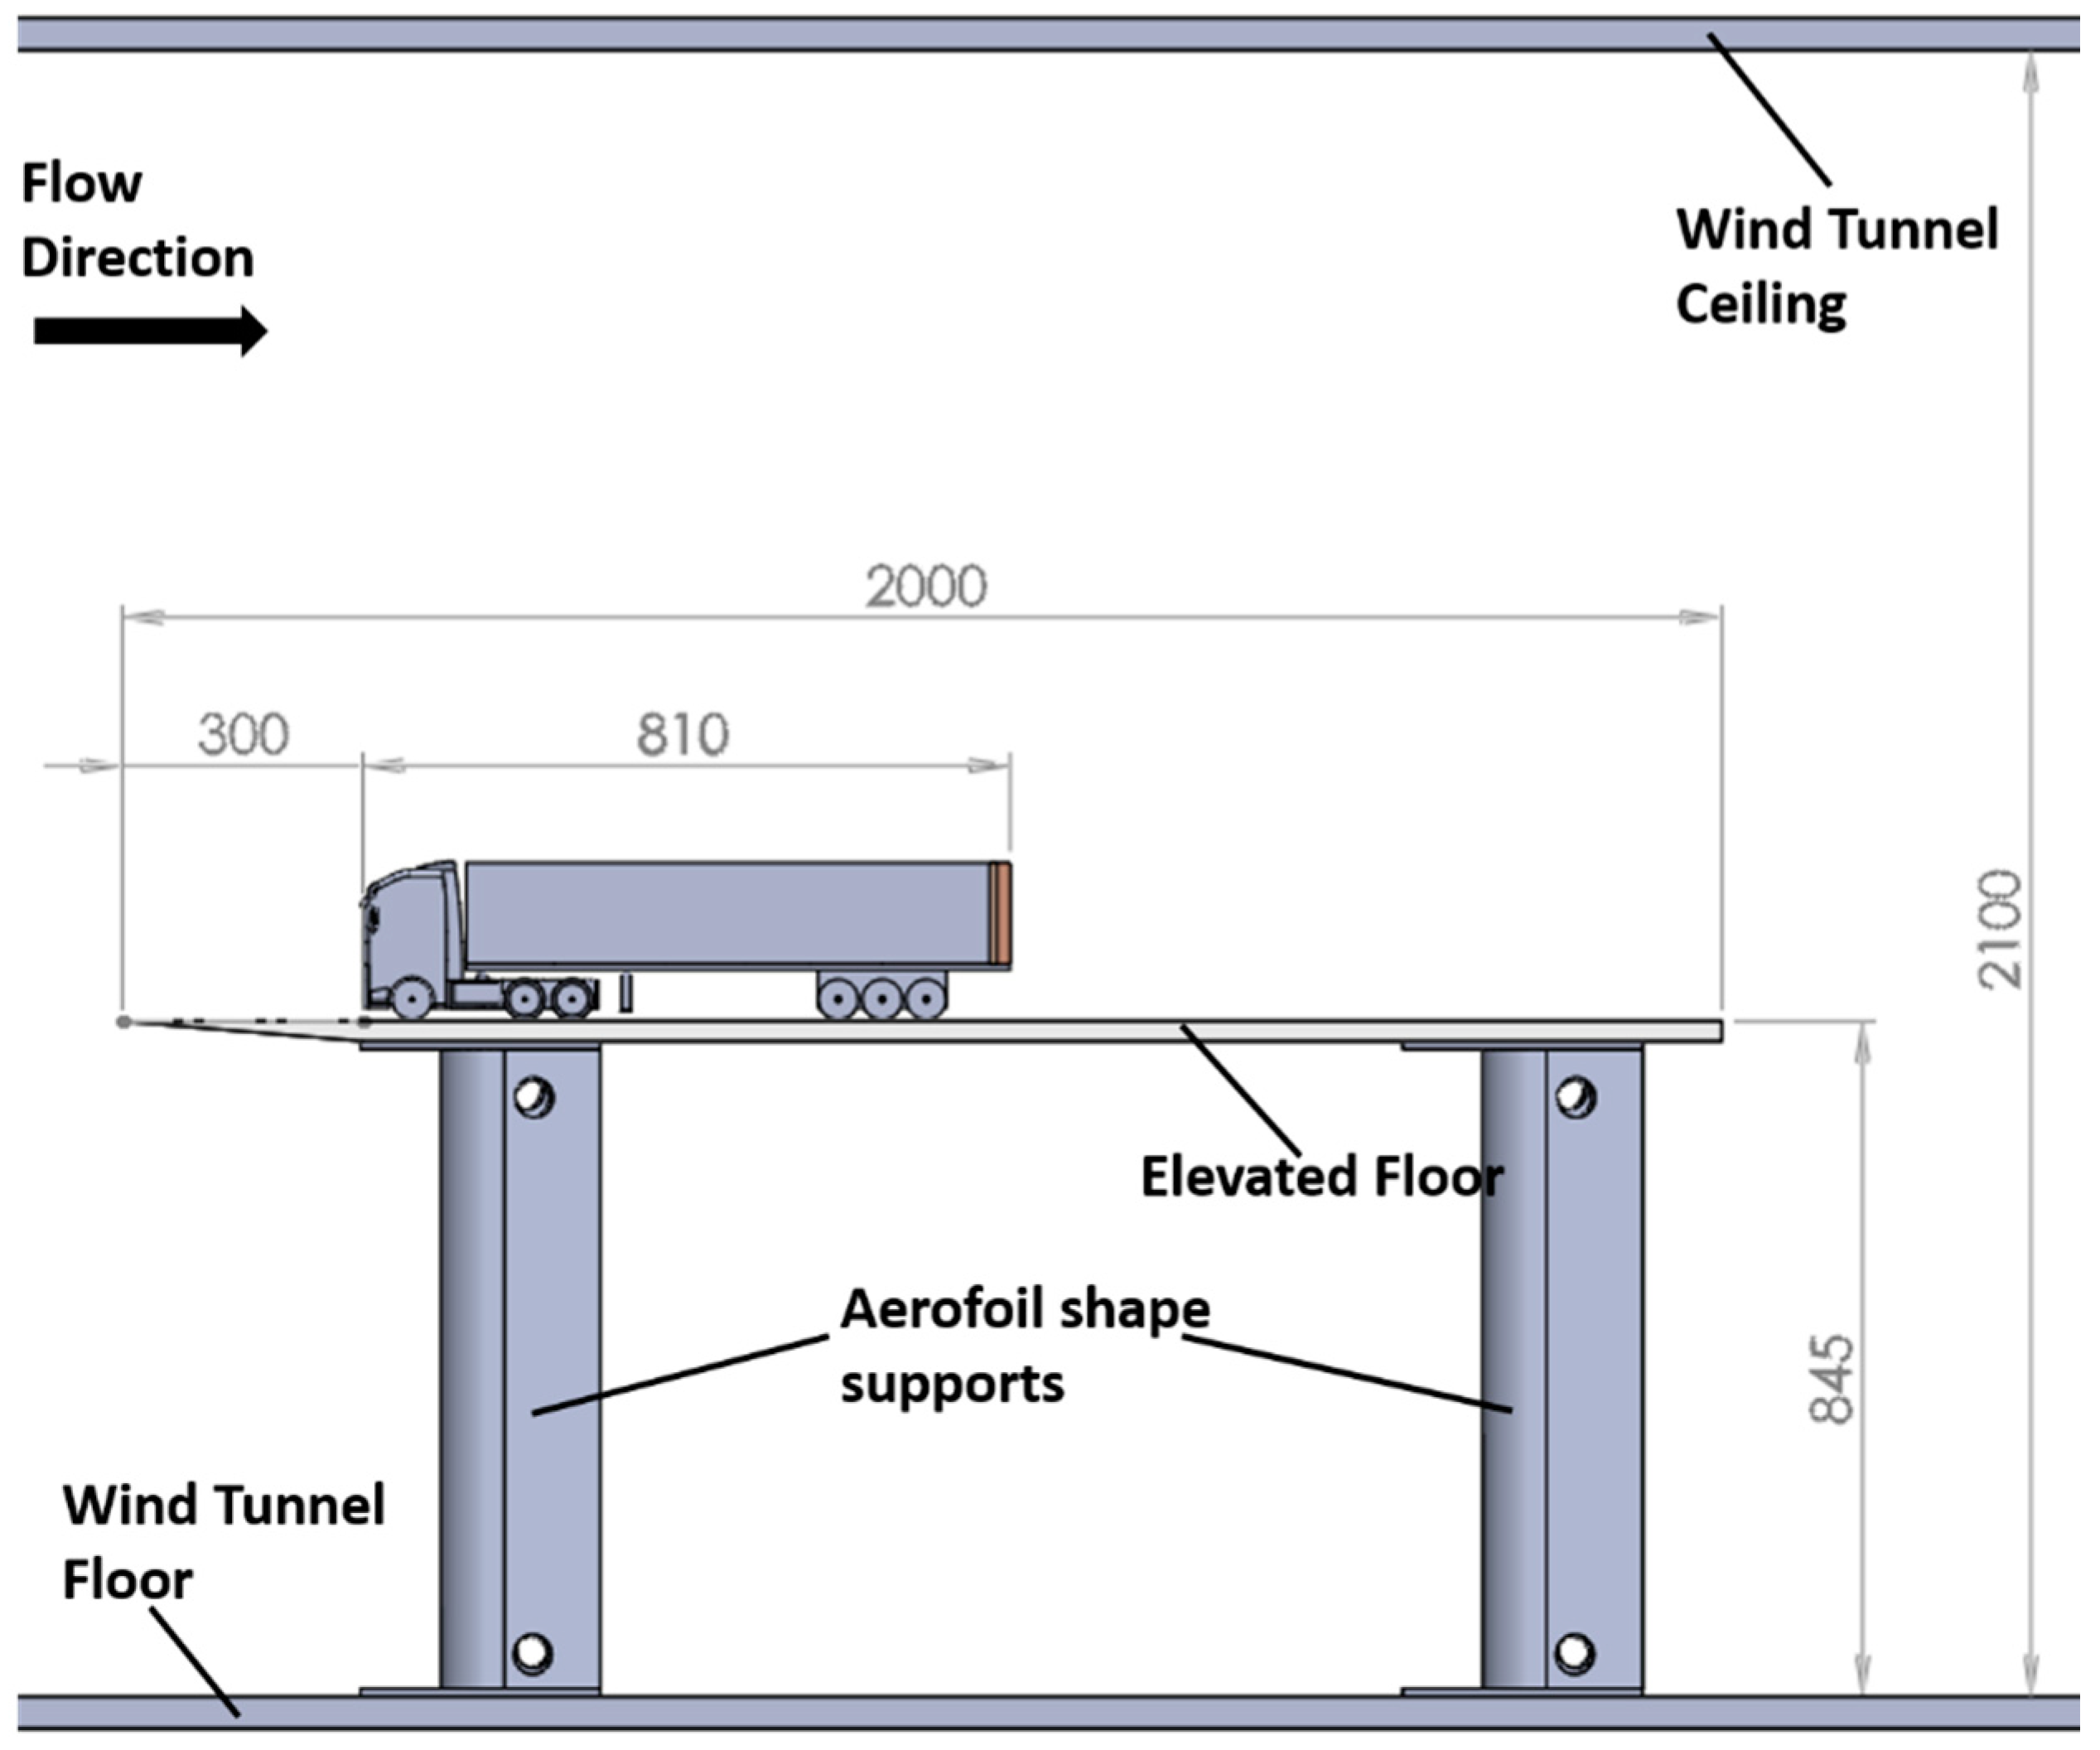
2. Experimental Setup
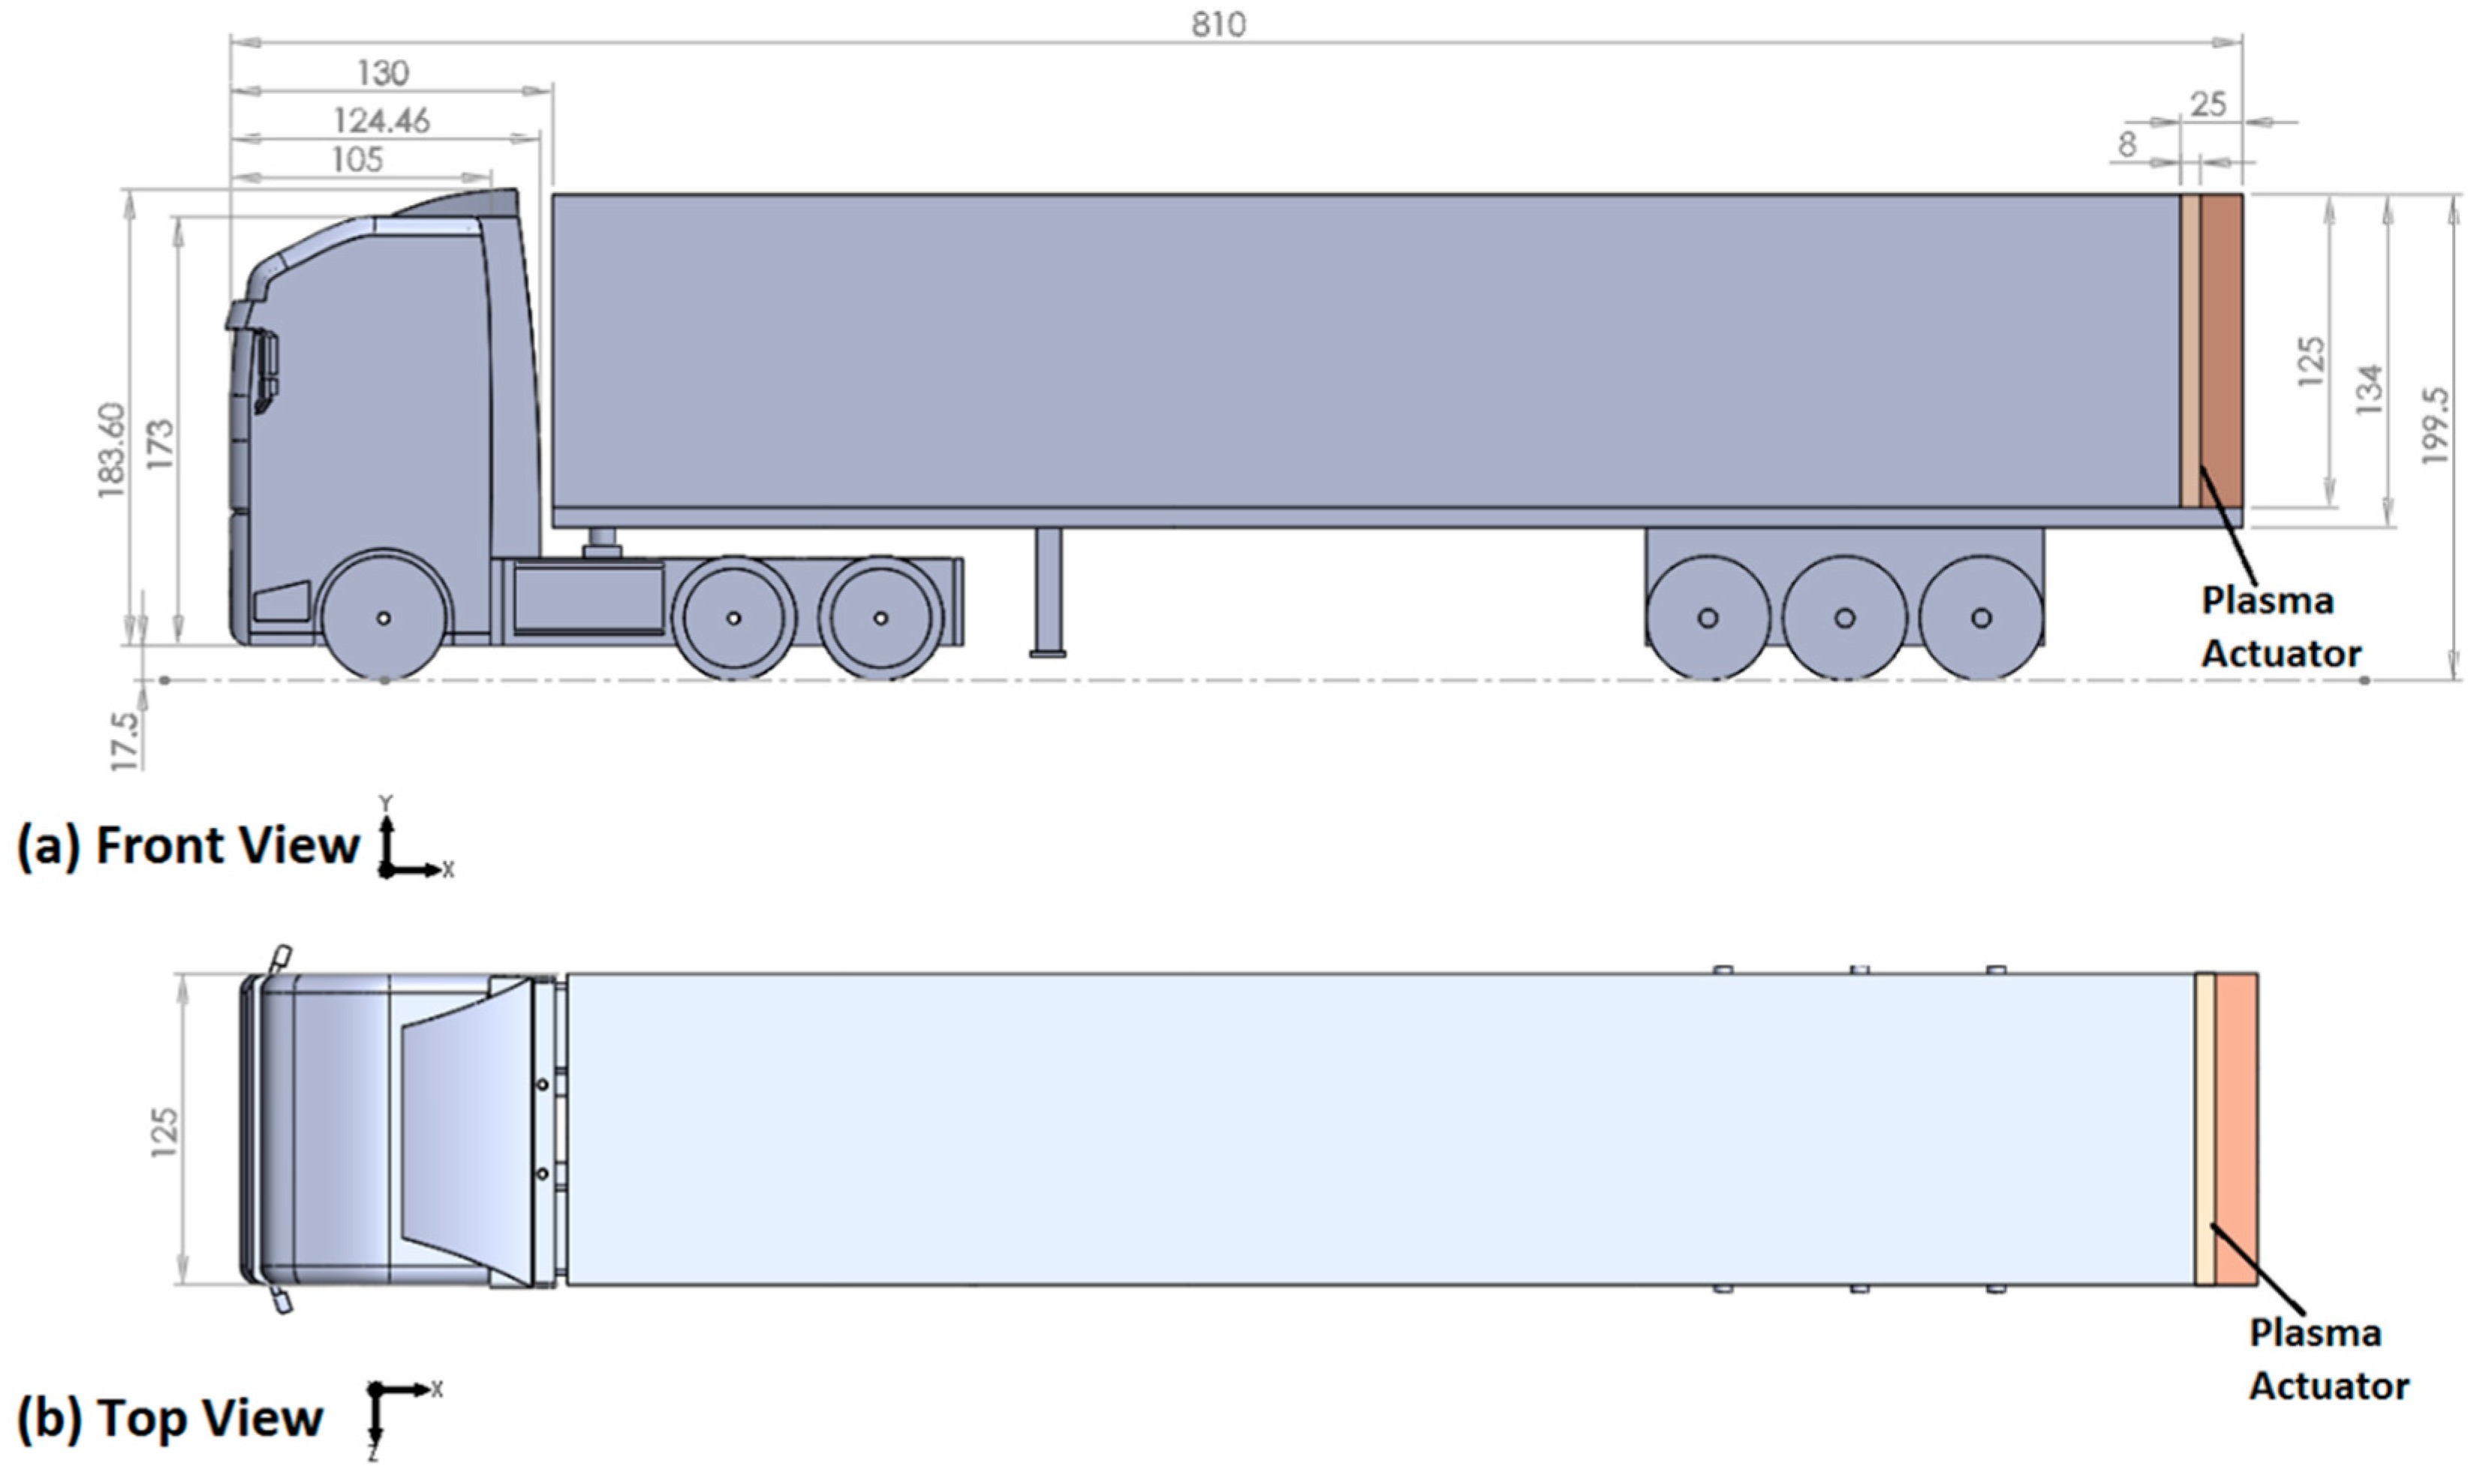
2.1. Scale Model

The 1:20 scale generic square-back articulated lorry model used in the present study was modified from the model used by Lo and Kontis in [30] and its schematic is shown in Figure 1. The model was lengthened accordingly to represent the maximum length of an articulated lorry that could be legally operated in the United Kingdom. In addition, a cap deflector was fitted on the tractor model to smoothen the flow reaching the rear end of the trailer. The normalised gap length ( G / A ) between the tractor and the trailer models was 0.17, where G and A are the gap length and the tractor frontal area, respectively. It should be noted that both the tractor and the trailer models were designed and scaled down using the geometry of an actual articulated lorry that could be easily found in Europe.

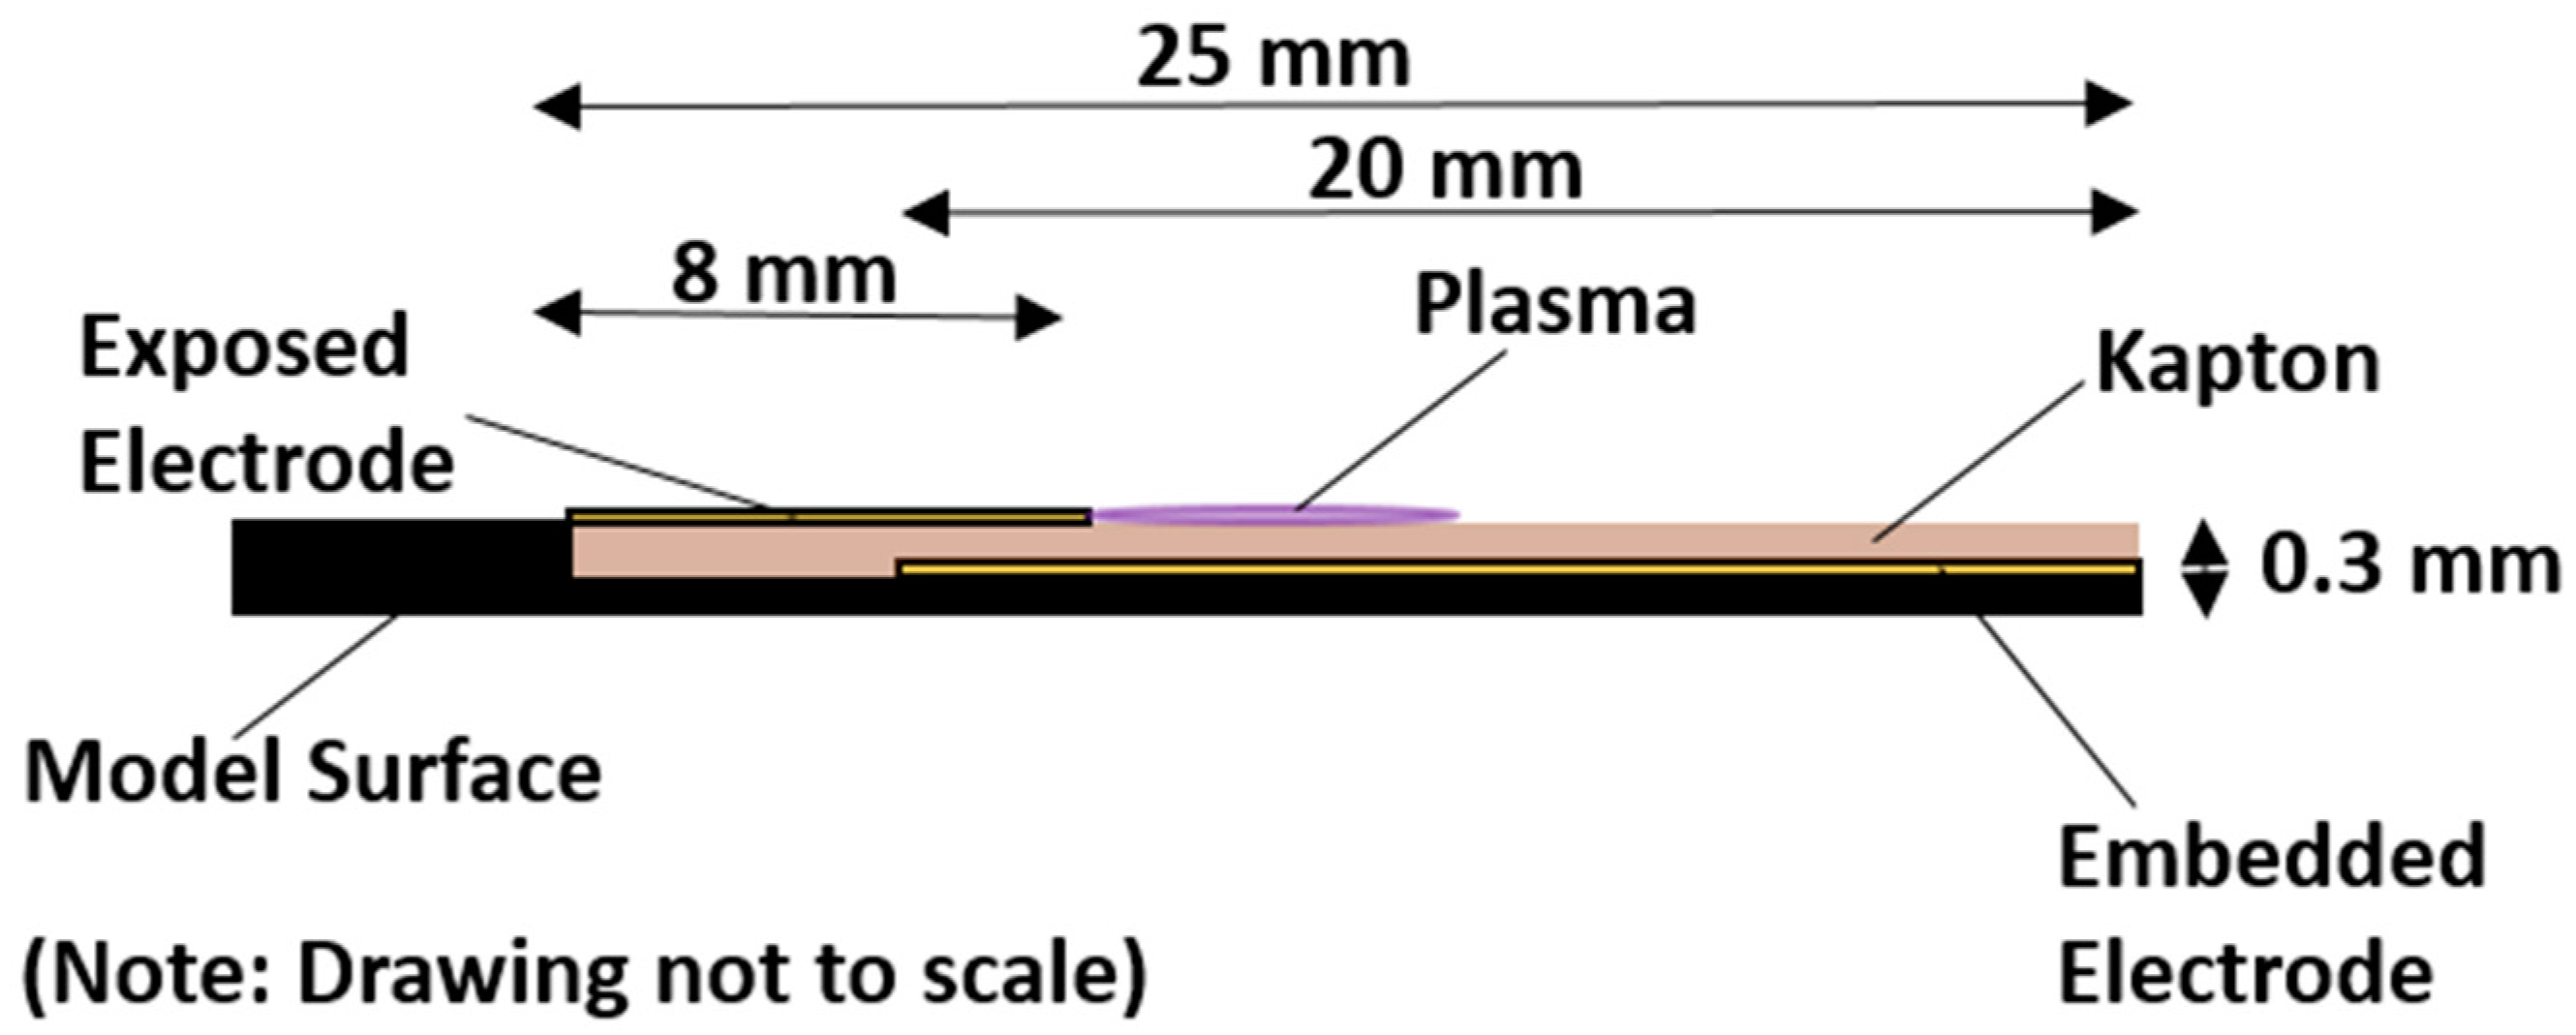
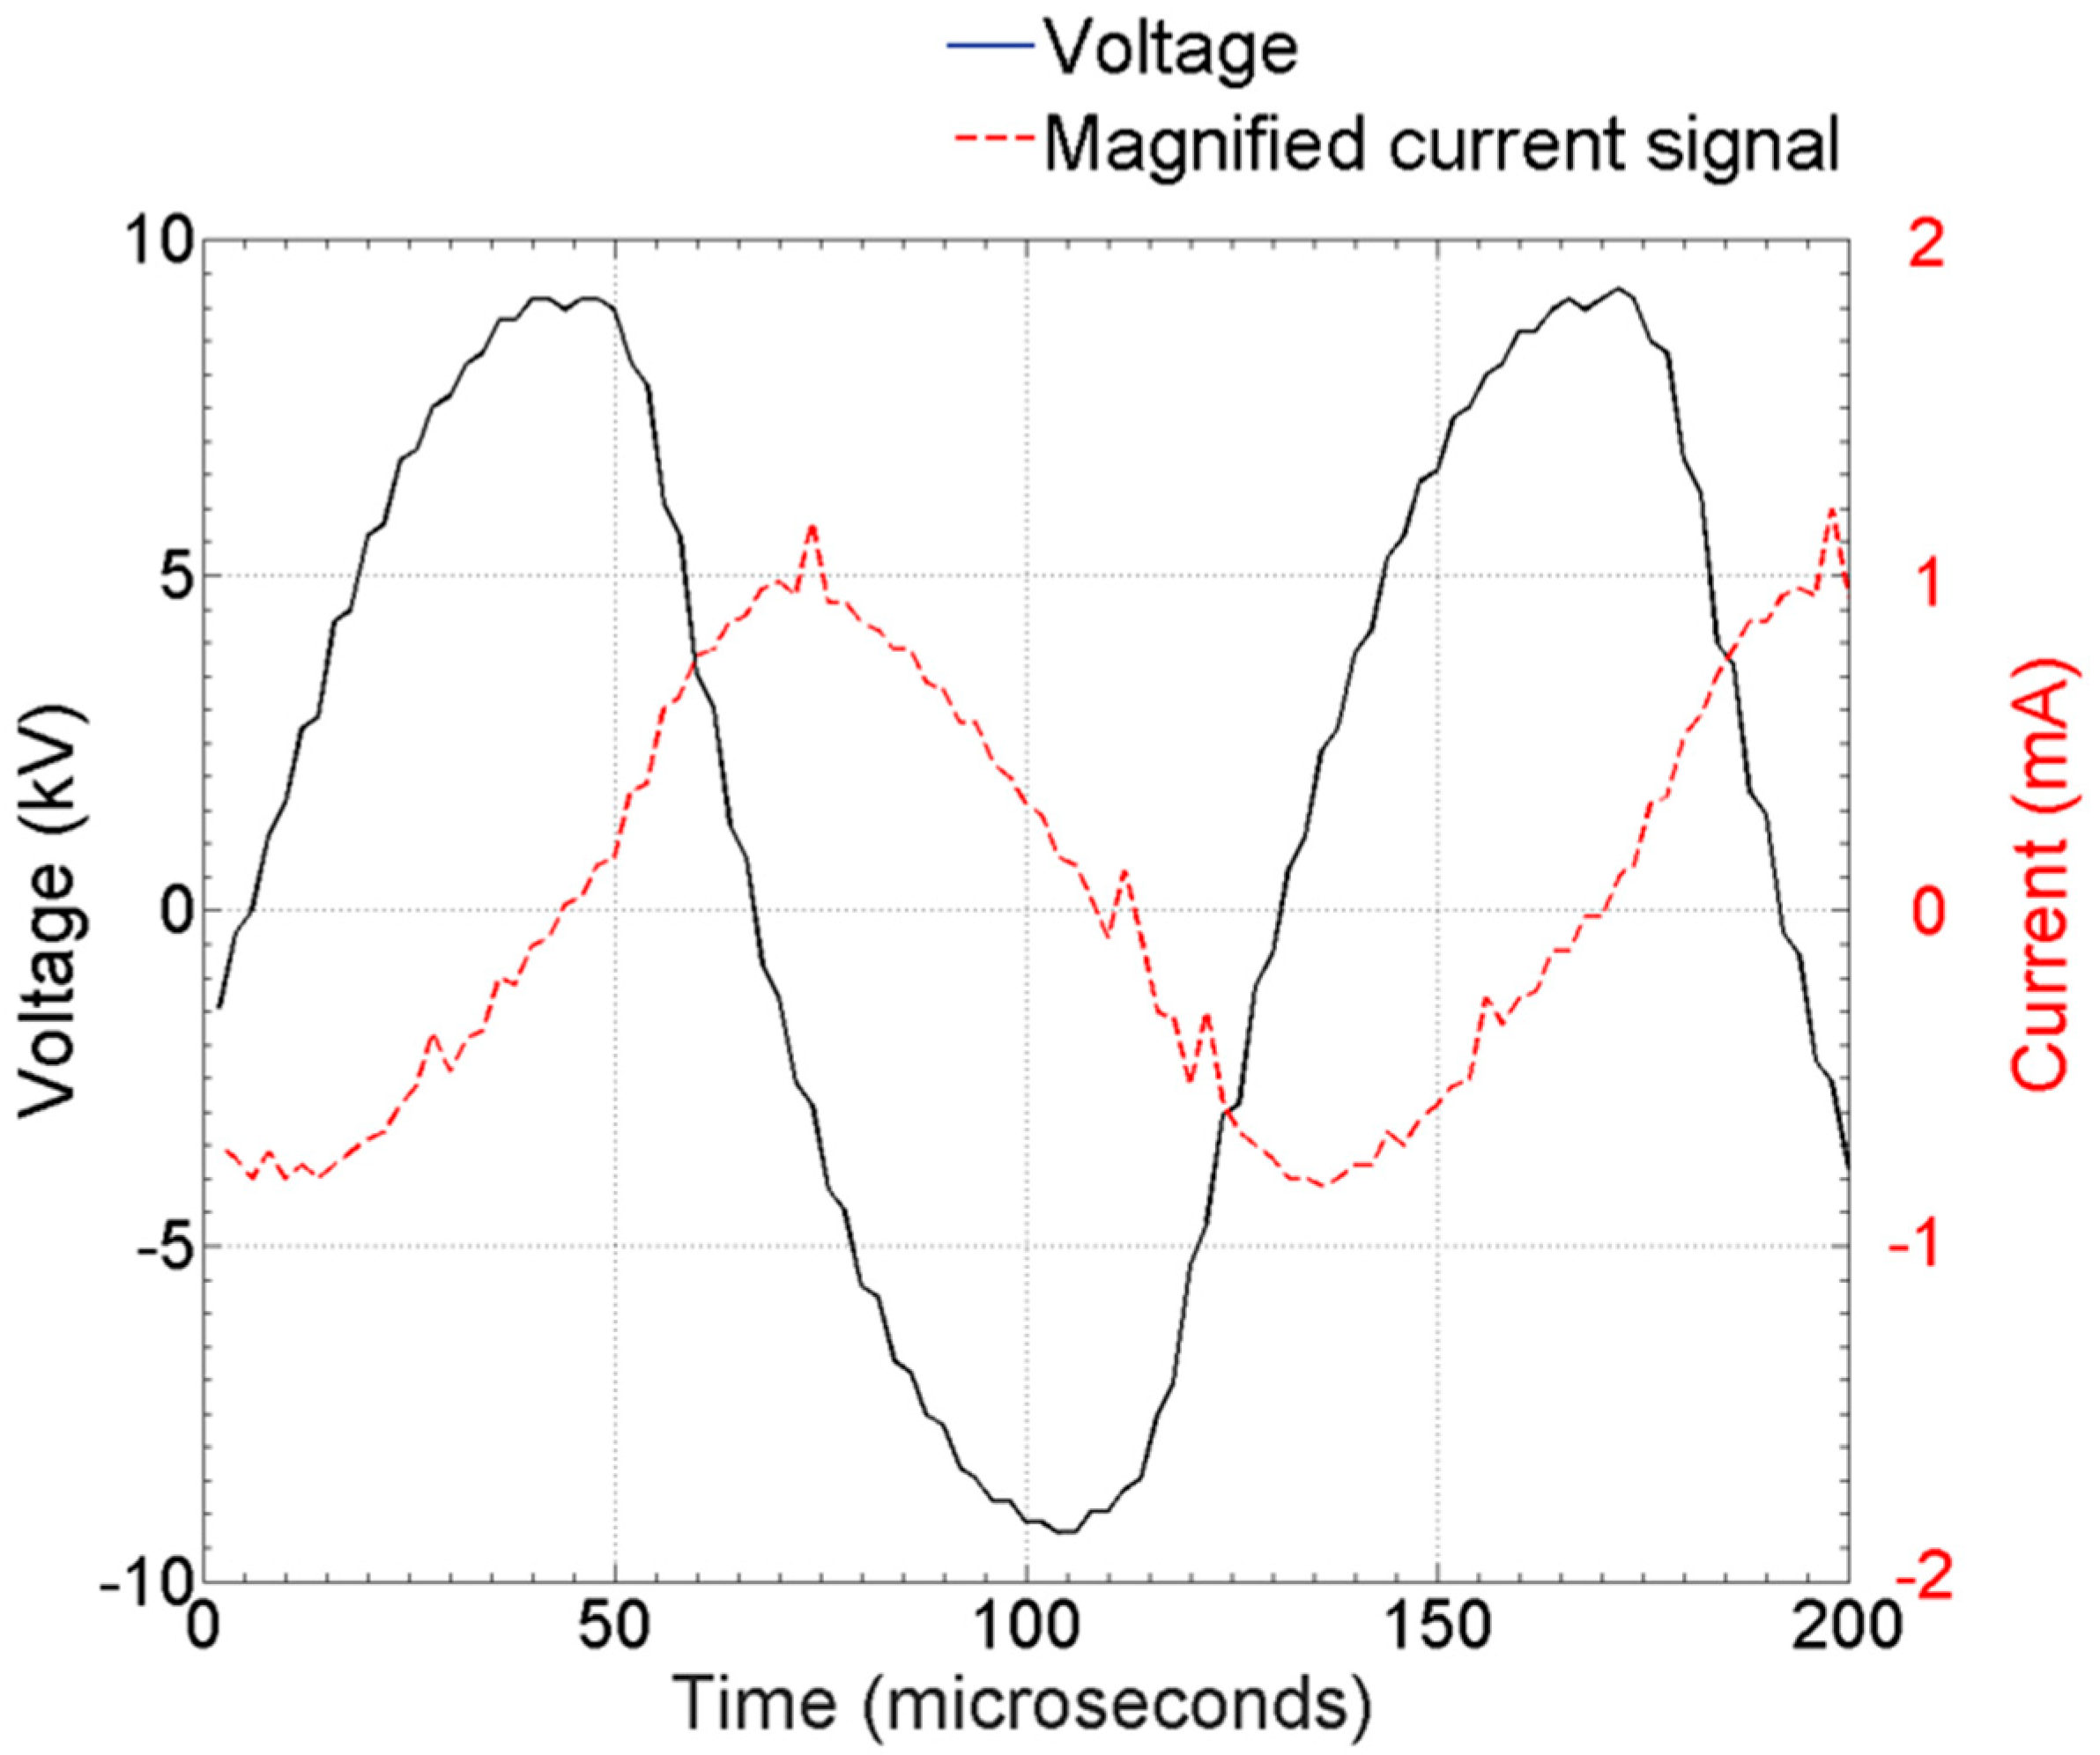
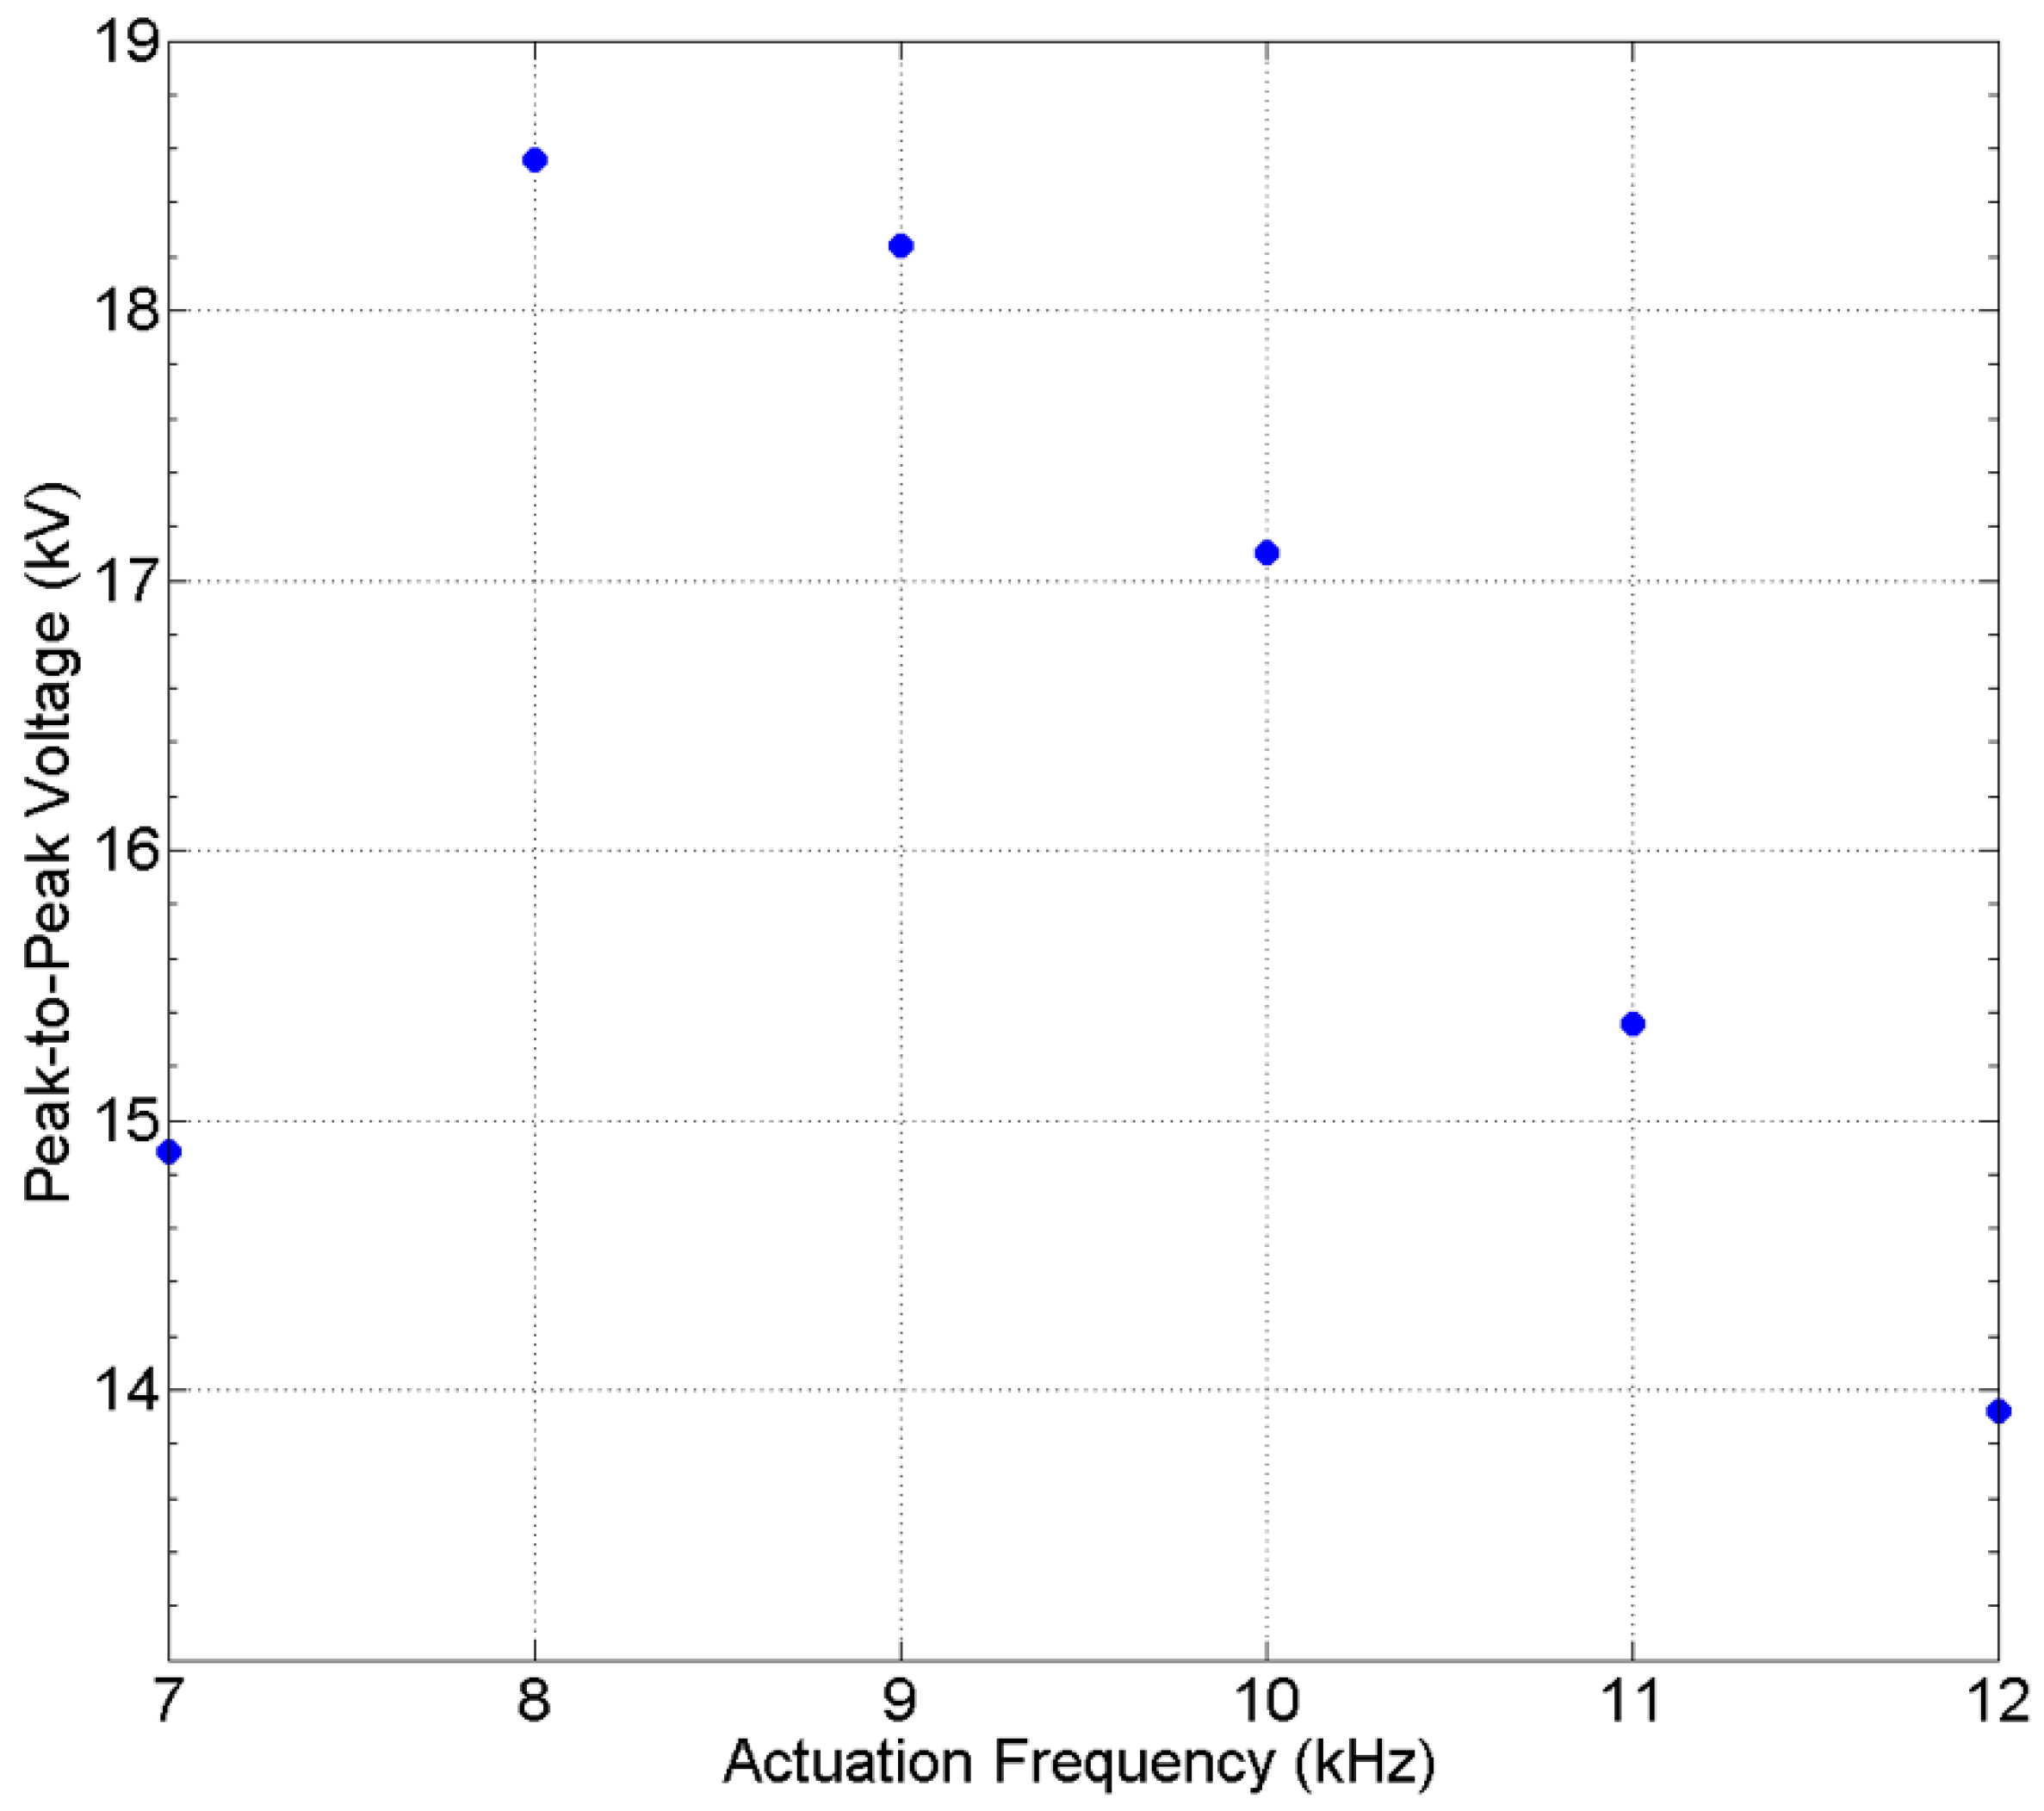
2.2. AC-DBD Plasma Actuator

The linear Single Dielectric-Barrier Discharge (SDBD) plasma actuator used was flush-mounted around the perimeter at the rear end of the trailer model as shown in Figure 1. Figure 2 illustrates the construction of the SDBD plasma actuator used in this study. Copper tape, supplied by RS UK with a thickness of 0.06 mm was used to construct the exposed and embedded electrodes of the actuator. The widths of these two electrodes were 8 and 20 mm, respectively. Kapton tape, also supplied by RS UK, was used to separate the two electrodes and its width and overall thickness were 25 mm and 0.195 mm, respectively. The exposed electrode was placed 17 mm upstream of the rear end of the trailer model and the two electrodes were overlapped by 3 mm as shown in Figure 2.
A set of Minipuls-4 high-voltage generator, manufactured by GBS Elektronik GmbH, Germany, was used to maintain the potential difference between the exposed and embedded electrodes of the SDBD plasma actuator. A Voltcraft (VSP2410, Germany) variable laboratory Direct-Current (DC) power supply was used to power the high voltage generator, and its voltage setting was maintained constant at 20 V DC. The actuation frequency of the high voltage generator used varied from 7 to 11 kHz. A sample voltage and current waveform captured at 8 kHz is shown in Figure 3. The peak-to-peak voltage output from the high voltage generator was in the range of 14.9 to 18.6 kV while the input voltage remained at 20 V DC throughout. The output voltage signals were measured by an Agilent (DSO1014A, USA) digital storage oscilloscope at various actuation frequencies and are presented in Figure 4. The bandwidth, maximum sampling rate and data writing speed of the digital oscilloscope are 100 MHz, 1 GSa/s, and 10 kpts, respectively.

2.3. Wind Tunnel Tests

Low-speed wind tunnel tests were conducted to investigate the flow characteristics along the wake region of the articulated lorry model with and without the linear AC-DBD plasma actuation being implemented. The wind tunnel used was identical to that employed by Lo and Kontis in [11,30]. The setup of the wind tunnel tests in the present study was similar to that shown in [30] and is summarised in Figure 5. The articulated lorry model was mounted on a false floor with the dimensions of 2 m (length) and 1 m (width). The model was mounted 300 mm downstream of the sharp leading edge of the false floor. The blockage caused by the presence of the false floor and the scale model to the wind tunnel test section was 3.52%. The ground clearance (C) to width (W) ratio (C/W) of the scale articulated lorry model used was C/W = 0.14 so that the ground clearance effects could be ignored [8]. It should be noted that C is the distance between the underfloor of the tractor model and the top surface of the false floor which is 17.5 mm, while W is the width of the articulated lorry model which is 125 mm (Figure 1). Freestream velocity (U) was set to U = 30 ± 2 ms−1 and the corresponding flow Reynolds number with respect to the height of the tractor model (ReH) was ReH = 3.6 × 10⁵. The flow Reynolds number was an order of magnitude lower than that encountered by an actual articulated lorry. However, as the present flow Reynolds number was above 2.1 × 10⁵, this meant that the flow features that presented and the drag coefficient of the model were still comparable to those encountered by an actual articulated lorry, according to Gurlek et al. [31] and Krajnovic and Davidson [32].

2.4. Force Balance Measurement

The standard force balance measurement was conducted to assess the time-averaged aerodynamic force acting on the articulated lorry model with and without the AC-DBD plasma actuation implemented. After the pre-set freestream velocity was reached and stabilised, the aerodynamic force was measured over a 30 s period with a sampling frequency of 1 kHz.

2.5. Two-Component Particle Image Velocimetry Measurements

The time-averaged two-component Particle Image Velocimetry (PIV) measurement was employed to resolve the velocity, vorticity, and turbulence information along the centreline of the articulated lorry model. Details about the setup of the present PIV measurement could be found in [11,30]. The centreline of the false floor was illuminated by a pair of Neodymium-doped Yttrium Aluminium Garnet (Nd-YAG) Q-switched lasers with maximum pulse energy and frequency of 0.1 J and 0.2 kHz, respectively. The time delay (∆t) between the two laser pulses was ∆t = 20 µs. Olive oil mist with a typical diameter of 1 µm was used as the seeder. A Phantom (v341, USA) high-speed camera was used for capturing the raw images in the PIV experiments. With the aid of a Cannon 100 mm fixed lens and a viewing area of 478 mm × 294 mm was achieved in the PIV measurements. The time-averaged flow field was constructed by averaging 2400 pairs of PIV raw images. Cross-correlation of the captured raw images was conducted by Davis 8.2, supplied by LaVision, Germany, using a two-stage approach. In the first stage, the PIV raw images were divided into a number of 32 × 32 pixels interrogation windows, and the window size was refined by half in the second stage. Two and three passes of cross-correlation were conducted in the first and second stages, respectively. The overall uncertainty of the PIV measurements is approximately 4%.

3. Results and Discussion

3.1. Wind-Off Performance

It is important to calibrate the wind-off performance of the linear AC-DBD plasma actuator at various actuation frequencies before using it in the wind tunnel tests. Figure 6 and Figure 7 show the velocity contour and profiles in the x-direction (u) of the flow induced by the plasma actuator at various actuation frequencies during the wind-off condition. Just after the edge of the exposed electrode, the plasma-induced flow begins as a wall jet over the dielectric layer. However, after it leaves the edge of the trailer, it continues as a free jet which is subsequently called the plasma-induced jet.
It can be seen from Figure 6 that amongst all plasma actuation frequencies being studied the lowest and highest plasma induced jet velocity in the x-direction appeared when the actuation frequency was 7 (Figure 6a) and 9 kHz (Figure 6c), respectively. Maximum jet velocity occurred when the actuation frequency was 9 kHz at the normalised location x/H = 0.2 (Figure 7a) with its time-averaged magnitude equal to u = 1.98 ms−1. In fact, the instantaneous plasma-induced jet velocity at this frequency can go up to 6 ms−1. It should be noted that H is the height of the trailer model which is 125 mm. The jet velocity decreases progressively downstream, with the increase in distance from the plasma actuator, at all plasma actuation frequencies. Above 9 kHz, increasing the actuation frequency reduces the wall jet velocity in the x-direction, as shown in Figure 6c–e and Figure 7.

3.2. Flow Control Effect by AC-DBD Plasma Actuation

3.2.1. Force Balance Data

The drag coefficient of the model, CD, using the data from the force balance are tabulated in the following Table 1. From Table 1, it can be seen that the use of AC-DBD plasma actuation could only marginally affect the drag coefficient of the articulated lorry model. Drag reduction occurred when the actuation frequency was 9 kHz but the reduction in CD compared to the baseline case was 0.001 which is negligibly small. The results obtained suggested that using the AC-DBD plasma actuation cannot reduce drag on the articulated lorry model. In contrast, at 7 kHz, the drag coefficient actually increased by 0.004. Although, it is still negligibly small, it points out the possibility of the drag increase due to the implementation of the AC-DBD plasma actuation.
Although the results shown in Table 1 confirmed that the use of the AC-DBD plasma actuation could not reduce drag, it is important to understand how the plasma actuation affects the flow characteristics in the wake region so that the design of the actuator can be modified to suit this application. To be exact, could the use of AC-DBD plasma actuation actually be able to exert effects on the flow and hence, manipulate the flow in the wake region? To answer, this question, a series of PIV measurements were conducted to visualise and quantify the flow characteristics in the wake region of the articulated lorry model with and without the AC-DBD plasma actuation being implemented. In addition, frequency responses of the flow in the wake region could be derived from the PIV data so that the effect of the AC-DBD plasma actuation in the flow frequency response could be studied.

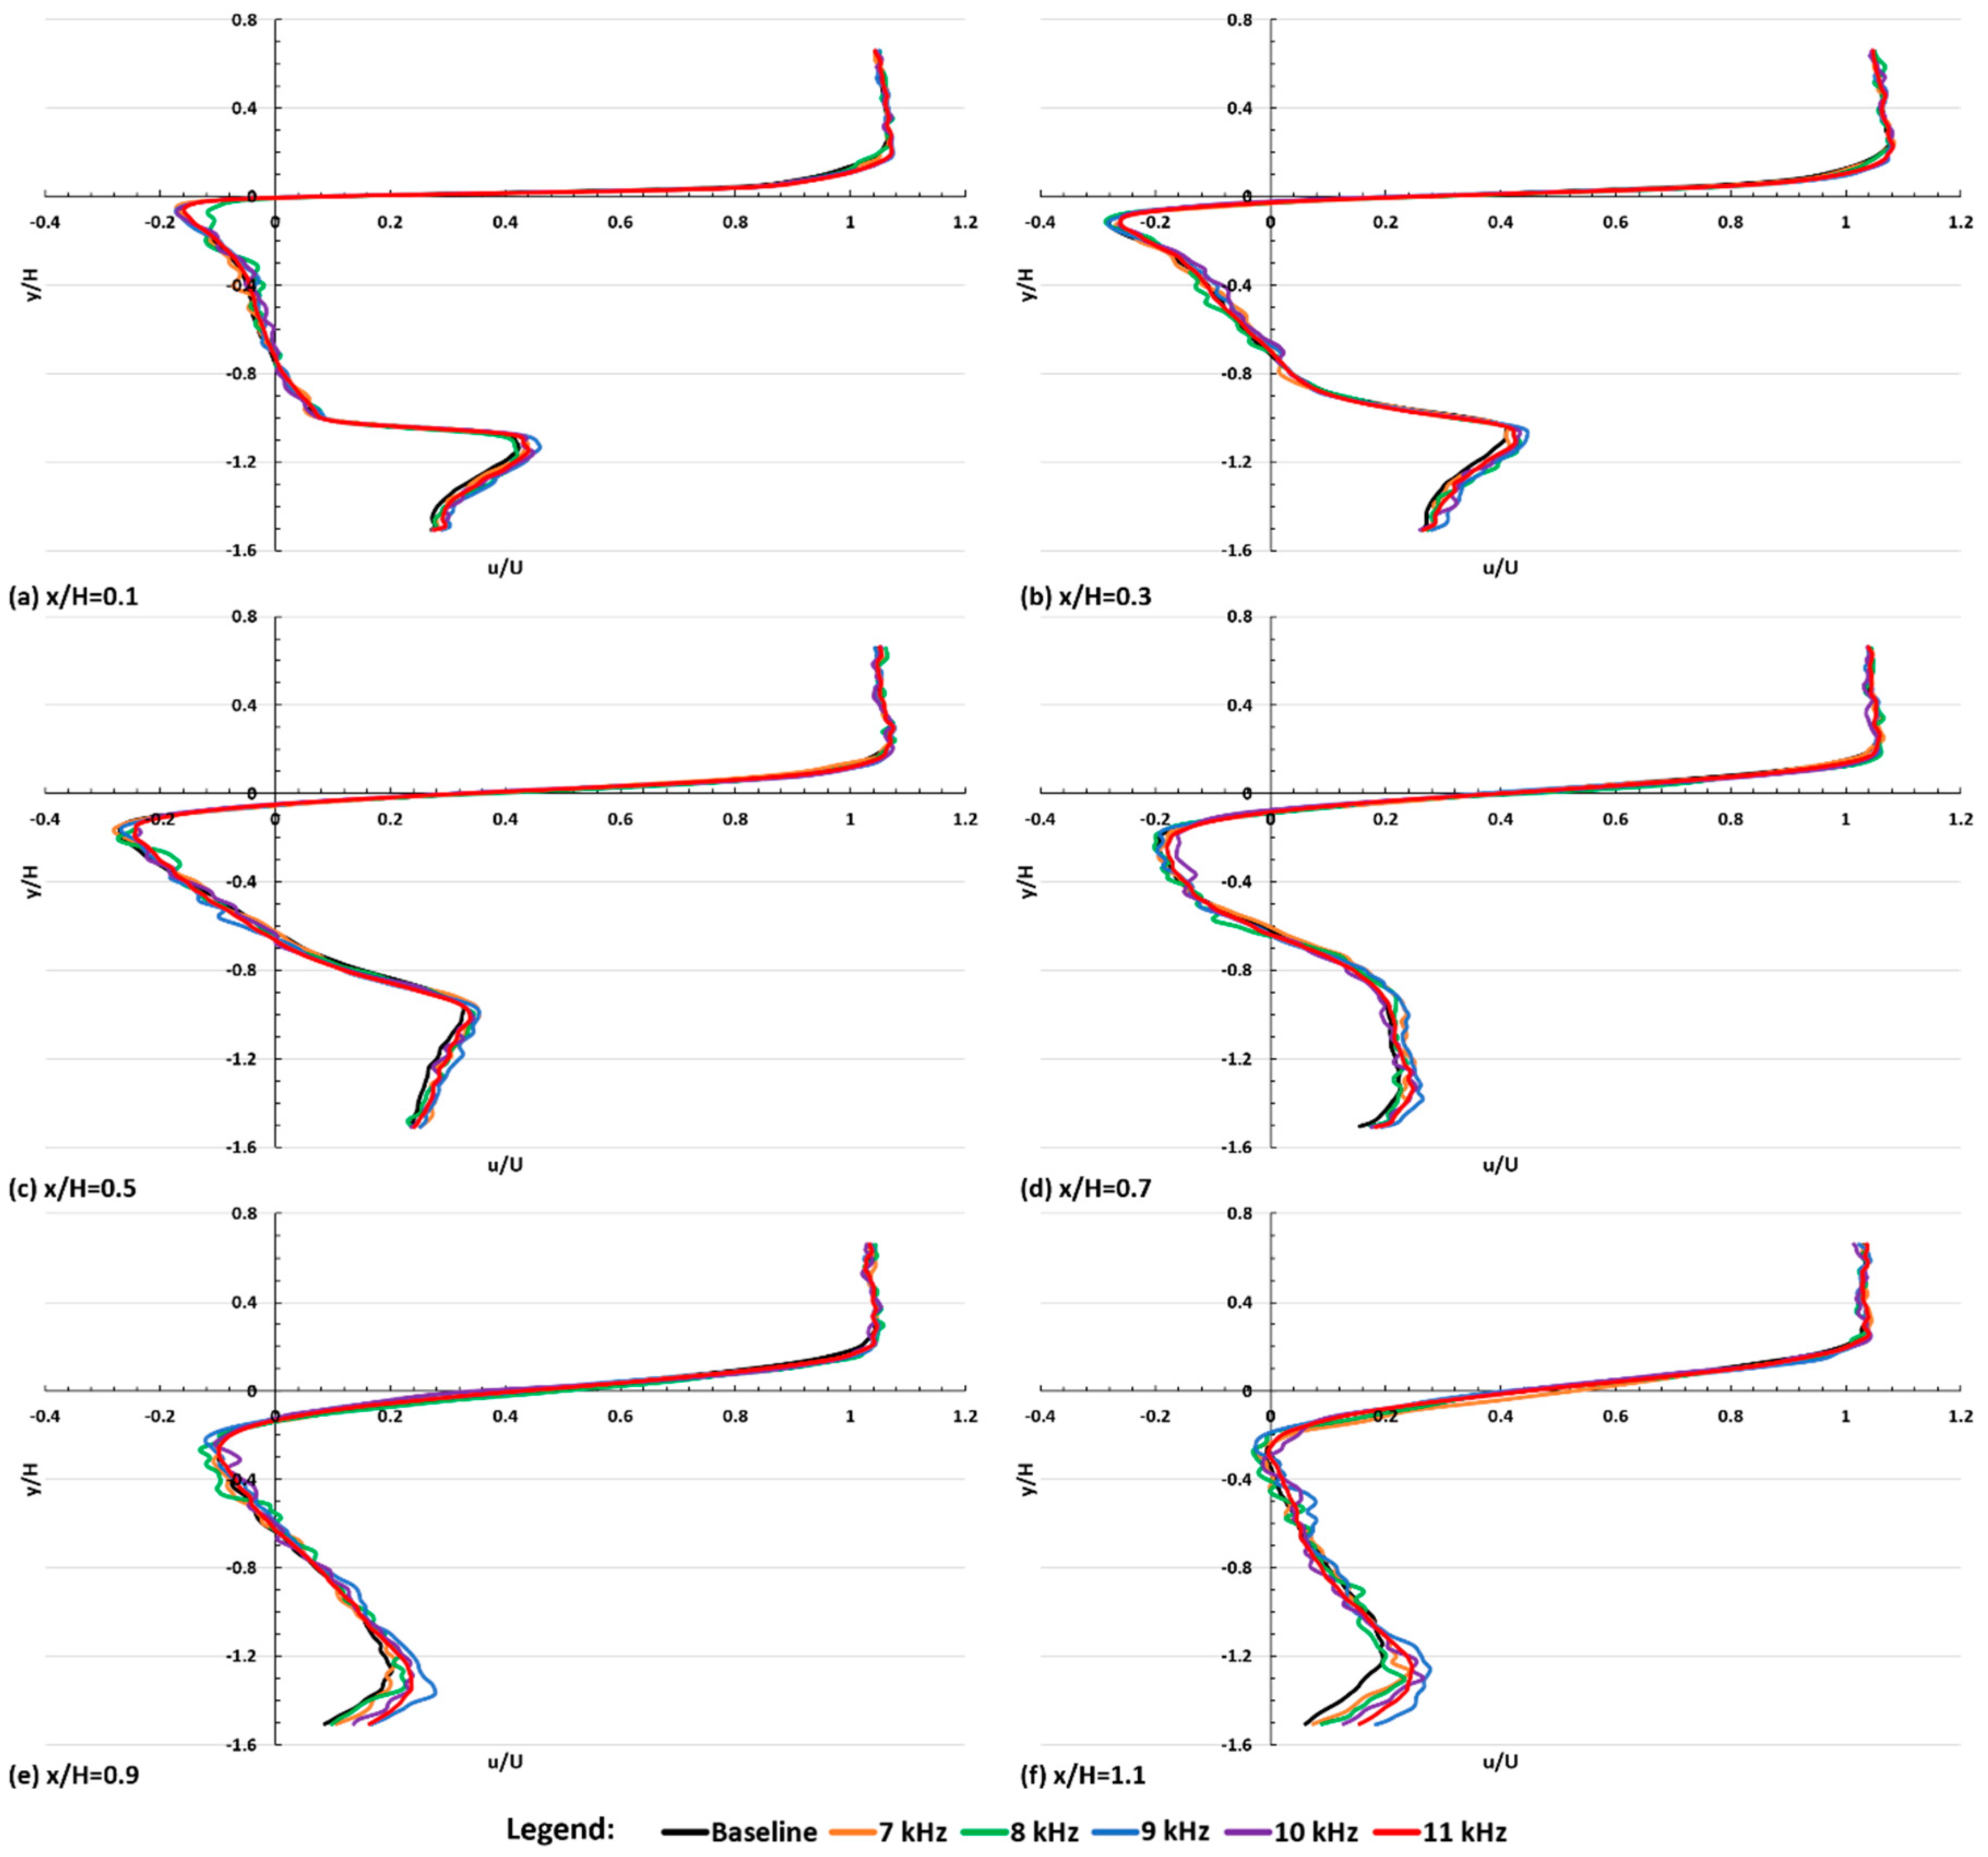
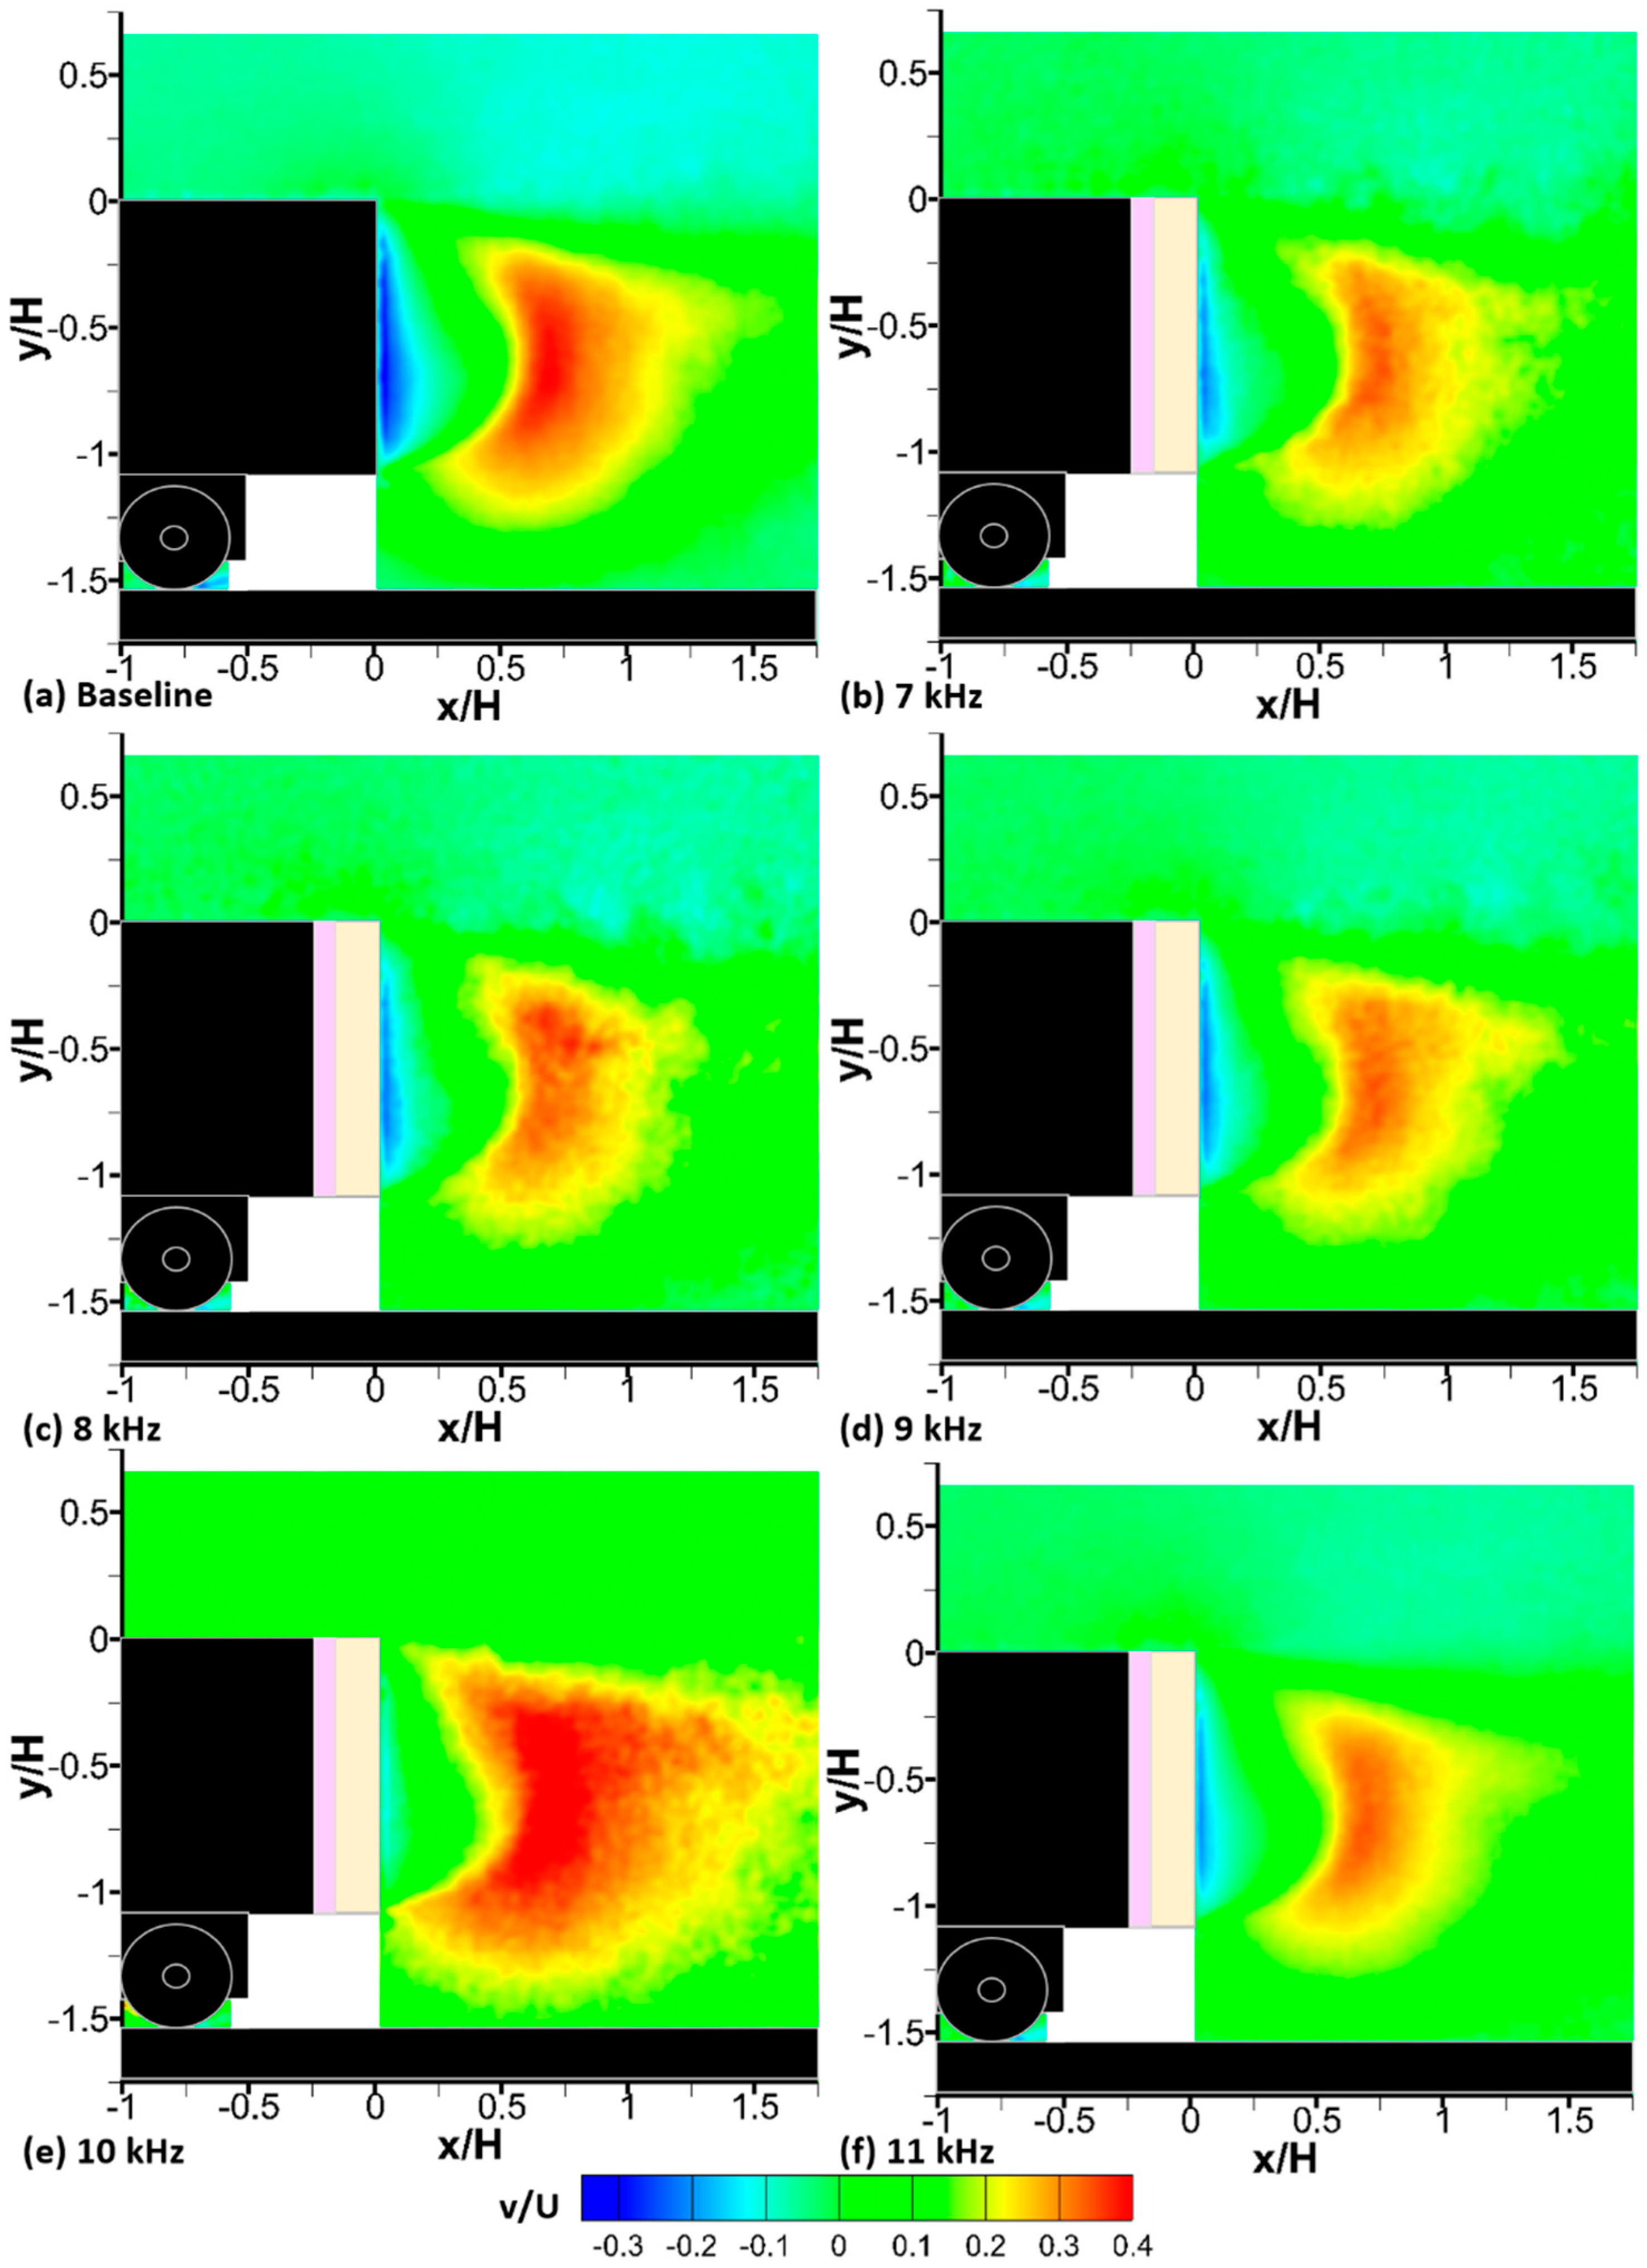
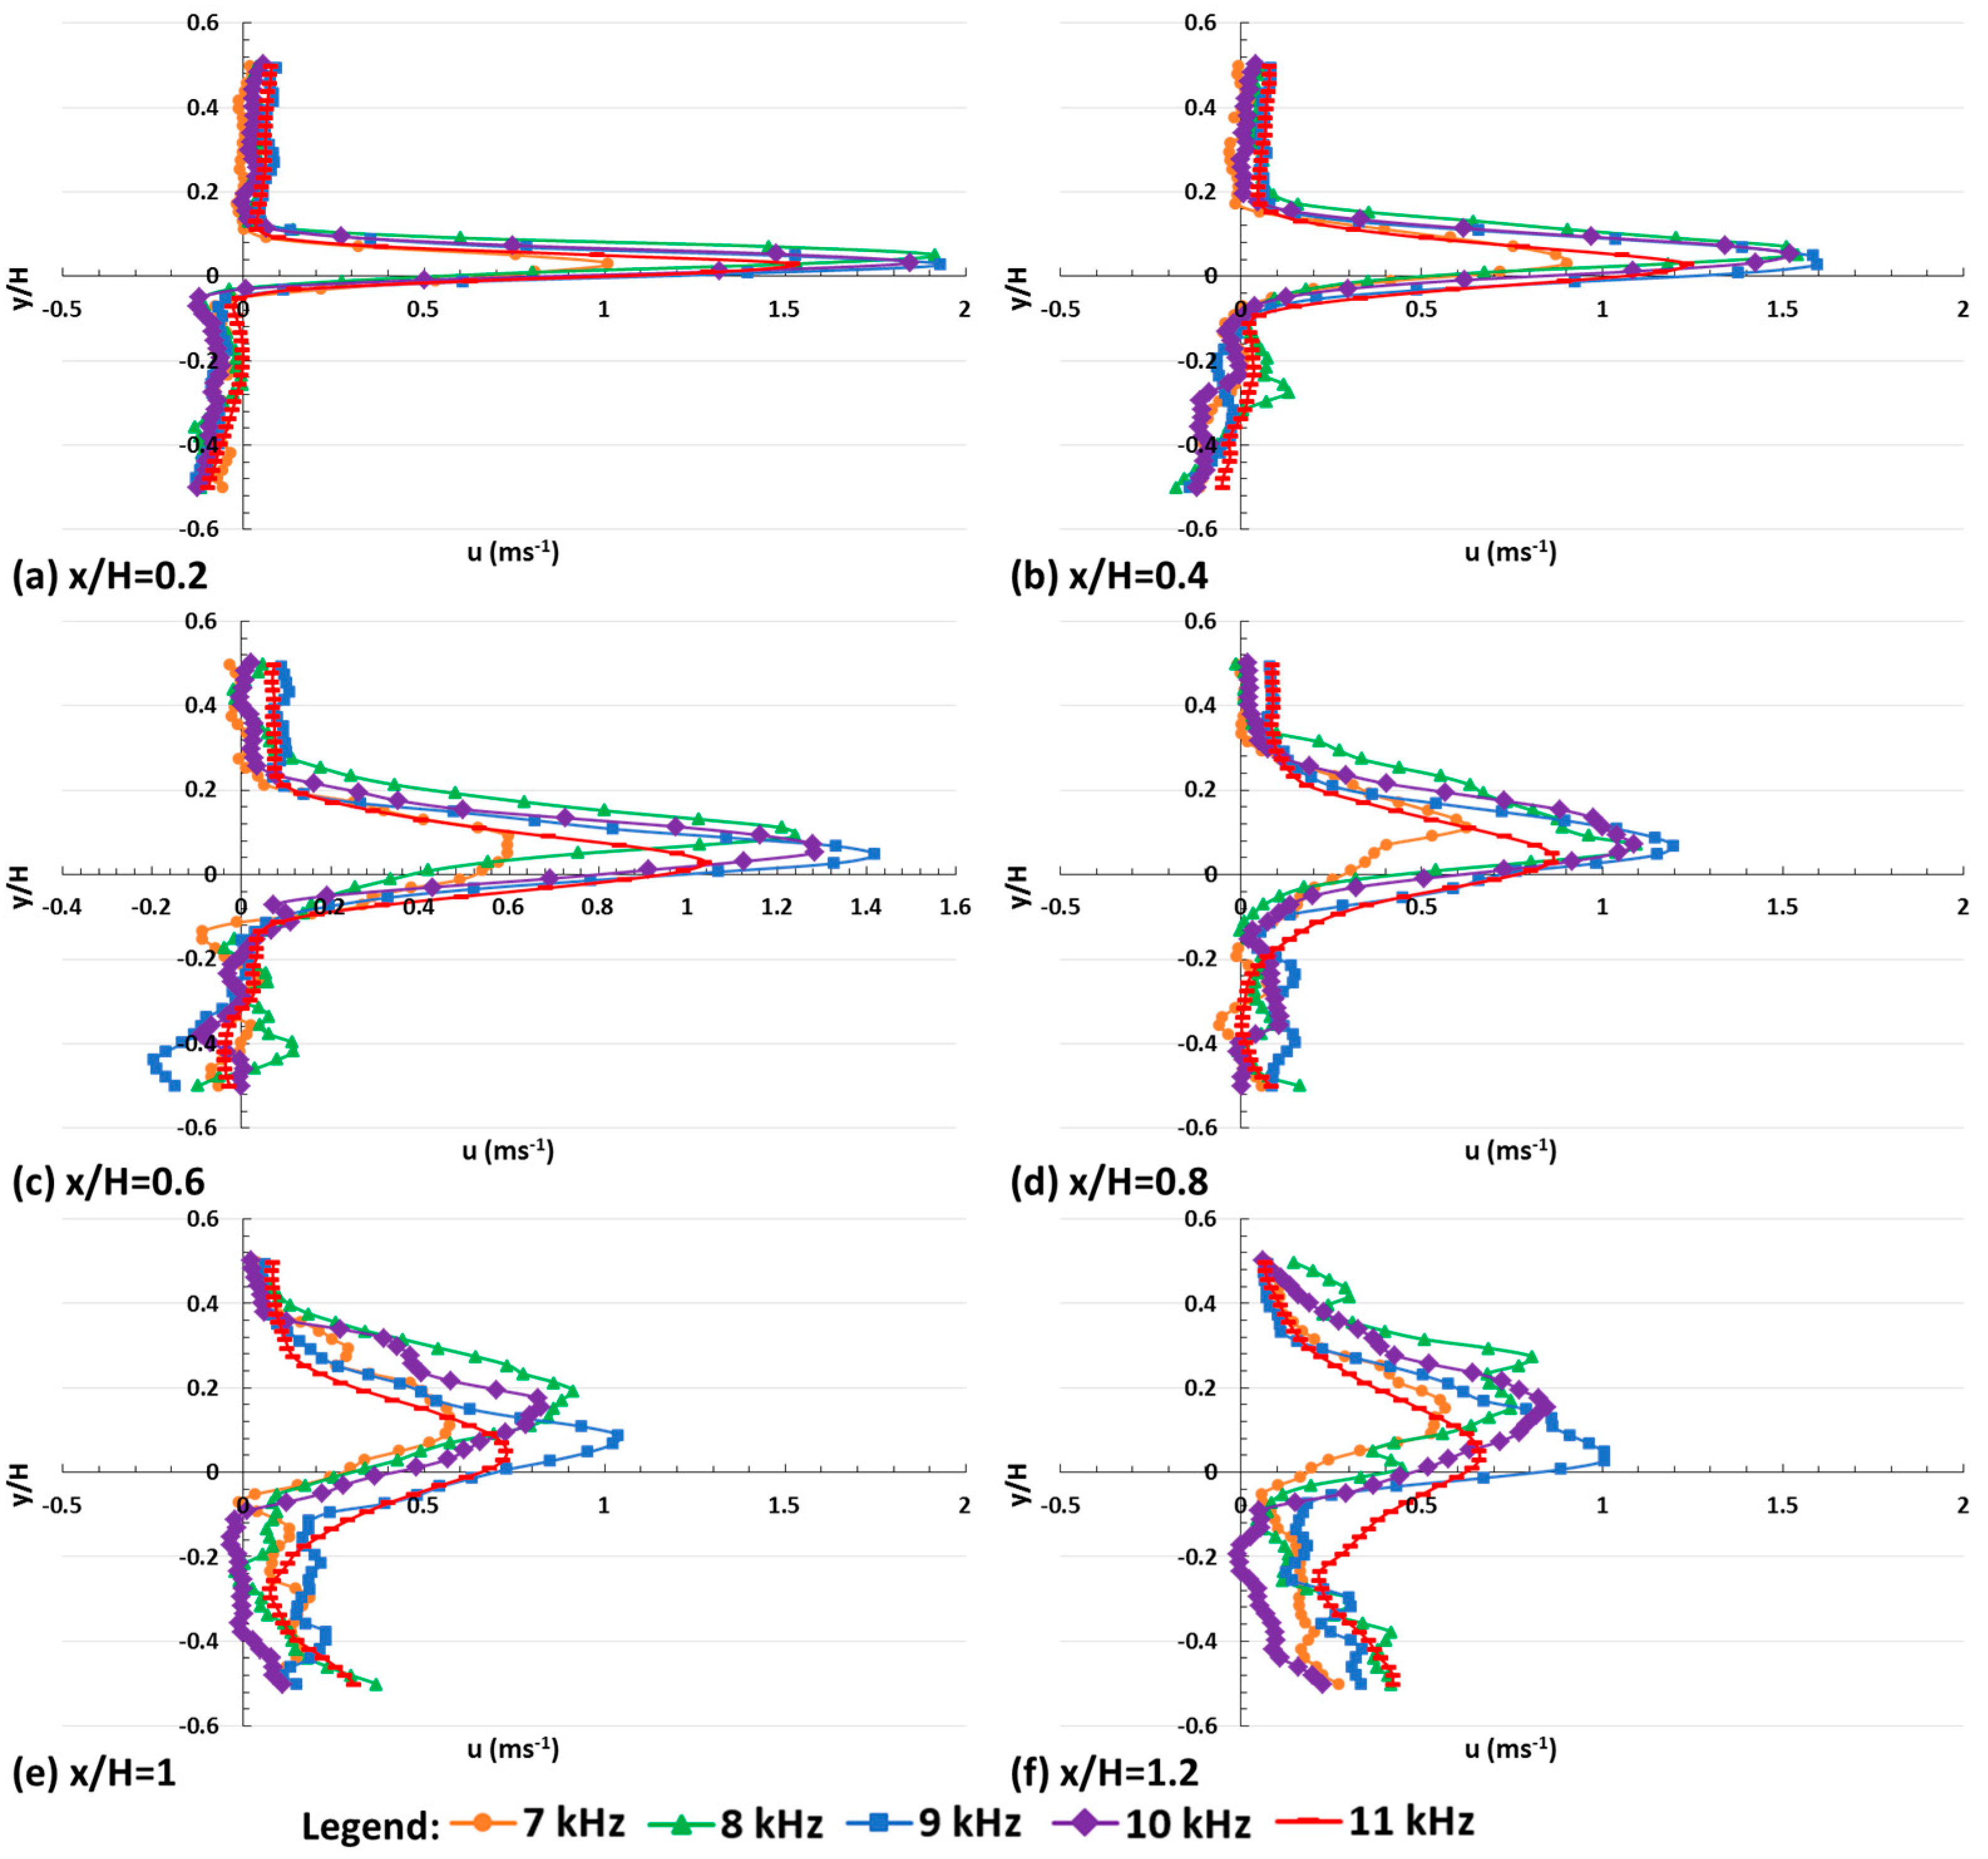
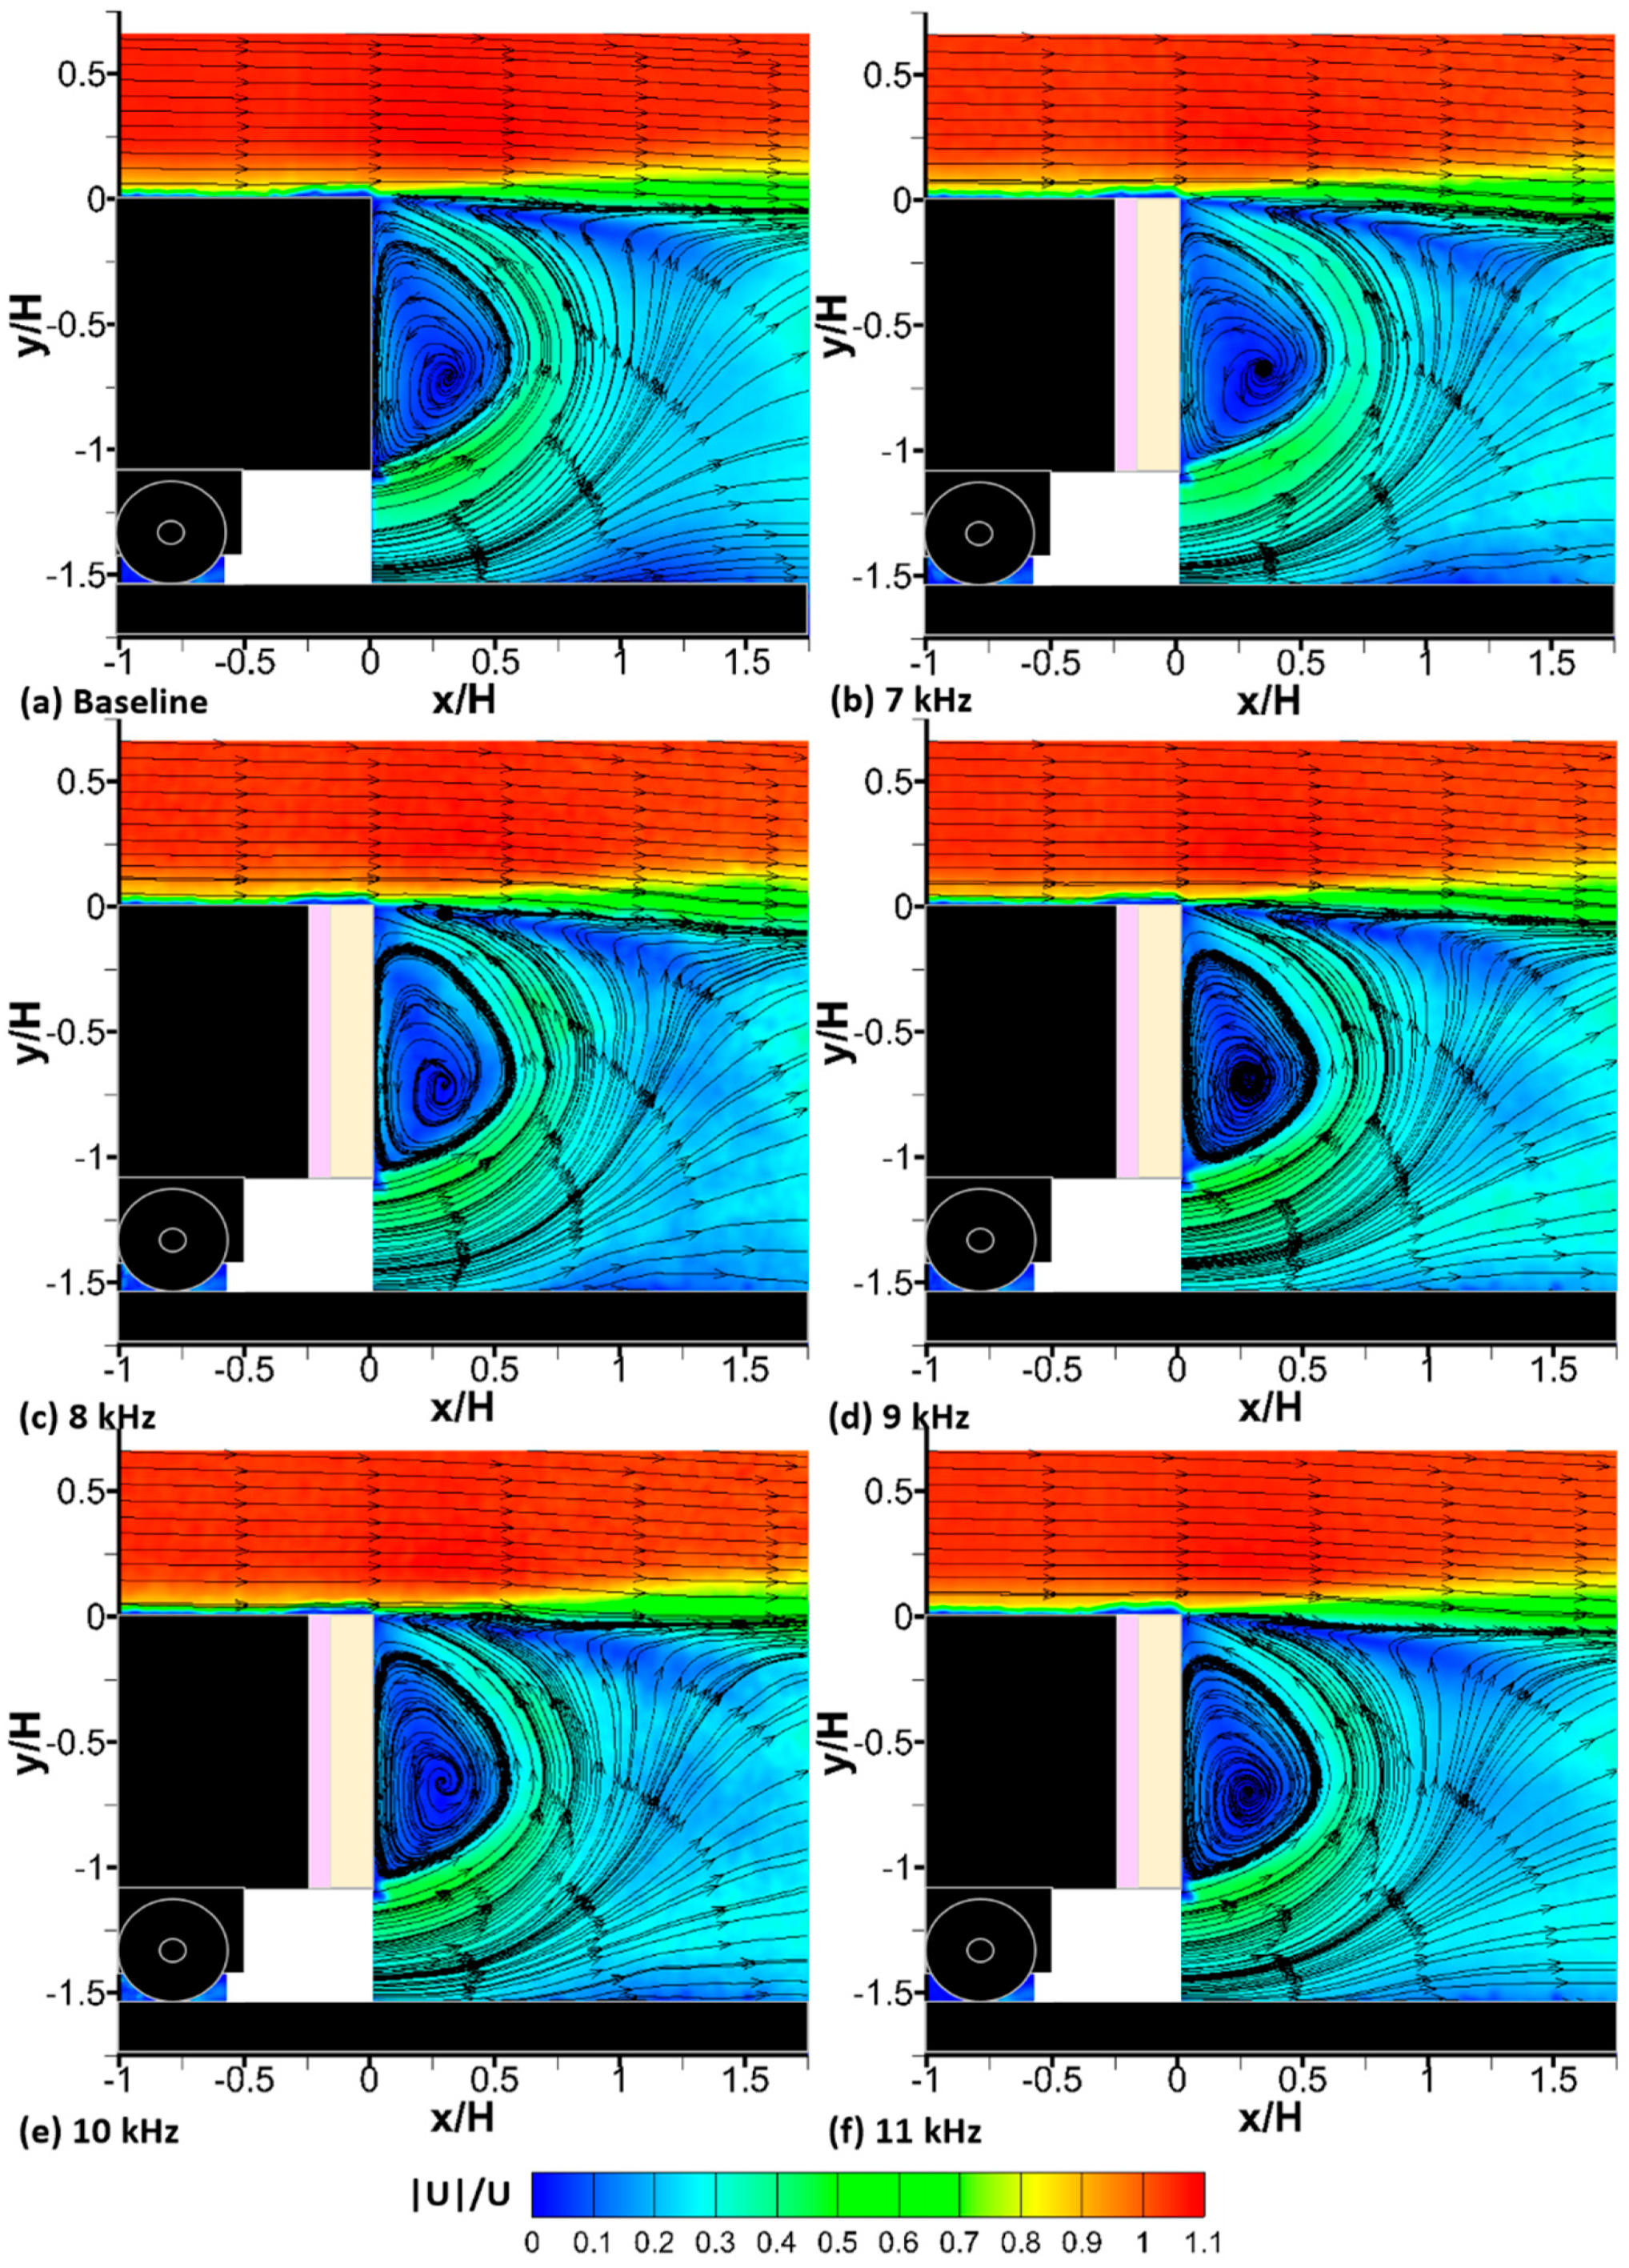
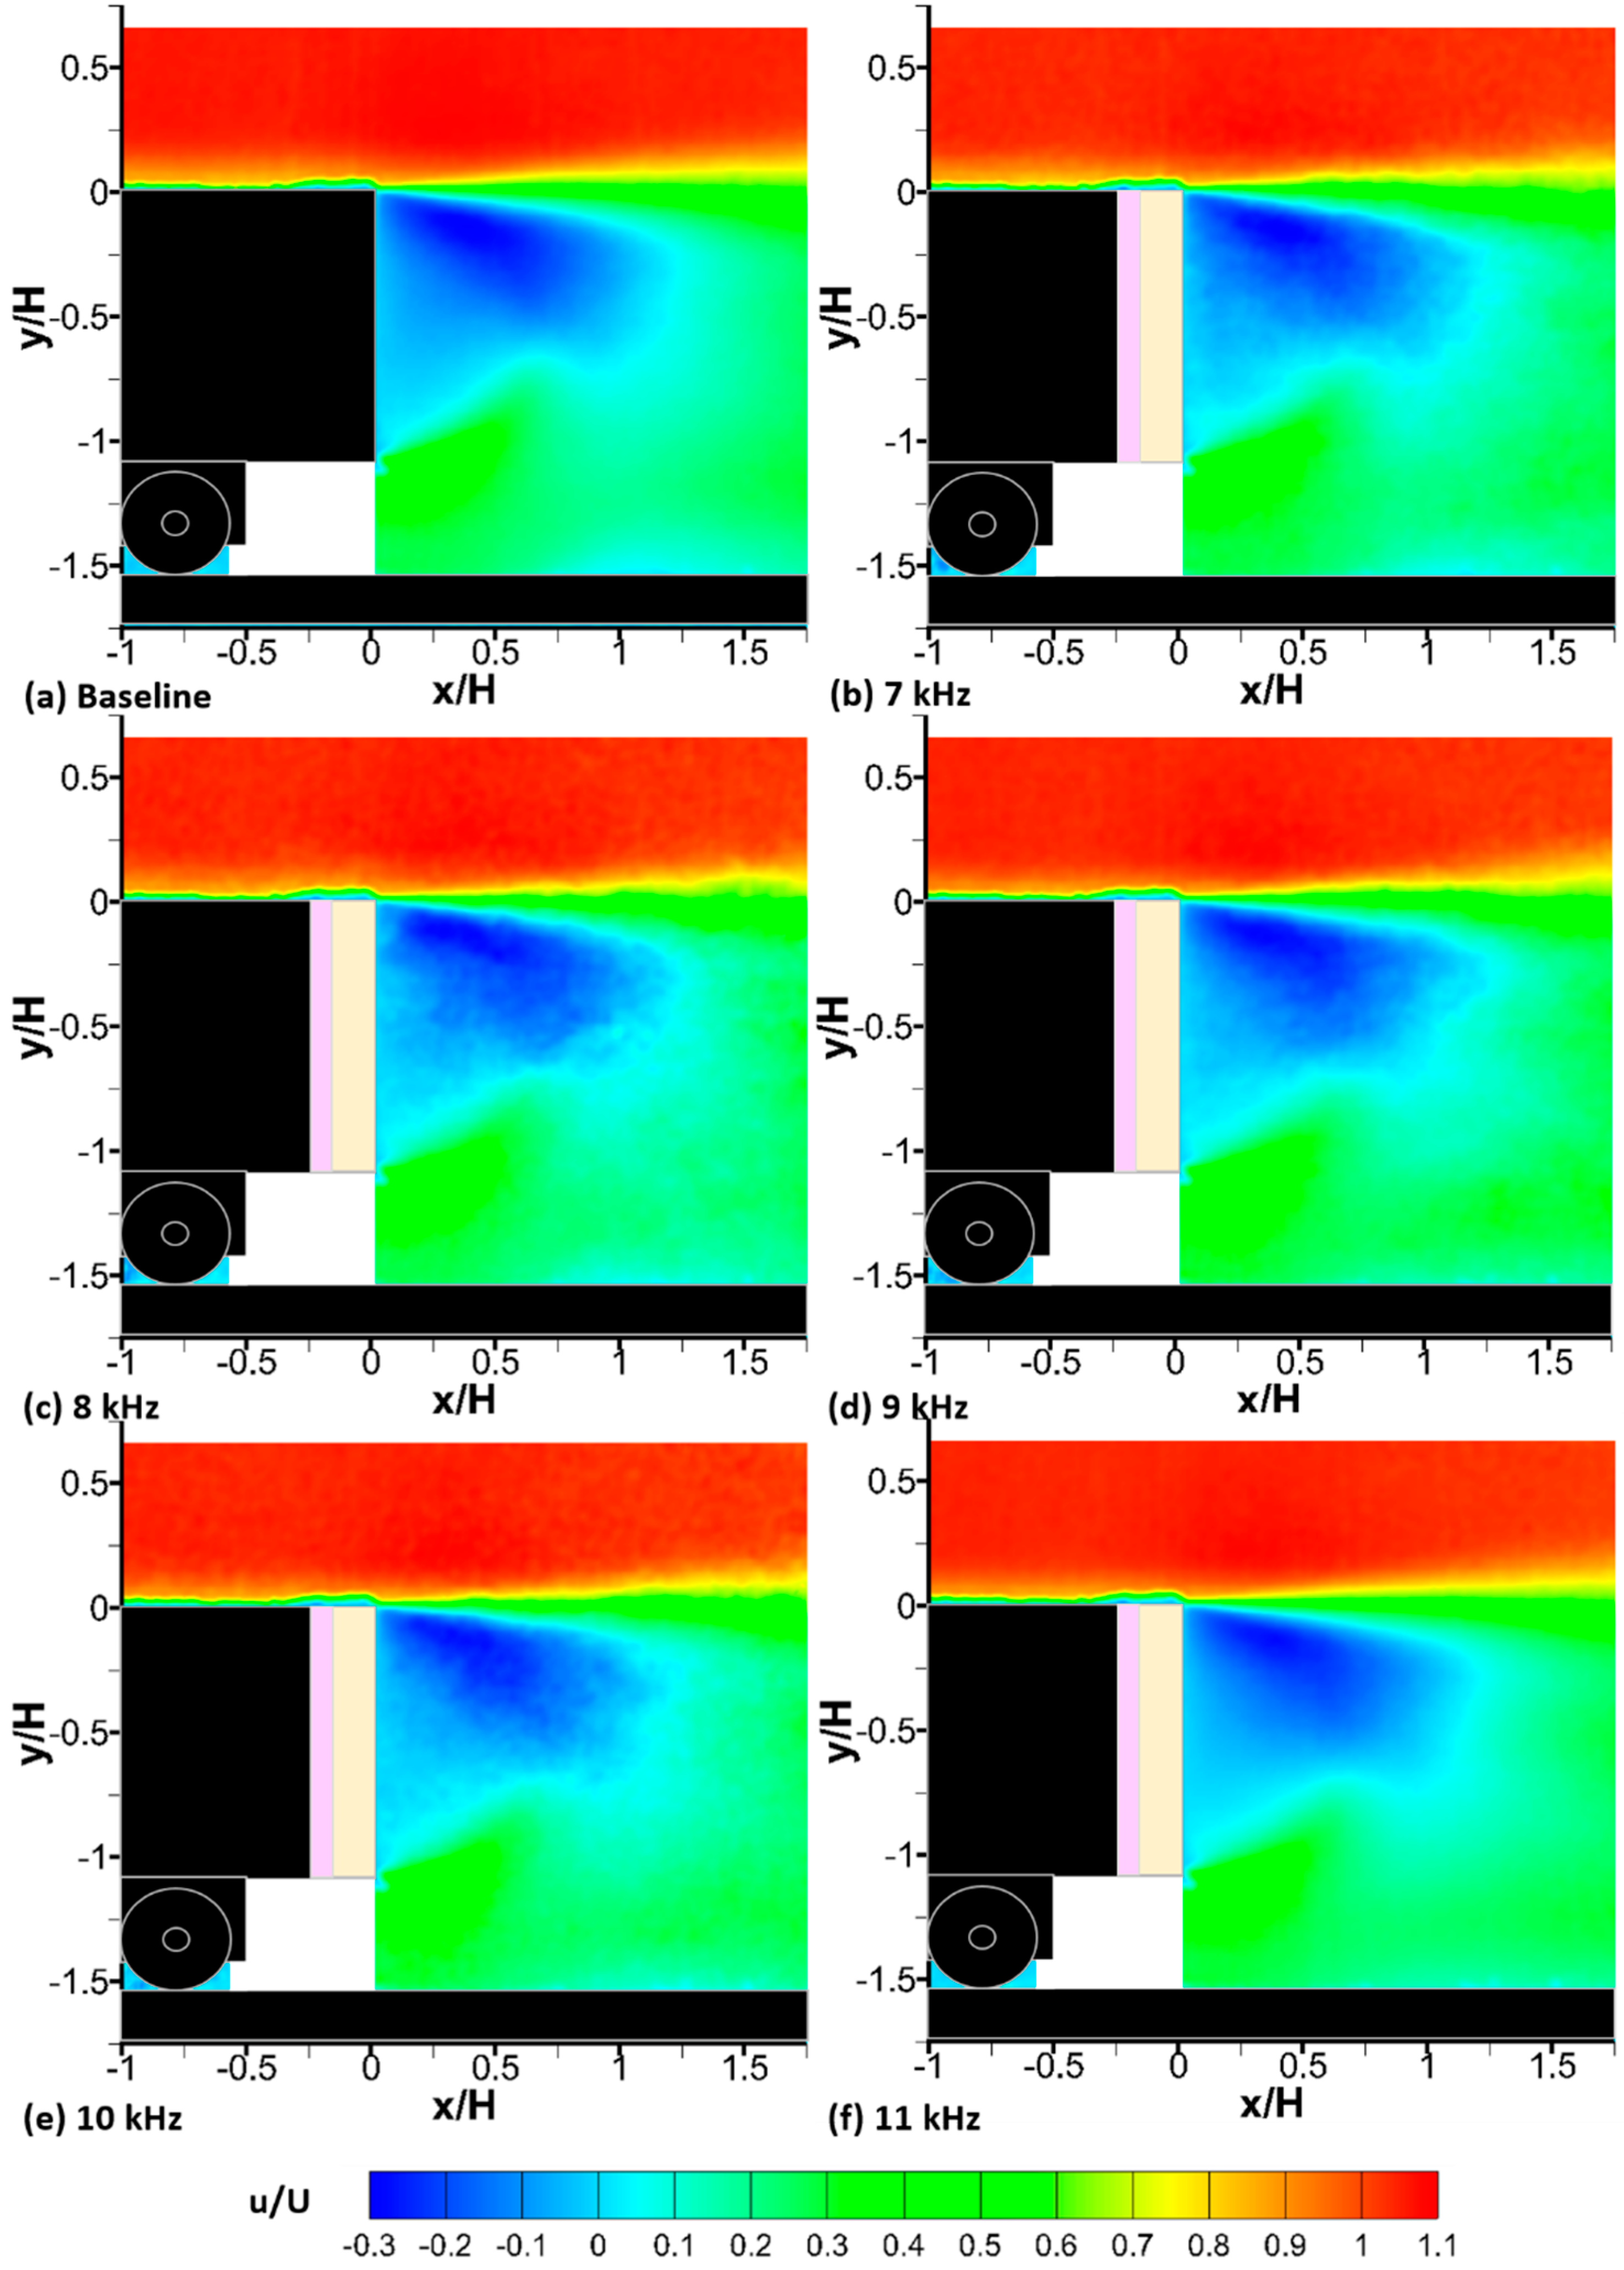
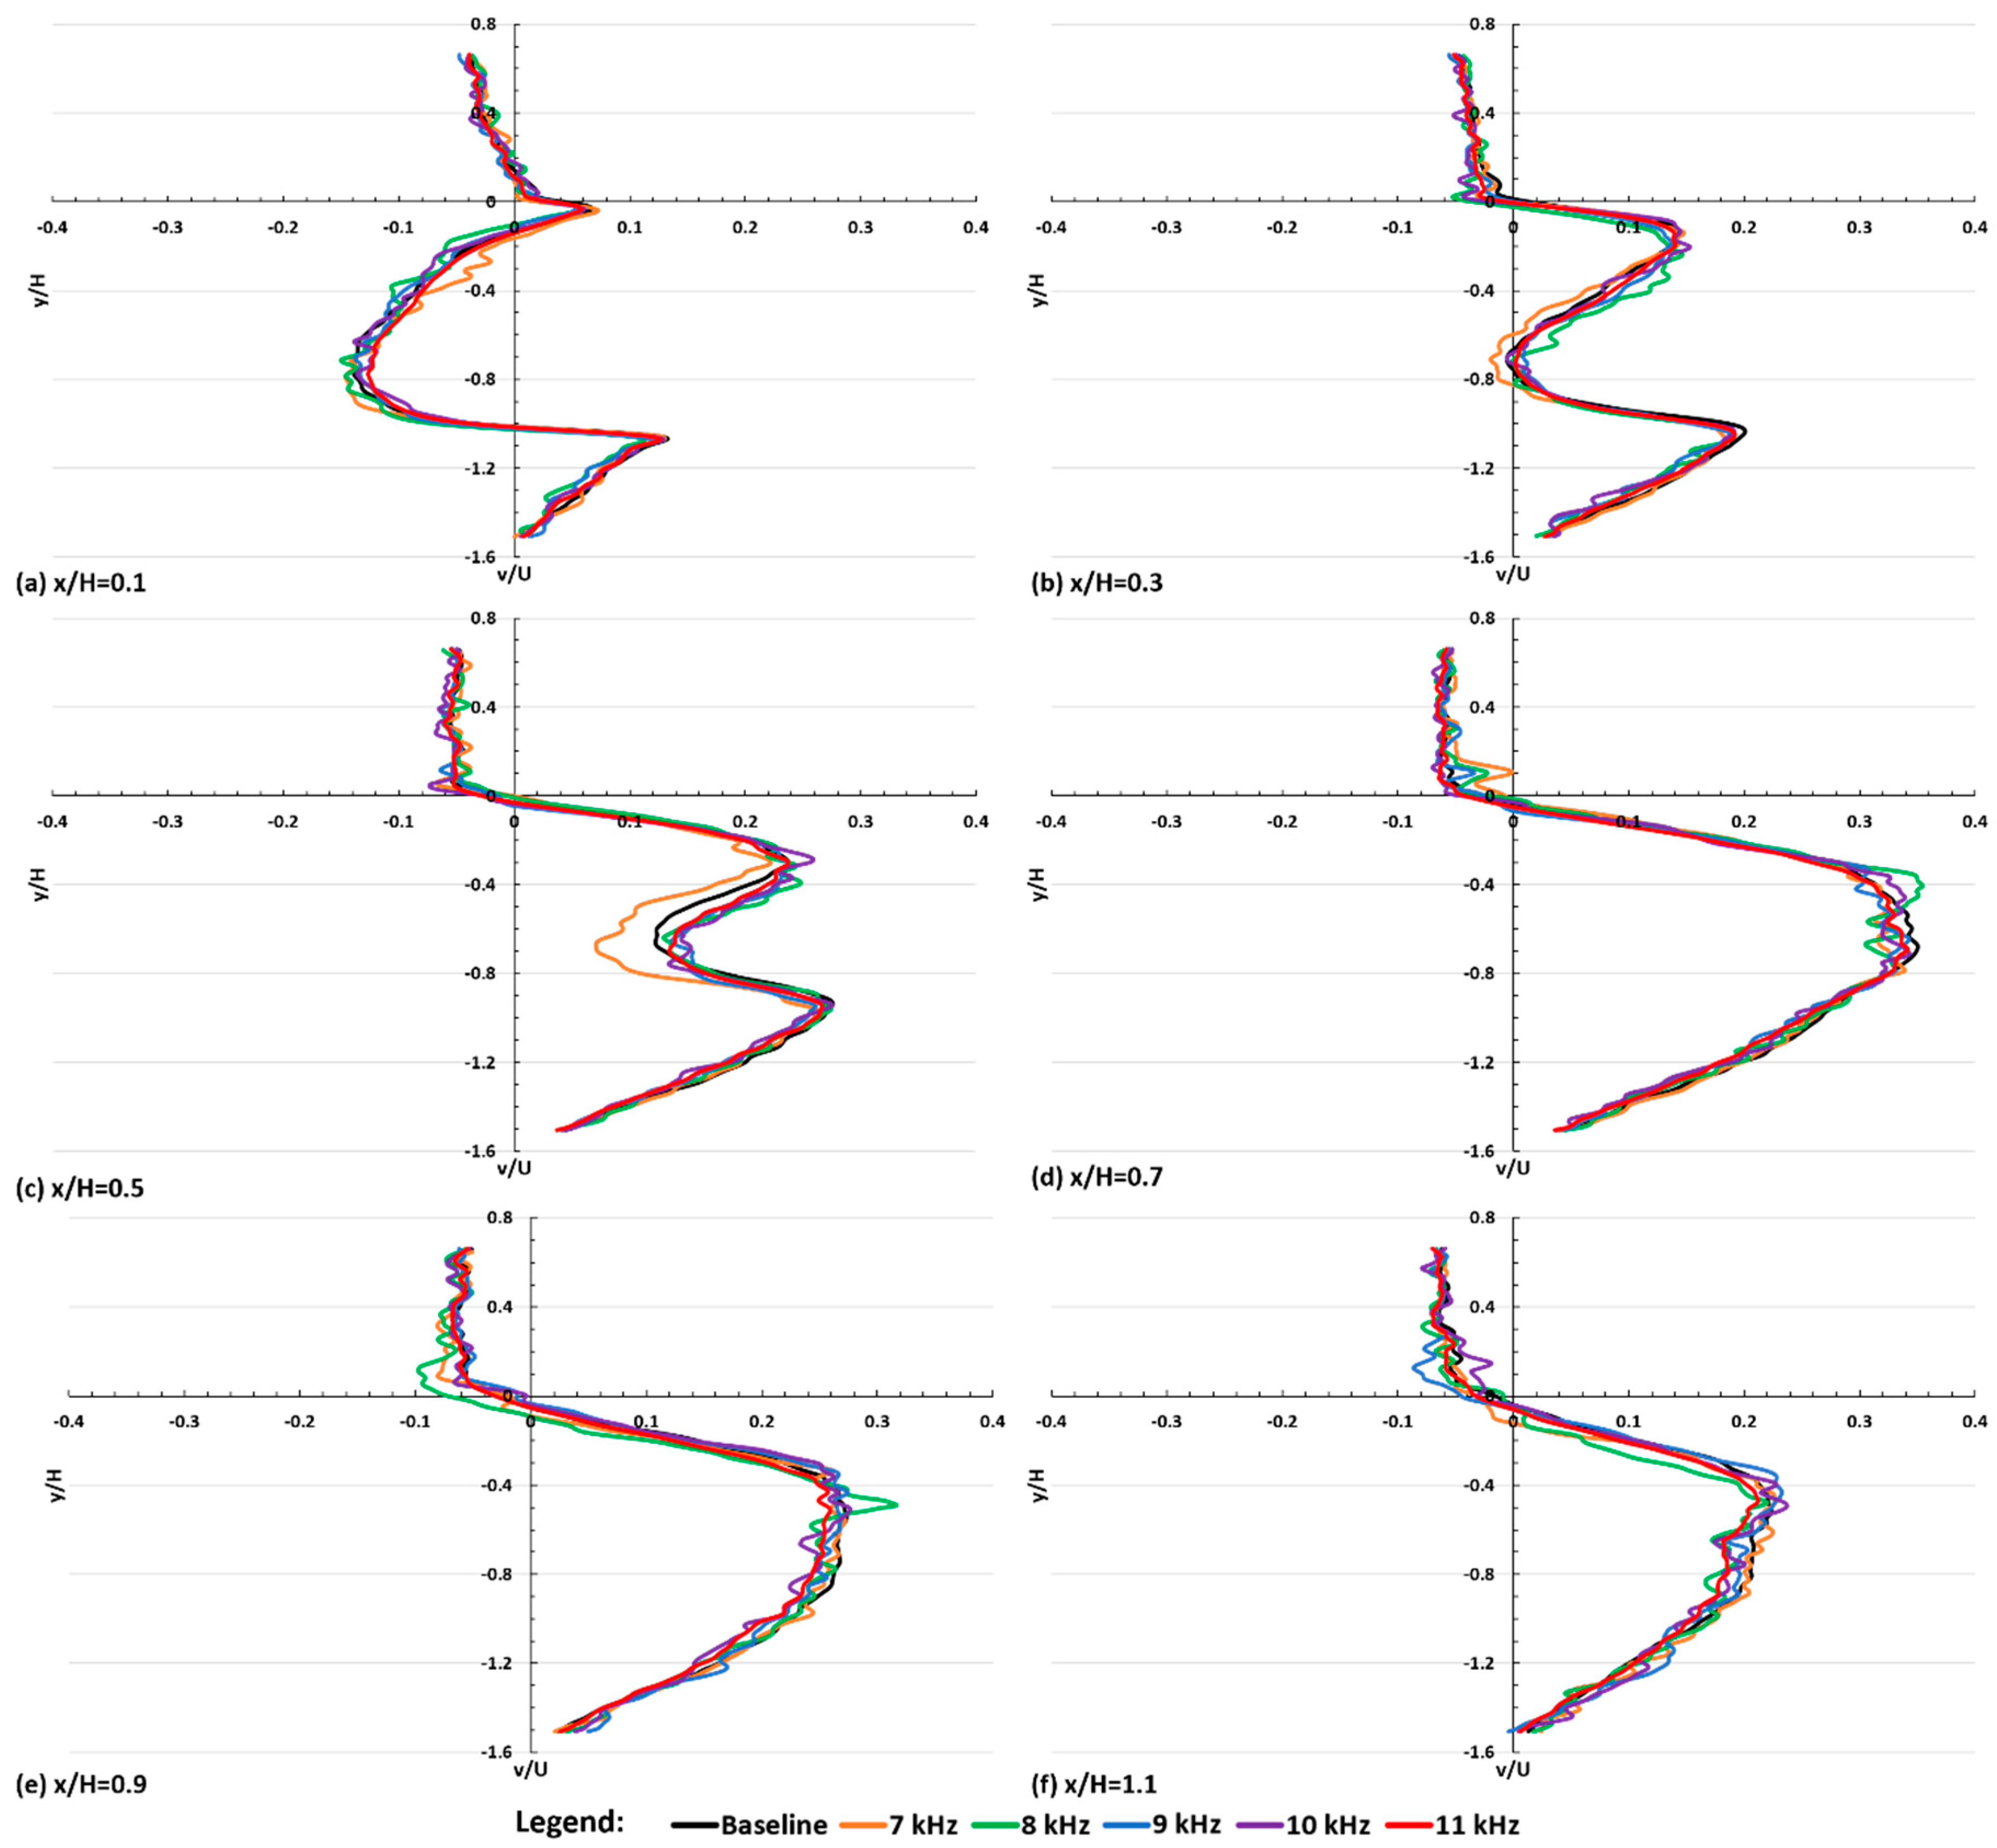
3.2.2. Time-Averaged Velocity Field

The effects of using the linear AC-DBD plasma actuation to manipulate the flow characteristics along the wake region is considered in this section. Figure 8 shows the streamtraces and the normalised velocity magnitude contour (|U|/U) downstream of the trailer rear end.
In the baseline trailer (Figure 8a), a large recirculating bubble appears downstream of the trailer rear end due to the coil up of the lower shear layer which emanates from the trailer’s underbody. The core of this vortex is located at the normalised location x/H = 0.3 and y/H = −0.25. The size of this recirculating bubble is about 0.8 H (length) and 1.4 H (height) which is comparable to that shown in Lo and Kontis in [30]. When implementing the linear AC-DBD plasma actuation, regardless of the actuation frequency, no significant change in the flow pattern is observed downstream of the trailer rear end. However, when the plasma actuation frequency is increased to 8 (Figure 8c) and 9 kHz (Figure 8d), the upper shear layer is deflected more downward in the region between 0.5 < x/H < 1.75 compared to that of the baseline trailer. In fact, the upper shear layer is deflected marginally more downwards when the actuation frequency is 8 kHz (Figure 8c) than when it is 9 kHz (Figure 8b). Further increases in the plasma actuation frequency to 10 (Figure 8e) and 11 kHz (Figure 8f) shows no additional effect on the shear layer deflection as the shear layer angle in these two cases is similar to that of the baseline case.
The extent of the upper shear layer deflection with and without plasma actuation was quantified by measuring the average shear layer angle relative to the freestream direction downstream of the trailer rear end, and are compared as shown in Figure 9. From Figure 9, it can be seen that when the plasma actuation frequency is 8 kHz, the shear layer was deflected the most downwards followed by the frequency at 9 Hz. The stronger shear layer deflection downwards in these two cases is likely to be caused by the strong plasma-induced jet generated at these two actuation frequencies. In contrast, when the actuation frequency is at 7, 10, and 11 kHz, the angle of the shear layer relative to the freestream direction becomes similar to that shown in the baseline trailer (i.e., no plasma actuation).
Normalised velocity contour and profiles in the x-direction (u/U) along the wake region of the articulate lorry model are presented in Figure 10 and Figure 11, respectively. From Figure 10a–f, it is clear that very similar normalised x-velocity contour appeared in all cases being studied. No observable differences could be noticed from these velocity contour graphs. In fact, similar conclusions could also be drawn if the normalised velocity profiles along the wake region in the x-direction are considered. From Figure 11, it can be seen that very similar normalised x-velocity profiles appeared between −0.8 < y/H < 0.5 in all cases being studied. This further indicated that the linear AC-DBD plasma actuation could not exert any observable effects in altering the size of the recirculating bubble and the magnitude of the reverse flow in the wake region.
In contrast, some interesting phenomena could be observed when considering the normalised y-velocity contours (v/U) shown in Figure 12. From Figure 12, a region that shows considerably high levels of positive y-velocity (i.e., strong upward flow movement) appears between 0.25 < x/H < 1.5 and −1.25 < y/H < −0.25. The length and height of this region in the baseline trailer are 1.2 H and 1.1 H, respectively (Figure 12a). However, when the linear AC-DBD plasma actuation is implemented and the actuation frequency is at 7, 8, 9, and 11 kHz (Figure 12b–d,f); the size of this region is slightly smaller than that presented in the baseline trailer. This indicates that with these plasma actuation frequencies, the strong upward flow movement in the wake region is confined to a smaller area. Surprisingly, the size of this region is the largest when the actuation frequency is 10 kHz (Figure 12e) amongst all cases being studied. This could explain why the shear layer points the least downward when the actuation frequency is 10 kHz (Figure 9).
Figure 13 shows the normalised y-velocity profiles measured at various normalised x-locations between 0.1 < x/H < 1.1 along the wake region of the trailer model. At x/H = 0.1 (Figure 13a), it can be seen that the normalised y-velocity profiles in the region between −0.8 < y/H < 0 (i.e., the beginning of the recirculating bubble) are very similar in all the cases. This suggests that using the linear AC-DBD plasma actuation could only exert limited effects in changing the flow velocity in the y-direction at this location. At x/H = 0.3 and an actuation frequency of 7 kHz (Figure 13b), the normalised y-velocity in the region between 0.2 < y/H < 0.8 (i.e., the middle of the recirculating bubble) is slightly lower than that shown in the baseline trailer. In contrast, slightly higher normalised y-velocity could be observed at the same region when the actuation frequency is 8 kHz compared to that shown in the baseline trailer.
Some changes in the normalised velocity in the y-direction occurred further downstream of the trailer rear end. At x/H = 0.5 (Figure 13c), the lowest normalised y-velocity appears when the actuation frequency is 7 kHz compared to all other cases being studied. Similar levels of normalised y-velocity appeared at the same region for all other actuation frequencies and are always slightly higher than those shown in the baseline trailer. This suggests that at this location, the linear AC-DBD plasma actuation induces stronger upward flow movement in the wake region with the exception of when the actuation frequency is 7 kHz. In contrast, lower levels of normalised y-velocity could be observed between −0.4 < y/H < −1 in all the trailers with the linear AC-DBD plasma actuation being implemented at the normalised locations x/H = 0.7 (Figure 13d) and 0.9 (Figure 13e). This indicated that the linear AC-DBD plasma actuation, regardless of its actuation frequency, induces weaker upward flow movement in the wake region at these two locations. Finally, at x/H = 1.1 (Figure 13f), the normalised y-velocity profiles become very similar in all cases being studied.

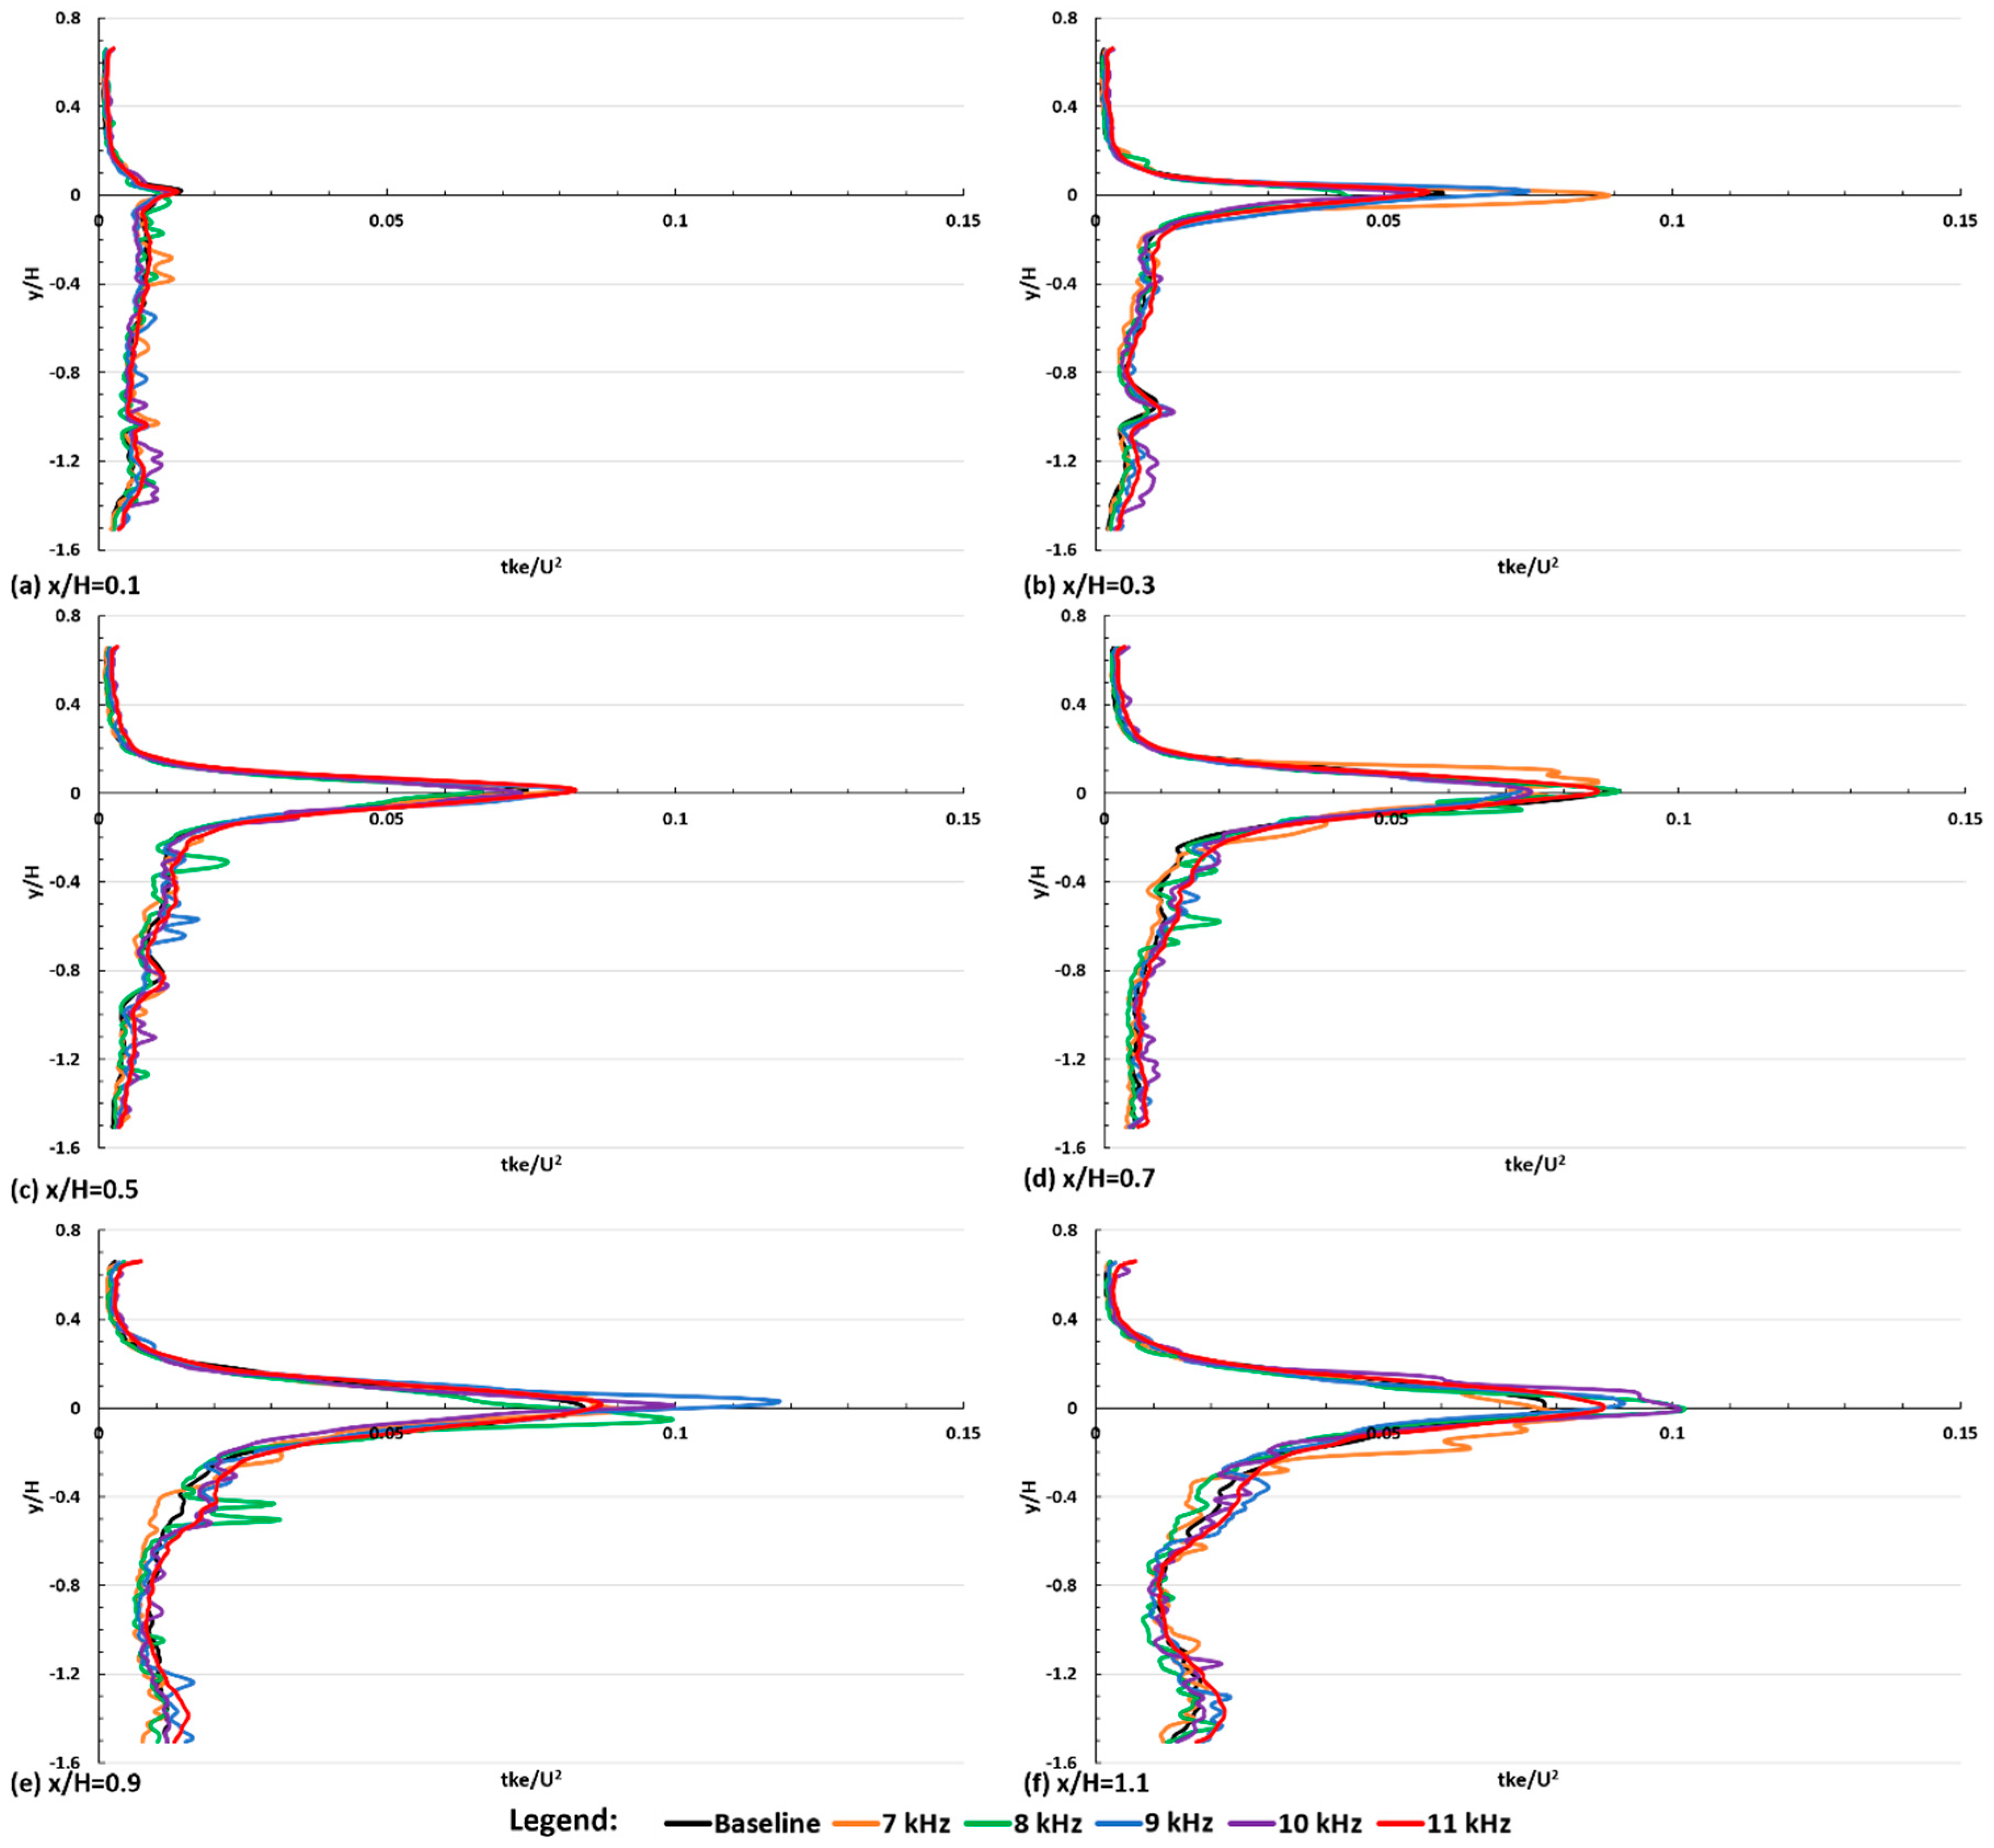
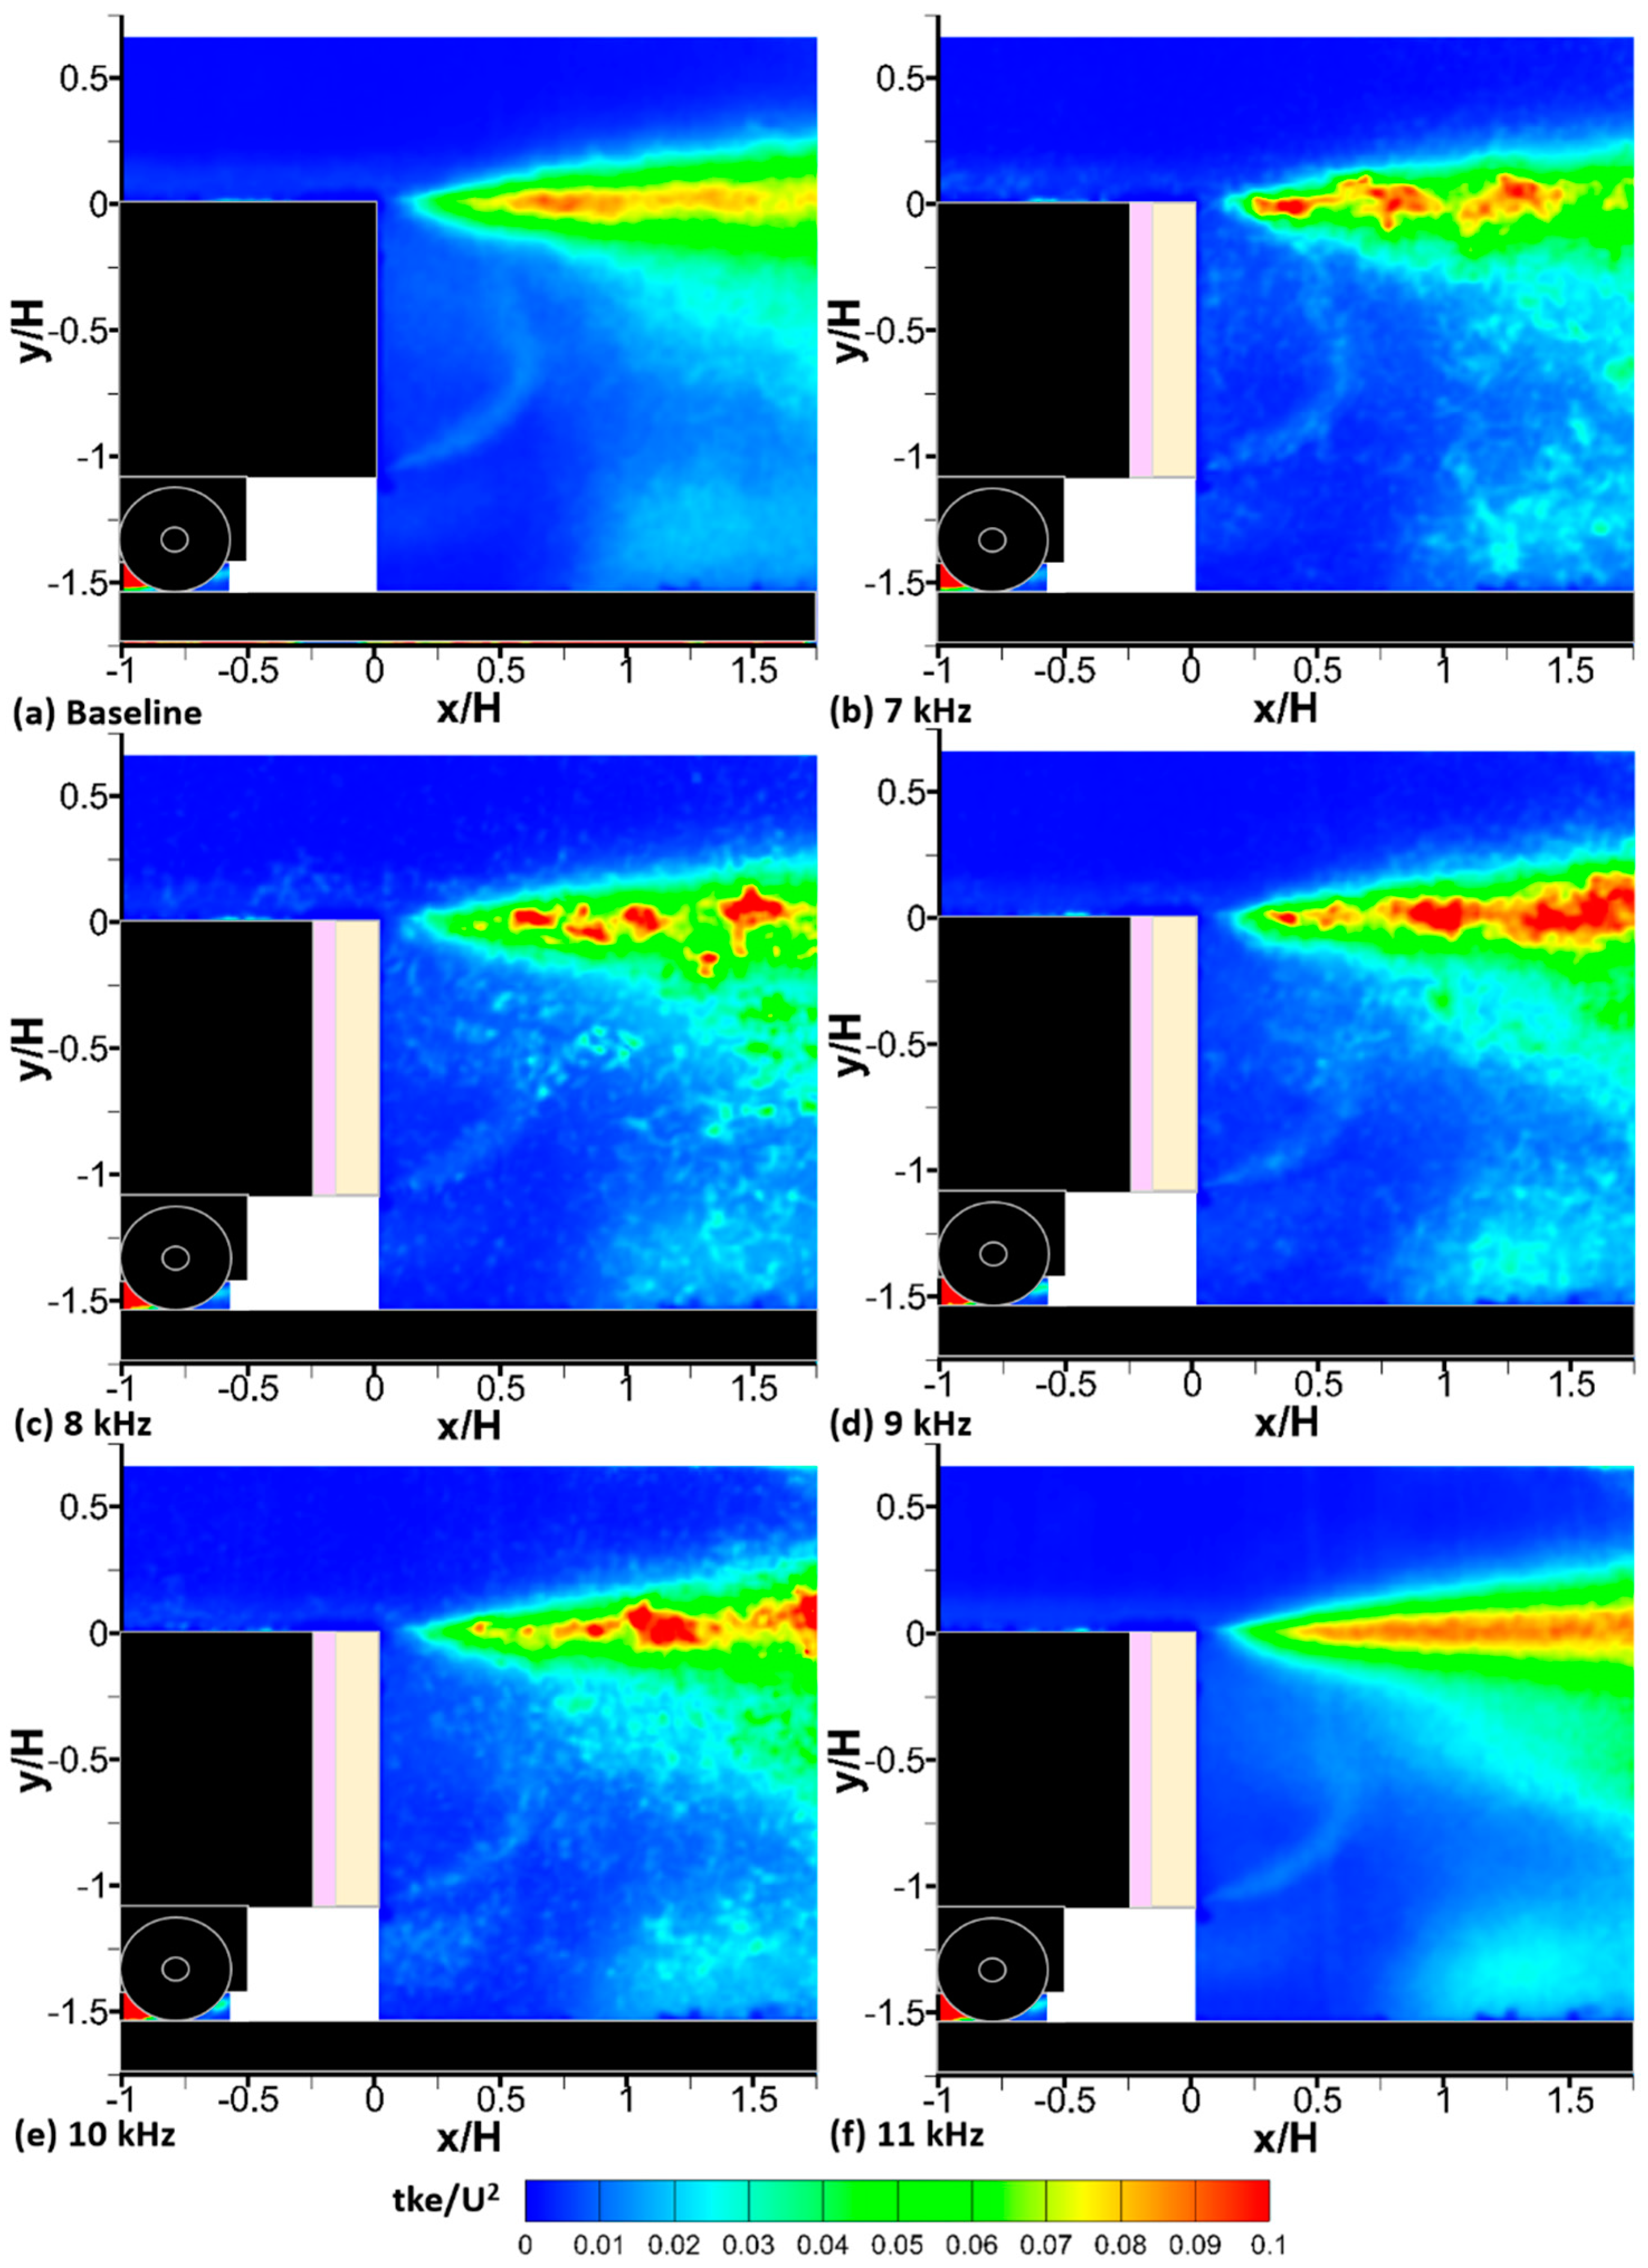
3.2.3. Flow Steadiness and Turbulence

Flow turbulence along the wake region of the trailer model is measured in the form of the normalised turbulence kinetic energy (tke/U2) contour, and is shown in Figure 14. In general, considerably high levels of turbulence kinetic energy appear along the upper shear layer in all cases being studied. In contrast, the turbulence kinetic energy levels remain relatively low in the region at which the recirculating bubble is present (i.e., between 0 < x/H < 0.8 and −1.5 < y/H < 0). From Figure 14, it is clear that using the linear AC-DBD plasma actuation at the trailer rear end changes the turbulence kinetic energy levels along the upper shear layer. In the baseline trailer (Figure 14a), moderate levels of turbulence kinetic energy occur along the upper shear layer in the region −0.1 < y/H < 0.1. When the linear AC-DBD plasma actuation is implemented, at 7 kHz (Figure 14b), higher levels of normalised turbulence kinetic energy could be observed along the upper shear layer compared to that shown in the baseline trailer. The levels of turbulence kinetic energy increase further by increasing the actuation frequency to 8 (Figure 14c) and 9 kHz (Figure 14d). Further increasing the actuation frequency to above 9 kHz reduces the turbulence kinetic energy levels along the upper shear as shown in Figure 14e,f for the plasma actuation frequencies of 10 and 11 kHz, respectively.
An interesting observation should be pointed out here. In Figure 14, it can be seen that a pattern of alternative high and low levels of turbulence intensity occurs in the shear layer in those cases with the linear AC-DBD plasma actuation being implemented. This phenomenon is particularly prominent at 7 (Figure 14b) and 8 kHz (Figure 14c). Since the presented contours are averaged over 2400 instantaneous PIV snapshots, the appearance of this alternative high and low turbulence intensity regions in the shear layer suggest that the acquisition rate of the PIV images corresponded to some significant frequency in the flow field. To be exact, it suggests that the linear AC-DBD plasma actuation induces a frequency in the flow. It is speculated that this frequency induced by the linear AC-DBD plasma actuation in the flow field leads to the occurrence of the increase of the flow unsteadiness in the flow field. Further investigations by employing time-resolved non-intrusive measurements are required to understand these phenomena in the presence of plasma actuation, and its effects on the overall wake flow and drag.
In fact, the turbulence kinetic energy levels along the wake region could be further quantified by plotting the normalised turbulence kinetic energy profiles at various locations along the wake region as shown in Figure 15. From Figure 15, it can be seen that in the region between −1.5 < y/H < −0.2 (i.e., below the upper shear layer), turbulence kinetic energy profiles are very similar at the locations x/H = 0.1, 0.3, 0.5, and 0.7 in all cases being studied. However, stronger fluctuation of the turbulence kinetic energy levels in the recirculating bubble (i.e., the region between 0 < x/H < 0.8 and −1.2 < y/H < −0.2) is observed in those trailers with the linear AC-DBD plasma actuation being implemented. This could be confirmed by observing Figure 14a,c,d at the locations x/H = 0.1, 0.5, and 0.7, respectively.
Further downstream of the trailer rear end, at x/H = 0.9 (Figure 15e) and 1.1 (Figure 15f), the fluctuation of the turbulence kinetic energy levels is even stronger between −1.5 < y/H < 0.4 (i.e., below the upper shear layer) in those trailers with the linear AC-DBD plasma actuation being implemented. The linear AC-DBD plasma actuation generally increases the turbulence kinetic energy levels along the upper shear layer compared to that of the baseline trailer. This can be confirmed by observing the normalised turbulence kinetic energy levels at y/H = 0 at the locations between 0.3 < x/H < 1.1 shown in Figure 15b–f.

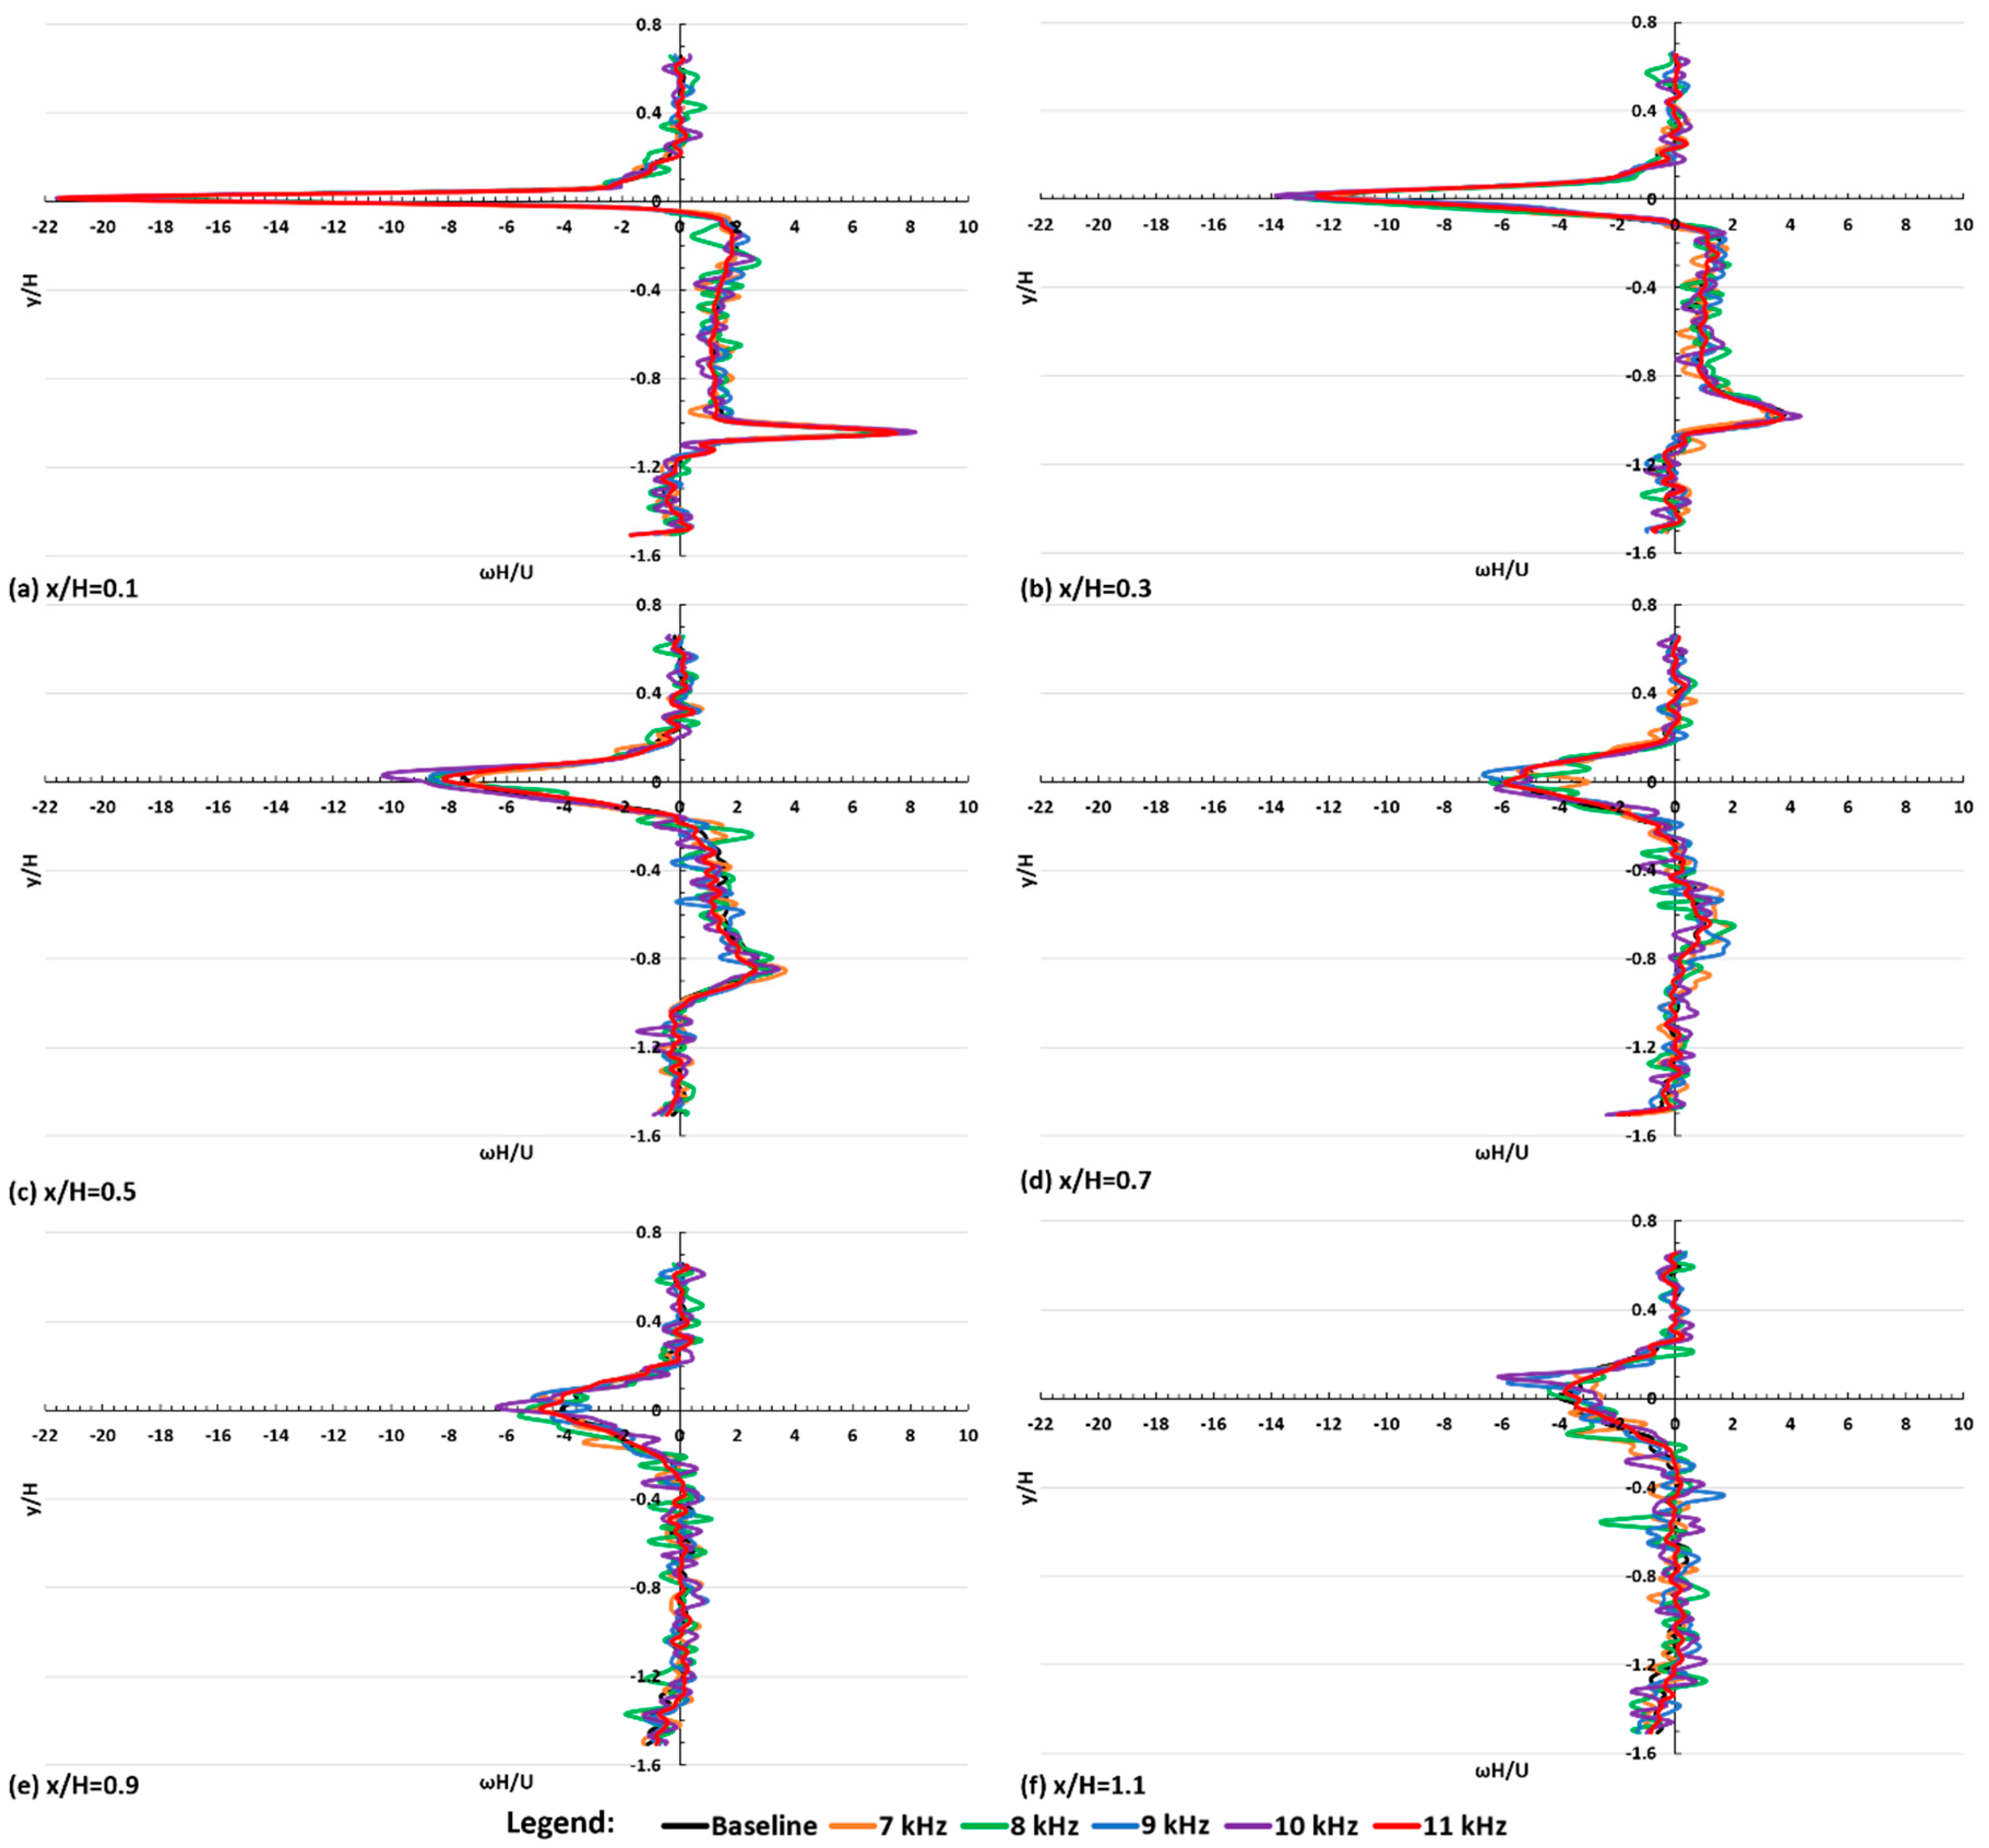
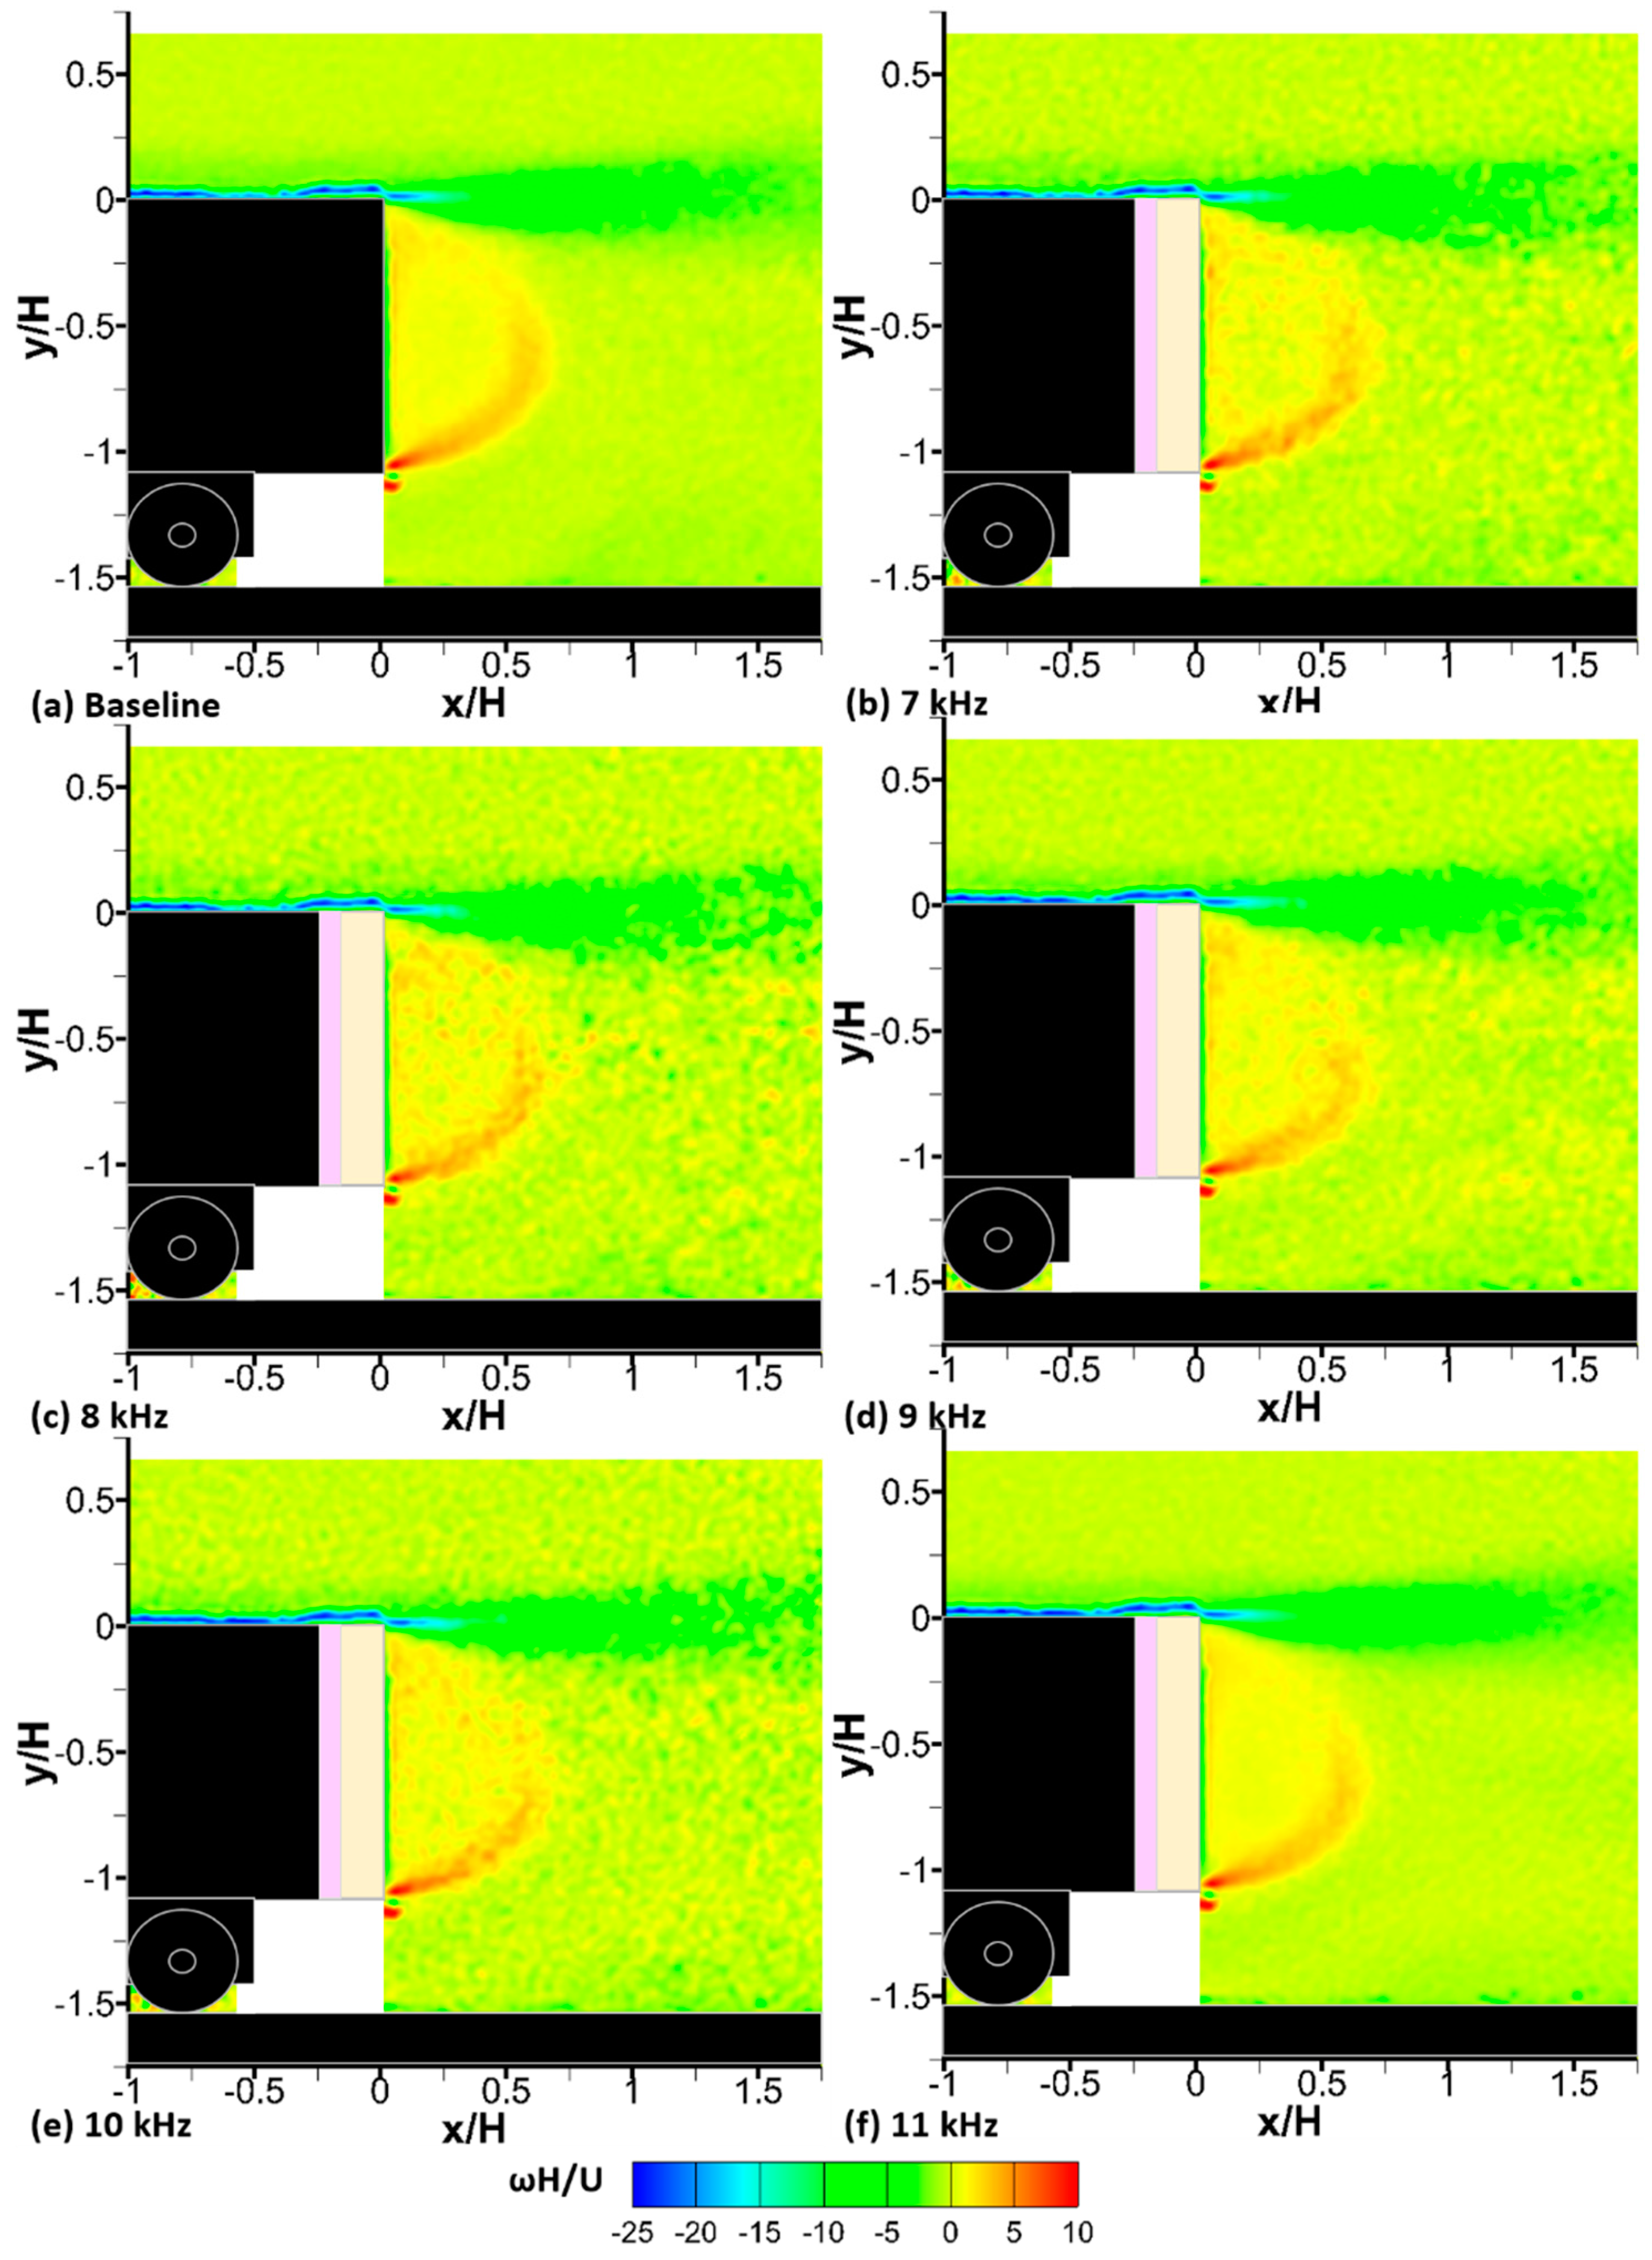
3.2.4. Flow Vorticity

The normalised z-vorticity contour (ωH/U) downstream of the rear end of the trailer model is displayed in Figure 16. In the baseline trailer (Figure 16a), considerably high levels of positive z-vorticity appear in the recirculating bubble. In those cases with the linear AC-DBD plasma actuator being implemented (Figure 16b–f), the z-vorticity contours remain similar to that shown in the baseline trailer (Figure 16a). This suggests that the linear AC-DBD plasma actuation exerts no obvious effect in altering the flow vorticity along the wake region downstream of the trailer rear end regardless of the actuation frequency being used.
Figure 17 shows the normalised z-vorticity profiles measured at various normalised locations downstream of the trailer rear end. From Figure 17, it can be seen that compared to the baseline trailer, using the linear AC-DBD plasma actuation at the rear end of a square-back trailer shows no obvious effects in changing the z-vorticity levels along the wake region below the upper shear layer (i.e., the region −1 < y/H < −0.3) at all the locations being studied (Figure 17a–f). In contrast, stronger vorticity fluctuation downstream of the trailer rear end occurred in those trailers with the linear AC-DBD plasma actuation being implemented. Interestingly, the only exception appears when the actuation frequency is at 11 kHz. At this actuation frequency, the z-vorticity profiles become similar to those shown in the baseline trailer at all the normalised x-locations being studied.

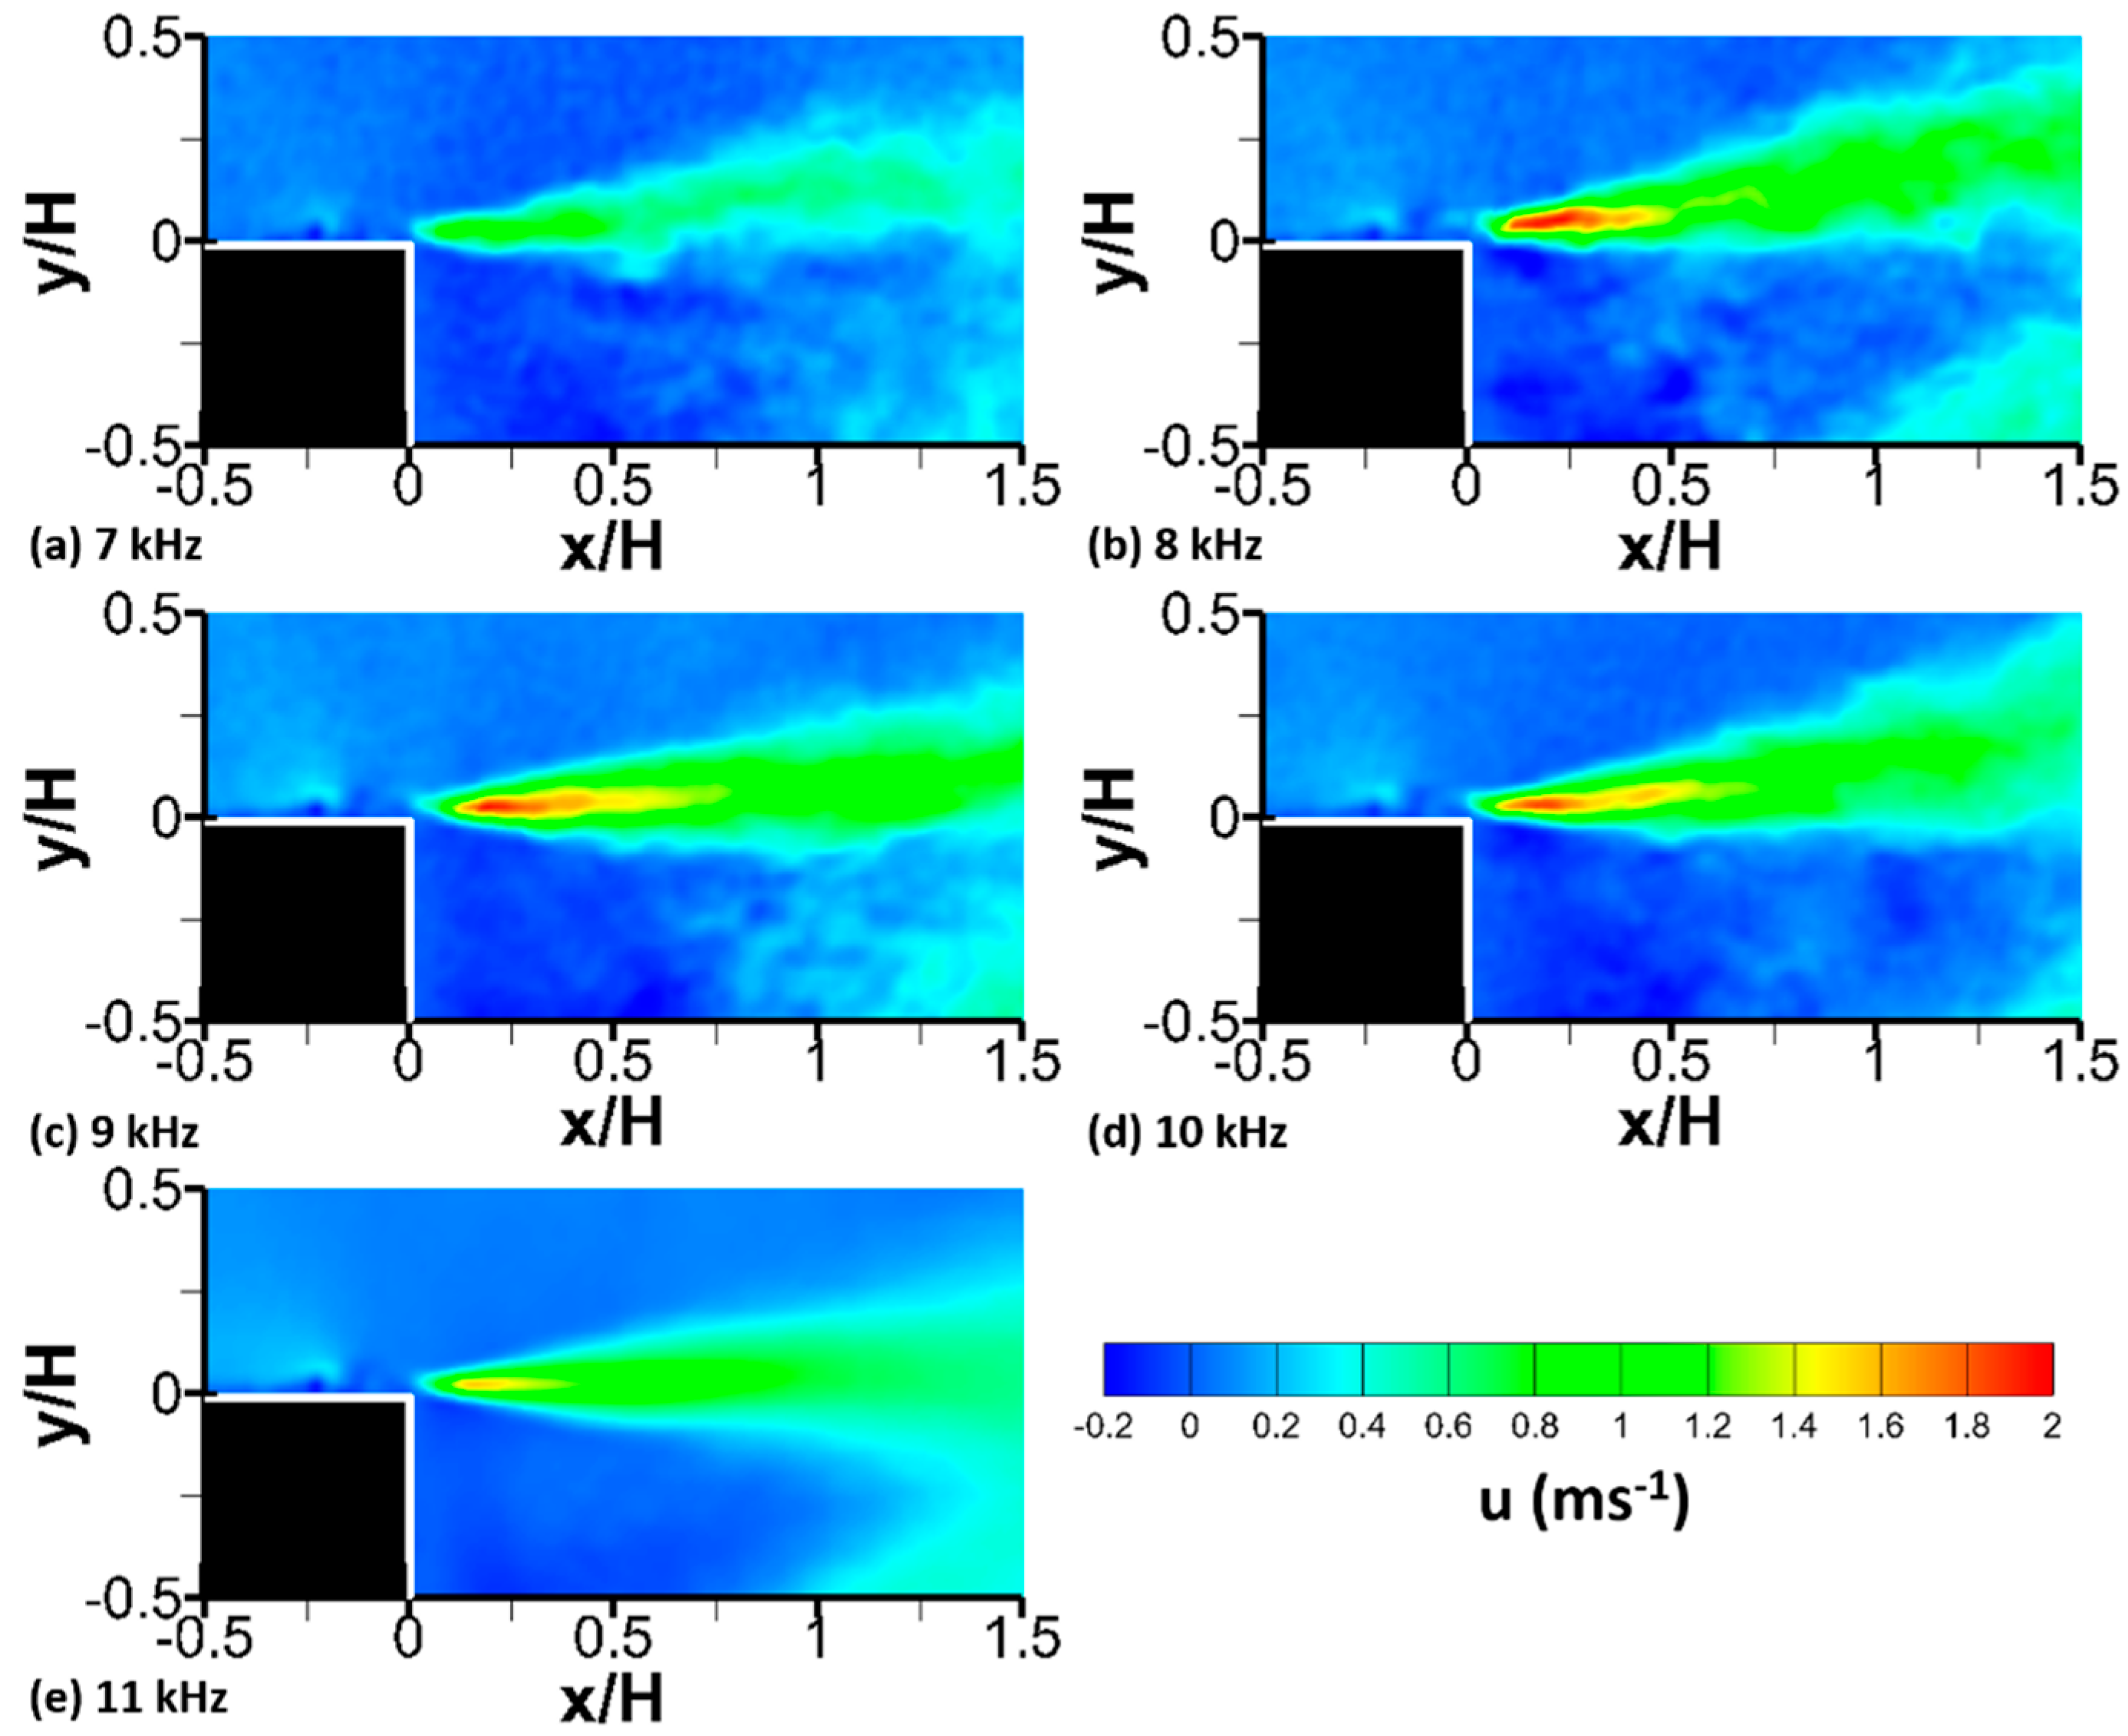
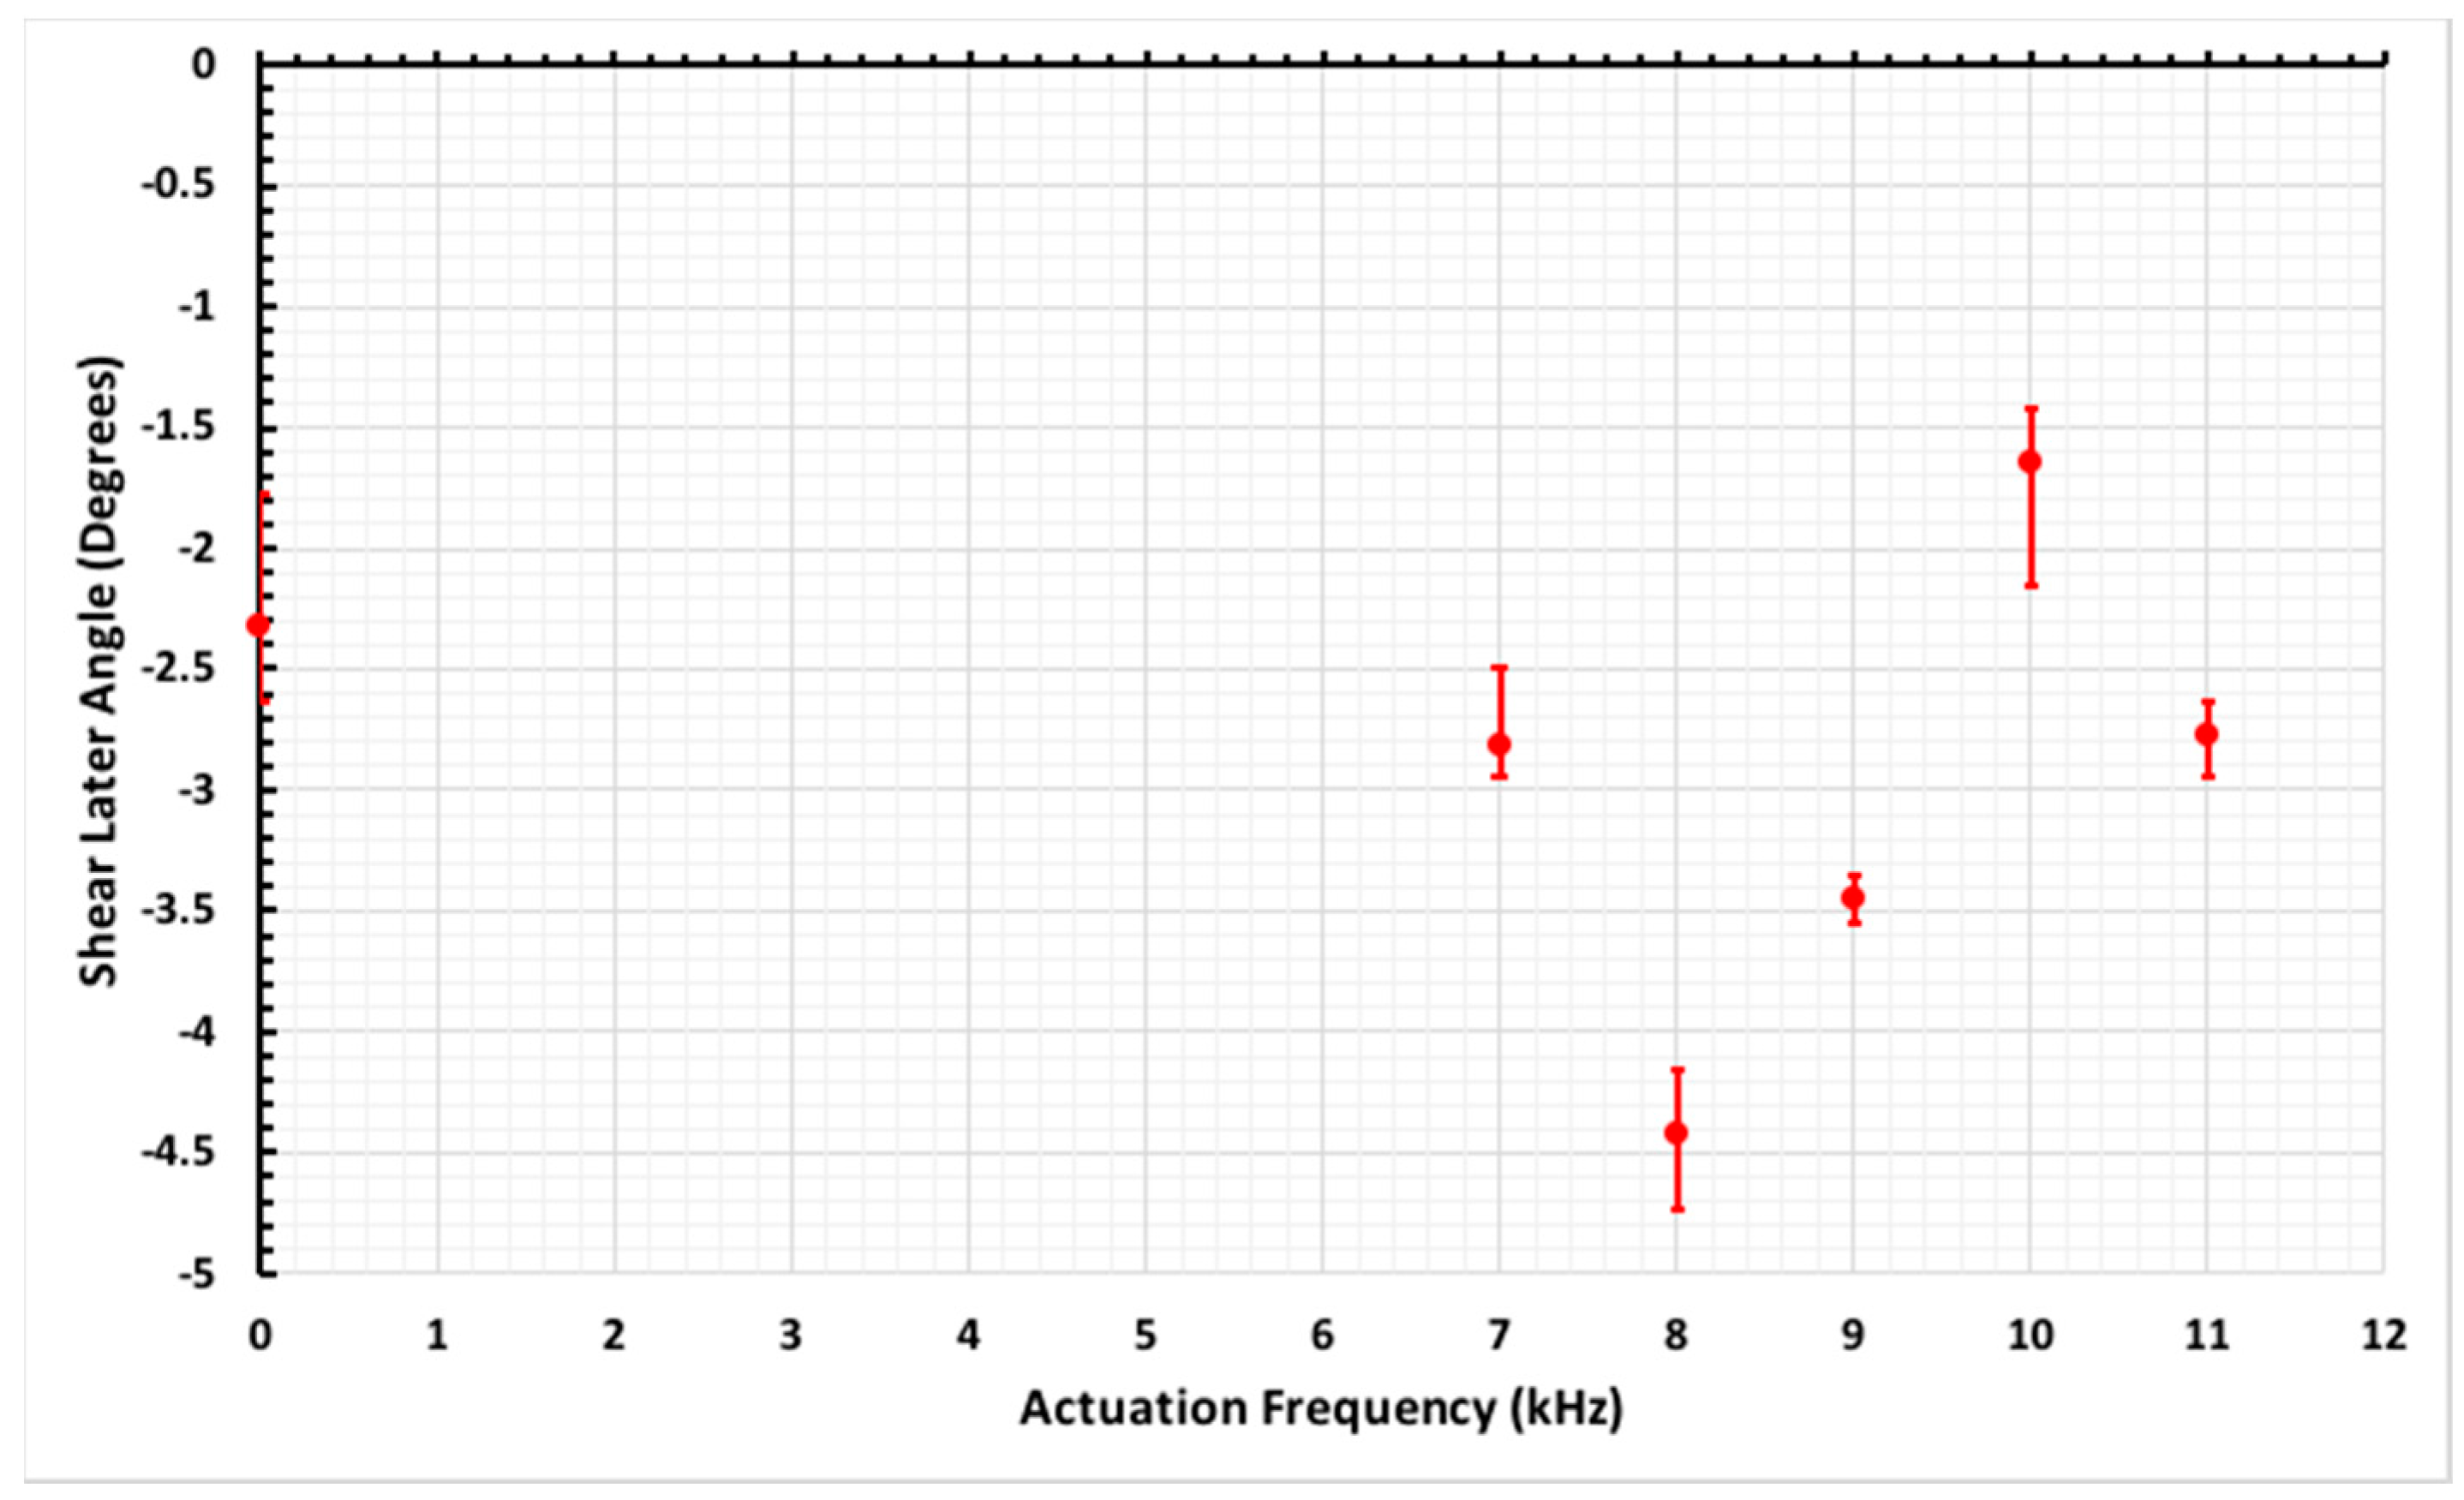
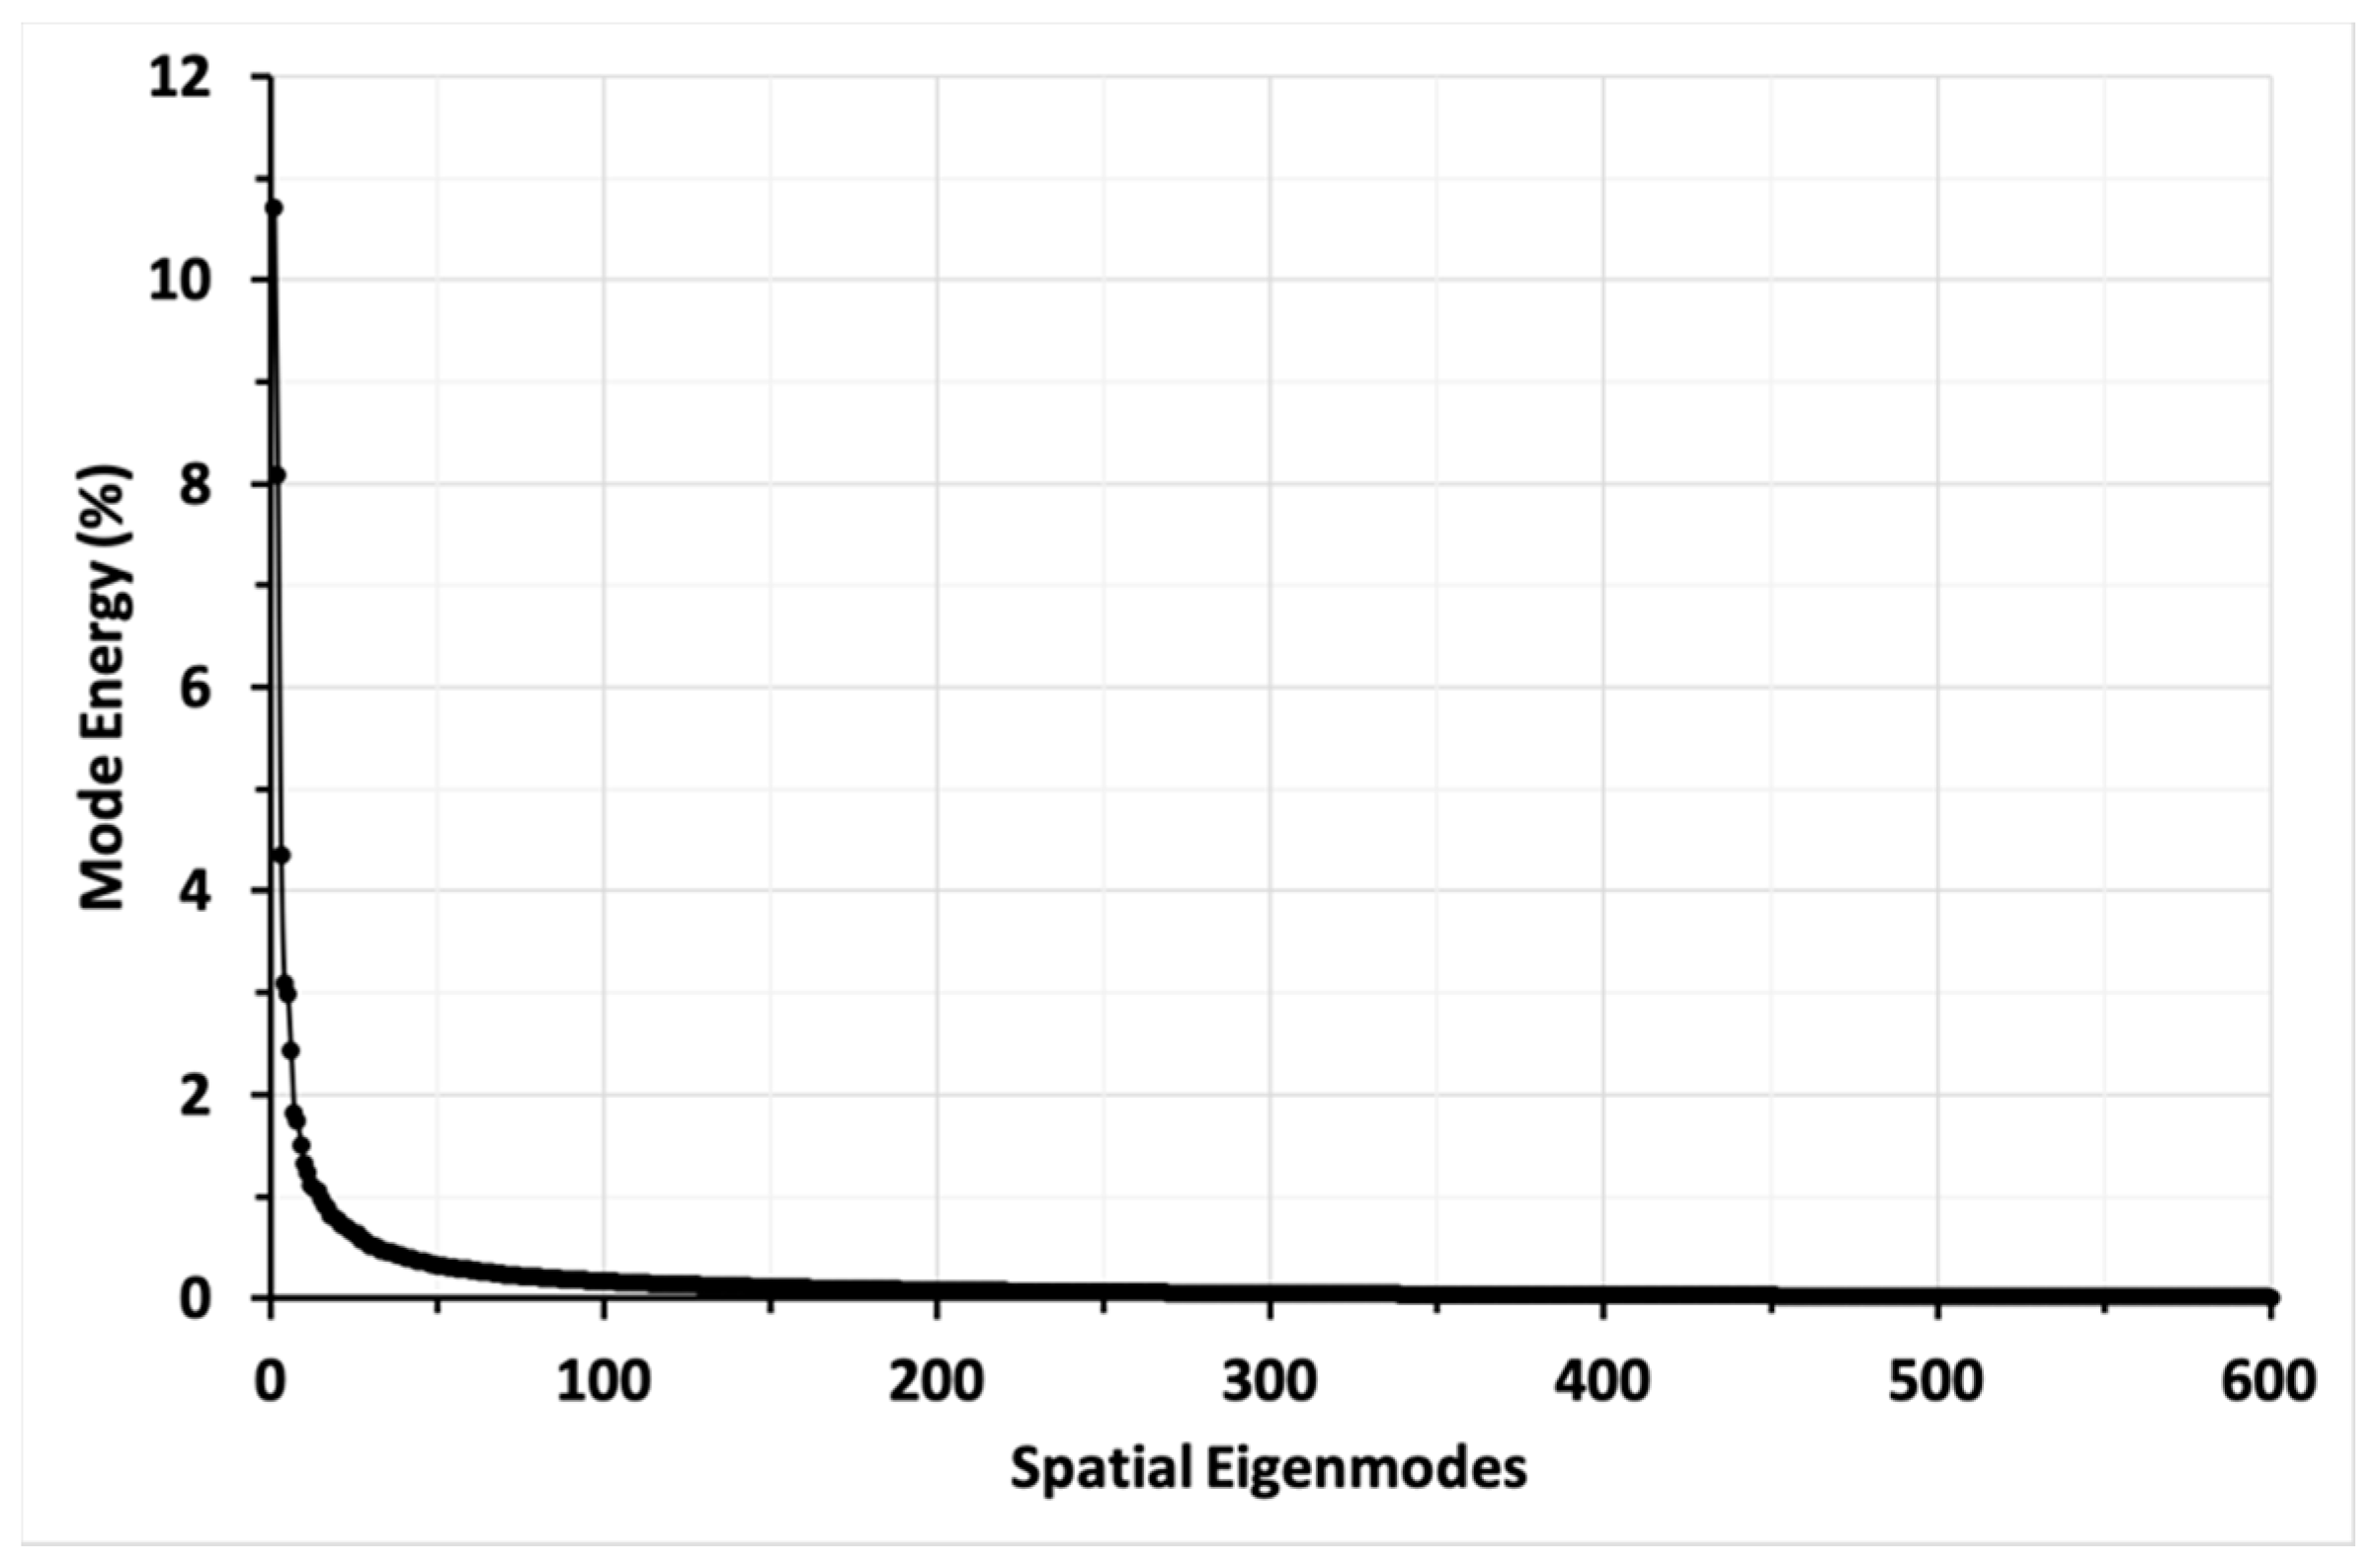
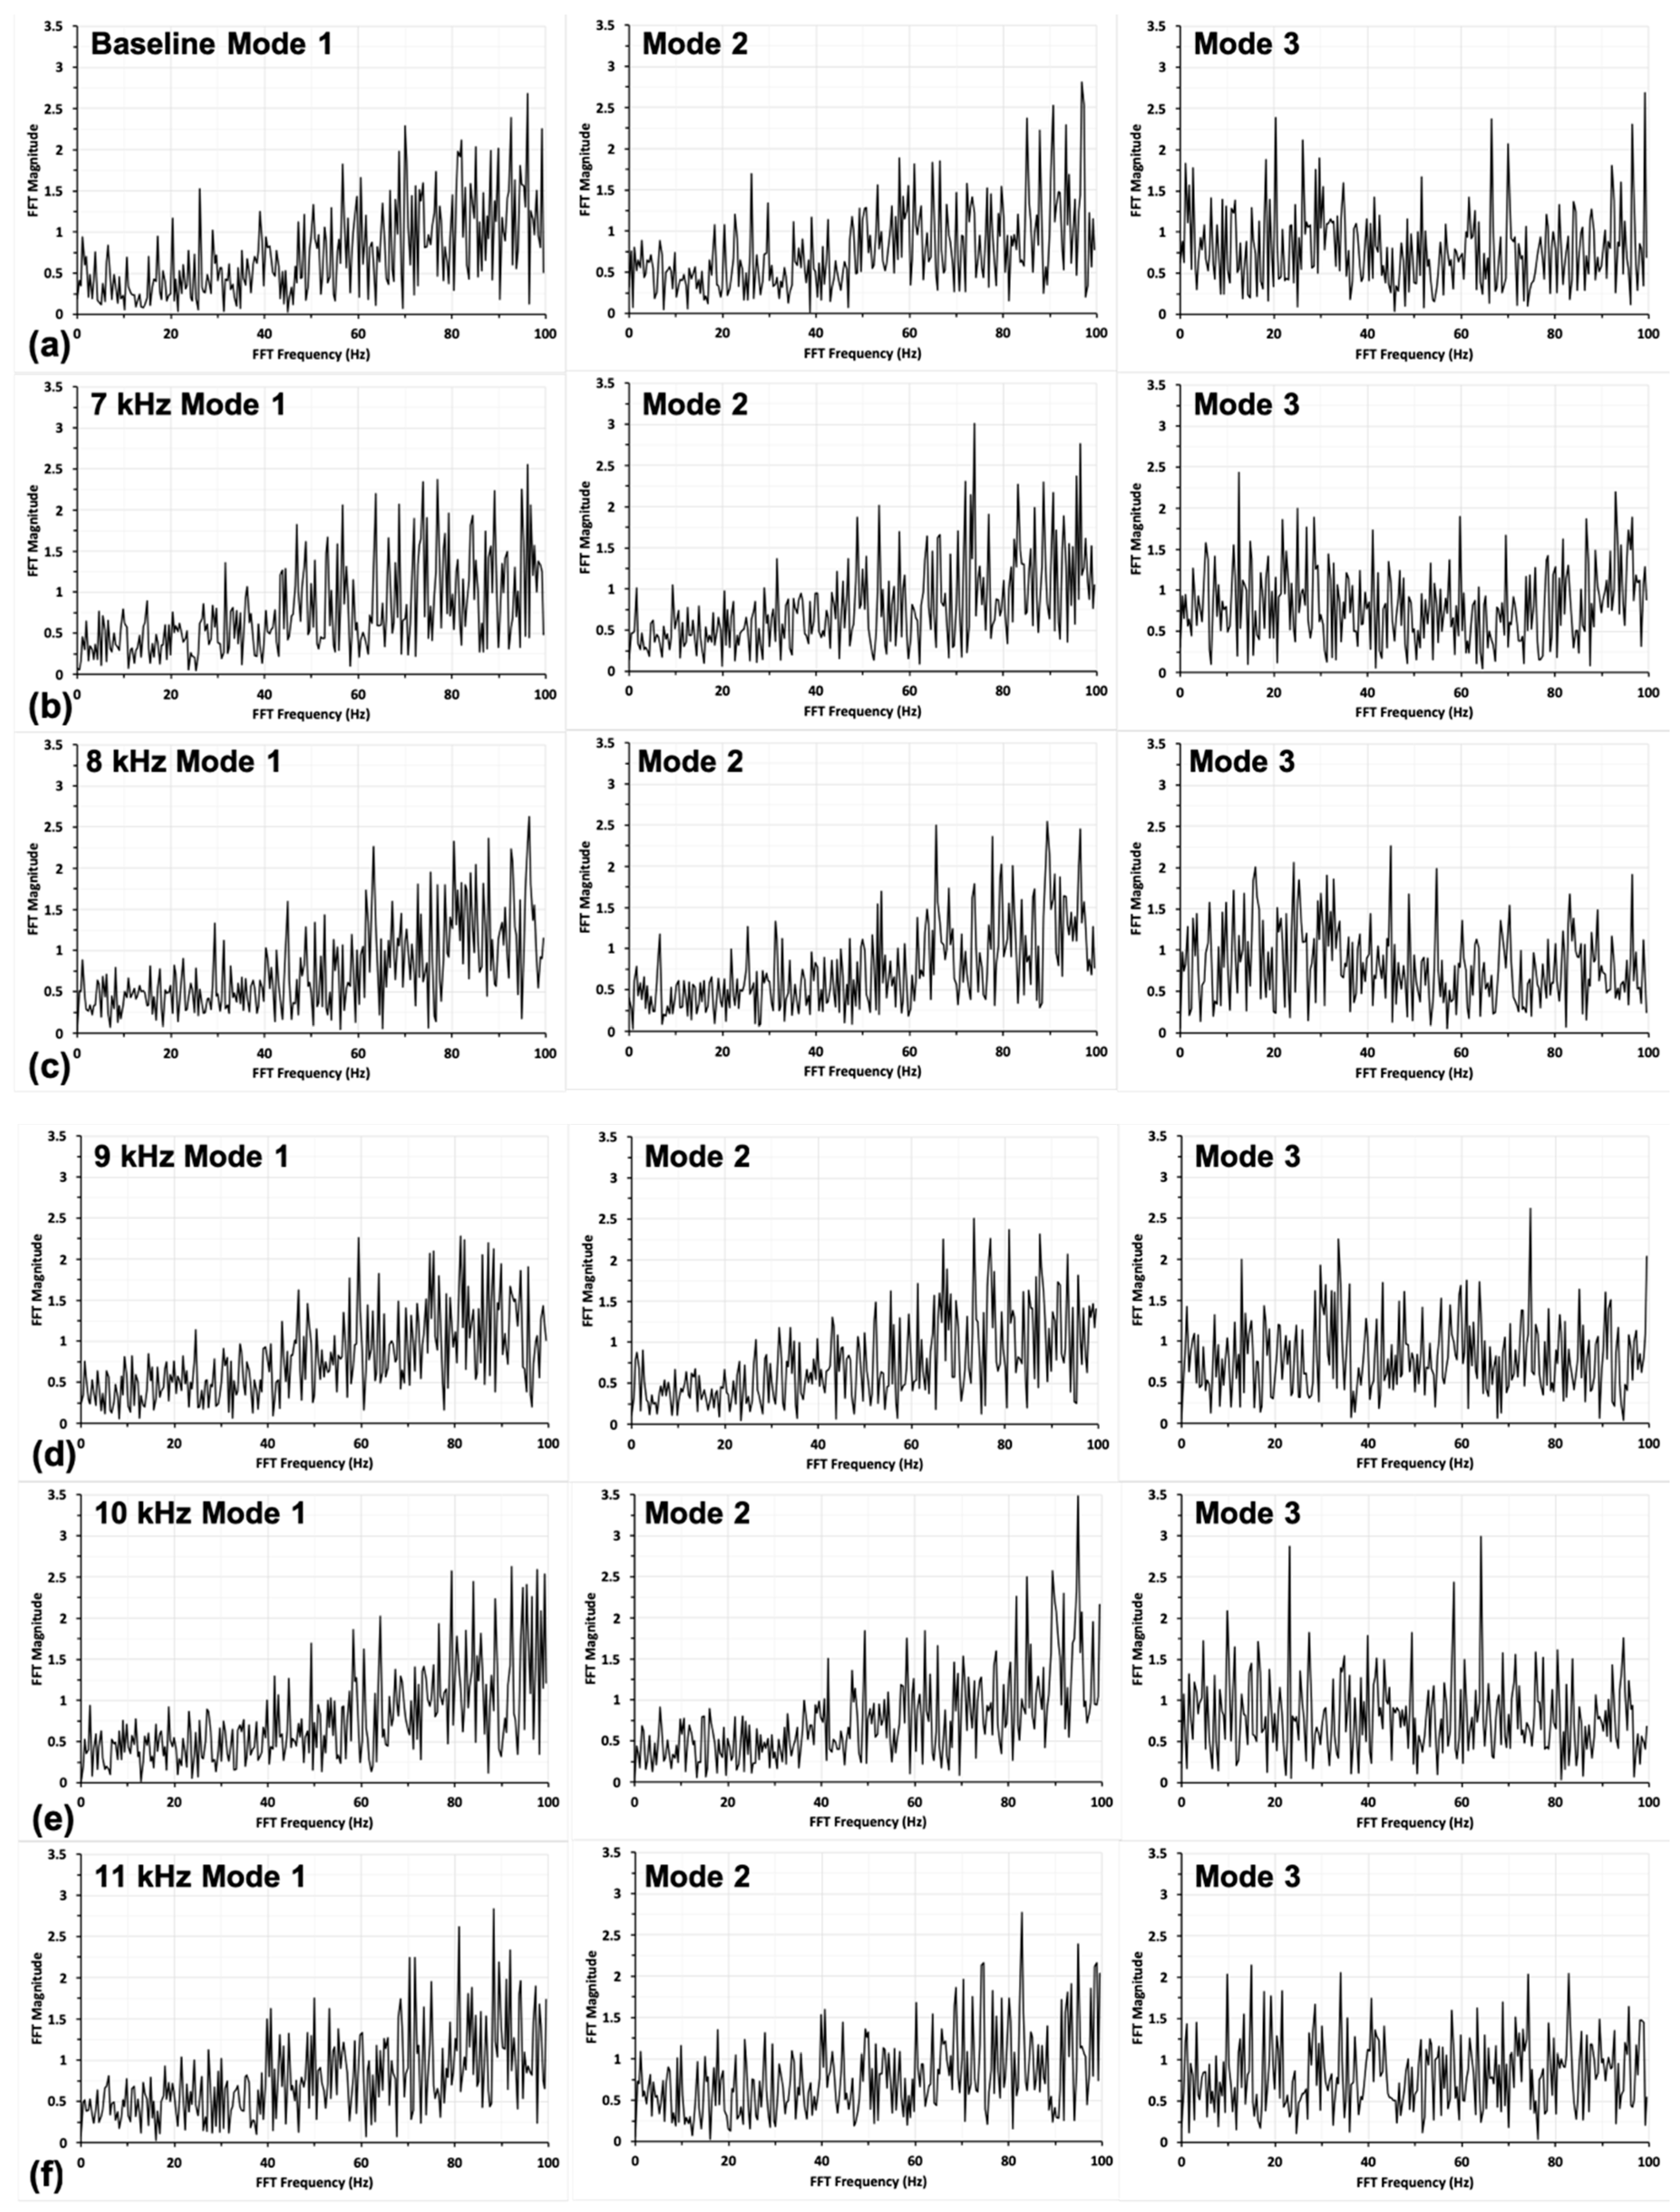
3.2.5. Frequency Analysis

Frequency analysis was conducted to visualise the frequency characteristics of the wake flow at different AC-DBD plasma actuation frequencies. Proper Orthogonal Decomposition (POD) was used to decompose the wake region into the spatial and temporal eigenmodes. Figure 18 shows the mode energy of different spatial eigenmodes obtained by POD. From Figure 18, it can be seen that the mode energy is highest in Mode 1 which contributed 10.57% of the overall mode energy, followed by Mode 2 (8.1%) and Mode 3 (4.3%). After Mode 3, the energy contribution by each of the remaining individual modes is less than 3%, and hence, the frequency responses from Mode 4 to 600 are not considered in the present study.
Fast Fourier Transform (FFT) was conducted to obtain the frequency domain of the wake flow of the first three modes, and the results are present in Figure 19. It can be seen that due to the highly unsteady nature of the flow in the wake region and the use of the stationary ground in the present study, multiple dominant frequencies were shown in all the three modes resolved by FFT. This agrees with the findings of Krajnovic and Davidson [33]. In Mode 1, from Figure 19, it can be seen that the AC-DBD plasma actuation exerts no significant effects on the frequency response to the wake flow as the dominant frequencies in the flow field of all the controlled cases are situated in the frequency band between 80 and 100 Hz, which is same as that shown in the baseline trailer. This further confirmed the conclusion which was made earlier that no observable effect to the flow characteristics in the wake region could be obtained by implementing the AC-DBD plasma actuation at the rear end of the trailer at all the actuation frequencies studied.
The situation changed slightly when the Mode 2 frequency response was considered. From Figure 19, it could be seen that compared to the baseline case, when the plasma actuation frequency was at 7, 8, or 9 kHz, the dominant frequency was shifted to the frequency band between 60 and 80 Hz, while 80 and 100 Hz was shown in the baseline trailer and the cases when the plasma actuation frequency was at 10 or 11 kHz. This suggests that the AC-DBD plasma actuation seems to be able to modify the Mode 2 frequency response of the wake flow. Finally, no general conclusion can be drawn from the Mode 3 frequency response. From Figure 19, it can be seen that the frequency response is considerably scattered and dominant frequencies appeared in both low, medium, and high-frequency bands in both the baseline trailer and all the control cases being studied.

3.2.6. General Discussion of Results

In Section 3.2.2 through to Section 3.2.5, the effects of using the linear AC-DBD plasma actuation at the trailer rear end in attempts to alter the flow characteristics along the wake region have been discussed. This section aims to summarise the results that are already presented, and provide a general discussion about the way the flow control could be achieved by implementing the linear AC-DBD plasma actuation at the rear end of a square-back trailer. From the data shown previously about the velocity field downstream of the trailer rear end, it could be seen that using the linear AC-DBD plasma actuation at the rear end of a square-back trailer model shows no observable effects in altering the size and shape of the recirculating bubble. In addition, the linear AC-DBD plasma actuation shows nearly no effects in changing the flow velocity in the x-direction along the wake region although it does affect the flow velocity in the y-direction. In contrast, it is clear that compared to the baseline trailer, the linear AC-DBD plasma actuation at the trailer rear end generally increases the turbulence kinetic energy levels along the upper shear layer. It also increases the fluctuation in the turbulence kinetic energy and z-vorticity along the wake region. However, the use of the AC-DBD plasma actuation exerts no significant effect on the frequency response of the flow in the wake region. In fact, from the results obtained, it is deduced that although the use of the AC-DBD plasma actuation increases vorticity and turbulence kinetic energy fluctuation, the effect to drag due to these increased fluctuations is negligible. In contrast, it is believed that the AC-DBD plasma actuation was actually unable to generate any impact on the flow. To be exact, the plasma actuation cannot generate any effect to manipulate the flow characteristics in the wake region. The reason which led to the drag increase or reduction that was observed in some cases in the present study was due to the occurrence of random errors in the wind tunnel measurement and was not due to the flow control effect provided by the AC-DBD plasma actuation.

4. Conclusions

An experimental study has been conducted to investigate the time-average streamwise flow characteristics along a 1:20 scale articulated lorry model with and without using the linear AC-DBD plasma actuation at the rear end of a square-back trailer. Force balance was used to measure the drag force acting on the articulated lorry model with and without the implementation of the plasma actuation. Force balance data showed that the AC-DBD plasma actuation exerts a negligible effect in altering the drag coefficient of the lorry model. In addition, the two-component particle image velocimetry measurements were conducted to obtain the time-averaged flow velocity, turbulence and vorticity information along the centreline of the wake region. Results about the time-average velocity field show that using the linear AC-DBD plasma actuation at the trailer rear end could neither alter the size nor the flow velocity in the x-direction along the wake region of the trailer model. However, it did show that the shear layer is deflected more downwards due to the effect of the AC-DBD plasma actuation at 8 and 9 kHz actuation frequencies. In addition, the flow velocity in the y-direction along the wake region could be altered by the effects of the linear AC-DBD plasma actuation. Turbulence kinetic energy was used to assess the flow turbulence levels along the wake region of the trailer model. Results show that higher levels of turbulence kinetic energy were generated in those trailers with the linear AC-DBD plasma actuation being implemented. It was observed that the highest levels of the turbulence kinetic energy appeared along the upper shear layer when the actuation frequency is 9 kHz. In addition, it was concluded that using the linear AC-DBD plasma actuation increased the levels of turbulence kinetic energy and the flow vorticity fluctuation along the wake region but did not show any significant effect in changing the frequency response of the flow in the wake region. Finally, it was proposed that the AC-DBD plasma actuation could not generate any significant impact to affect the flow characteristics in the wake region and hence, no flow control effect can be observed by using this active flow control technique in the present study.

Author Contributions

Experimental work was jointly conducted by K.H.L. and R.S. Data analysis and manuscript preparation were jointly done by K.H.L., R.S. and K.K.

Funding

This research received no external funding.

Acknowledgments

The author would like to thank the technical support provided by the University of Glasgow for the manufacturing of the false floor used in the present study.

Conflicts of Interest

The authors declare no conflict of interest.

References

  1. Wood, R.M. A discussion of a heavy truck advanced aerodynamic trailer system. In Proceedings of the International Forum of Road Transport Technology (IFRTT) 9th International Symposium on Heavy Vehicle Weights and Dimensions, Pennsylvania State University, State Colleague, PA, USA, 18–22 June 2006. [Google Scholar]
  2. European Commission Research and Innovation: <<Aerodynamics and Flexible Trucks>> Webpage. Available online: https://ec.europa.eu/research/participants/portal/desktop/en/opportunities/h2020/topics/gv-09-2017.html (accessed on 23 January 2017).
  3. Balkanyi, S.R.; Bernal, L.P.; Khalighi, B. Analysis of the Near Wake of Bluff Bodies in Ground Proximity; ASME Papers; The American Society of Mechanical Engineers: New Orleans, LA, USA, 2002. [Google Scholar] [CrossRef]
  4. Verzicco, R.; Fatica, M.; Iaccarino, G.; Moin, P.; Khalighi, B. Large eddy simulation of a road vehicle with drag-reduction devices. AIAA J. 2002, 40, 2447–2455. [Google Scholar] [CrossRef]
  5. Yi, W. Drag Reduction of A Three-Dimensional Car Model Using Passive Control Device. Ph.D. Thesis, Seoul National University, Seoul, Korea, 2007. [Google Scholar]
  6. Peterson, R.L. Drag Reduction Obtained by the Addition of A Boattail to A Box Shaped Vehicle; Technical Report of National Aeronautics and Space Administration; NASA-CR-163113; NASA: Washington, DC, USA, 1981.
  7. Croll, R.H.; Gutierrez, W.T.; Hassan, B.; Suazo, J.E.; Riggins, A.J. Experimental Investigation of the Ground Transportation System (GTS) Project for Heavy Vehicle Drag Reduction; SAE Technical Paper; Society of Automotive Engineers: Farmington Hills, MI, USA, 1996; paper no. 960907. [Google Scholar]
  8. Choi, H.; Lee, J.; Park, H. Aerodynamics of Heavy Vehicles. Annu. Rev. Fluid Mech. 2014, 46, 441–468. [Google Scholar] [CrossRef]
  9. Altaf, A.; Omar, A.A.; Asrar, W. Passive drag reduction of square back road vehicles. J. Wind Eng. Ind. Aerodyn. 2014, 134, 30–43. [Google Scholar] [CrossRef]
  10. The United Kingdom Government <<Moving Goods by Road>> Webpage. Available online: https://www.gov.uk/guidance/moving-goods-by-road (accessed on 19 July 2017).
  11. Lo, K.H.; Kontis, K. Flow characteristics over a tractor-trailer model with and without vane-type vortex generator installed. J. Wind Eng. Ind. Aerodyn. 2016, 159, 110–122. [Google Scholar] [CrossRef] [Green Version]
  12. Mugnaini, C.M. Aerodynamic Drag Reduction of A Tractor-Trailer Using Vortex Generators: A Computational Fluid Dynamic Study. Master’s Thesis, California State University, Sacramento, CA, USA, 2015. [Google Scholar]
  13. Patten, J.; McAuliffe, B.; Mayda, W.; Tanguay, B. Review of Aerodynamic Drag Reduction Devices for Heavy Trucks and Buses; Technical Report of National Research Council Canada; Center for Surface Transportation Technology: Ottawa, ON, Canada, 2012; CSTT-HVC-TR-205. [Google Scholar]
  14. Leuschen, J.; Cooper, K.R. Full-Scale Wind Tunnel Tests of Production and Prototype, Second-Generation Aerodynamic Drag-Reducing Devices for Tractor-Trailers; SAE Technical Paper; Society of Automotive Engineers: Farmington Hills, MI, USA, 2006. [Google Scholar] [CrossRef]
  15. Englar, R.J. Advanced Aerodynamic Devices to Improve the Performance, Economics, Handling and Safety of Heavy Vehicles; SAE Technical Paper; Society of Automotive Engineers: Farmington Hills, MI, USA, 2001. [Google Scholar] [CrossRef]
  16. Littlewood, R.P.; Passmore, M.A. Aerodynamic drag reduction of a simplified squareback vehicle using steady blowing. Exp. Fluids 2012, 53, 519–529. [Google Scholar] [CrossRef] [Green Version]
  17. Howell, J.; Sheppard, A.; Blakemore, A. Aerodynamic Drag Reduction for A Simple bluff Body Using Base Bleed; SAE Technical Paper; Society of Automotive Engineers: Farmington Hills, MI, USA, 2003. [Google Scholar] [CrossRef]
  18. Amitay, M.; Menicovich, D.; Gallardo, D. Enhanced fuel efficiency on tractor-trailers using synthetic jet-based active flow control. Proc. SPIE 9801 Ind. Commer. Appl. Smart Struct. Technol. 2016, 980102. [Google Scholar] [CrossRef]
  19. Gillieron, P.; Kourta, A. Aerodynamic drag reduction by vertical splitter plates. Exp. Fluids 2010, 48, 1–16. [Google Scholar] [CrossRef]
  20. Moreau, E. Airflow control by non-thermal plasma actuators. J. Phys. D Appl. Phys. 2007, 40, 605–636. [Google Scholar] [CrossRef]
  21. Roth, J.R. Aerodynamic flow acceleration using paraelectric and peristaltic electrohydrodynamic effects of an one atmosphere uniform glow discharge plasma. Phys. Plasma 2003, 10, 2117. [Google Scholar] [CrossRef]
  22. Corke, T. Plasma flow control optimized airfoil. In Proceedings of the 44th AIAA Aerospace Sciences Meeting and Exhibit, AIAA-2006-1208, Reno, NV, USA, 9–12 January 2006. [Google Scholar]
  23. He, C.; Patel, M.P.; Corke, T.C. Plasma flaps and slats: An application of weakly ionized plasma actuators. J. Aircr. 2009, 46, 864–873. [Google Scholar] [CrossRef]
  24. Post, M.L.; Corke, T.C. Separation control using plasma actuators: Dynamic stall vortex control on oscillating airfoil. AIAA J. 2006, 44, 3125–3135. [Google Scholar] [CrossRef]
  25. Ramakumar, K.; Jacob, J.D. Flow control and lift enhancement using plasma actuators. In Proceedings of the 35th AIAA Fluid Dynamics Conference and Exhibit, AIAA 2005-4635, Toronto, ON, Canada, 6–9 June 2005. [Google Scholar]
  26. Thomas, F.O.; Kozlov, A.; Corke, T.C. Plasma actuators for cylinder flow control and noise reduction. AIAA J. 2008, 46, 1921–1931. [Google Scholar] [CrossRef]
  27. Luo, X. Plasma Based Jet Actuators for Flow Control. Ph.D. Thesis, University of Southampton, Southampton, UK, 2012. [Google Scholar]
  28. Do, H.; Kim, W.; Mungal, M.G.; Cappelli, M.A. Bluff body flow separation control using surface dielectric barrier discharges. In Proceedings of the 45th AIAA Aerospace Sciences Meeting and Exhibit, AIAA-2007-939, Reno, NV, USA, 8–11 January 2007. [Google Scholar]
  29. Roy, S.; Zhao, P.; DasGupta, A.; Soni, J. Dielectric barrier discharge actuator for vehicle drag reduction at highway speeds. AIP Adv. 2016, 6, 025322. [Google Scholar] [CrossRef] [Green Version]
  30. Lo, K.H.; Kontis, K. Flow around and articulated lorry model. Exp. Thermal Fluid Sci. 2017, 82, 58–74. [Google Scholar] [CrossRef]
  31. Gurlek, C.; Sahin, B.; Ozkan, G.M. PIV studies around a bus model. Exp. Thermal Fluid Sci. 2012, 38, 115–126. [Google Scholar] [CrossRef]
  32. Krajnovic, S.; Davidson, L. Numerical study of the flow around a bus-shaped body. ASME J. Fluids Eng. 2003, 125, 500–509. [Google Scholar] [CrossRef]
  33. Krajnovic, S.; Davidson, L. Influence of floor motions in wind tunnels on the aerodynamics of road vehicles. J. Wind Eng. Ind. Aerodyn. 2005, 93, 677–696. [Google Scholar] [CrossRef]
Figure 1. Schematic of the articulate lorry model (adopted and modified from [30]). Note: all units are in mm. (a) Front view and (b) side view.
Applsci 09 02426 g001
Figure 2. Schematic of the linear Single Dielectric Barrier Discharge (SDBD) plasma actuator.
Applsci 09 02426 g002
Figure 3. Voltage and magnified current output waveform at 18 kV peak-to-peak and 8 kHz.
Applsci 09 02426 g003
Figure 4. Peak-to-peak voltage output at different actuation frequencies.
Applsci 09 02426 g004
Figure 5. Schematic setup of the wind tunnel tests (adopted and modified from [11]). Note: all units are in mm.
Applsci 09 02426 g005
Figure 6. Jet velocity in the x-direction generated by the plasma actuator at various actuation frequencies. (a) 7 kHz, (b) 8 kHz, (c) 9 kHz, (d) 10 kHz, and (e) 11 kHz.
Applsci 09 02426 g006
Figure 7. Jet x-velocity at various actuation frequencies at different normalised x-locations downstream of the trailer rear end. x/H = (a) 0.2, (b) 0.4, (c) 0.6, (d) 0.8, (e) 1.0 and (f) 1.2.
Applsci 09 02426 g007
Figure 8. Streamtraces and normalised velocity magnitude contour downstream of the trailer rear end at various plasma actuation frequencies. (a) Baseline, (b) 7 kHz, (c) 8 kHz, (d) 9 kHz, (e) 10 kHz, and (f) 11 kHz.
Applsci 09 02426 g008
Figure 9. Averaged shear layer angle relative to the freestream direction at different actuation frequencies.
Applsci 09 02426 g009
Figure 10. Normalised x-velocity contour downstream of the trailer rear end at various plasma actuation frequencies. (a) Baseline, (b) 7 kHz, (c) 8 kHz, (d) 9 kHz, (e) 10 kHz, and (f) 11 kHz.
Applsci 09 02426 g010
Figure 11. Normalised x-velocity profiles measured at various normalised x-locations along the wake region. x/H = (a) 0.1, (b) 0.3, (c) 0.5, (d) 0.7, (e) 0.9, and (f) 1.1.
Applsci 09 02426 g011
Figure 12. Normalised y-velocity contour downstream of the trailer rear end at various plasma actuation frequencies. (a) Baseline, (b) 7 kHz, (c) 8 kHz, (d) 9 kHz, (e) 10 kHz, and (f) 11 kHz.
Applsci 09 02426 g012
Figure 13. Normalised y-velocity profiles measured at various normalised x-locations along the wake region. x/H = (a) 0.1, (b) 0.3, (c) 0.5, (d) 0.7, (e) 0.9, and (f) 1.1.
Applsci 09 02426 g013
Figure 14. Normalised turbulence kinetic energy downstream of the trailer rear end at various plasma actuation frequencies. (a) Baseline, (b) 7 kHz, (c) 8 kHz, (d) 9 kHz, (e) 10 kHz, and (f) 11 kHz.
Applsci 09 02426 g014
Figure 15. Normalised turbulence kinetic energy profiles measured at various normalised x-locations along the wake region. x/H = (a) 0.1, (b) 0.3, (c) 0.5, (d) 0.7, (e) 0.9, and (f) 1.1.
Applsci 09 02426 g015
Figure 16. Normalised z-vorticity downstream of the trailer rear end at various plasma actuation frequencies. (a) Baseline, (b) 7 kHz, (c) 8 kHz, (d) 9 kHz, (e) 10 kHz, and (f) 11 kHz.
Applsci 09 02426 g016
Figure 17. Normalised z-vorticity profiles at various normalised x-locations along the wake region. x/H = (a) 0.1, (b) 0.3, (c) 0.5, (d) 0.7, (e) 0.9, and (f) 1.1.
Applsci 09 02426 g017
Figure 18. Mode energy at different spatial Eigenmodes.
Applsci 09 02426 g018
Figure 19. Frequency characteristics of the first three modes of the wake region at different AC-DBD plasma actuation frequencies. (a) Baseline (0 kHz), (b) 7 kHz, (c) 8 kHz, (d) 9 kHz, (e) 10 kHz, and (f) 11 kHz.
Applsci 09 02426 g019
Table 1. Coefficient of drag of the model with and without Alternate Current Dielectric Barrier Discharge (AC-DBD) plasma actuation.
CaseCDΔCD
Baseline case, no plasma actuation0.725-
Controlled case, plasma actuation at 7 kHz0.729+0.004
Controlled case, plasma actuation at 8 kHz0.725+0.000
Controlled case, plasma actuation at 9 kHz0.724−0.001
Controlled case, plasma actuation at 10 kHz0.725+0.000
Controlled case, plasma actuation at 11 kHz0.726+0.001

