Gradual Meso-Structural Response Behaviour of Characteristics of Asphalt Mixture Main Skeleton Subjected to Load

 ,
, 
Abstract
:1. Introduction
2. Research Approach
2.1. Mesoscopic Evaluation Indices for the Main Skeleton
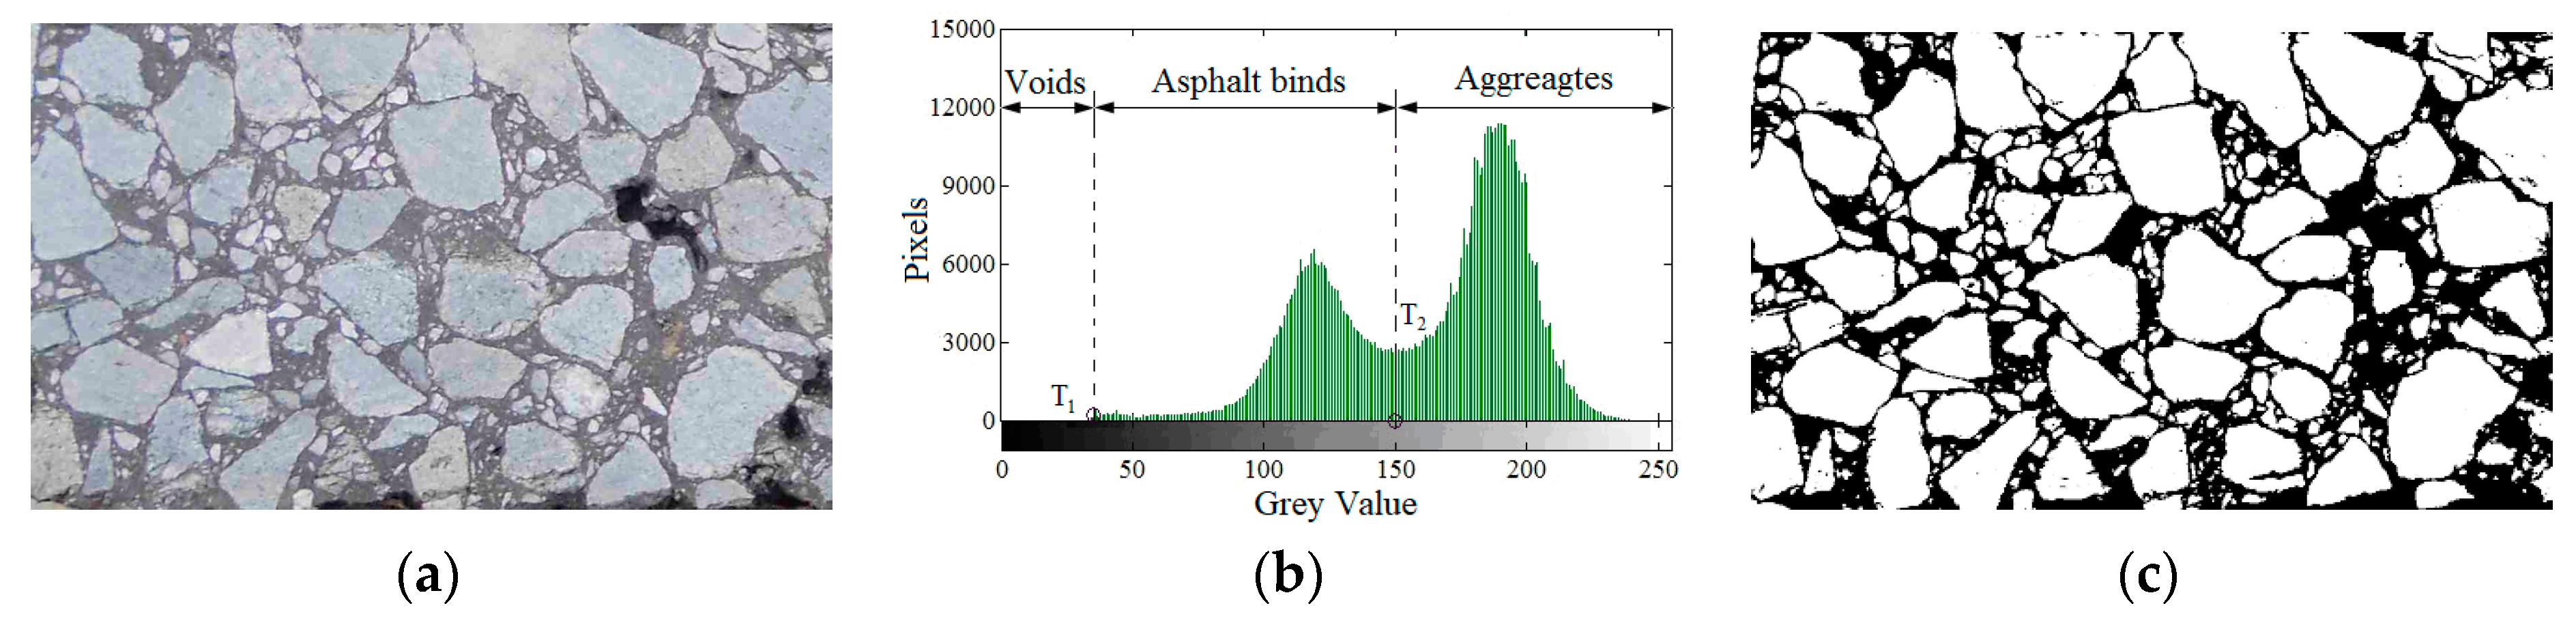
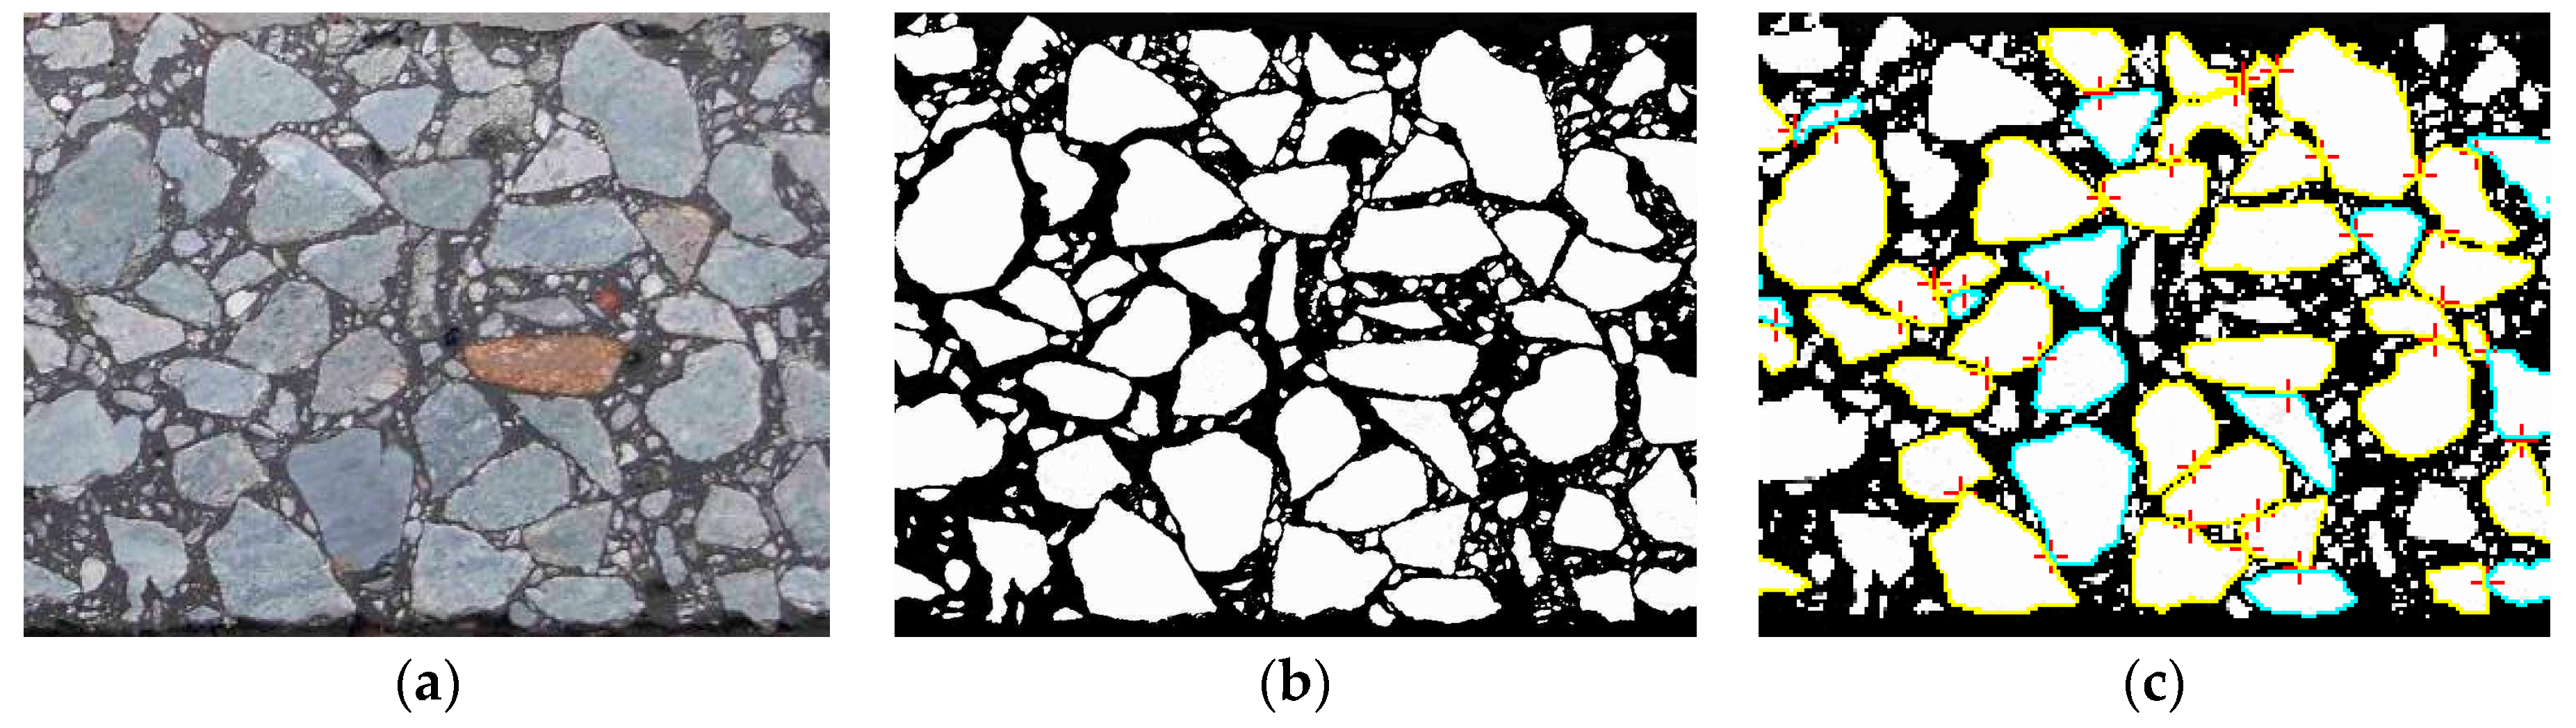
2.2. Image Processing and Acquisition Method of Mesoscopic Evaluation Indices for the Main Skeleton
3. Materials and Test Design
3.1. Materials
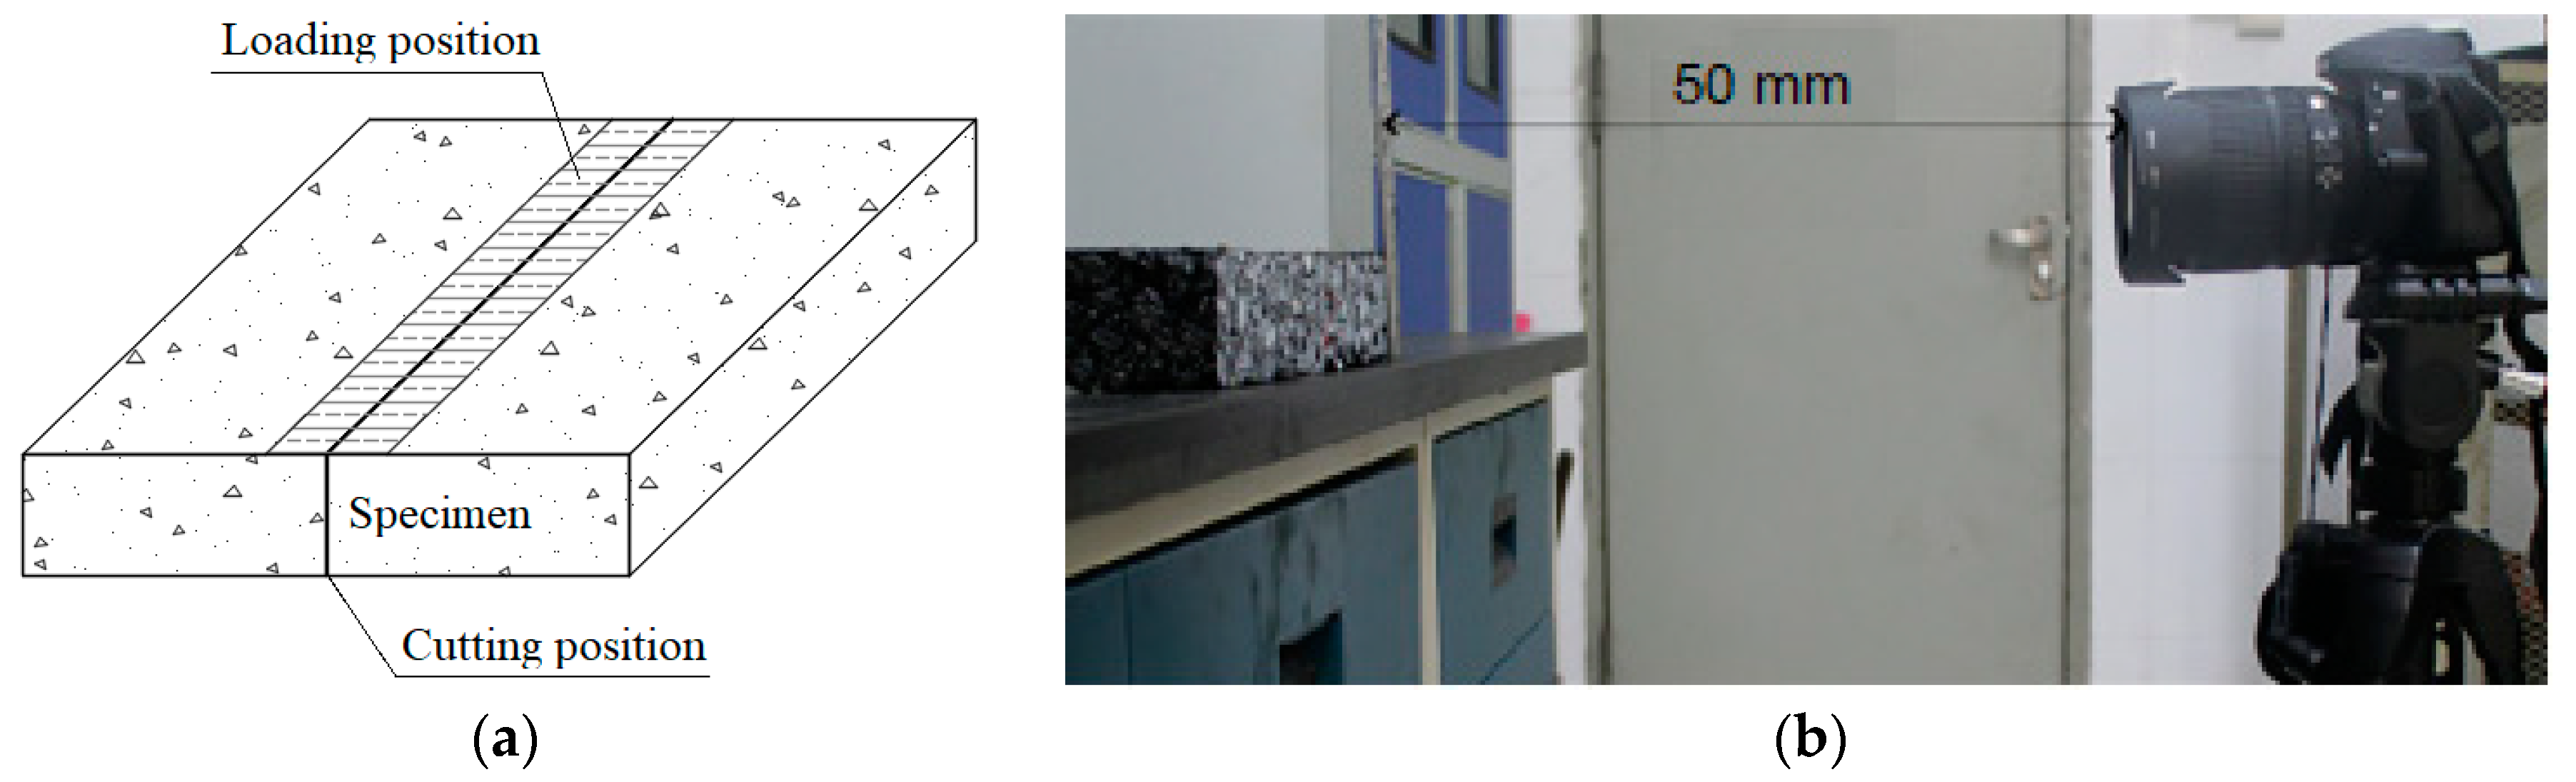
3.2. Test Design
3.3. Effect of Specimen Cutting on the Test Results
4. Results and Discussion
4.1. Gradual Microscopic Contact Behaviour of the Main Skeleton
4.1.1. Mesoscopic Contact Characteristics of the Main Skeleton
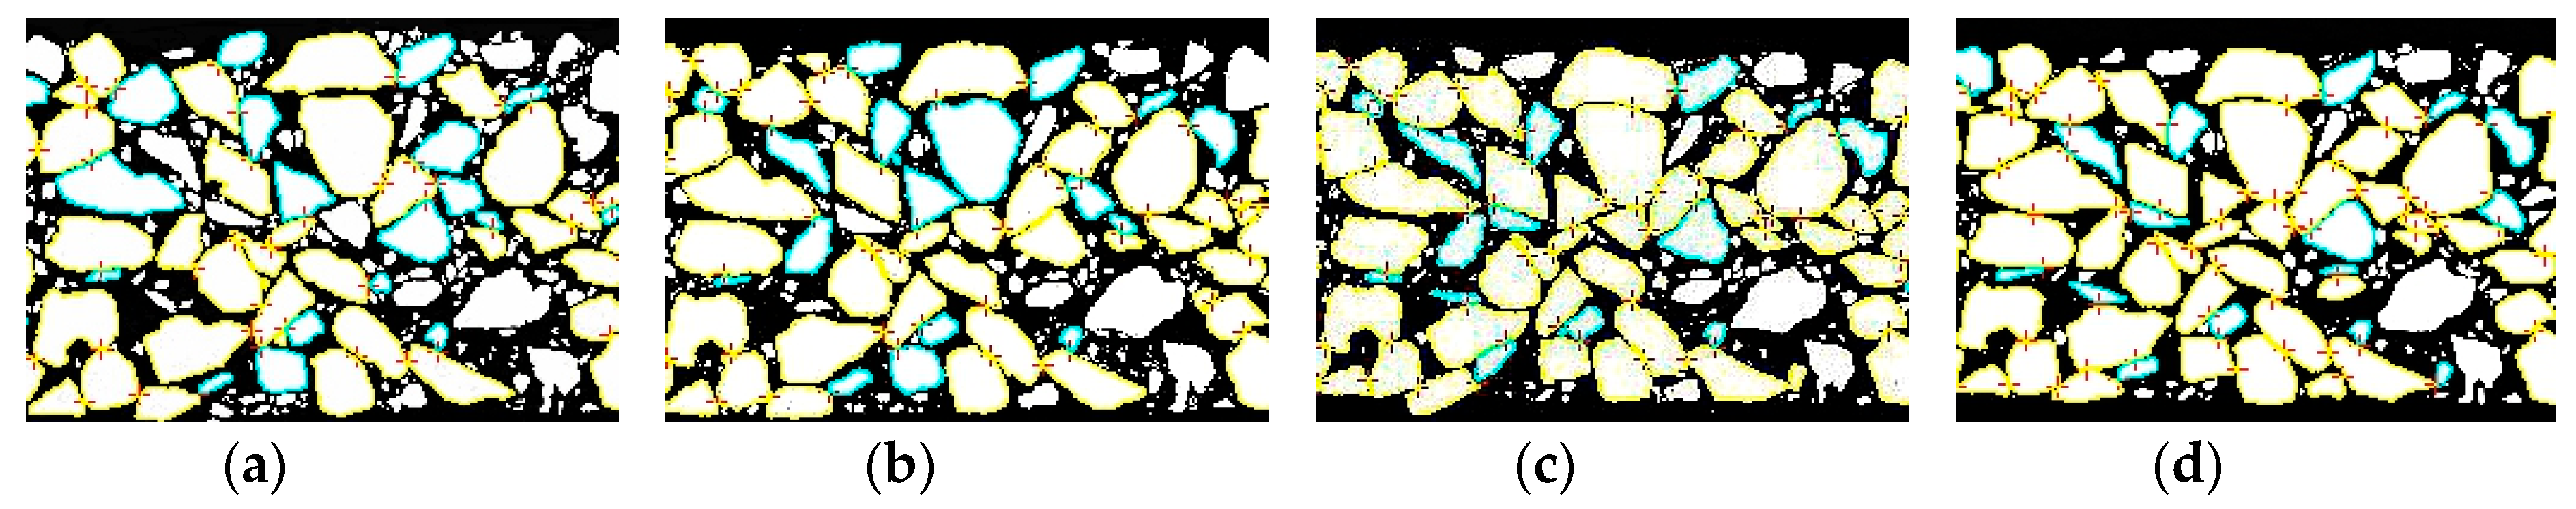
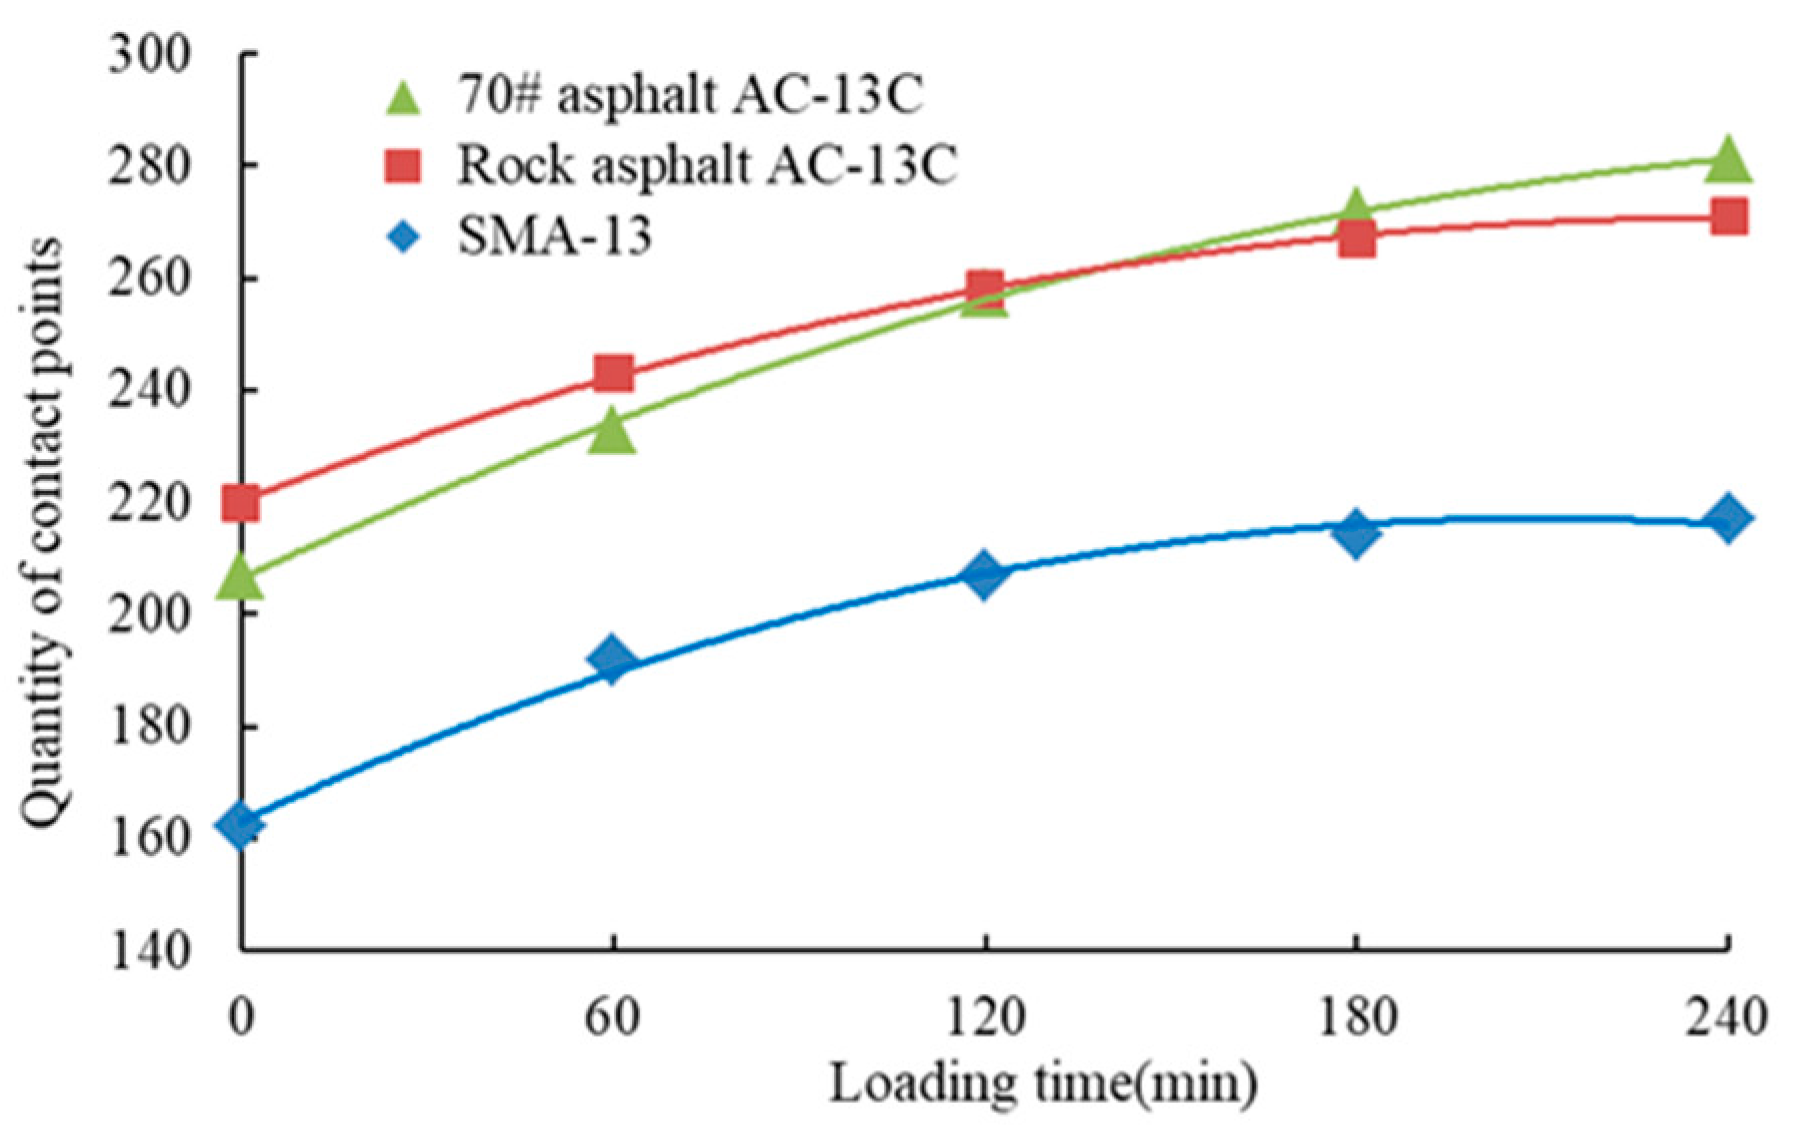
4.1.2. Gradual Development of Contact Point Characteristics
4.1.3. Contribution Rate of Coarse Aggregate Particle Size to Contact Points
 2.36 mm indicates that the coarse aggregates with particle sizes of 2.36–4.75 mm come into contact with 2.36–4.75 mm coarse aggregates; 2.36 mm 4.75 mm indicates that the coarse aggregates with particle sizes of 2.36–4.75 mm come into contact with 4.75–9.5 mm coarse aggregates; the rest may be deduced by analogy. 4.75 mm, 4.75 4.75 mm, and 2.36 2.36 mm; the peak value of contact points is found in coarse aggregates that are 2.36 4.75 mm, and the contribution rate of coarse aggregates with particle sizes larger than 4.75 mm to the number of contact points is less than 60%. In SMA-13, the maximum quantities of contact points among coarse aggregates are found when the particles are 4.75 4.75 mm, 4.75 9.5 mm, and 2.36 4.75 mm; the peak value of contact points is found in coarse aggregates that are 4.75 4.75 mm, and the contribution rate of coarse aggregates with particle sizes larger than 4.75 mm to the number of contact points reaches 80%. In AC-13, although aggregates with particle sizes of 2.36–4.75 mm can effectively increase the quantity of contact points, the mixture’s rutting resistance is relatively poor because of the smaller particle sizes and the insufficient stability of the main skeleton. When particle sizes are larger than 4.75 mm, especially when the contribution rate of coarse aggregates larger than 9.5 mm to the number of contact points is high, the coarse aggregates can form a relatively steady main skeleton structure. Therefore, coarse aggregates with particle sizes larger than 4.75 mm provide the largest contribution to the formation of a steady main skeleton.
4.2. Gradual Change Behaviour of Mesoscopic Evaluation Indices for the Main Skeleton
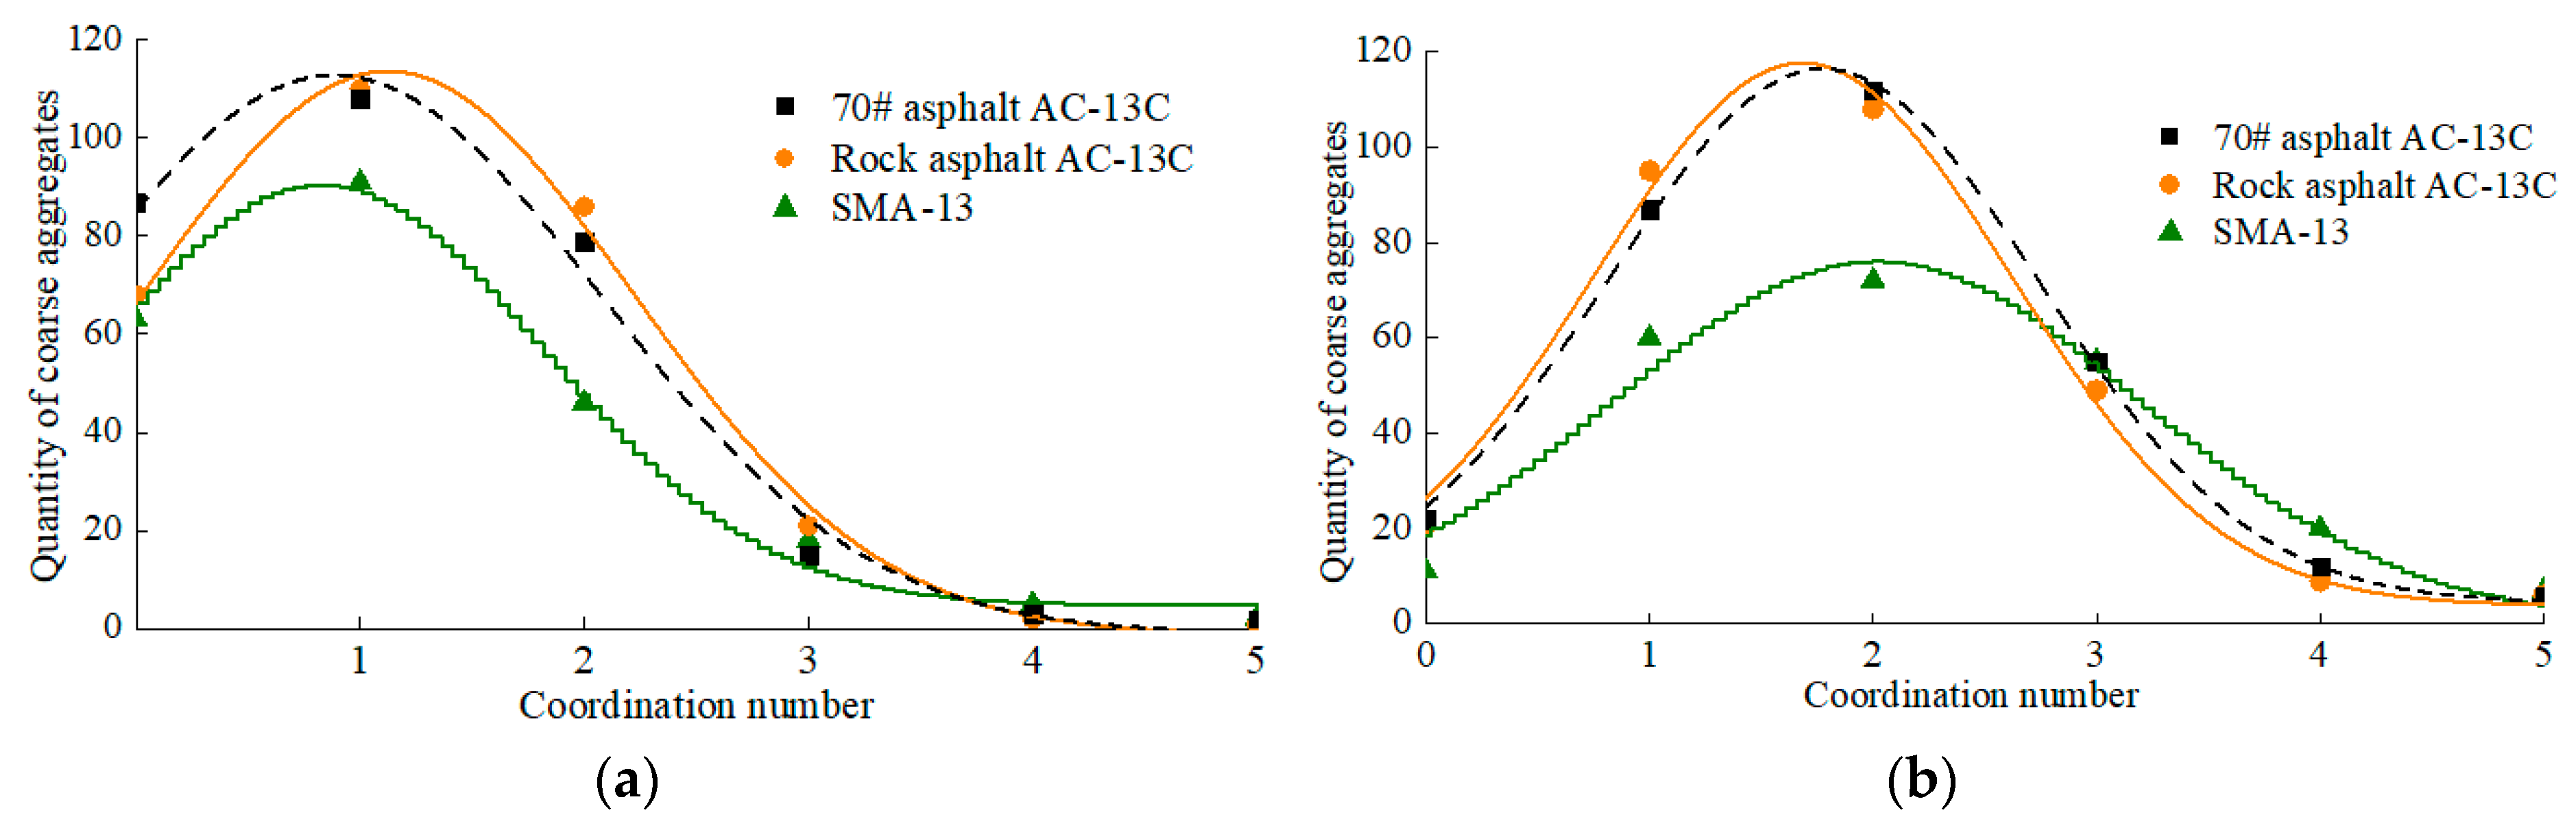
4.2.1. Gradual Trend of Coarse Aggregate Coordination Number
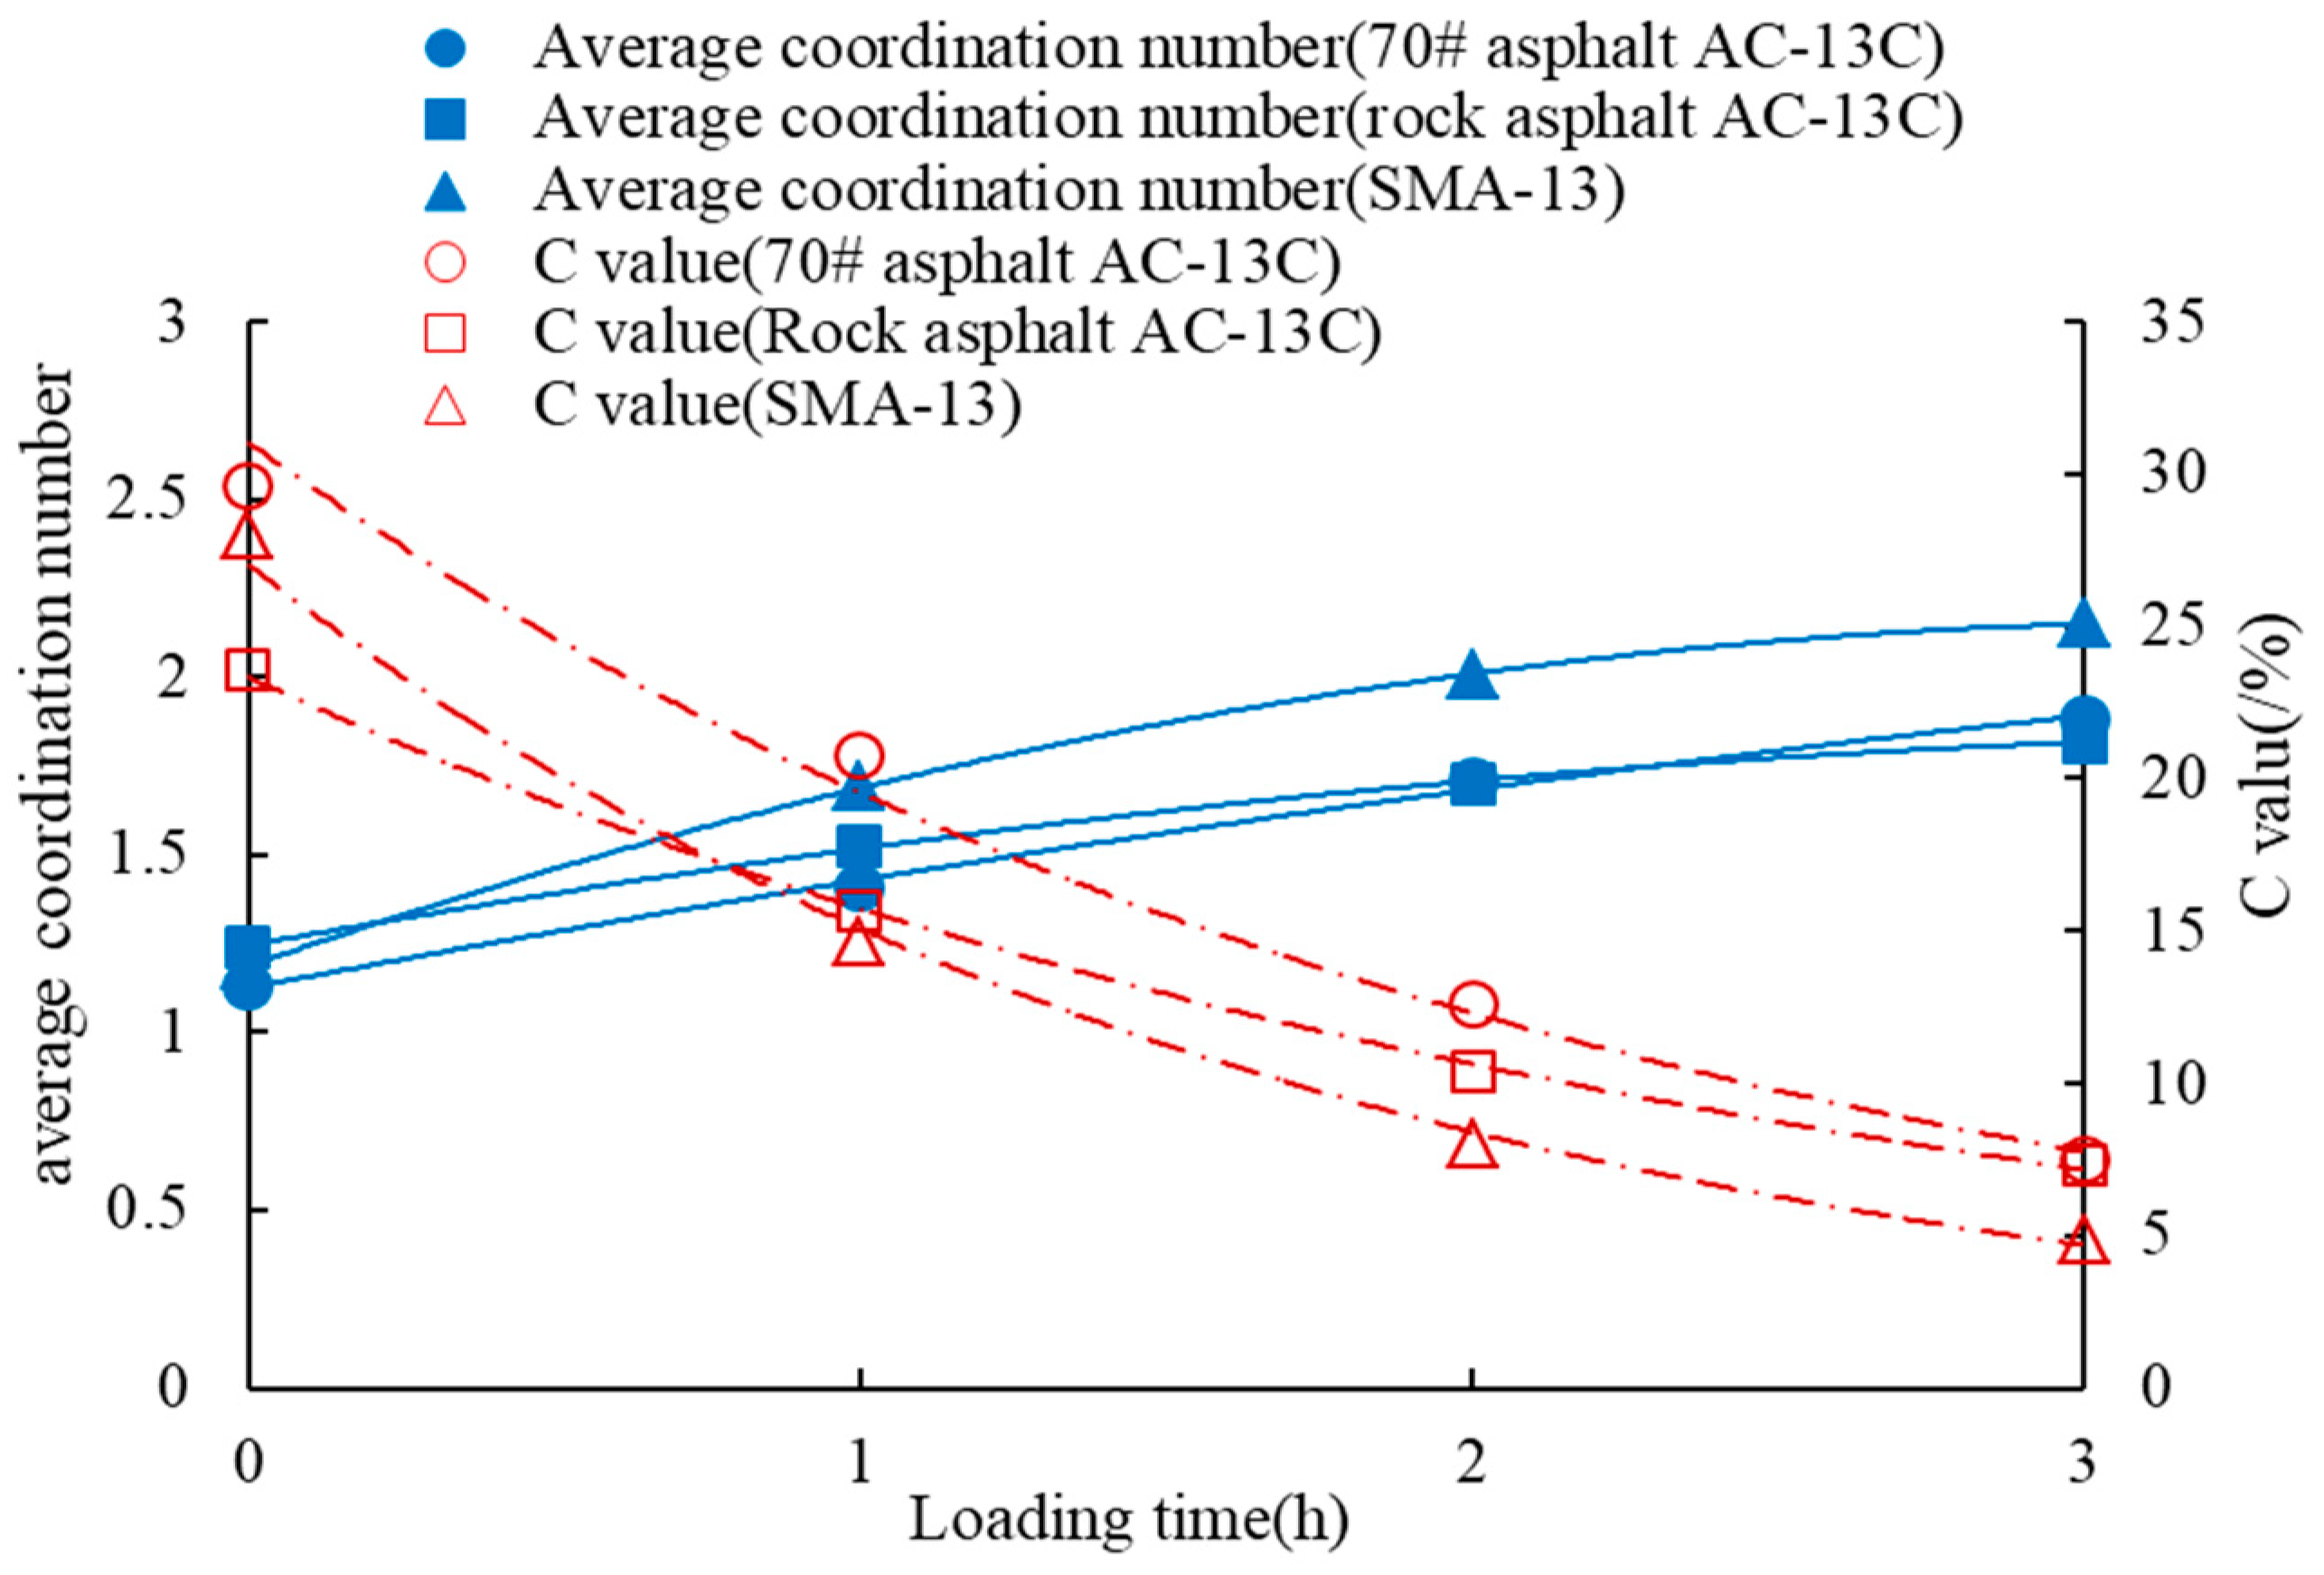
4.2.2. Gradual Change Trend of and C Value
4.3. Design Criteria of Mesoscopic Evaluation Indices for the Main Skeleton
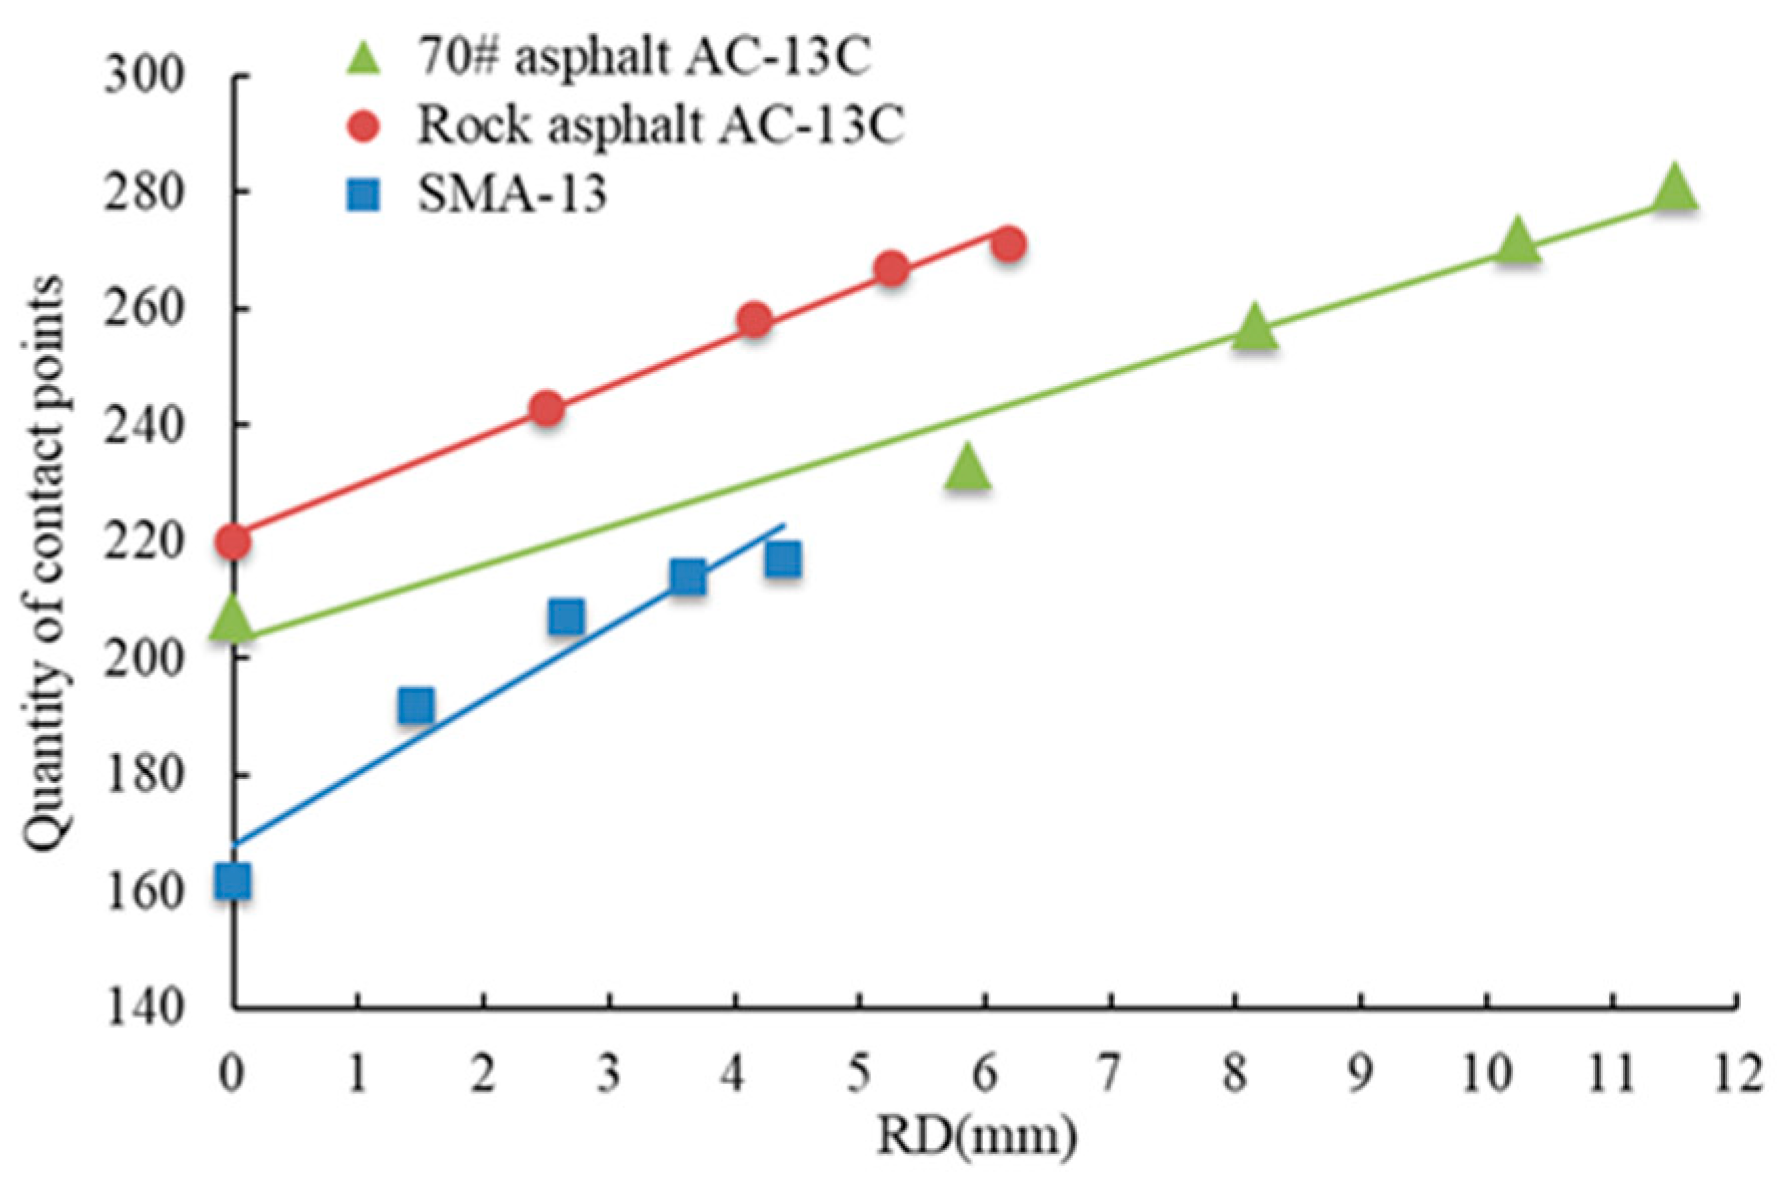
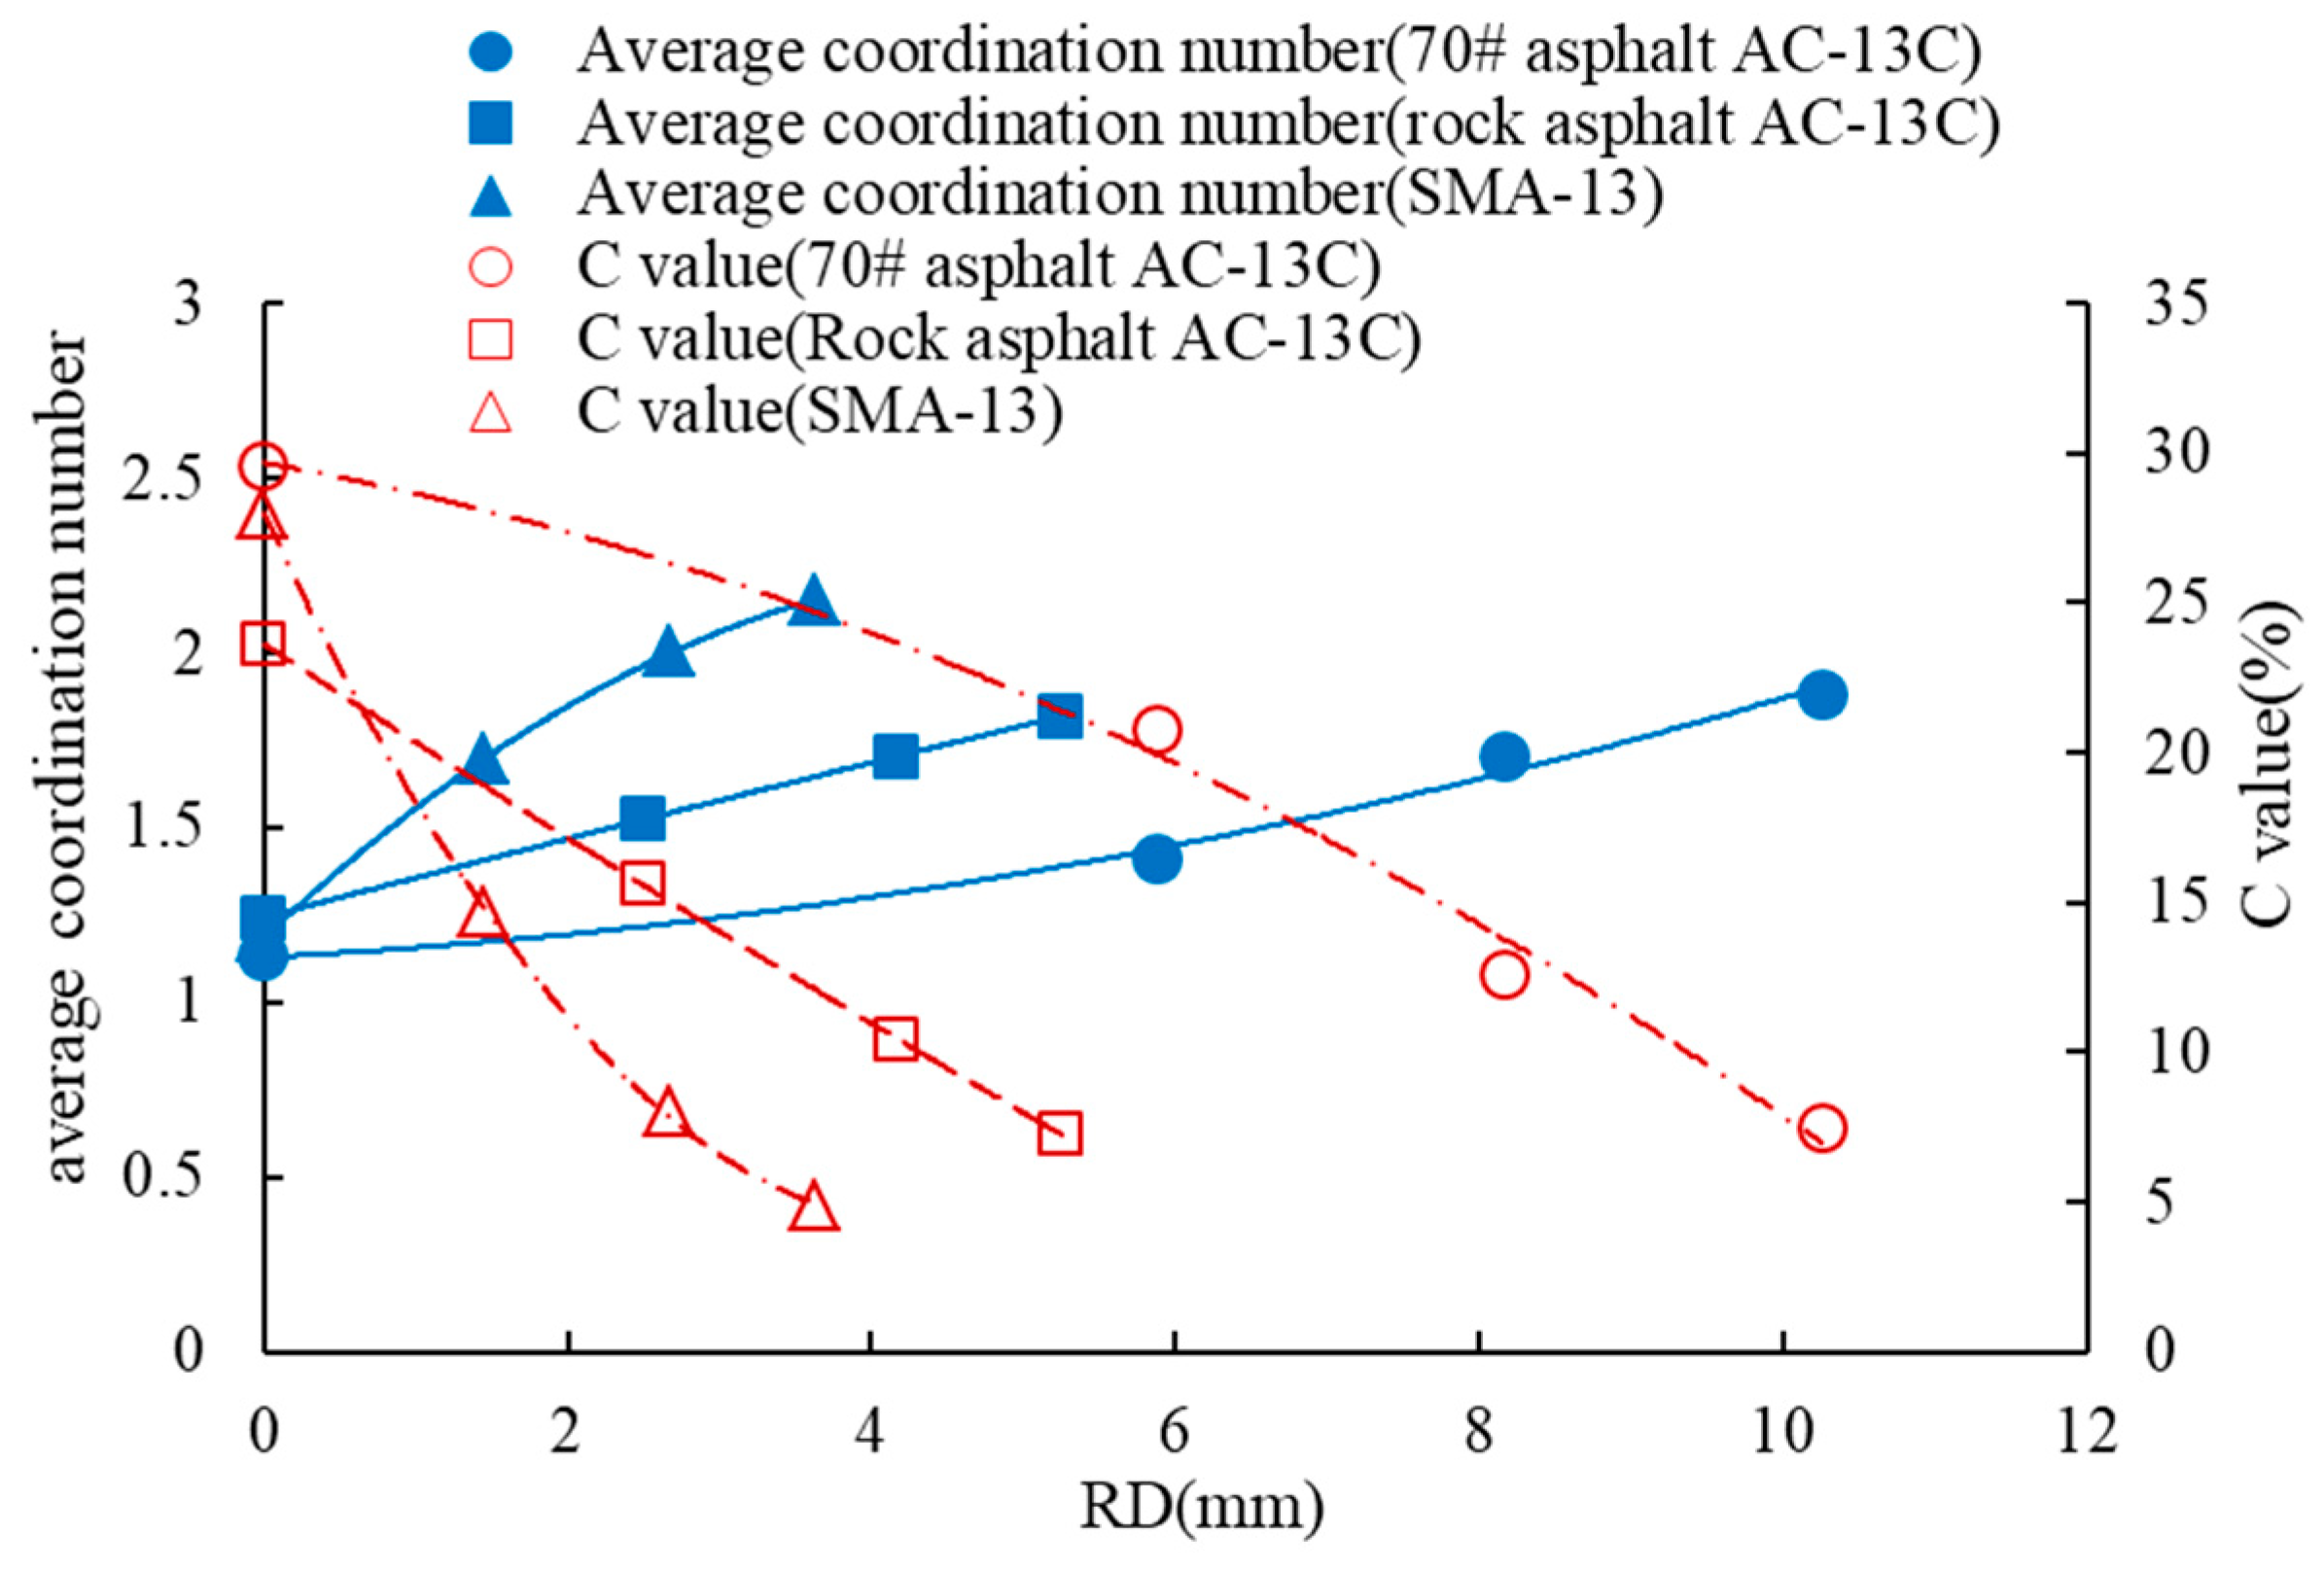
4.3.1. Relationship between Mesoscopic Evaluation Indices and the Macroscopic Index of the Main Skeleton
4.3.2. Design Criteria of Mesoscopic Evaluation Indices for the Main Skeleton
5. Conclusions
Author Contributions
Funding
Conflicts of Interest
References
- Yang, Z.; Zhang, G.Y.; Wei, X.S.; Wei, J.; Yu, H.; Xu, W. Quantitative analysis of the blending degree of virgin and RAP binders in recycled asphalt mixtures with a high RAP content. Appl. Sci. 2018, 8, 2668. [Google Scholar] [CrossRef]
- Asi, I.M. Laboratory comparison study for the use of stone matrix asphalt in hot weather climates. Constr. Build. Mater. 2006, 20, 982–989. [Google Scholar] [CrossRef]
- Roque, R.; Birgisson, B.; Kim, S.; Guarin, A. Development of Mix Design Guidelines for Improved Performance of Asphalt Mixtures; Florida Department of Transportation: Tallahassee, FL, USA, 2006. [Google Scholar]
- Guarin, A.; Roque, R.; Kim, S.; Sirin, O. Disruption factor of asphalt mixture. Int. J. Pavement Eng. 2013, 14, 472–485. [Google Scholar] [CrossRef]
- Kim, S.; Roque, R.; Birgisson, B.; Guarin, A. Porosity of the dominant aggregate size range to evaluate coarse aggregate structure of asphalt mixtures. J. Mater. Civ. Eng. 2009, 21, 32–39. [Google Scholar] [CrossRef]
- Kim, S.; Guarin, A.; Roque, R.; Birgisson, B. Laboratory evaluation for rutting performance based on the DASR porosity of asphalt mixture. Road Mater. Pavement Des. 2008, 8, 421–440. [Google Scholar] [CrossRef]
- Yideti, T.F.; Birgisson, B.; Jelagin, D.; Guarin, A. Packing theory-based framework to evaluate permanent deformation of unbound granular materials. Int. J. Pavement Eng. 2013, 14, 309–320. [Google Scholar] [CrossRef]
- Liba, B.; Jelagin, D.; Birgisson, B. Gradation based framework for asphalt mixture. Mater. Struct. 2013, 46, 1401–1414. [Google Scholar]
- Yideti, T.F.; Birgisson, B.; Jelagin, D.; Guarin, A. Packing theory-based framework to evaluating resilient modulus of unbound granular materials. Int. J. Pavement Eng. 2014, 15, 689–697. [Google Scholar] [CrossRef]
- Tan, Y.Q.; Xing, C.; Ren, J.D.; Zhang, L. Research on mesostructured characteristics of asphalt mixture based on particle packing theory. China J. Highw. Transp. 2017, 30, 1–8. [Google Scholar]
- Ding, X.; Ma, T.; Gao, W. Morphological characterization and mechanical analysis for coarse aggregate skeleton of asphalt mixture based on discrete-element modeling. Constr. Build. Mater. 2017, 154, 1048–1061. [Google Scholar] [CrossRef]
- Ma, T.; Zhang, D.; Zhang, Y.; Hong, J. Micromechanical response of aggregate skeleton within asphalt mixture based on virtual simulation of wheel tracking test. Constr. Build. Mater. 2016, 111, 153–163. [Google Scholar] [CrossRef]
- Gong, F.; Zhou, X.; You, Z.; Liu, Y.; Chen, S. Using discrete element models to track movement of coarse aggregates during compaction of asphalt mixture. Constr. Build. Mater. 2018, 189, 338–351. [Google Scholar] [CrossRef]
- Sefidmazgi, N.R.; Tashman, L.; Bahia, H. Internal structure characterization of asphalt mixtures for rutting performance using imaging analysis. Road Mater. Pavement Des. 2012, 13, 21–37. [Google Scholar] [CrossRef]
- Ding, X.; Ma, T.; Zhang, W.; Zhang, D.; Yin, T. Effects by property homogeneity of aggregate skeleton on creep performance of asphalt concrete. Constr. Build. Mater. 2018, 171, 205–213. [Google Scholar] [CrossRef]
- Cai, X.; Wang, D.Y. Evaluation of rutting performance of asphalt mixture based on the granular media theory and aggregate contact characteristics. Road Mater. Pavement Des. 2013, 14, 325–340. [Google Scholar] [CrossRef]
- Cai, X.; Wu, K.H.; Huang, W.K.; Wan, C. Study on the correlation between aggregate skeleton characteristics and rutting performance of asphalt mixture. Constr. Build. Mater. 2018, 179, 294–301. [Google Scholar] [CrossRef]
- Pouranian, M.R.; Haddock, J.E. Determination of voids in the mineral aggregate and aggregate skeleton characteristics of asphalt mixtures using a linear-mixture packing model. Constr. Build. Mater. 2018, 188, 292–304. [Google Scholar] [CrossRef]
- Wang, X.; Gu, X.; Jiang, J.; Deng, H. Experimental analysis of skeleton strength of porous asphalt mixtures. Constr. Build. Mater. 2018, 171, 13–21. [Google Scholar] [CrossRef]
- Shi, L.W.; Wang, D.Y.; Xu, C.; Liang, H.H. Investigation into meso performance of asphalt mixture skeleton based on discrete element method. J. South China Univ. Technol. Nat. Sci. Ed. 2015, 43, 50–56. [Google Scholar]
- Ying, H.; Zhou, J.; Wu, Q.; Liu, Y. Variation of the contact form of coarse aggregate particles in skeleton type asphalt mixture. J. Build. Mater. 2016, 19, 292–298. [Google Scholar]
- Sefidmazgi, N.R.; Bahia, H.U. Effect of compaction conditions on aggregate packing using 2-Dimensional image analysis and the relation to performance of HMA. Mater. Struct. 2014, 47, 1313–1324. [Google Scholar] [CrossRef]
- Gopalakrishnan, K.; Shashidhar, N. Structural characteristics of three-dimensional random packing aggregates with wide size distribution. Int. J. Inf. Technol. 2006, 3, 201–208. [Google Scholar]
- Chen, J.; Huang, X.M. Evaluation of aggregate skeleton structure using the discrete element method. J. Southeast Univ. Nat. Sci. Ed. 2012, 42, 761–765. [Google Scholar]
- Rothenburg, L.; Kruyt, N.P. Critical state and evolution of coordination number in simulated granular materials. Int. J. Solids Struct. 2004, 41, 5763–5774. [Google Scholar] [CrossRef]
- Coenen, A.R.; Kutay, M.E.; Sefidmazgi, N.R.; Bahia, H.U. Aggregate structure characterization of asphalt mixtures using 2-Dimensional image analysis. Road Mater. Pavement Des. 2012, 13, 433–454. [Google Scholar] [CrossRef]
- Elseifi, M.A.; Al-Qadi, I.L.; Yang, S.H.; Carpenter, S.H. Validity of Asphalt Binder Film Thickness Concept in Hot-Mix Asphalt; Transportation Research Board: Washington, DC, USA, 2008; Paper No: 08-0603. [Google Scholar]
- Cai, X.; Wang, D.Y.; Li, K.; Wan, C. Prediction of shear modulus of asphalt mixtures based on granular mechanics. China J. Highw. Transp. 2013, 26, 38–46. [Google Scholar]
- Ministry of Transport of the People’s Republic of China. Standard Test Methods of Bitumen and Bituminous Mixtures for Highway Engrneering; China Communications Press: Beijing, China, 2011.
- Ministry of Transport of the People’s Republic of China. Technical Specification for Construction of Highway Asphalt Pavements; China Communications Press: Beijing, China, 2004.
- Javilla, B.; Fang, H.; Mo, L.; Shu, B.; Wu, S. Durability of innovative construction materials and structures test evaluation of rutting performance indicators of asphalt mixtures. Constr. Build. Mater. 2017, 177, 1215–1223. [Google Scholar] [CrossRef]


| Image Acquisition Method | Advantages | Disadvantages | Cross-Sectional Image of Specimen |
|---|---|---|---|
| Scanning based on X-ray CT | 1. Non-destructive; testing method causes no damage to specimens 2. Continuous asphalt mixture tomographic images can easily be obtained; 3D reconstruction can be achieved with a computer | 1. A long debugging time is necessary to acquire the cross-sectional image of the same position before and after loading; errors are easily produced 2. Acquired image is blurred, making it difficult to identify the boundary between aggregate and asphalt; the error of subsequent image processing and analysis is relatively large |  |
| Photography by CCD digital camera | 1. Affords shooting of specimen before and after dynamic loading; precise shooting position is guaranteed when the specimen is cut 2. Cross-sectional image is clear and highly precise; greyscale typically shows an ideal ‘bimodal’ distribution and facilitates subsequent processing and analysis | 1. Specimen can be damaged by cutting 2. Multiple groups of specimens are required to obtain more cross-sectional images; test workload is large | 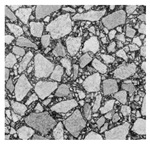 |
| Parameters | Technical Parameters | |
|---|---|---|
| 70# Binder | SBS Modified Binder | |
| Penetration (25°C, 100 g, 5 s, 0.1 mm) | 66 | 62 |
| Ductility (5 cm/min, 5°C, cm) | 135 | 147 |
| Softening point (°C) | 50.0 | 79.0 |
| Density of bitumen (15°C, g·cm−3) | 1.058 | 1.033 |
| Appearance | Ash Content (%) | Water Content (%) | Asphalt Content (%) | Density (g·cm−3) |
|---|---|---|---|---|
| Black powder | 12 | 1.28 | 88 | 0.765 |
| Type of Mixture | Type of Aggregate | Cement Content (%) | Mineral Powder Content (%) | Lignin Fibre Content (%) | Asphalt Content (%) |
|---|---|---|---|---|---|
| 70# asphalt AC-13C | Granite | 2.0 | -- | -- | 4.9 |
| Rock asphalt AC-13C | Granite | 2.0 | -- | -- | 5.0 |
| SMA-13 | Basalt | -- | 11.0 | 3.5 | 6.0 |
| Sieve Size (mm) | Passing Rate (%) | |||||||||
|---|---|---|---|---|---|---|---|---|---|---|
| 16 | 13.2 | 9.5 | 4.75 | 2.36 | 1.18 | 0.6 | 0.3 | 0.15 | 0.075 | |
| AC-13C | 100 | 99.5 | 75.9 | 40.3 | 31.4 | 23.5 | 16.5 | 9.8 | 6.7 | 4.3 |
| SMA-13 | 100 | 95.9 | 59.0 | 27.3 | 22.5 | 18.9 | 16.4 | 14.0 | 12.8 | 10.0 |
| Type of Mixture | γf (g·cm−3) | γt (g·cm−3) | VV (%) | VMA (%) | VFA (%) |
|---|---|---|---|---|---|
| 70# asphalt AC-13C | 2.405 | 2.505 | 4.0 | 14.8 | 73.2 |
| Rock asphalt AC-13C | 2.412 | 2.506 | 3.8 | 14.8 | 74.6 |
| SMA-13 | 2.362 | 2.467 | 4.3 | 17.0 | 75.0 |
| Specimens | Quantity of contact points (total quantity) | |||
|---|---|---|---|---|
| Before loading | After 1-h Loading | After 2-h Loading | ||
| 70# asphalt AC-13C | Cut specimen | 207 | 233 | 257 |
| Uncut specimen | 234 | 209 | 274 | |
| SMA-13 | Cut specimen | 162 | 192 | 207 |
| Uncut specimen | 155 | 203 | 219 | |
| Type of Mixture | Loading Time (h) | Contact Distribution of Coarse Aggregates with Different Particle Sizes (mm) | |||||||||
|---|---|---|---|---|---|---|---|---|---|---|---|
| 2.36 ↕ 2.36 | 2.36 ↕ 4.75 | 2.36 ↕ 9.5 | 2.36 ↕ 13.2 | 4.75 ↕ 4.75 | 4.75 ↕ 9.5 | 4.75 ↕ 13.2 | 9.5 ↕ 9.5 | 9.5 ↕ 13.2 | 13.2 ↕ 13.2 | ||
| 70# asphalt AC-13C | Before loading | 40 | 90 | 8 | 2 | 52 | 14 | 1 | 0 | 0 | 0 |
| After 1-h loading | 39 | 98 | 7 | 2 | 71 | 15 | 1 | 0 | 0 | 0 | |
| After 2-h loading | 41 | 110 | 8 | 1 | 82 | 14 | 1 | 0 | 0 | 0 | |
| After 3-h loading | 42 | 118 | 8 | 1 | 89 | 13 | 1 | 0 | 0 | 0 | |
| Rock asphalt AC-13C | Before loading | 34 | 91 | 16 | 1 | 56 | 20 | 1 | 1 | 0 | 0 |
| After 1-h loading | 39 | 100 | 18 | 2 | 59 | 23 | 1 | 1 | 0 | 0 | |
| After 2-h loading | 42 | 111 | 17 | 2 | 61 | 22 | 2 | 1 | 0 | 0 | |
| After 3-h loading | 41 | 115 | 19 | 2 | 63 | 24 | 2 | 1 | 0 | 0 | |
| SMA-13 | Before loading | 6 | 30 | 11 | 2 | 63 | 37 | 5 | 7 | 1 | 0 |
| After 1-h loading | 2 | 39 | 12 | 2 | 81 | 42 | 4 | 8 | 2 | 0 | |
| After 2-h loading | 5 | 46 | 15 | 2 | 78 | 48 | 4 | 8 | 1 | 0 | |
| After 3-h loading | 4 | 47 | 17 | 2 | 82 | 49 | 4 | 8 | 1 | 0 | |
| 9 | Loading Time (h) | Coordination Number | |||||
|---|---|---|---|---|---|---|---|
| 0 | 1 | 2 | 3 | 4 | 5 | ||
| Corresponding quantity of coarse aggregates with coordination number: total quantity and (percentage) | |||||||
| 70# asphalt AC-13C | Before loading | 87(30) | 108(37) | 79(27) | 15(5) | 3(1) | 2(1) |
| After 1-h loading | 61(21) | 102(35) | 92(31) | 31(11) | 5(2) | 3(1) | |
| After 2-h loading | 37(13) | 91(31) | 106(36) | 46(16) | 10(3) | 4(1) | |
| After 3-h loading | 22(7) | 87(30) | 112(38) | 55(19) | 12(4) | 6(2) | |
| Rock asphalt AC-13C | Before loading | 68(24) | 105(38) | 86(30) | 21(7) | 2(1) | 1(0) |
| After 1-h loading | 45(16) | 102(35) | 96(33) | 37(13) | 6(2) | 2(1) | |
| After 2-h loading | 30(10) | 99(34) | 102(35) | 45(16) | 8(3) | 4(1) | |
| After 3-h loading | 21(7) | 95(33) | 108(38) | 49(17) | 9(3) | 6(2) | |
| SMA-13 | Before loading | 63(28) | 91(40) | 46(20) | 18(8) | 5(2) | 2(1) |
| After 1-h loading | 33(15) | 76(34) | 63(28) | 37(16) | 12(5) | 4(2) | |
| After 2-h loading | 18(8) | 65(29) | 70(31) | 48(21) | 18(8) | 6(3) | |
| After 3-h loading | 11(5) | 60(27) | 72(32) | 55(24) | 20(9) | 7(3) | |
| Coefficient | y0 | xc | W | A | R2 | |
|---|---|---|---|---|---|---|
| 70# asphalt AC-13C | Before loading | −0.937 | 0.886 | 2.372 | 338.191 | 0.9717 |
| After 3-h loading | 4.506 | 1.776 | 1.916 | 268.700 | 0.9962 | |
| Rock asphalt AC-13C | Before loading | −1.091 | 1.124 | 2.182 | 313.786 | 0.9890 |
| After 3-h loading | 3.897 | 1.685 | 1.870 | 266.512 | 0.9827 | |
| SMA-13 | Before loading | 4.700 | 0.857 | 1.982 | 213.012 | 0.9829 |
| After 3-h loading | 0.617 | 2.016 | 2.382 | 224.909 | 0.9154 | |
| Type of Mixture | Mesoscopic Indices | Macroscopic Indices | ||||
|---|---|---|---|---|---|---|
| Coordination Number Peak Value | C (%) | DS (times·mm−1) | RD at Loading Time of 1 h (mm) | RD at Loading Time of 3 h (mm) | ||
| 70# asphalt AC-13C | 1.78 | 1.88 | 7.48 | 2136 | 5.88 | 10.26 |
| Rock asphalt AC-13C | 1.69 | 1.82 | 7.29 | 3980 | 2.50 | 5.25 |
| SMA-13 | 2.02 | 2.15 | 4.89 | 4222 | 1.46 | 3.64 |
| Average value | 1.83 | 1.95 | 6.55 | 3446 | 3.28 | 6.38 |
© 2019 by the authors. Licensee MDPI, Basel, Switzerland. This article is an open access article distributed under the terms and conditions of the Creative Commons Attribution (CC BY) license (http://creativecommons.org/licenses/by/4.0/).
Share and Cite
Shi, L.; Yang, Z.; Wang, D.; Qin, X.; Xiao, X.; Julius, M.K. Gradual Meso-Structural Response Behaviour of Characteristics of Asphalt Mixture Main Skeleton Subjected to Load. Appl. Sci. 2019, 9, 2425. https://doi.org/10.3390/app9122425
Shi L, Yang Z, Wang D, Qin X, Xiao X, Julius MK. Gradual Meso-Structural Response Behaviour of Characteristics of Asphalt Mixture Main Skeleton Subjected to Load. Applied Sciences. 2019; 9(12):2425. https://doi.org/10.3390/app9122425
Chicago/Turabian StyleShi, Liwan, Zhen Yang, Duanyi Wang, Xiao Qin, Xin Xiao, and Masley Kwaku Julius. 2019. "Gradual Meso-Structural Response Behaviour of Characteristics of Asphalt Mixture Main Skeleton Subjected to Load" Applied Sciences 9, no. 12: 2425. https://doi.org/10.3390/app9122425
APA StyleShi, L., Yang, Z., Wang, D., Qin, X., Xiao, X., & Julius, M. K. (2019). Gradual Meso-Structural Response Behaviour of Characteristics of Asphalt Mixture Main Skeleton Subjected to Load. Applied Sciences, 9(12), 2425. https://doi.org/10.3390/app9122425