Communication

Thermodynamic Simulations for Determining the Recycling Path of a Spent Lead-Acid Battery Electrolyte Sample with Ca(OH)2

1
Center for Carbon Mineralization, Mineral Resources Division, Korea Institute of Geoscience and Mineral Resources, 124 Gwahak-ro, Gajeong-dong, Yuseong-gu, Daejeon 34132, Korea
2
Shanghai Environment Sanitation Engineering Design and Research Institute Co. Ltd., Shanghai 200232, China
3
School of Resources, Environment, and Materials, Guangxi University, 100 Daxue Rd, Nanning 530004, China
*
Author to whom correspondence should be addressed.
Appl. Sci. 2019, 9(11), 2262; https://doi.org/10.3390/app9112262
Submission received: 9 May 2019 / Revised: 22 May 2019 / Accepted: 27 May 2019 / Published: 31 May 2019
(This article belongs to the Special Issue Electronic Waste: Management and Recovery Technologies)

Abstract

:

Featured Application

This thermodynamic simulation can help design the recycling process of spent lead-acid battery electrolyte. The effect of ambient CO2 and pH can be simulated by thermodynamic calculations.

Abstract

By utilizing thermodynamic calculations, the possible removal path of spent lead-acid battery electrolytes was modeled. The process was divided into precipitation and carbonation processes. In the carbonation process, two scenarios were discussed, namely carbonation with and without pre-filtration of the precipitates resulted from the precipitation process. The results showed that in the precipitation process, the theoretical limit for the chemical removal of SO42− was 99.15%, while in the following carbonation process without filtration, only 69.61% of SO42− was removed due to the fact that CO2 reacts with Ca2+ ion in the solution, and thus leads to the production of CaCO3 and SO42− ions in the solution. In the carbonation process without filtration, with the increase of CO2 in the solution the removal ratio of SO42− further decreases. Thermodynamic simulation was effective in predicting the theoretical removal limits and helps in understanding and optimizing the removal process.

Graphical Abstract

1. Introduction

Lead-acid batteries (LAB) are widely used in motor vehicles [1,2], backup power supplies [3], and stand-alone power systems [4,5] due to their properties of excellent reliability, low cost, good operation life, high surge currents, and relatively large power-to-weight ratio [6]. LABs, as the single most-used battery system worldwide, consume approximately 85% of the total global lead production [7]. To satisfy the huge and ever-increasing demand for lead worldwide, in 2014 alone 2.46 million tons of secondary lead was recovered from spent LABs. [8] The first step in the recycling process is disassembly, in which spent LABs are separated into four parts, i.e., the grid, with the main composition being lead (92~95%), lead paste, which is mainly composed of lead oxide (PbO), lead dioxide (PbO2), lead sulfate (PbSO4), and lead (Pb) plastics, which are the main composition of shells, and electrolytes, with the main composition being sulfate acid (38 wt.% H2SO4). The grid separated from spent LABs is commonly refined for utilization in the manufacture of new LABs [9]. The lead paste has been intensively studied with various hydrometallurgy and pyrometallurgy techniques [10,11,12,13,14]; shells are also recovered as polypropylene for manufacturing new LABs [15,16], and the electrolytes are normally collected for further purification [8]. However, in spent LAB recycling plants, installation of new devices is required to collect and handle the highly corrosive electrolytes. In a typical disassembly and refinery plant, spent electrolytes are often discharged onto the ground and collect in a pit, which makes the purification process unreasonable for recycling. The typical recycling methods of SO42− ions from wastewater include: adsorption [17], chemical precipitation [18,19], biological treatment [20], and ion exchange [21]. Due to the high concentrations of SO42− in the spent electrolytes, chemical precipitation was adopted. BaCl2 [22], limestone [19], and ettringite [23] have been used to remove SO42− in wastewater, while no detailed theoretical calculation has been reported. In this paper, the systematic theoretical calculations of spent LAB electrolytes’ reactions with Ca(OH)2 were conducted, and sulfate ions were then recovered as CaSO4·2H2O. Thermodynamic calculations were utilized to simulate the whole process, based on which the optimum conditions and recycling path were obtained. The thermodynamic simulation predicted the theoretical chemical precipitation removal efficiency and suggested that ambient CO2 should be avoided in the precipitation process and filtration should be adopted before the carbonation process to achieve higher efficiency.

2. Materials and Methods

2.1. Materials

The spent LAB electrolyte sample was received from Dansuk Industrial Co., Ltd., Gyeonggi-do, Korea. The spent electrolyte sample was first filtered and analyzed with Inductively coupled plasma-optical emission spectrometry (ICP-OES) to measure the concentration of SO42− ions. The concentration of SO42− in the spent electrolyte was 147,000 mg/L. The main impurities of the spent electrolyte were Ca2+, Mg2+, and Pb2+ (3.01 mg/L). Due to the low concentrations of both Ca2+ and Mg2+ and the fact that both ions are not toxic, only Pb2+ was discussed in detail in this research. The pH of the spent electrolyte solution was measured with a Thermo ScientificTM OrionTM Versa Star ProTM pH meter equipped with a highly sensitive ROSS Ultra 8302BNUMD electrode, with the mean pH being −0.53.

2.2. Methods

The thermodynamic calculations were carried out with Matlab® R2010a software using thermodynamic parameters of all possible reactions. At the first stage, spent H2SO4 from the electrolyte sample was precipitated with Ca(OH)2 powder until the solution was almost saturated calcium hydroxide, then the carbonation processes were simulated, both with and without pre-filtration of the precipitates resulted from the precipitation process. All simulations were performed under the condition that the temperature was kept at 25 °C at all times. Equations (1)–(3), (4)–(13), and (14)–(21) from Table 1 were used in the calculation of the thermodynamic equilibrium distributions of the saturated solutions of Ca(OH)2, CaCO3, and CaSO4·2H2O, respectively, while Equations (21)–(29) and (30)–(43) from Table 1 were utilized to calculate the thermodynamic distributions of different species during the precipitation process and carbonation process after filtration of the precipitates. Equations (44)–(47), together with Equations (23), (24), (26)–(29), (34), (35), (37), and (39) from Table 1, were utilized to calculate the carbonation process without the filtration of precipitates resulted from the precipitation process. Equations (48)–(55) and (56)–(61) from Table 1 were used to calculate the thermodynamic distributions of Pb2+ in precipitation and carbonation processes, respectively. All species (aqueous species and precipitates) at different pH can be obtained by solving the matrix of equilibrium constants and mass balances.
It is worth pointing out that in the modeling process of carbonation, the system was considered as a closed system with a certain amount of CO2 injected into the system. This was adopted due to the fact that CO2 was the gas and the amount of CO2 consumed cannot be easily obtained.
Due to the fact that calcium, sulfate, and carbonate are all divalent ions with quite low ionic activity coefficients (γ), which are γCa2+ = 0.28 (I = 0.7, 25 °C and 1 atm), γSO42− = 0.12, and γCO32− = 0.20 (I = 0.7, 25 °C and 1 atm), respectively, the activity corrections are needed in the thermodynamic modeling process. The definition of ionic strength (I) and activity coefficient are shown in Equations (1) and (2) [24]:
I = 1 / 2 m i Z i 2
γ i =   a i m i
where mi is the molality of an aqueous species, i is the corresponding aqueous species, Zi is the charge of i, ai is activity of species i, and γi is the activity coefficient of species i. In this study, a simplified Helgeson-Kirkham-Flowers model was used to calculate the activity coefficient, as shown in Equation (3) [25,26,27]:
L o g γ i =   A Z i 2 ( I 1 + B I ) L o g ( 1 + 0.018 m k ) + b I
where A is the Debye-Hückel slope, B is the distance of the closest approach, b is a solute specific parameter, and k is all solute species in the aqueous solution.

3. Results

3.1. Precipitation

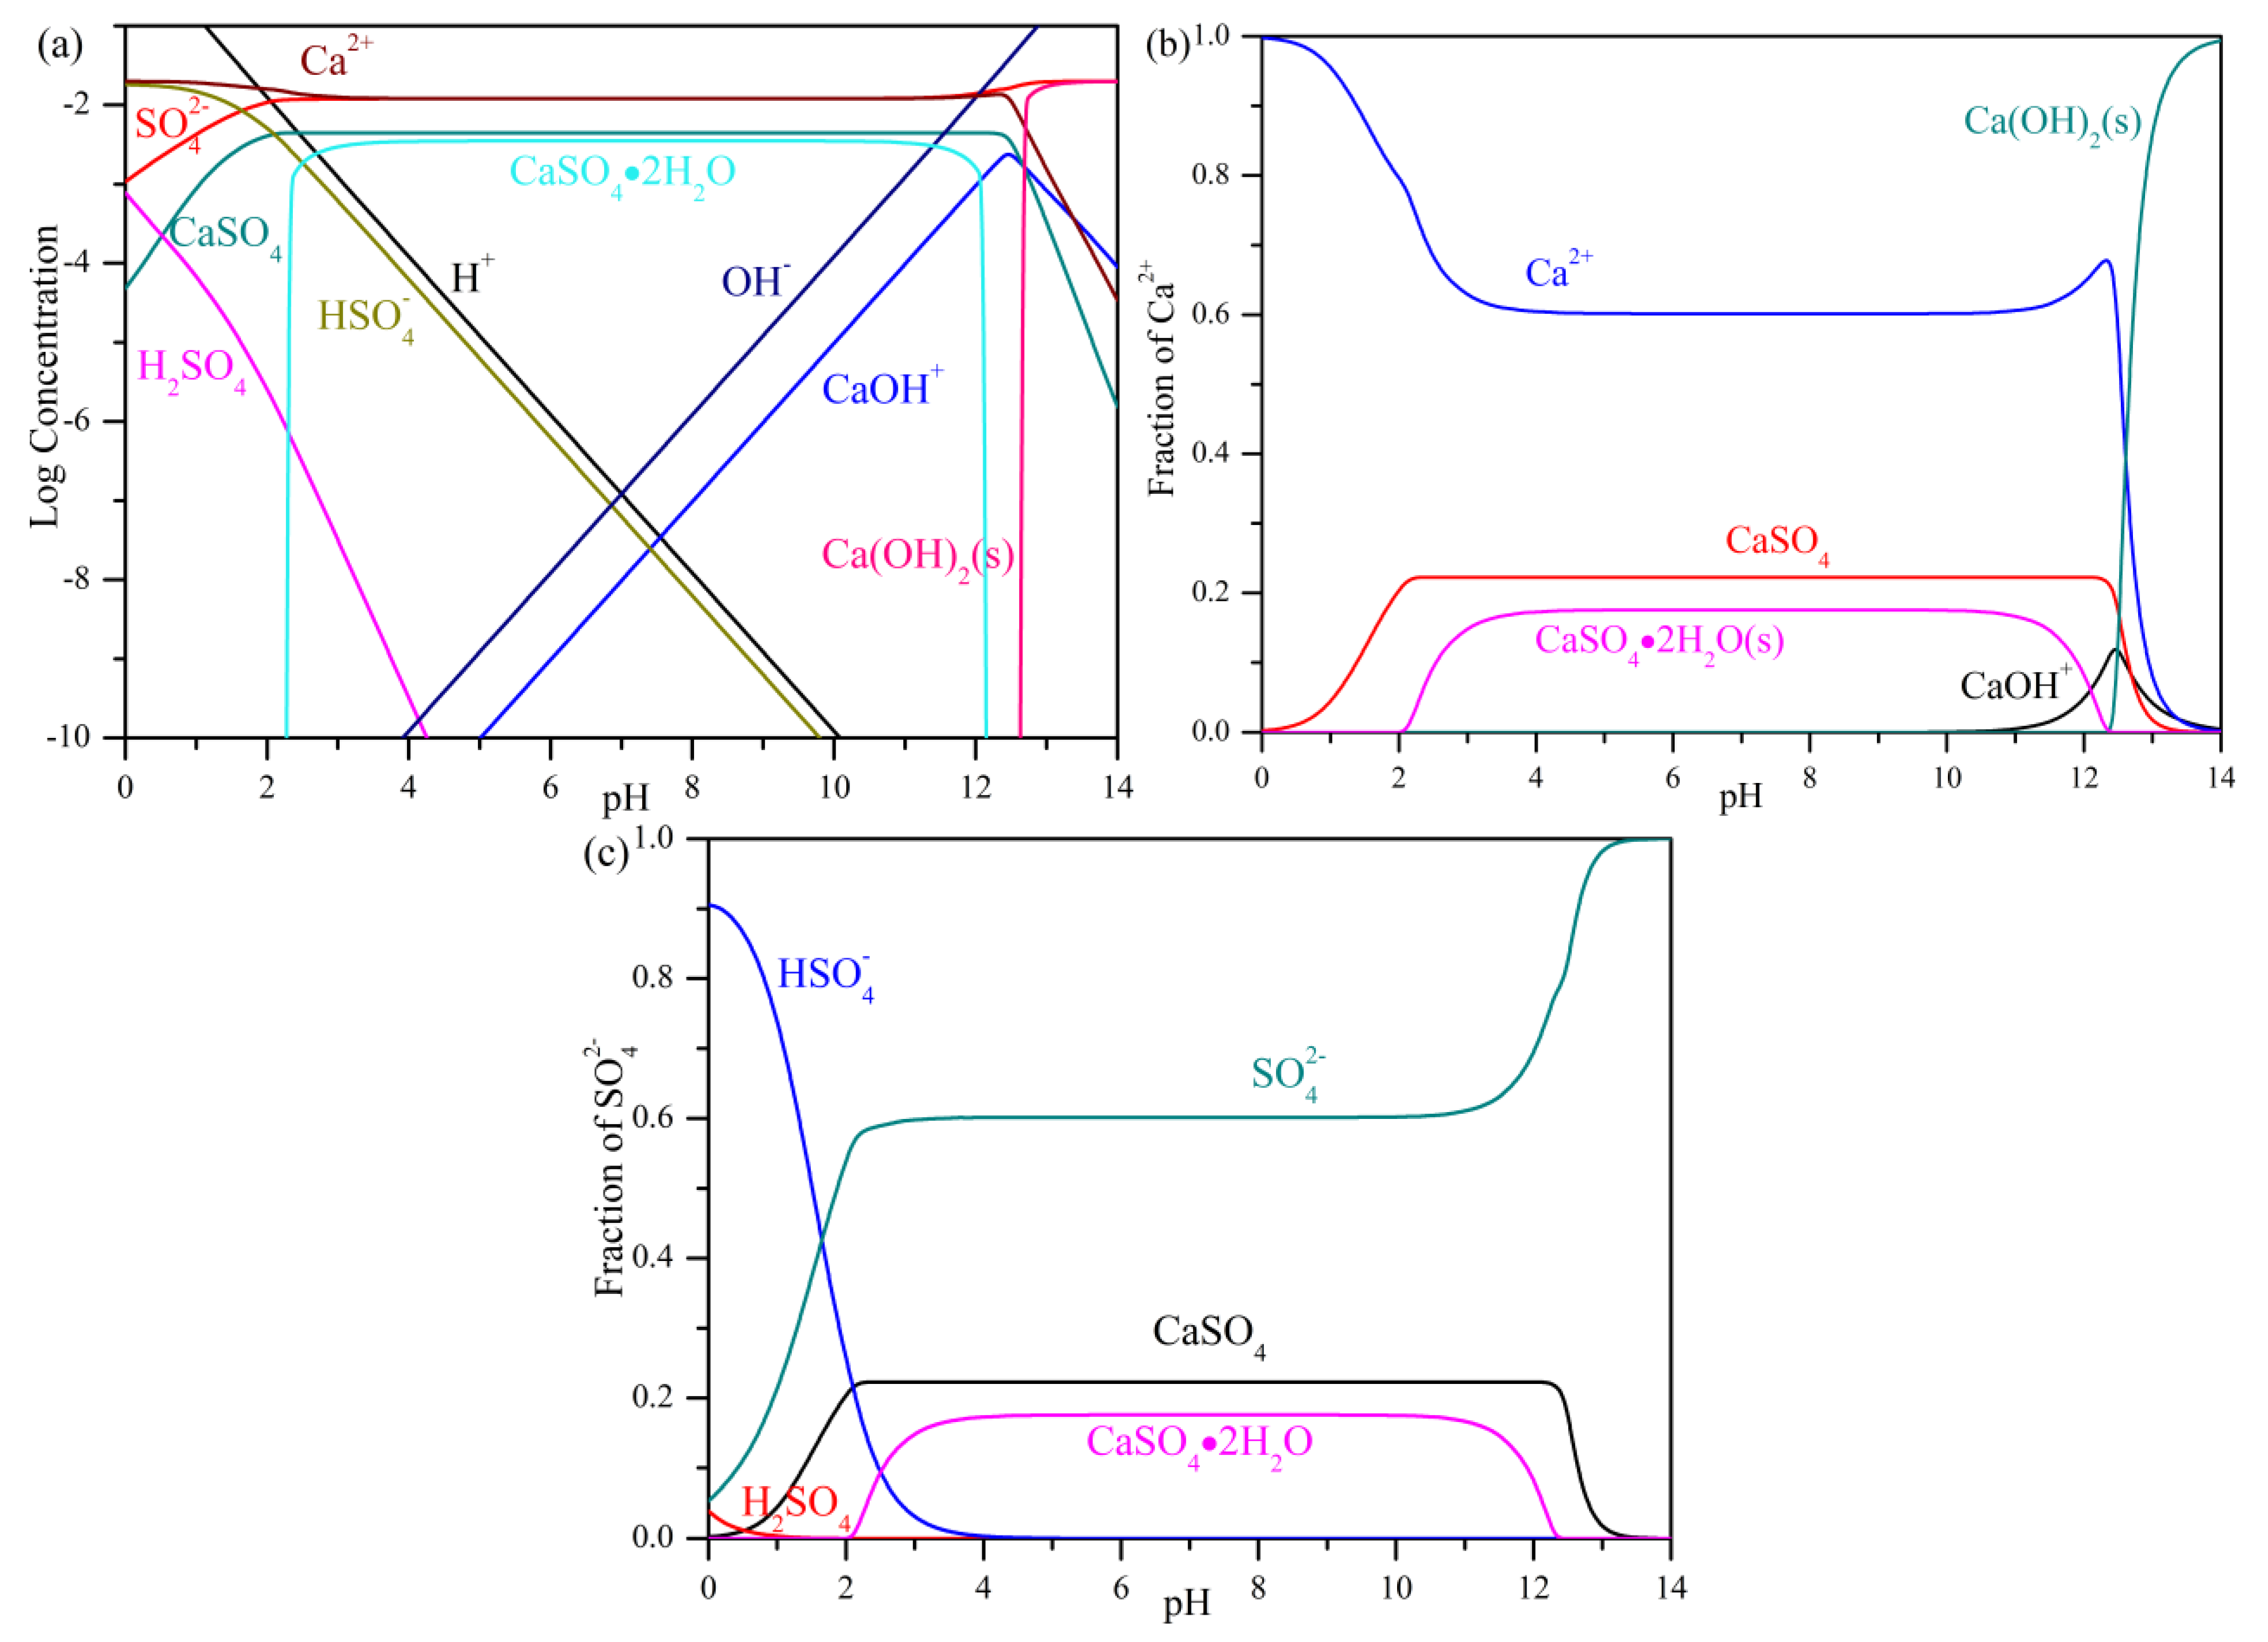
Figure 1 shows the thermodynamic calculations of 30 mM Ca(OH)2 in aqueous solution at 25 °C with different pH. The theoretical values were obtained by solving the matrix consisting of both equilibrium constants (Equations (2) and (3) from Table 1) and mass balances (Equations (4) and (5)). With Matlab, this set of equations were simultaneously solved with 100 steps in the whole pH range (0~14), thus giving the distribution of each species at different pH. In the case of Ca(OH)2 solution, four species, Ca2+, CaOH+, OH, and Ca(OH)2(s), were taken into consideration. Figure 1a shows the log concentrations of different species in 30 mM Ca(OH)2 solution with different pH. Log concentrations were adopted due to the low concentrations of each species. As can be seen, with the increase of pH the concentration of Ca2+ first stays unchanged when pH < 12.6, while with the further increase of pH, the concentration of Ca2+ decreased slowly, and at the same time Ca(OH)2(s) emerged in the solution as a precipitate. CaOH+ ions started to appear at pH 6, the log concentration of which increased linearly until pH 12.6, after which the log concentration of CaOH+ ions started to decrease linearly. In Figure 1b, the fraction of calcium was calculated vs. pH, and a similar change of concentration was also observed for Ca2+, CaOH+, and Ca(OH)2. The theoretical parameters of saturated Ca(OH)2 are shown in Table 1; as can be seen, the theoretical pH of saturated Ca(OH)2 is 12.45 with CCa2+ = 19.48 mM. Similarly, the equilibrium distributions of saturated CaCO3 solution can be calculated by solving the matrix composed of Equations (4)–(13) from Table 1 (thermodynamic parameters) and (6)–(8) (mass balances). The distributions of different species in CaCO3 solution was also shown in Figure 2 and Table 1. As can be seen, for the saturated solution of CaCO3, the equilibrium pH is 9.94 and CCa2+ = 0.1415 mM. For the saturated CaCO3 solution, if the pH is high enough (pH > 13), Ca2+ from CaCO3(s) will dissolve into solution and form Ca(OH)2(s), thus causing the increase of concentration of free Ca2+ ions. As for saturated CaSO4 solution (Figure 3), the equilibrium pH is 7.08 and the equilibrium CCa2+ = 12.03 mM. In the saturated solution of CaSO4, the main precipitate would be CaSO4·2H2O; as can be seen from Figure 3b, with the increase of pH CaSO4·2H2O starts to decrease at pH 11 and the dominant precipitate becomes Ca(OH)2(s) at approximately pH 13. Therefore, for recovering CaSO4·2H2O, the pH should be controlled properly. By comparing the data in Figure 1 and Figure 2, it is clear that the equilibrium concentration of Ca2+ in CaCO3 solution was significantly smaller than that in Ca(OH)2 solution, which was caused by the much smaller solubility products (Ksp) of CaCO3, and should carbonation happen in the precipitation process the concentration of Ca2+ should also decrease, which would, in turn, cause the increase of SO42−. Based on the results obtained from Figure 1, Figure 2 and Figure 3, we conclude that the saturated CaCO3 solution has the lowest equilibrium CCa2+, and contacting with CO2 might decrease the concentration of Ca2+ ions, which will help us better understand the carbonation process discussed in Section 3.2. The detailed species distribution of saturated Ca(OH)2, CaCO3 and CaSO4 can be found in Table 2.
C C a 2 + + C C a ( O H ) 2 ( s ) +   C C a O H + =   C a t o t a l
2 ×   C C a 2 +   + C C a O H + = C O H
C C a C O 3 ( s ) +   C C a C O 3 +   C C a H C O 3 +   C C a 2 + =   C C a t o t a l
C C a C O 3 ( s ) + C C a C O 3 +   C C a H C O 3 +   C C O 3 2 +   C H C O 3   +   C H 2 C O 3 +   C C O 2 +   C C O 2 ( g )          =   C C O 3 2 t o t a l
C C a H C O 3 +   C H C O 3   + 2 × ( C H 2 C O 3 +   C C O 2 +   C C O 2 ( g ) ) =   C O H
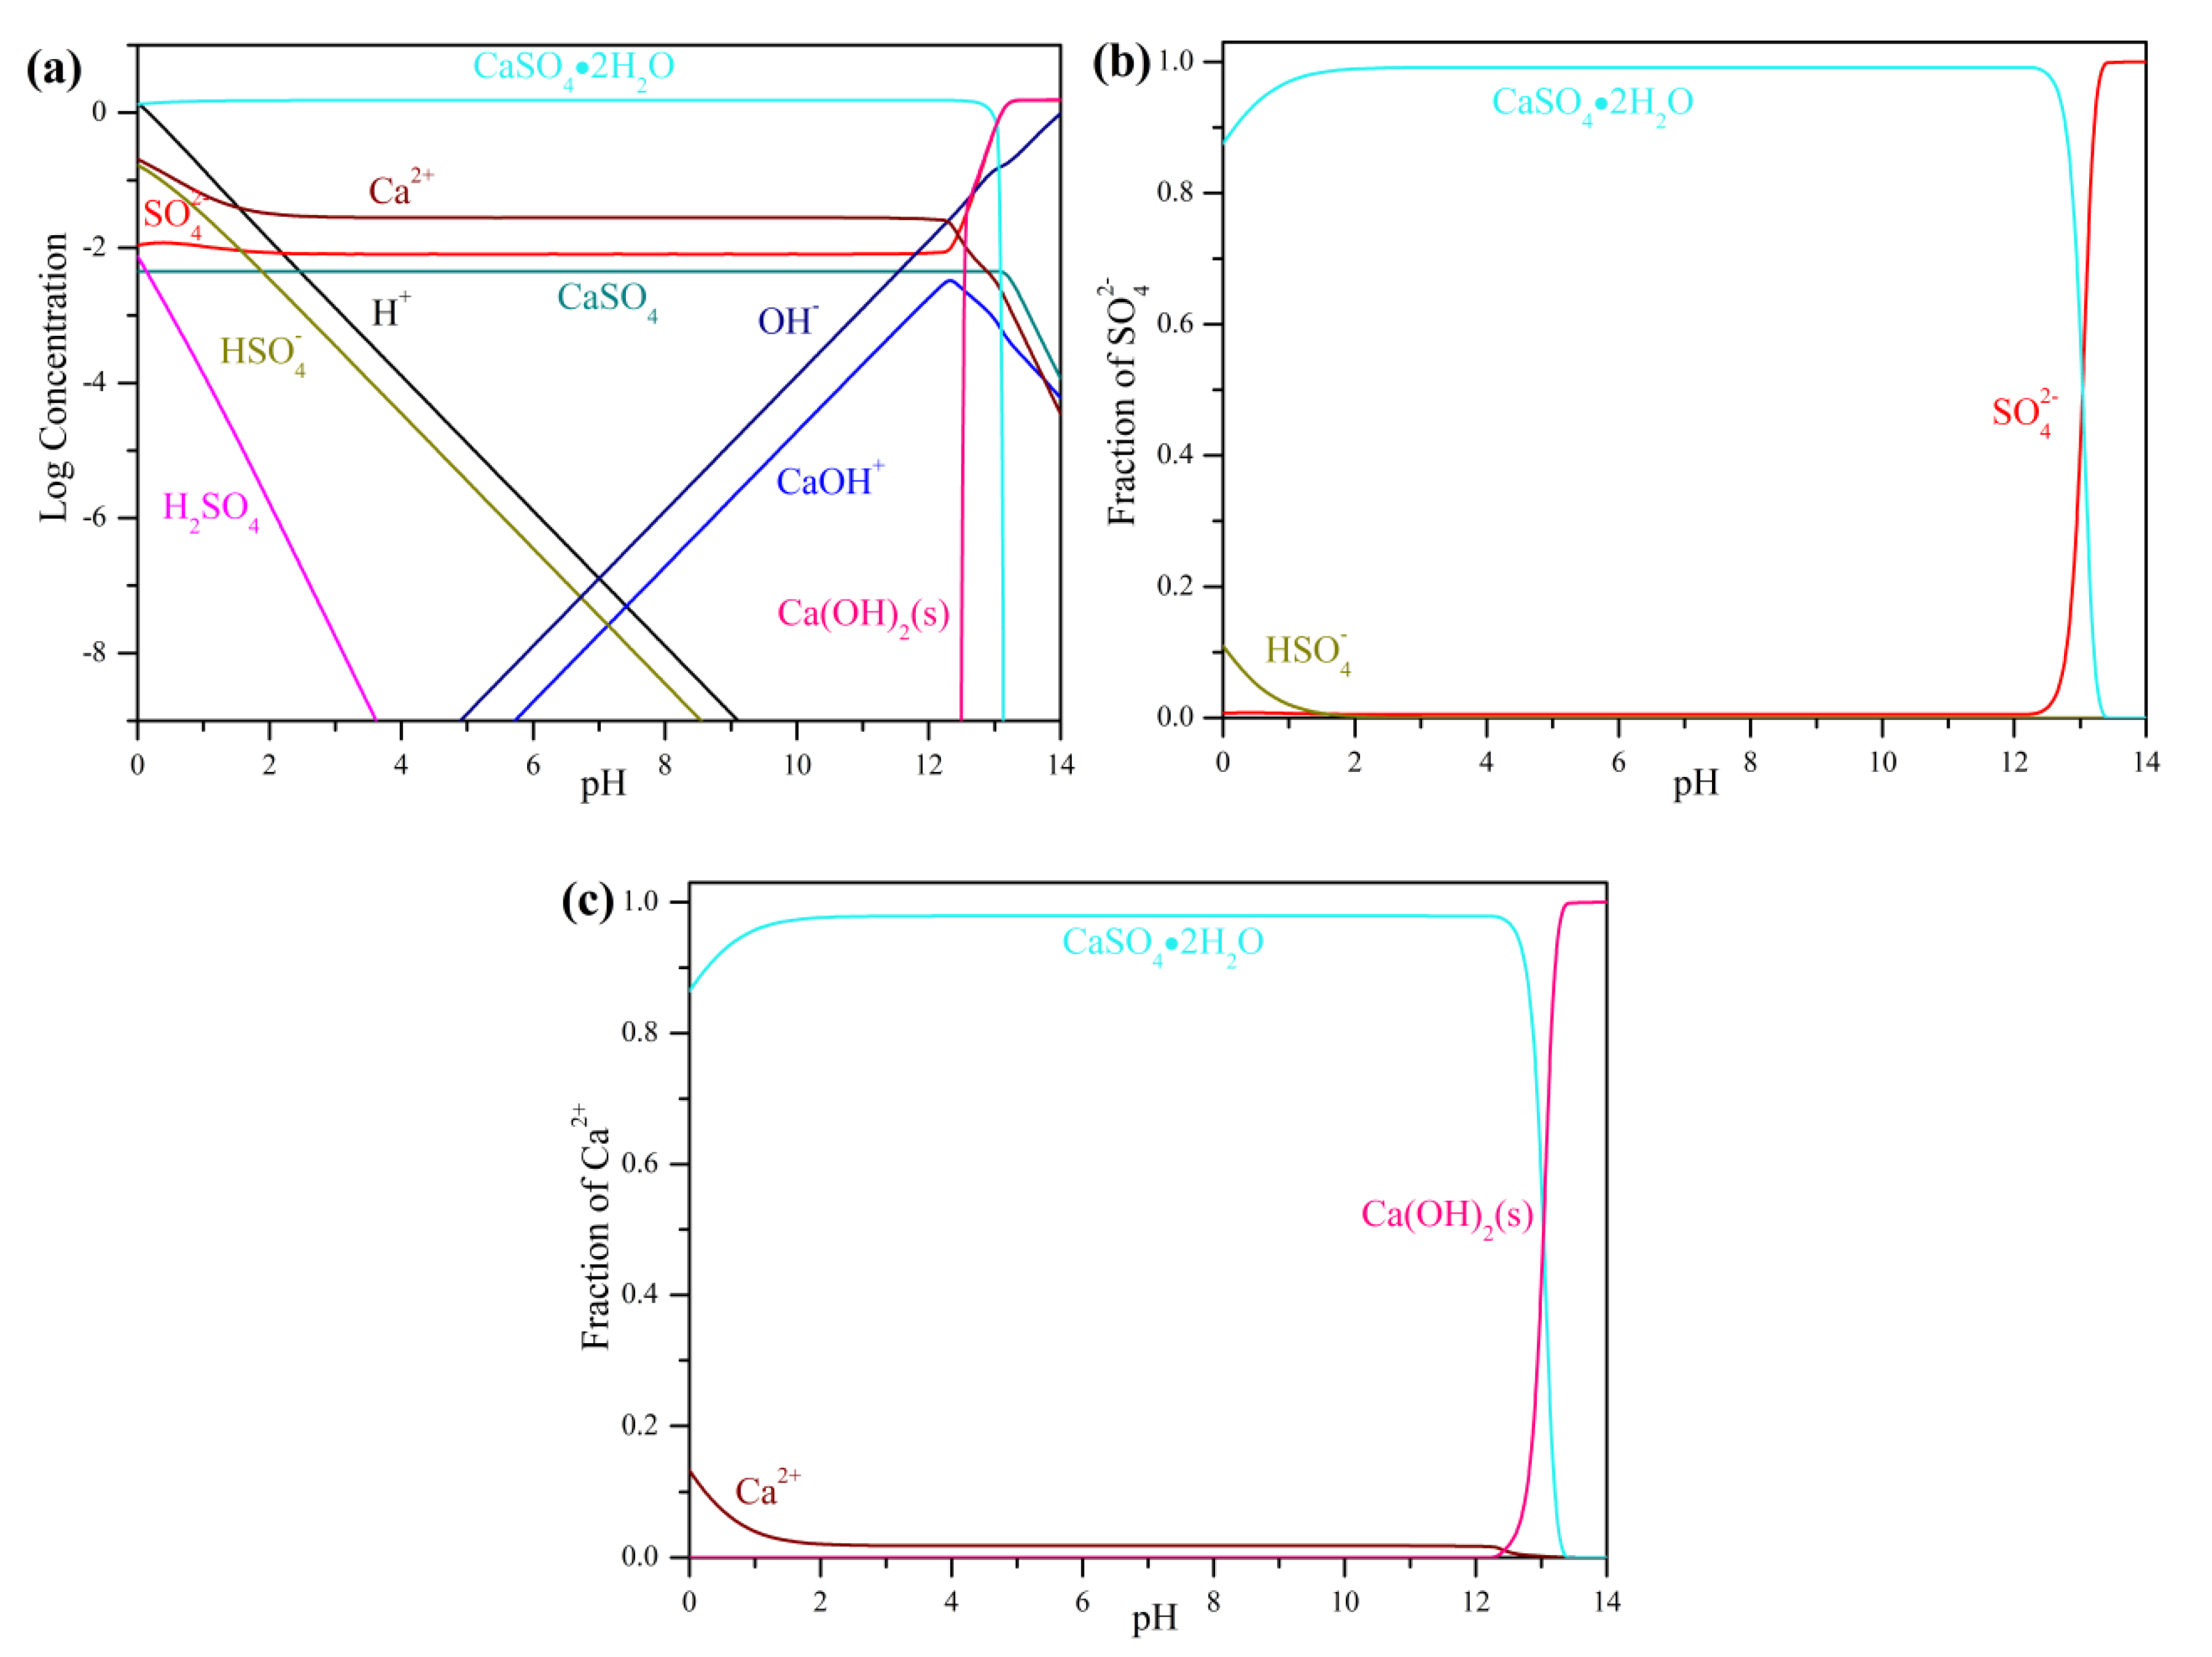
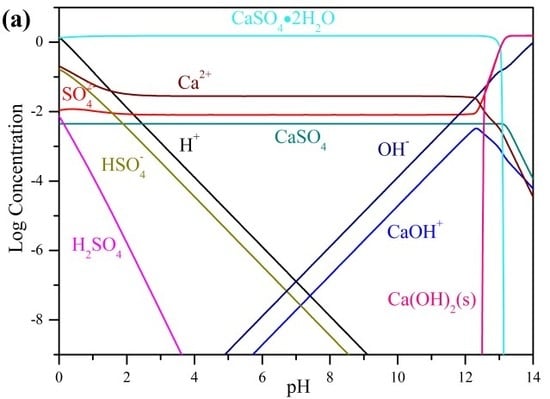
According to the ICP-OES measurement results, the concentration of SO42− in the spent electrolyte sample was 1.53 M. Figure 4 shows the reaction equilibriums of 1.53 M SO42− reacting with 1.55 M Ca(OH)2 at different pH. Extra Ca(OH)2 was introduced to ensure the removal of SO42− ions. As can be seen from Figure 4, the main precipitates were CaSO4·2H2O in a wide pH range (pH: 2~12), according to Equation (9), and when pH < 2 [19], CaSO4·2H2O would dissolve into the solution and become Ca2+ and SO42− ions, according to Equation (10). At the same time, if pH > 12, the ratio of CaSO4·2H2O might also decrease because of the formation of Ca(OH)2(s) (Figure 4c) and SO42− (Figure 4b), according to Equation (11). The final pH and composition of the mixture are shown in Table 3; as can be seen, the equilibrium pH of the mixture is 12.42 with CCa2+ = 25.06 mM, CSO42− = 8.668 mM, and CCaSO4·2H2O = 1517 mM. Based on these data, the removal ratio of SO42− can be calculated and shown in Table 3. Also, by comparing the data obtained from the precipitation process with the saturated CaCO3 and CaSO4 solution data, the result indicates that if CO2 was introduced in the precipitation process, the removal efficiency of SO42− might decrease. Therefore, ambient CO2 should be avoided in the precipitation process to obtain a higher removal efficiency. Also, the theoretical results obtained in this model are very close to the experimental results of Fang et al. [23].
Ca ( OH ) 2 ( s )   +   H 2 SO 4     CaSO 4 · 2 H 2 O   ( s )
CaSO 4 · 2 H 2 O   ( s )   +   H +     HSO 4   +   Ca 2 +   +   2 H 2 O
CaSO 4 · 2 H 2 O   ( s )   +   2 OH     Ca ( OH ) 2 ( s )   +   SO 4 2   +   2 H 2 O
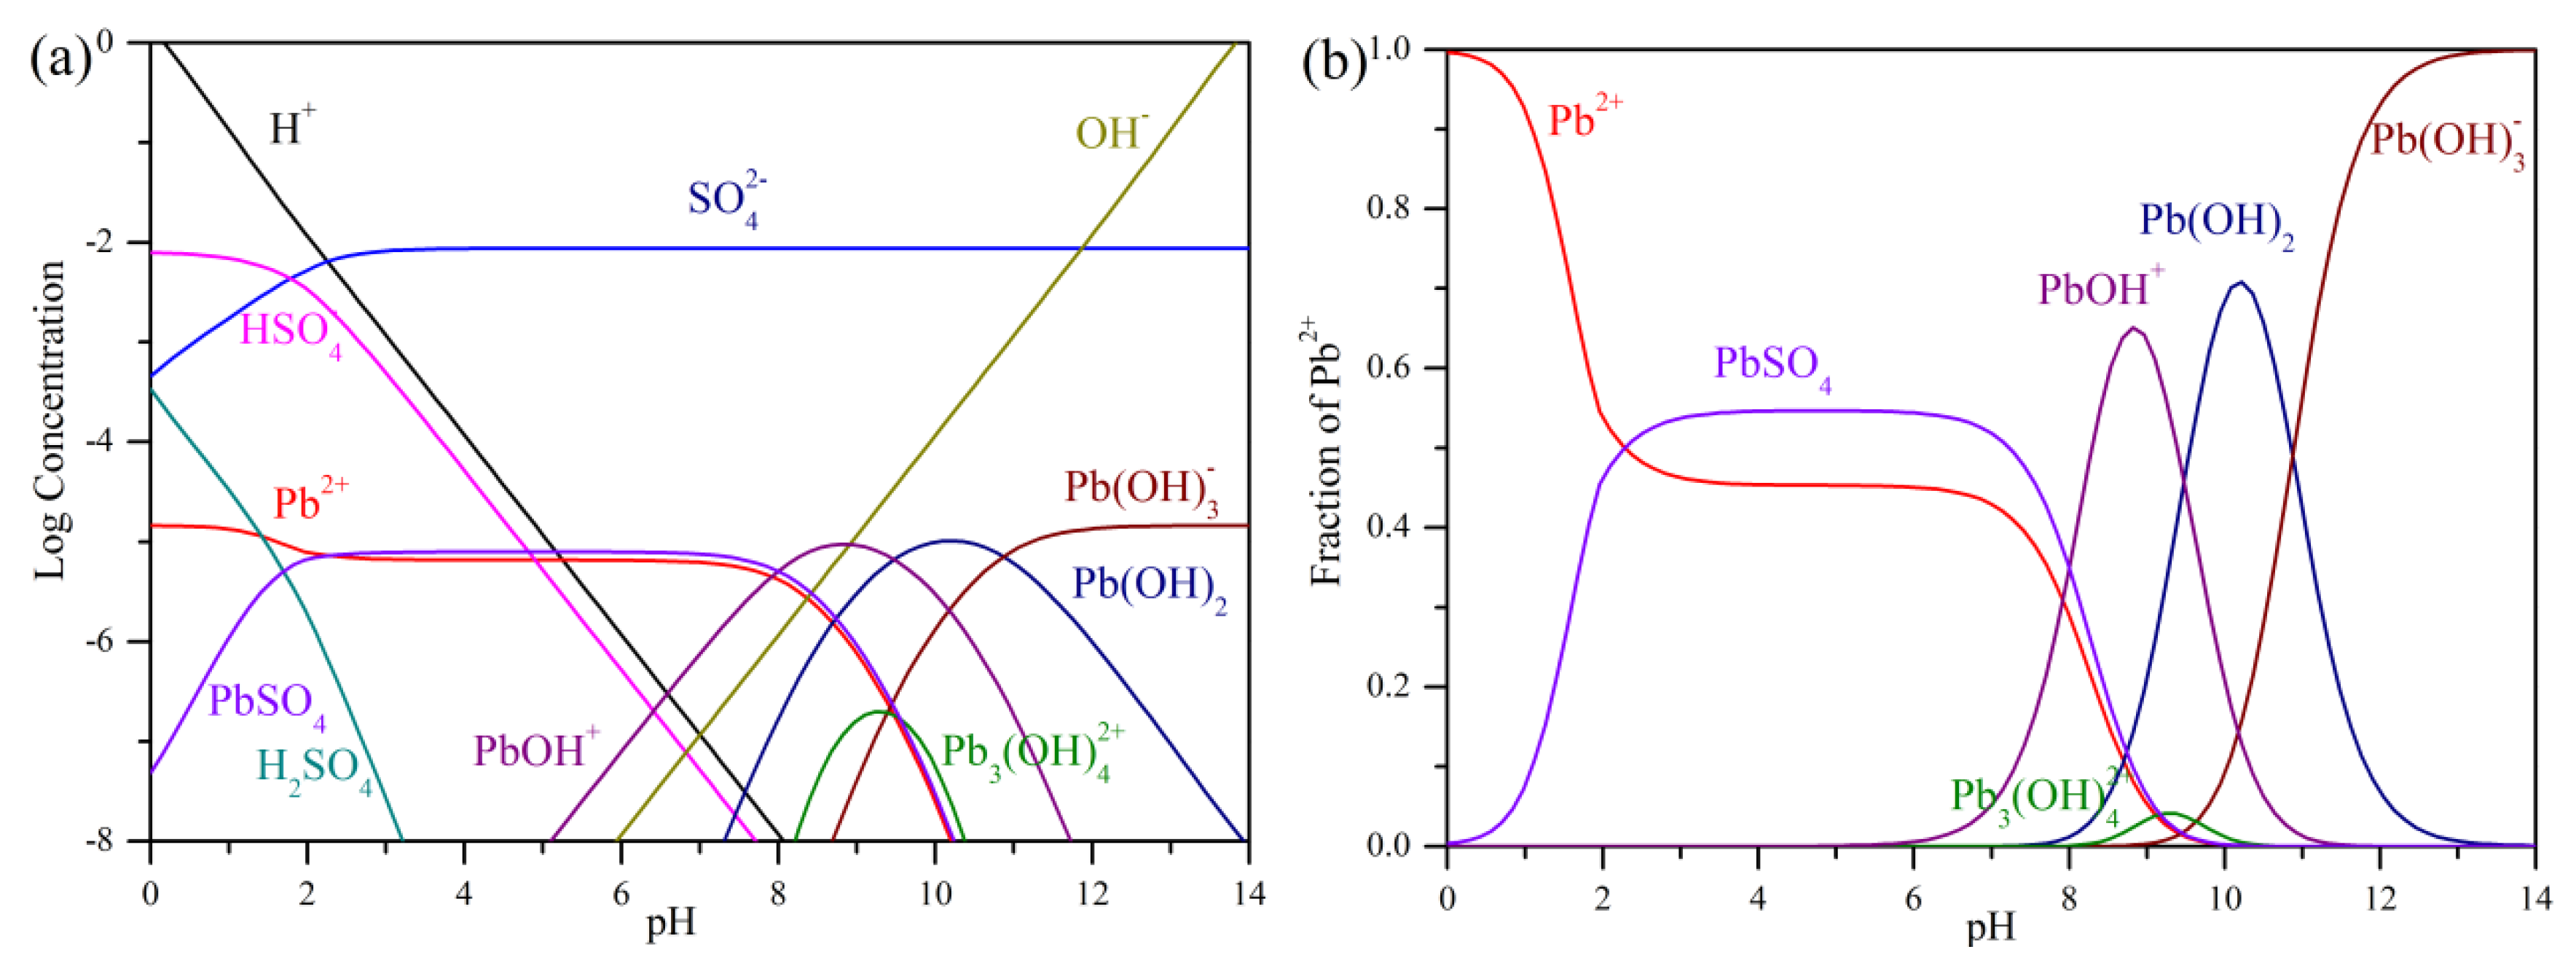
Figure 5 shows the distributions of lead-related ions at different pH. As can be seen from Figure 5a, no precipitation was formed in the whole pH range due to the extremely low concentration of lead and the existence of SO42− (Table 3). [28] This might be in favor of the precipitation process due to the fact that lead is toxic, and according to this simulation, no lead was precipitated in the precipitation process with Ca(OH)2. Figure 5b shows the fraction of lead at different pH, based on which the distribution of lead can be divided into three regions: at low pH region (pH < 2), the main form of lead is Pd2+; at moderate pH region (2 < pH < 7), lead was mainly in the form of PbSO4 (Equation (52) from Table 1); at high pH region (pH > 7), lead forms a complex with OH ions and forms four kinds of complexes with the increase of pH (Equations (48)–(51) from Table 1).

3.2. Carbonation

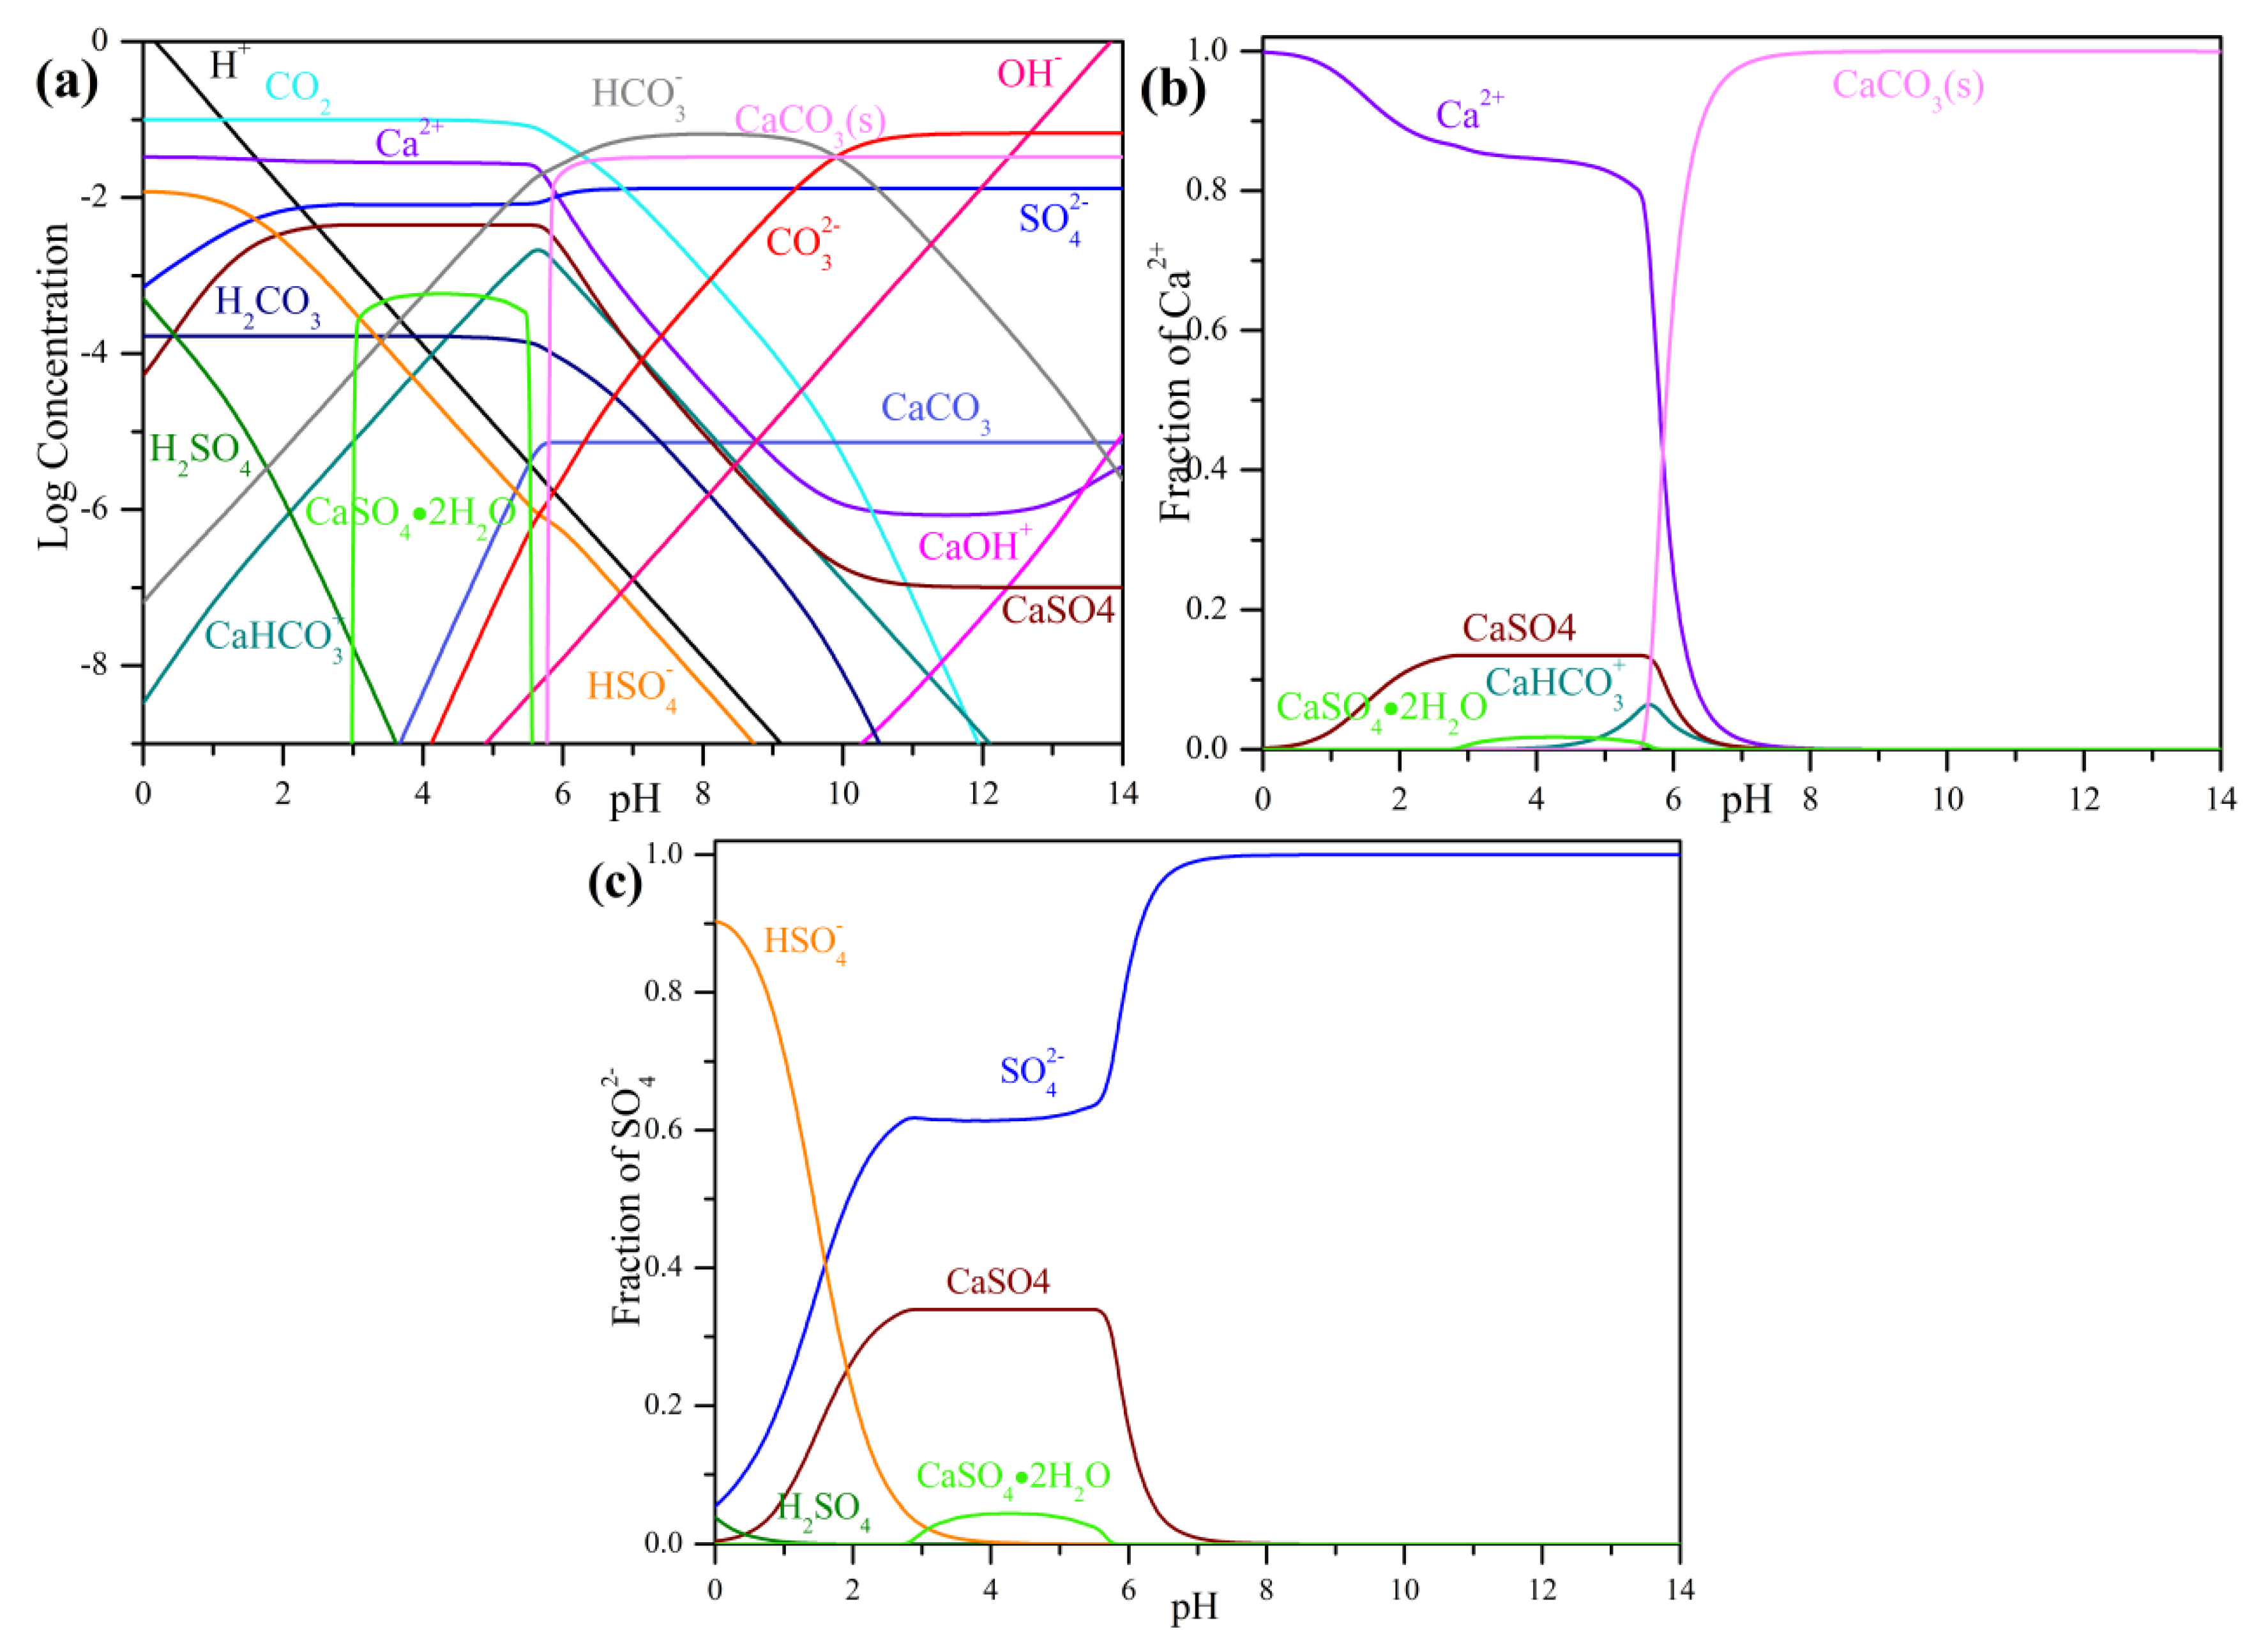
After the precipitation process, the extra Ca(OH)2 should be removed and the carbonation process introduced to both remove extra Ca(OH)2 and neutralize the solution. Due to the fact that the appearance of CO2 might promote the production of CaCO3, which in turn might influence the final products of the carbonation process, the carbonation process was divided into 2 scenarios: with filtration and without filtration of the precipitates resulted from the precipitation process, respectively. In the filtration and carbonation scenario, the total calcium concentration (TCa) TCa = CCa2+ + CCaOH+ + CCaSO4 = 33.122 mM, while the total sulfate concentration (TSO42−) TSO42− = CSO42− + CCaSO4 = 13.125 mM. Figure 6 shows the calculated species distributions of the carbonation process after filtration; as can be seen, the main precipitate when pH > 6 was CaCO3 (Equation (12)), while in the pH range of 3~5 the main precipitate was CaSO4·2H2O (Equation (43) from Table 1). As shown in Figure 6b, with the increase of pH the ratio of calcium in Ca2+ ion form decreases and the ratio in CaCO3 form increases, which was caused by the formation of CaCO3 in the alkaline region (Equation (12)). As can be seen from Figure 6c, when the pH > 7, the dominant species is SO42−, because the dissociation of CaSO4 (Equation (13)) and the dissociation of CaSO4 were caused by the constant removal of Ca2+ according to Equation (12). When the final pH is 7, the equilibrium species distributions are shown in Table 3; as can be seen, the equilibrium C[Ca2+] = 0.4509 mM, C[SO42−] = 13.01 mM, and the main precipitate was CaCO3(s) (32.44 mM).
Ca 2 +   +   CO 2   +   2 OH     CaCO 3 ( s )   +   H 2 O
CaSO 4     Ca 2 +   +   SO 4 2
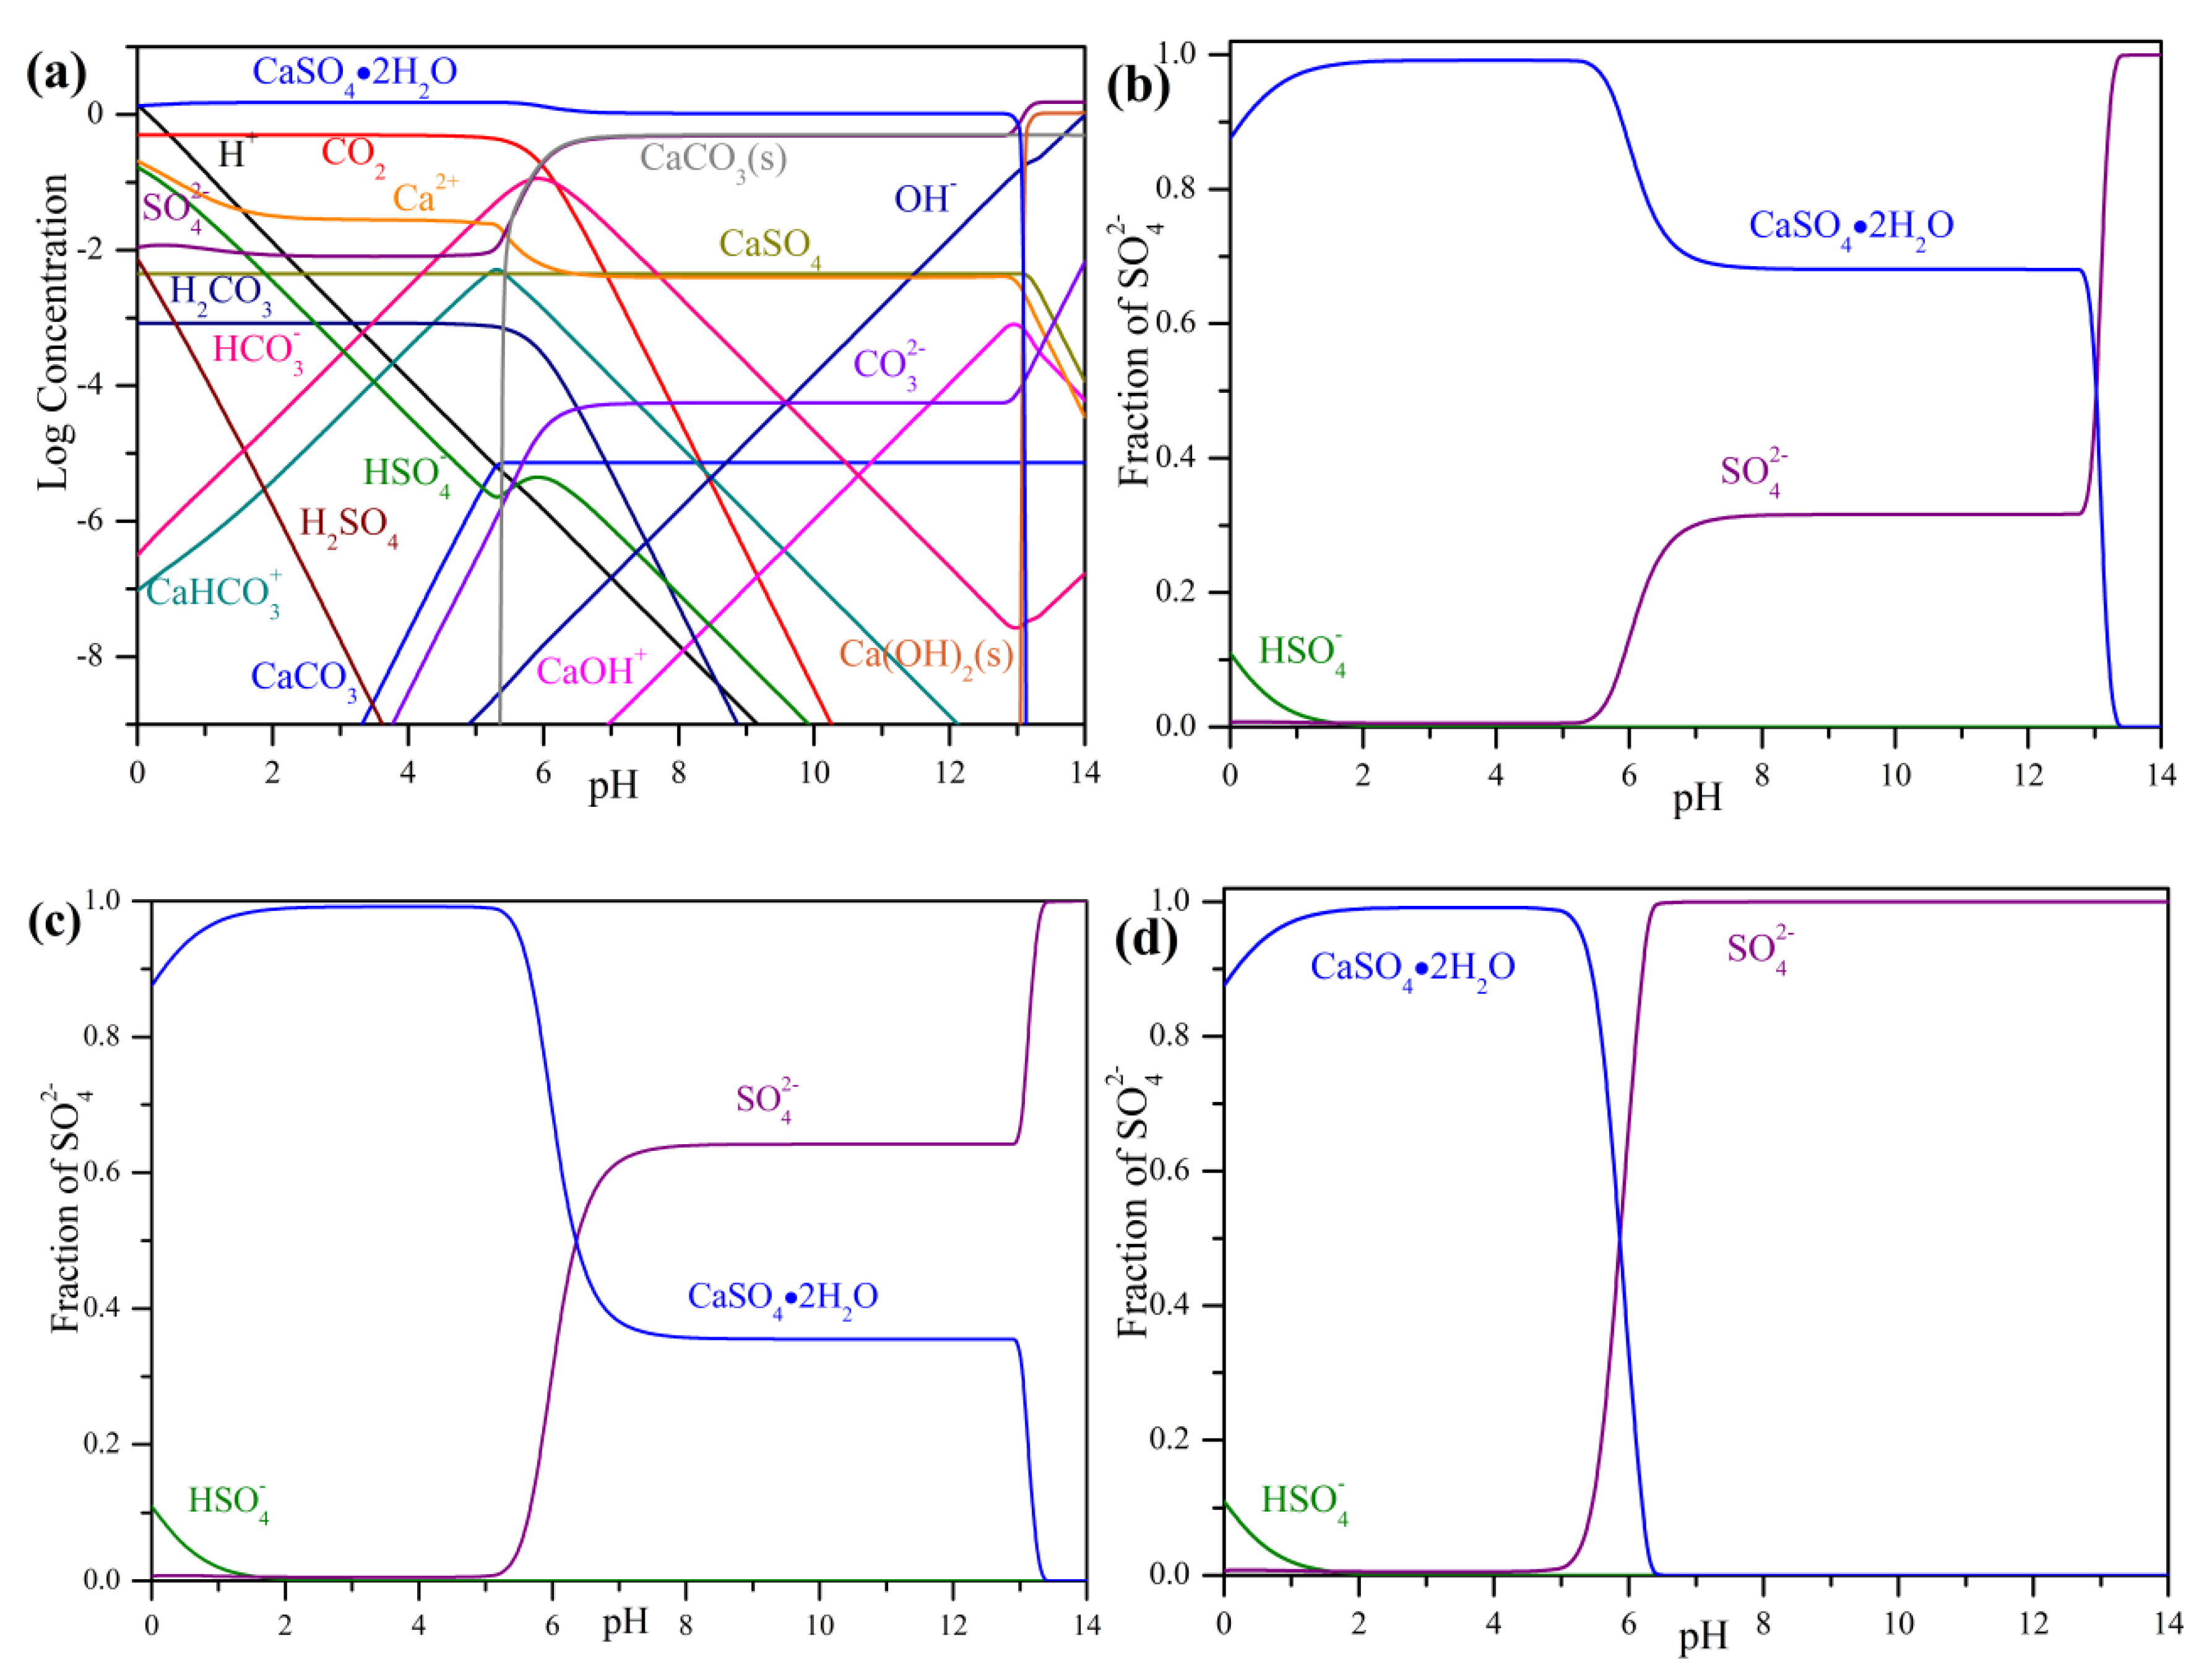
In the case of carbonation without filtration, the total calcium concentration is Tca = 1.55 M, and the total sulfate concentration is TSO42−= 1.53 M. As can be seen from Figure 7, the dominant precipitated species were CaSO4·2H2O (pH: 2~5, Equation (9)), CaSO4·2H2O and CaCO3 (pH: 5~13, Equations (9) and (12)), and Ca(OH)2(s) and CaCO3 (pH: 13~14, Equations (11) and (12)), respectively. When pH is smaller than 2, a certain amount of CaSO4·2H2O would dissolve, as can be seen from Figure 7b (Equation (10)). The decrease of CCaSO4·2H2O in pH 5–7 was mainly caused by the formation of CaCO3 (Equation (12)), which leads to the dissolution of CaSO4·2H2O (Equation (14)), and simultaneously results in the increase of CSO42− in the same region. In other words, this decrease of CCaSO4·2H2O in pH 5–7 resulted from the combination of CaSO4·2H2O dissolution reactions (Equation (14)) and carbonation reaction (Equation (12)). When pH is larger than 13, the fraction of CaSO4·2H2O further decreases to almost zero; this was caused by both the formation of CaCO3 (Equation (12)), and most importantly, the formation of Ca(OH)2(s) (Equation (11)) at extremely high pH. The fraction of CaSO4·2H2O decreases with the increase of CO2 concentrations, according to Figure 7b–d. To obtain a higher removal ratio of SO42−, 0.1 M CO2 was chosen. The equilibrium species distributions of the solution at pH 7 are listed in Table 3; the equilibrium CCa2+ = 4.098 mM, CSO42−= 460.43 mM, CCaCO3(s) = 476.2 mM, and CCaSO4·2H2O = 1065 mM. The calculated removal ratio of sulfate, in this case, is lower (69.61%) than the carbonation after filtration (99.15%).
CaSO 4 · 2 H 2 O   ( s )     Ca 2 +   +   SO 4 2   +   2 H 2 O
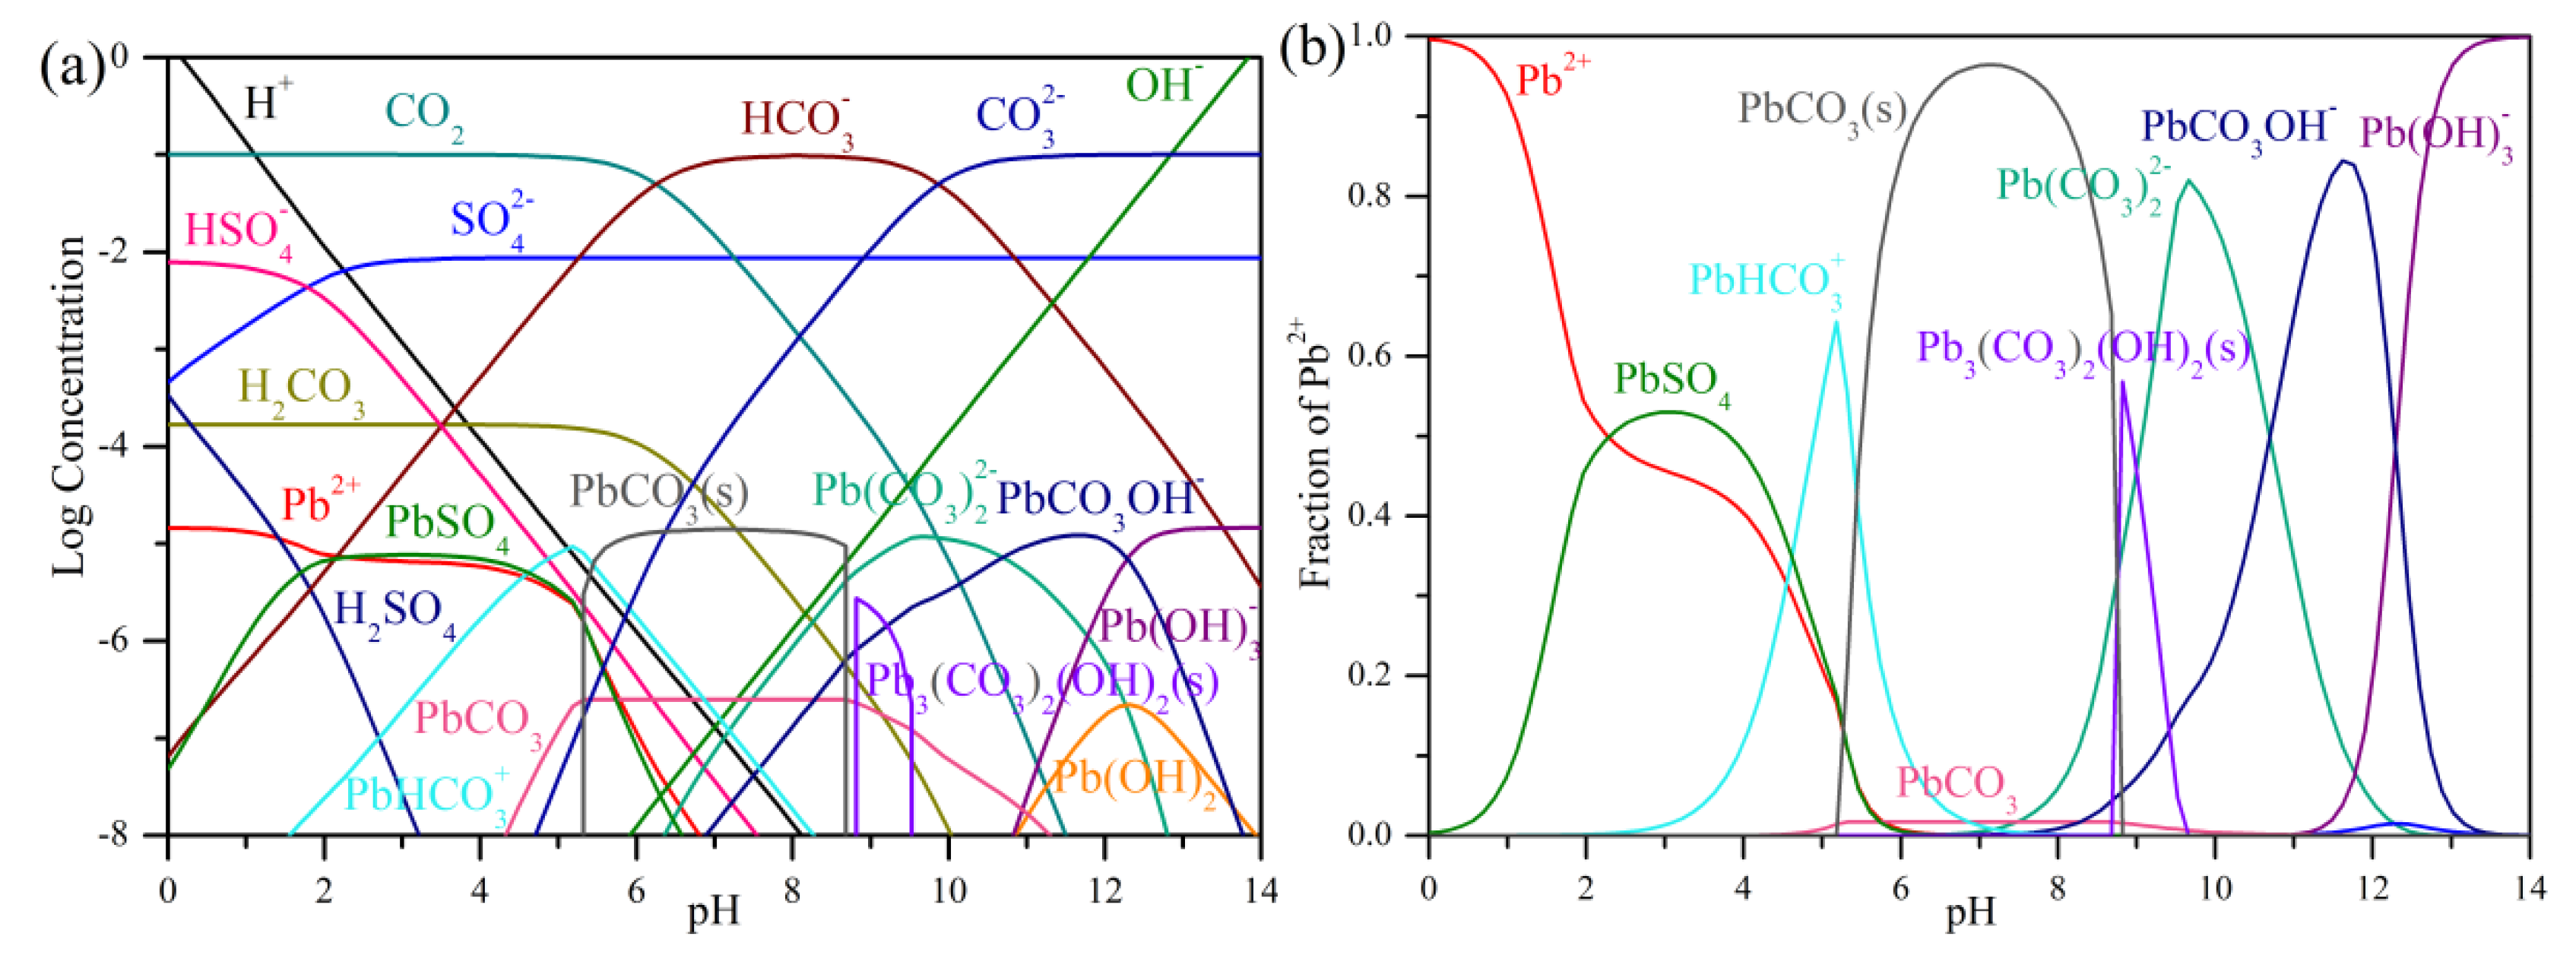
Since carbonation with filtration was a better option than carbonation without filtration, only carbonation with filtration was calculated for lead (Figure 8). As can be seen from Figure 8a, the PbCO3(s) precipitate (Equation (61) from Table 1) existed in the moderate pH region (5 < pH < 9); when pH is lower than this value PbCO3(s) might react with H+ to form PbHCO3+, according to Equation (15), while at a higher pH with the increase of pH, PbCO3(s) might react with both CO32− and OH to form Pb3(CO3)2OH2(s) (Equation (16)), Pb(CO3)22− (Equation (17)), PbCO3OH (Equation (18)), and Pb(OH)3 (Equation (19)), respectively. The end pH = 7 was adopted for the carbonation process, in which 96.35% of lead was precipitated as PbCO3(s), and thus stabilized with CaCO3 in the carbonation process (Table 3).
PbCO 3 ( s )   +   H +     PbHCO 3 +
3 PbCO 3 ( s )   +   2 OH     Pb 3 ( CO 3 ) 2 OH 2 ( s )   +   CO 3 2
PbCO 3 ( s )   +   CO 3 2     Pb ( CO 3 ) 2 2
PbCO 3 ( s )   +   OH     PbCO 3 OH
PbCO 3 ( s )   +   3 OH     Pb ( OH ) 3   +   CO 3 2

4. Conclusions

Normally, the spent LAB electrolytes can be directly filtered and reused on the condition that the electrolytes were collected and handled properly in the dissembling plant. For dissembling plants without appropriate collecting setups, electrolytes are often polluted with foreign ions, since electrolytes are often discharged onto the ground directly. These polluted electrolytes cannot be purified by simple filtration, and thus require more reasonable recycling techniques. Instead, it is more reasonable and profitable to recycle and stabilize SO42− in the form of CaSO4·2H2O, which can be widely used as a fertilizer and for building materials. In this study, the polluted electrolyte sample was recycled with chemical precipitation and carbonation techniques. To understand the whole recycling process, thermodynamic simulations in the precipitation and carbonation processes were conducted. The thermodynamic calculations of saturated Ca(OH)2, CaCO3, and CaSO4 solutions helped us to understand the whole process, since Ca(OH)2 and CaSO4 appear in both precipitation and carbonation processes when the pH is higher than 13. Additionally, CaCO3 appears in the carbonation process with and without filtration. The theoretical limit for the removal ratio of SO42− was predicted to be 99.15% with 1.53 M SO42− and 1.55 M Ca(OH)2. Also, by comparing the carbonation process with and without pre-filtration of the precipitates obtained from the precipitation process, the theoretical removal efficiency of SO42− was calculated to be 99.15% and 69.61%, respectively. With the increase of CO2 concentrations in the solution, the removal efficiency of SO42− further decreased. Furthermore, the chemical precipitation and carbonation of lead in the spent electrolyte sample were calculated; no precipitation existed in the precipitation process due to the appearance of SO42−, while 96.35% of lead was precipitated as PbCO3(s) in the carbonation process, which stabilized lead with CaCO3. The thermodynamic calculations helped us to design and understanding the whole removal process quantitatively. Based on the thermodynamic calculation results, the optimized removal process of SO42− should be precipitation without contact with ambient CO2, since PbCO3 might precipitate around pH 9, which would lead to the existence of lead in CaSO4·2H2O. Additionally, filtration should be undertaken before the carbonation process to avoid the re-dissolution of CaSO4·2H2O. After filtration, the final product of the recycling process (CaSO4·2H2O) is obtained. In the following carbonation process, the flow rate of CO2 and pH should be controlled properly to stabilize lead and extra calcium in the form of PbCO3 and CaCO3, respectively. At last, after chemical precipitation and carbonation, there is still around 13 mM SO42− in the solution, which needs to be removed by adsorption or ion-exchange techniques. The overall theoretical chemical precipitation limit for removal of SO42− was 99.15%. The limitation of the simulation was: (1) in the simulation process of carbonation, where the system was assumed to be a closed system with all CO2 dissolved in the solution; and (2) equilibrium at each pH is achieved by both carbonation reaction and addition of HCl or NaOH when needed. These limitations might cause the deviation of simulation values from experimental results, however, the tendency of the whole process should be similar, which makes the simulation of the carbonation process a good tool for reference.

Author Contributions

Conceptualization, T.F. and J.W.A.; data curation, B.F.; formal analysis, B.F.; investigation, S.G.; methodology, S.G.; project administration, J.W.A.; resources, J.W.A.; software, B.F.; supervision, T.F. and J.W.A.; validation, S.G., B.F., and J.W.A.; visualization, B.F.; writing—original draft, S.G.; writing—review and editing, T.F.

Funding

This research was supported by the National Strategic Project-Carbon Mineralization Flagship Center of the National Research Foundation of Korea (NRF) funded by the Ministry of Science and ICT (MSIT), the Ministry of Environment (ME) and the Ministry of Trade, Industry and Energy (MOTIE). (2017M3D8A2084752).

Conflicts of Interest

The authors declare no conflict of interest. The funders had no role in the design of the study; in the collection, analyses, or interpretation of data; in the writing of the manuscript, or in the decision to publish the results.

References

  1. Bode, H. Lead-Acid Batteries; U.S. DOE: Washington, DC, USA, 1977; pp. 1–15.
  2. Bhangu, B.S.; Bentley, P.; Stone, D.A.; Bingham, C.M. Nonlinear observers for predicting state-of-charge and state-of-health of lead-acid batteries for hybrid-electric vehicles. IEEE Trans. Veh. Technol. 2005, 54, 783–794. [Google Scholar] [CrossRef]
  3. Parker, C.D. Lead–acid battery energy-storage systems for electricity supply networks. J. Power Sources 2001, 100, 18–28. [Google Scholar] [CrossRef]
  4. Zou, G.; Dou, Y.; Chang, X.; Chen, Y. Design and application of a standalone hybrid wind-solar system for automatic observation systems used in the polar region. Appl. Sci. 2018, 8, 2376. [Google Scholar]
  5. Chang, Y.; Mao, X.; Zhao, Y.; Feng, S.; Chen, H.; Finlow, D. Lead-acid battery use in the development of renewable energy systems in China. J. Power Sources 2009, 191, 176–183. [Google Scholar] [CrossRef]
  6. Pavlov, D. Lead-Acid Batteries: Science and Technology, 1st ed.; Elsevier Science: Oxford, UK, 2011; pp. 21–26. [Google Scholar]
  7. Recycling Used Lead-Acid Batteries: Health Considerations. Available online: https://apps.who.int/iris/bitstream/handle/10665/ (accessed on 31 May 2019).
  8. Sun, Z.; Cao, H.; Zhang, X.; Lin, X.; Zheng, W.; Cao, G.; Sun, Y.; Zhang, Y. Spent lead-acid battery recycling in China–A review and sustainable analyses on mass flow of lead. Waste Manag. 2017, 64, 190–201. [Google Scholar] [CrossRef] [PubMed]
  9. Ellis, T.W.; Mirza, A.H. The refining of secondary lead for use in advanced lead-acid batteries. J. Power Sources 2010, 195, 4525–4529. [Google Scholar] [CrossRef]
  10. Bernardes, A.M.; Espinosa, D.C.R.; Tenorio, J.A.S. Recycling of batteries: A review of current processes and technologies. J. Power Sources 2004, 130, 291–298. [Google Scholar] [CrossRef]
  11. Zhu, X.; Yang, J.; Gao, L.; Liu, J.; Yang, D.; Sun, X.; Zhang, W.; Wang, Q.; Li, L.; He, D.; et al. Preparation of lead carbonate from spent lead paste via chemical conversion. Hydrometallurgy 2013, 134–135, 47–53. [Google Scholar] [CrossRef]
  12. Andrews, D.; Raychaudhuri, A.; Frias, C. Environmentally sound technologies for recycling secondary lead. J. Power Sources 2000, 88, 124–129. [Google Scholar] [CrossRef]
  13. Liu, W.; Tian, J.; Chen, L.; Guo, Y. Temporal and spatial characteristics of lead emissions from the lead-acid battery manufacturing industry in China. Environ. Pollut. 2017, 220, 696–703. [Google Scholar] [CrossRef]
  14. Spanos, C.; Berlinger, S.A.; Jayan, A.; West, A.C. Inverse Charging Techniques for Sulfation Reversal in Flooded Lead-Acid Batteries. J. Electrochem. Soc. 2016, 163, A1612–A1618. [Google Scholar] [CrossRef]
  15. Jolly, R.; Rhin, C. The recycling of lead-acid batteries: Production of lead and polypropylene. Resour. Conserv. Recycl. 1994, 10, 137–143. [Google Scholar] [CrossRef]
  16. Rust, N.; Ferg, E.E.; Masalova, I. A degradation study of isotactic virgin and recycled polypropylene used in lead acid battery casings. Polym. Test. 2006, 25, 130–139. [Google Scholar] [CrossRef]
  17. Hong, S.; Cannon, F.S.; Hou, P.; Byrne, T.; Nieto-Delgado, C. Adsorptive removal of sulfate from acid mine drainage by polypyrrole modified activated carbons: Effects of polypyrrole deposition protocols and activated carbon source. Chemosphere 2017, 184, 429–437. [Google Scholar] [CrossRef] [PubMed]
  18. Cuesta Mayorga, I.; Astilleros, J.M.; Fernández-Díaz, L. Precipitation of CaCO3 polymorphs from aqueous solutions: The role of pH and sulfate groups. Minerals 2019, 9, 178. [Google Scholar] [CrossRef]
  19. Gominsek, T.; Lubej, A.; Pohar, C. Continuous precipitation of calcium sulfate dehydrate from waste sulfuric acid and lime. J. Chem. Technol. Biotechnol. 2005, 80, 939–947. [Google Scholar] [CrossRef]
  20. Najib, T.; Solgi, M.; Farazmand, A.; Heydarian, S.M.; Nasernejad, B. Optimization of sulfate removal by sulfate reducing bacteria using response surface methodology and heavy metal removal in a sulfidogenic UASB reactor. J. Environ. Chem. Eng. 2017, 5, 3256–3265. [Google Scholar] [CrossRef]
  21. Arahman, N.; Mulyati, S.; Lubis, M.R.; Takagi, R.; Matsuyama, H. Removal profile of sulfate ion from mix ion solution with different type and configuration of anion exchange membrane in electrodialysis. J. Water Process Eng. 2017, 20, 173–179. [Google Scholar] [CrossRef]
  22. Kartic, D.N.; Narayana, B.C.H.A.; Arivazhagan, M. Removal of high concentration of sulfate from pigment industry effluent by chemical precipitation using barium chloride: RSM and ANN modeling approach. J. Environ. Manag. 2018, 206, 69–76. [Google Scholar] [CrossRef]
  23. Fang, P.; Tang, Z.; Chen, X.; Huang, J.; Tang, Z.; Cen, C. Removal of High-Concentration Sulfate Ions from the Sodium Alkali FGD Wastewater Using Ettringite Precipitation Method: Factor Assessment, Feasibility, and Prospect. J. Chem. 2018, 2018, 1265168. [Google Scholar] [CrossRef]
  24. Garrels, R.M.; Thompson, M.E. A chemical model for sea water at 25 degrees C and one atmosphere total pressure. Am. J. Sci. 1962, 260, 57–66. [Google Scholar] [CrossRef]
  25. Helgeson, H.C.; Kirkham, D.H.; Flowers, G.C. Theoretical prediction of the thermodynamic behavior of aqueous electrolytes by high pressures and temperatures; IV, Calculation of activity coefficients, osmotic coefficients, and apparent molal and standard and relative partial molal properties to 600 degrees C and 5kb. Am. J. Sci. 1981, 281, 1249–1516. [Google Scholar]
  26. Oelkers, E.H.; Helgeson, H.C. Triple-ion anions and polynuclear complexing in supercritical electrolyte solutions. Geochim. Cosmochim. Acta 1990, 54, 727–738. [Google Scholar] [CrossRef]
  27. Shock, E.L.; Oelkers, E.H.; Johnson, J.W.; Sverjensky, D.A.; Helgeson, H.C. Calculation of the thermodynamic properties of aqueous species at high pressures and temperatures. Effective electrostatic radii, dissociation constants and standard partial molal properties to 1000 °C and 5 kbar. J. Chem. Soc. Faraday Trans. 1992, 88, 803–826. [Google Scholar] [CrossRef]
  28. Karimi, H. Effect of pH and initial Pb(II) concentration on the lead removal efficiency from industrial wastewater using Ca(OH)2. Int. J. Water Wastewater Treat. 2017, 3, 1–4. [Google Scholar]
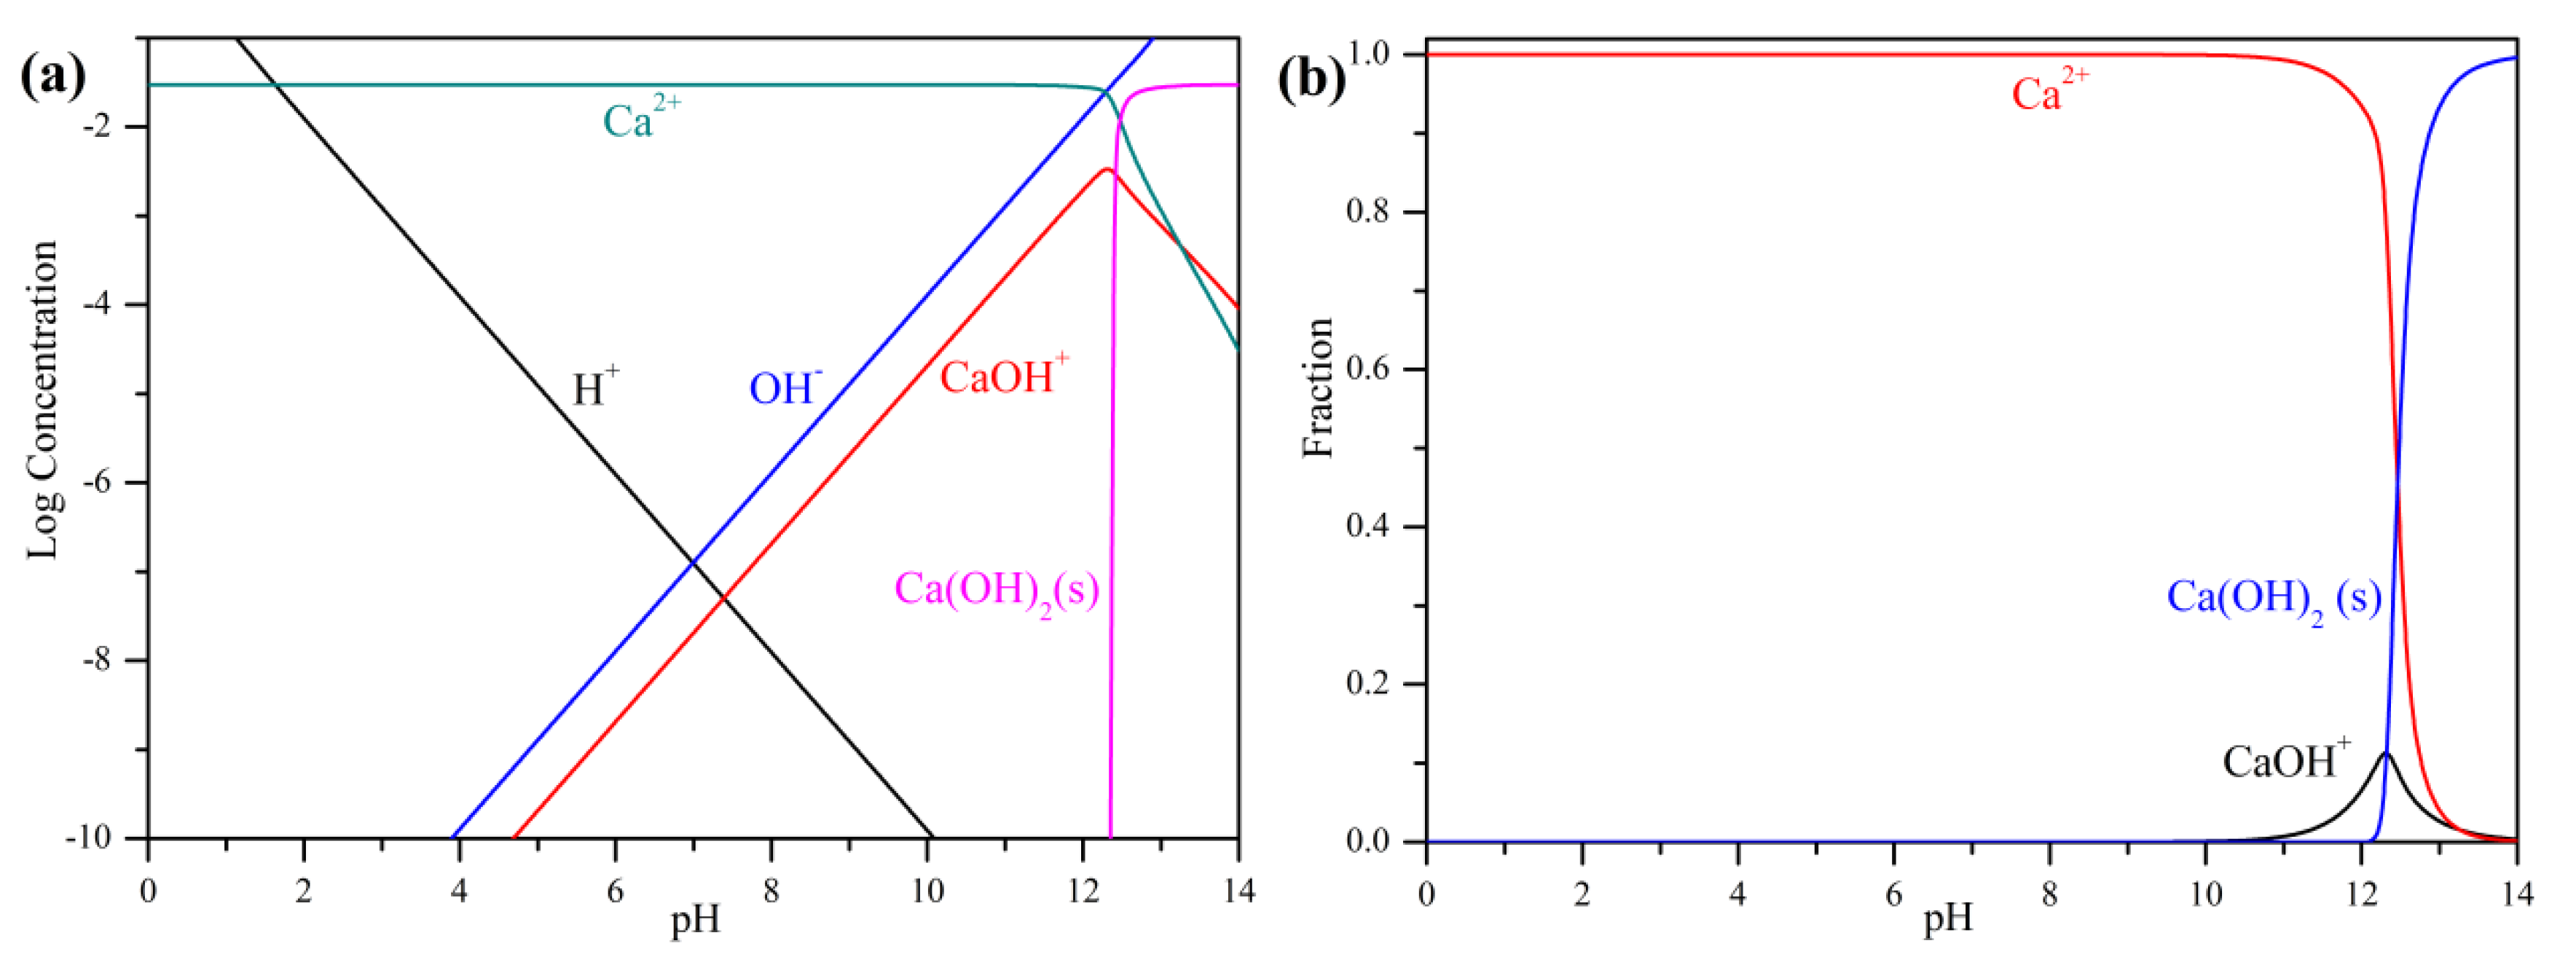
Figure 1. Calculated species distributions of 30 mM Ca(OH)2 at different pH: (a) with log concentration vs. pH; (b) with fraction of calcium vs. pH.
Applsci 09 02262 g001
Figure 2. Calculated species distributions of 10 mM CaCO3 at different pH: (a) with log concentration vs. pH; (b) with fraction of calcium vs. pH.
Applsci 09 02262 g002
Figure 3. Calculated species distributions of 20 mM CaSO4 at different pH: (a) with log concentration vs. pH; (b) with fraction of calcium vs. pH; (c) with fraction of sulfate vs. pH.
Applsci 09 02262 g003
Figure 4. Calculated species distributions of 1.53 M SO42− reacting with 1.55 M Ca(OH)2 at different pH: (a) with log concentration vs. pH; (b) with fraction of sulfate vs. pH; (c) with fraction of calcium vs. pH.
Applsci 09 02262 g004
Figure 5. Calculated species distributions of 8.67 mM SO42− reacting with 0.0145 mM Pb2+ at different pH: (a) with log concentration vs. pH; (b) with fraction of lead vs. pH.
Applsci 09 02262 g005
Figure 6. Calculated species distributions of carbonation process with filtration at different pH: (a) with log concentration vs. pH; (b) with fraction of calcium vs. pH; and (c) with fraction of sulfate vs. pH.
Applsci 09 02262 g006
Figure 7. Calculated species distributions of carbonation process without filtration at different pH: (a) CCO2 = 0.1 M with log concentration vs. pH; (b) CCO2 = 0.1 M with fraction of sulfate vs. pH; (c) CCO2 = 1 M with fraction of sulfate vs. pH; and (d) CCO2 = 2 M with fraction of sulfate vs. pH.
Applsci 09 02262 g007
Figure 8. Calculated lead related species distributions of carbonation process with filtration at different pH: (a) CCO2 = 0.1 M with log concentration vs. pH; and (b) CCO2 = 0.1 M with fraction of lead vs. pH.
Applsci 09 02262 g008
Table 1. Chemicals, formulas, reactions, and equilibrium constants used in the thermodynamic calculations.
FormulasPossible Chemical ReactionsLog10(K) 1
H+/OH-H2O H+ + OH(1)−13.99
Ca2+2H+ + Ca(OH)2(s) Ca2+ + 2H2O(2)22.62
CaOH+H+ + Ca(OH)2(s) CaOH+ + H2O(3)9.785
Ca(OH)2(s)CaCO3(s) + 2H2O 2H+ + 2CO32− + Ca(OH)2(s)(4)−30.88
CaO(s)CaCO3(s) + H2O 2H+ + 2CO32− + CaO(s)(5)−41.0
CaCO3CaCO3(s) CaCO3(6)−4.961
CaHCO3+CaCO3(s) + H+ CaHCO3+(7)3.08
CaOH+CaCO3(s) + H2O H+ + 2CO32− + CaOH+(8)−21.11
CO22H+ + CO32− H2O + CO2(9)16.68
CO2(g)2H+ + CO32− H2O + CO2(g)(10)18.15
H2CO32H+ + CO32− H2CO3(11)16.70
HCO3H+ + CO32− HCO3(12)10.33
Ca2+CaCO3(s) Ca2+ + CO32−(13)−8.30
CaOH+CaSO4(s) + H2O CaOH+ + H+ + SO42−(14)−17.21
CaSO4CaSO4(s) CaSO4(15)−2.190
Ca2+/SO42−CaSO4(s) Ca2+ + SO42−(16)−4.378
Ca(OH)2 (s)CaSO4(s) +2H2O Ca(OH)2(s) + 2H+ + SO42−(17)−26.99
CaO(s)CaSO4(s) +H2O CaO + 2H+ + SO42−(18)−37.08
CaSO4·2H2O (s)CaSO4(s) +2H2O CaSO4·2H2O(s)(19)0.161
H2SO42H+ + SO42− H2SO4(20)0.780
HSO4H+ + SO42− HSO4(21)1.982
CaOH+Ca(OH)2(s) + H+ H2O + CaOH+(22)9.785
CaSO4CaSO4·2H2O(s) CaSO4 +2H2O(23)−2.351
Ca2+Ca(OH)2(s) + 2H+   Ca2+ + 2H2O(24)22.62
CaO(s)Ca(OH)2(s)   CaO(s) + H2O(25)−10.09
CaSO4(s)CaSO4·2H2O(s) CaSO4(s) +2H2O(26)−0.161
H2SO4CaSO4·2H2O(s) H2SO4 + Ca(OH)2(s)(27)−26.37
HSO4CaSO4·2H2O(s) HSO4 + Ca(OH)2(s) + H+(28)−25.17
SO42−CaSO4·2H2O(s) SO42− + Ca(OH)2(s) + 2H+(29)−13.99
CaCO3Ca2+ + CO2 + H2O CaCO3 + 2H+(30)22.62
CaHCO3+Ca2+ + CO2 + H2O CaHCO3+ + H+(31)9.785
CaOH+Ca2+ + H2O CaOH+ + H+(32)−30.88
CaSO4Ca2+ + SO42−   CaSO4(33)−41.0
CO2(g)CO2 CO2(g)(34)−4.961
H2CO3CO2 + H2O H2CO3(35)3.080
H2SO42H+ + SO42−   H2SO4(36)−21.11
HCO3CO2 + H2O H+ + HCO3(37)16.68
HSO4H+ + SO42− HSO4(38)18.15
CO32−CO2 + H2O 2H+ + CO32−(39)16.7
Ca(OH)2(s)Ca2+ + 2H2O Ca(OH)2(s) + 2H+(40)10.33
CaCO3(s)Ca2+ + 2H2O + CO2 CaCO3(s)(41)−8.30
CaSO4(s)Ca2+ + SO42−   CaSO4(s)(42)−17.21
CaSO4·2H2O(s)Ca2+ + SO42−+ 2H2O CaSO4·2H2O (s)(43)−2.19
CaCO3Ca(OH)2(s) + CO2   CaCO3 + H2O(44)−4.378
CaHCO3+Ca(OH)2(s) + CO2 + H+   CaHCO3+ + H2O(45)−26.99
CaOH+Ca(OH)2(s) + H+   CaOH++ H2O(46)−37.08
CaCO3(s)Ca(OH)2(s) + CO2   CaCO3(s) + H2O(47)0.161
Pb(OH)2Pb2+ + 2H2O Pb(OH)2 + 2H+(48)−17.12
Pb(OH)3Pb2+ + 3H2O Pb(OH)3 + 3H+(49)−28.06
Pb3(OH)42+2Pb2+ + 4H2O Pb3(OH)42+ + 4 H+(50)−23.88
PbOH+Pb2+ + H2O PbOH+ + H+(51)−7.71
PbSO4Pb2+ + SO42− PbSO4(52)2.69
Pb(OH)2(s)Pb2+ + 2H2O Pb(OH)2(s) + 2H+(53)−13.6
PbO(s)Pb2+ + 2H2O PbO(s) + 2H+(54)−12.9
PbSO4(s)Pb2+ + SO42− PbSO4(s)(55)7.79
Pb(CO3)22−Pb2+ + 2H2O + 2CO2 Pb(CO3)22− + 4H+(56)−23.26
PbCO3Pb2+ + H2O + CO2 PbCO3 + 2H+(57)−10.08
PbCO3OHPb2+ + 2H2O + 2CO2 PbCO3OH + 3H+(58)−18.48
PbHCO3+Pb2+ + H2O + CO2 PbHCO3+ + H+(59)−3.331
Pb3(CO3)2(OH)2(s)3Pb2+ + 3H2O + 2CO2 Pb3(CO3)2(OH)2(s) + 6H+(60)−13.96
PbCO3(s)Pb2+ + H2O + CO2 PbCO3(s) + 2H+(61)−3.48
Note: 1. K data obtained from HSC Chemistry® 6.0 database.
Table 2. Calculated concentrations of different species in saturated Ca(OH)2, CaCO3, and CaSO4 solutions.
ContentsSpeciesConcentrations (mM)
Saturated Ca(OH)2 (30 mM)Ca(OH)2 (s)7.203
Ca2+19.48
OH28.44
CaOH+3.318
Saturated CaCO3 (10 mM)CaCO3(s)9.847
CaCO31.094 × 10−2
CaHCO3+1.415 × 10⁻⁴
OH8.886 × 10−2
Ca2+0.1415
CO32−4.318 × 10⁻²
HCO39.840 × 10−2
H2CO32.560 × 10−5
CO22.468 × 10−5
Saturated CaSO4 (20 mM)OH1.212 × 10−4
SO42−12.03
CaOH+9.681 × 10⁻⁶
CaSO44.457
H2SO43.236 × 10−13
HSO46.279 × 10−5
Ca2+12.03
CaSO4·2H2O3.516
Table 3. Calculated equilibrium species distributions of the precipitation process and carbonation process, with and without filtration.
ContentsSpeciesConcentrations (mM)Removal Efficiency of SO42−/Pb2+
1.55 M Ca(OH)2 +
1.53 M SO42−
OH26.5399.15%
CaOH+3.605
CaSO44.457
Ca2+25.06
SO42−8.668
CaSO4·2H2O1517
Pb(OH)23.447 × 1040
Pb(OH)31.416 × 10²
Carbonation after filtration at pH 7
(0.1 M CO2)
Ca2+0.450999.15%
SO42−13.01
CaSO40.1118
HCO357.32
CaCO3(s)32.44
PbCO3(s)1.397 × 10296.35%
PbCO32.512 × 104
PbHCO3+1.834 × 10⁴
Pb(CO3)22−7.332 × 10⁵
Carbonation without filtration at pH 7
(0.1 M CO2)
CaSO44.45769.61%
HCO320.48
Ca2+4.098
SO42−460.43
CaCO3(s)476.2
CaSO4·2H2O1065