Article

A Self-Configuring Membership-Function-Based Approach for Fuzzy Fatigue Reliability Optimization of Welded A-Type Frame Considering Multi-Source Uncertainties

1
Department of Mechanical Engineering, Hunan University of Technology, Zhuzhou 412007, China
2
State Key Laboratory of Advanced Design and Manufacture for Vehicle Body, Hunan University, Changsha 410082, China
*
Authors to whom correspondence should be addressed.
Appl. Sci. 2019, 9(11), 2227; https://doi.org/10.3390/app9112227
Submission received: 30 April 2019 / Revised: 23 May 2019 / Accepted: 24 May 2019 / Published: 30 May 2019
(This article belongs to the Section Mechanical Engineering)

Abstract

:
A large number of sample data is needed to ascertain the characteristic parameters of traditional membership function, so that the calculated fuzzy fatigue reliability based on this method has certain errors for engineering structures without enough samples. A fuzzy fatigue reliability analysis method based on self-configuring membership function is proposed, while considering its multi-source uncertainties in the design, manufacture, and use stage in order to accurately evaluate fatigue reliability of welded A-type frame. In this paper, a novel membership function was presented on account of a small amount of sample data, which some experimental results verified. The mathematical expression for failure probability was deduced from the suggested model, as well as fatigue reliability. Subsequently, the thickness of steel plate defined in design stage, the material properties of weld metal that is produced in manufacture stage, and the loads at different connection sites determined in use stage were all considered as the random variables, which were obtained from Latin hypercube sampling, and the fatigue limit of weld metal was deemed as the fuzzy variable. Based on the response surface method, the fuzzy fatigue reliability performance function was constructed to assess failure probability of welded A-type frame under the condition of downhill and turning braking with full load, while its fatigue reliability was found to be far less than 90%. The fuzzy fatigue reliability optimization that was based on genetic algorithm was implemented, which showed that its reliability varied from 69.47% to 95.12%.

1. Introduction

The electric wheel dump truck is used for several hundred tons of transportation in large open pit sites. There are a large number of curves on the mine surface, so that the steering is frequently needed [1,2]. The welded A-type frame is considered as one of the bearing components in the steering system, and thus its fatigue reliability is of pivotal performance to guarantee the safe operation of the vehicle [3]. When the structural fatigue reliability is calculated as the traditional linear cumulative damage theory, the accumulated fatigue damage that is caused by high stress level over fatigue limit is only taken into account, while the one that is produced by low stress level below fatigue limit is often ignored. However, there is fuzziness in whether the stress near fatigue limit results in damage, and some research suggests that the low stress level slightly below fatigue limit also yields fatigue damage [4,5]. Therefore, exploring structural fatigue reliability based on fuzzy theory is more effective than the traditional linear cumulative damage theory.
With the increasingly harsh service environment of mechanical equipment, more and more scholars focus on the fatigue reliability of bearing components. Li et al. [4] proposed a failure-based reliability estimation method while using the multi-source information compound to predict the reliability of turbine blades of aero engines. Case studies of reliability assessment under fuzzy stress with and without strength were implemented based on dynamic stress-strength interference model by taking types of cycles into account. Zhu et al. [5] presented a novel linear damage accumulation rule by use of fuzzy sets theory, which was in consideration of both the damage and strengthening of low amplitude loads, as well as the sequence effects of different loads. Zhang et al. [6] suggested a kind of Bayesian approach to ascertain a fatigue lifetime reliability model of ship structure taking advantage of small sample experimental data. The empirical distribution was obtained from the fuzzy synthesis judgment, and by likelihood function characterized the sample information. Combining empirical information with sample information, the Bayesian approach was utilized to determine the posterior probability distribution. However, even though the fuzzy theory was widely employed to estimate the engineering structure reliability by determining the distribution of random stress and strength, the effects on fatigue reliability evolution that are caused by the uncertainties of design variables were still not included. Liu et al. [7] evaluated the fatigue strength of welded structures with welding defects using fuzzy sets theory, when considering the interrelations among the category, dimension, location, and the interaction of defects. Based on the fuzzy theory and reliability design rules, Zhu et al. [8] constructed the fuzzy reliability mathematical model for the fatigue strength of the V-belt. The fuzzy reliability design method with coexisting random variables and fuzzy variables was discussed. These researches that are mentioned above mainly depended on the traditional fuzzy membership function to characterize fuzzy extent, such as normal distribution, parabolic distribution, et al. However, the characteristic parameters that were needed in these models could be only ascertained by a large number of sample data, which was not suitable to describe the distribution of random variable having limited sample data. Wang et al. [9] proposed a fatigue reliability analysis and optimization method based on the three degrees of freedom flexible micro-positioning stage to determine the fatigue strength of the hinges by considering various influencing factors. Subsequently, the genetic algorithm was utilized to conduct on fatigue reliability optimization. Jiang et al. [10] analyzed the structural reliability under both static and fatigue load, and then the optimal design with different variables was carried out by making use of an improved genetic algorithm. However, this work characterized the randomness of variables utilizing the traditional distribution function, and the fatigue reliability performance function could be directly obtained. As for engineering structures, in fact, the fatigue reliability performance function was difficult to ascertain on the basis of limited samples.
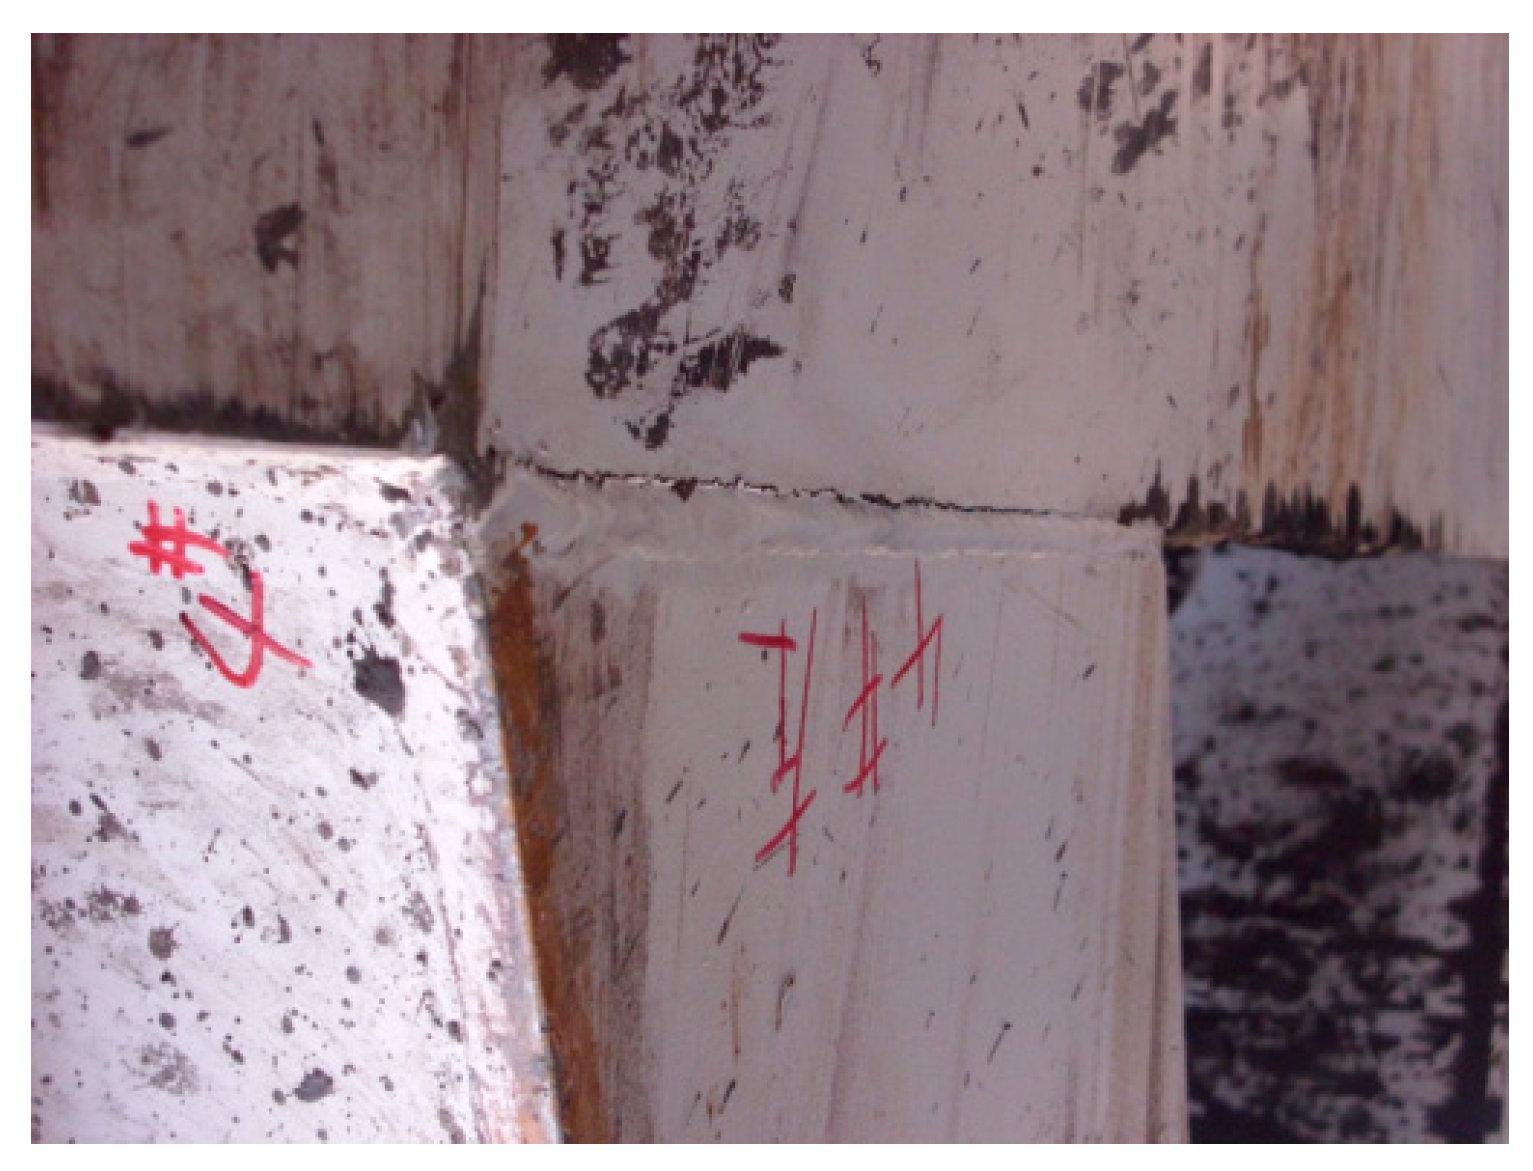
Plate high-strength steel with different thicknesses welded this A-type frame [11]. In the manufacturing stage, the material properties of the weld metal are scattered, which is caused by man-made factors. In addition, the dimension of A-type frame is usually obtained from the traditional experience, which could be different from the “ideal” structure. The steering loads at its connection sites should be random during the in-service stage, because the excitation source is stochastic. These parameters are all relative with the structural fatigue reliability. According to the traditional stress-strength interface model [12,13,14], only stress and strength are directly considered as random variables to evaluate fuzzy fatigue reliability, which is unreasonable to ignore the uncertainties of dimension, material properties, and loads. More importantly, the common fuzzy fatigue reliability analysis is based on the traditional membership function, such as normal distribution, parabolic distribution, et al. However, a large number of sample data is needed to ascertain the characteristic parameters of traditional membership function, so that the calculated fuzzy fatigue reliability that is based on this method has certain errors for engineering structures without enough samples. The performance function used for calculating fatigue reliability is also not easy to determine on account of a small amount of sample data. Therefore, the multi-source uncertainties were taken into account to analyze the fuzzy fatigue reliability of welded A-type frame to accurately establish the membership function and performance function.
In this paper, a new membership function was constructed based on the limited sample data, whose accuracy was testified by experimental data. According to the fuzzy theory, the failure probability formula was deduced. Subsequently, the response surface method was employed to establish fuzzy fatigue reliability performance function, while considering the uncertainties of dimension, material properties, and loads. The fuzzy fatigue reliability of the welded A-type frame was evaluated by the self-configuring membership function, and the optimal design for improving fatigue reliability was conducted through the genetic algorithm.

2. Fatigue Cracking of Welded A-Type Frame

The electric wheel dump truck with heavy loads has to run on mine road surface for more than ten hours every day and frequently change direction, as shown in Figure 1. After around 15 months of driving, some cracks appearing along weld toes in welded A-type frames were found, as shown in Figure 2, and they were considered as fatigue failure. Its service time was far less than the engineering requirements. Thus, the fatigue reliability evaluation of the welded A-type frame was indispensable.

3. Construction of New Membership Function

3.1. Modeling of Membership Function

The fatigue damage calculation that is based on the traditional stress/strain approach only took the stress level over the fatigue limit into account and it ignored the one below the fatigue limit, which will result in the inaccuracy of this evaluation. The fuzzy linear fatigue damage accumulation could be evaluated by [15,16,17,18,19,20] in order to give consideration to the stress level over and below the fatigue limit:
i = 1 k n i N i + i = k + 1 m U ( S i ) n i N 0 = 1
where m is the number of total stress level, S i is every stress level, n i is the number of each stress level, k is the number of stress level over the fatigue limit, N i is the number of cycles at each stress level over the fatigue limit, the number of stress level below the fatigue limit is varying from k + 1 to m , N 0 is the number of cycles at each stress level below the fatigue limit, and U ( S i ) is the membership function.
The fuzziness of variables is usually described by the membership function of fuzzy sets. According to the fuzzy theory, there are four kinds of distribution forms: the linear distribution, the normal distribution, the parabolic distribution, and the square root distribution, which are successively expressed by:
U ( S ) = { 1 S S r S S r S r a a S < S r 0 S < a
U ( S ) = { 1 S S r exp [ ( S S r σ c ) 2 ] S < S r
U ( S ) = { 1 S S r ( S S r S r a ) 2 a S < S r 0 S < a
U ( S ) = { 1 S S r ( S S r S r a ) 1 2 a S < S r 0 S < a
where S is the stress value, S r is the fatigue limit, a is the fuzzy damage boundary, and σ c is the standard deviation of the fatigue limit. In our previous research [21], the fatigue expectancy of the welded A-type frame was predicted on the basis of the membership function that is mentioned above. According to the estimated results that are listed in the Table 1, the minimum relative error was from the square root distribution, and was around 16.5%. The others were around 20%. Even though they were close to the real lifetime, its prediction accuracy still needed to be improved. If there was enough sample data to determine the characteristic parameters in distribution functions, then the estimated results could be more precise. However, the samples of this engineering structure were limited; how to precisely characterize the distribution features of fuzzy variables is the key point to explore engineering fatigue reliability. Therefore, the authors attempted to create a new membership function to describe the distribution feature of fuzzy variables.
According to the statistical data of different stress levels and the proposed membership function given in reference [21,22], a new membership function was expressed by:
U ( S ) = { 1 S S r ( S a K S r ) 3 a S < S r 0 S < a
where K is the constant for correcting membership degree of fuzzy variable. In this paper, it was taken as 0.164. Subsequently, this membership function was utilized to predict the fatigue lifespan of the welded A-type frame. The calculated result was 8.25 × 10⁴ and its relative error was only 5.99%, which was more accurate than the ones based on the traditional membership functions. The fatigue lives that were obtained from different membership functions for the round bar with transverse holes in order to further verify the accuracy of this model were predicted and are listed in Table 2 [23]. The suggested model had the minimum relative error in this case, which was 35.9% and far less than the others. Thus, this membership function could be used for the following fuzzy fatigue reliability evaluation and optimization.

3.2. Analytical Expression of Failure Probability Based on Suggested Model

In this paper, based on the fuzzy theory, the fatigue strength was considered as a fuzzy variable r , and the working stress was considered as constant S 0 . Subsequently, according to the stress-strength interface model, its failure probability could be expressed by [24]:
F λ = P ( S 0 > r ˜ λ ) = S 0 f r ˜ λ ( r ) d r
where P ( S 0 > r ˜ λ ) stood for probability of the invariable working stress S 0 over the fatigue strength r which was uniform distribution during interval [ a λ , b λ ] . a λ and b λ were relative with the membership function of fuzzy fatigue strength and they could be evaluated by the function of threshold λ . f r ˜ λ ( r ) was probability density function of fuzzy fatigue strength.
If the working stress was turned into random variable S i and less than or equal to the average value m , the failure probability could be evaluated by:
F i = P ( S i > r ˜ ) = 0 L ( S i ) S i a λ b λ a λ d λ
When the random working stress was more than the average value m , the failure probability could be evaluated by:
F i = P ( S i > r ˜ ) = 0 R ( S i ) S i a λ b λ a λ d λ + 1 R ( S i )
where L ( ) and R ( ) were the left and right reference function.
Subsequently, after the definite integrals were conducted, Equations (8) and (9) could be expressed by:
F i = 3 h ( S i m c a ) [ l n ( 1 L ( S i ) h 3 ) L ( S i ) h 3 ] 3 h ( S i a ) 2 ( c a ) ( L ( S i ) h ) 2 3 + ( m a ) ( c a ) L ( S i )
F i = 3 h ( S i m c a ) [ l n ( 1 R ( S i ) h 3 ) R ( S i ) h 3 ] 3 k ( S i a ) 2 ( c a ) ( R ( S i ) h ) 2 3 + ( m c ) ( c a ) R ( S i ) + 1
where h was the constant and equal to ( 1 / 5 K ) 3 , and a and c were deterministic value during interval [ a λ , b λ ] . Once the failure probability F i was determined, the fatigue reliability R i could be obtained by:
R i = 1 F i

4. Fuzzy Fatigue Reliability Assessment of Welded A-Type Frame

4.1. Analysis Flow

The Monte Carlo method stated that the occurrence frequency of event A was infinitely close to the occurrence probability. According to Bernoulli’s law of large numbers, if the parameter ε was more than zero, the relation between them could be evaluated by [25]:
lim n P ( | n / N P ( A ) | < ε ) = 1
where n / N was the occurrence frequency of event A and P ( A ) was the occurrence probability of event A . In this paper, the Monte Carlo method was utilized to acquire the fuzzy fatigue reliability of welded A-type frame, which needed several steps. Firstly, combining the response surface method with the stress/strength interface model, the fuzzy fatigue reliability performance function was constructed. In this part, the random variable and fuzzy variable were defined, respectively. The sample data was obtained from the Latin Hyper sampling method. The elastic and plastic finite element analysis was utilized to calculate the results corresponding to random variables. Afterwards, if the accuracy of performance function was guaranteed, then the response values calculated from the constructed function were considered as the output variable and compared with the design variable based on the suggested membership function. Finally, based on the Monte Carlo method and fuzzy theory, the comparison results in the second step were counted and analyzed to calculate the failure probability and fatigue reliability. The optimal design of fuzzy fatigue reliability based on genetic algorithm was conducted once the fatigue reliability of welded A-type frame was found to be less than 90%. Figure 3 shows the analysis flow.

4.2. Experimental Results for Material Properties

The finite element analysis was needed to calculate response values for constructing fuzzy fatigue reliability performance function. Therefore, the material properties had to be determined first. The welded joints were designed to be flat dog-bone shaped specimens, as shown in Figure 4.
The monotonic tensile test was conducted on this specimen under velocity control at the rate of 0.025 mm/s. The gauge length of the extensometer used for measuring the strain was 12.5 mm. Figure 5 shows both the engineering and true stress/strain curve. Afterwards, the Young modulus E , tensile strength σ b , and yield strength σ y could be obtained from this figure, and Table 3 lists their values.
In addition, the cyclic material properties were needed to calculate equivalent stress. Therefore, the fatigue tests were conducted on welded specimens under strain control. The cyclic elastic and plastic strains and the corresponding stresses were obtained from the cyclic tests by measuring strains. Subsequently, the Ramerg-Osgood equation was employed to gain the cyclic stress and stain curve by fitting the experimental data, as shown in Figure 6. The cyclic strength coefficient K and cyclic strain hardening exponent n were both ascertained, as listed in Table 3.

4.3. Coupled Rigid and Flexible Multi-Bodies Dynamic Analysis

In order to determine the loads at connection sites of the welded A-type frame, the coupled rigid and flexible multi-bodies dynamic model for the whole electric wheel dump truck was constructed utilizing ADAMS software, as shown in Figure 7. The accuracy of this model was verified by the experimental data that was illustrated in previous work [25]. Subsequently, the load information at different connection sites could be obtained from the simulation under conditions of downhill and turning braking with full load at the speed of 20 km/h, as shown in Figure 8. The load time history at the very beginning of simulation from 0 s to 2 s was ignored, because the simulated results in this stage were not stable enough. This load was transformed to be loading and unloading and reloading condition to simulate the mechanical behavior under cyclic loading, as shown in Figure 9.

4.4. Finite Element Model of Welded A-Type Frame

The finite element model of the welded A-type frame was built by software HYPERMESH, as shown in Figure 10. There were 84,948 elements and 134,564 nodes, which included 82,046 C3D8 elements and 2902 C3D6 elements. Gradual meshing simulated the weld metal was simulated. The connection sites in the welded A-type frame were marked in Figure 10 by A1 (front traction joint), A2 (right steering joint), A3 (left steering joint), and A4 (front lateral stabilizer joint), and the corresponding loads at fours joints were F 1 , F 2 , F 3 , and F 4 . There were four kinds of plates marked by lateral plate, based plate, roof plate, and tail plate, whose thickness was different from each other. Subsequently, in order to testify the accuracy of this model, the quasi-static analysis for simulating the mechanical behavior under the condition of random horizontal road running with full load was conducted to compare the calculated equivalent stresses with the tested ones. Figure 11 shows the simulated stress contour. The maximum stress located at the corner between the bottom roof plate and right lateral plate was 83.69 MPa, which was caused by the stress concentration at geometric transition position. The measuring points of welded A-type frame are displayed in Figure 12, and the layout of strain gauge at point A1-2 are also shown in Figure 13. Table 4 lists the experimental data for the same condition obtained from the mine road tests. The relative errors between the simulated results and the tested ones were around 10%, except the measuring point A2-1 and A2-2. Ignoring the steering loads at location A2 and A3 under the condition of random horizontal road running with full load in the simulation caused it. However, there were some loads at these two joints in the real truck due to goods partiality and residual pressure in steering power cylinder.

4.5. Fuzzy Fatigue Performance Function Considering Multi-Source Uncertainties

4.5.1. Determination of Random Variables and Fuzzy Variable

The fuzzy fatigue reliability of welded A-type frame was relative with many factors. In this paper, the random excitation produced the loads, and thus the vertical force at front traction joint F 1 , the lateral force at right and left steering joint F 2 and F 3 , and the lateral force at front lateral stabilizer joint F 4 were considered as the random variables. The A-type frame was welded by different thickness of plates, while this dimension could be changeable as long as the maximum equivalent stress trended to be smaller. Therefore, the thickness of tail plate t 1 , the thickness of roof plate t 2 , the thickness of lateral plate t 3 , and the thickness of base plate t 4 were also considered as the random variables. In addition, the material properties of the welded A-type frame were related to the working stress in the elastic and plastic period. Therefore, the elastic parameters, including Young modulus E and Poisson ratio υ , and the plastic parameters, including cyclic strength coefficient K and cyclic strain hardening exponent n , were taken as the random variables in virtue of the manual manufacturing process. The quality of weld seam could not be evaluated by a specific value, because it depended on the welding process. Thus, the fatigue strength was considered as the fuzzy variable. The maximum equivalent stress S was the pivotal parameter to determine the fatigue reliability, and it was considered as the output variable. Subsequently, twelve random variables and one fuzzy variable were defined and are listed in Table 5.

4.5.2. Constructing Fuzzy Fatigue Reliability Performance Function

In this paper, the Latin hypercube sampling method was used to obtain the sample data of random variables for constructing the fuzzy fatigue reliability performance function [26]. Once the random variables were determined, the maximum equivalent stress, as the output variable, could be calculated by the finite element analysis. All 103 samples are listed in Table 6. Due to the limited space, only six sample data is given here.
Afterwards, based the second order response surface model [25], the sample data was fitted to gain the fuzzy fatigue reliability performance function, which was evaluated by:
S = 5765.9829746838 0.0460035259152328 E 7620.51862342684 v + 1.07724247031585 K + 911.320649940866 n 5.97753486639276 t 1 19.7394731046835 t 2 0.814943597776015 t 3 1.19870182115256 t 4 0.00712008001101523 f 1 + 0.0259170840744808 f 2 0.00409075710641759 f 3 + 0.000577166707218423 f 4 + 1.61454865565098 e 007 E 2 + 8030.00709577048 v 2 0.000684064009640305 K 2 + 159617.228684235 n 2 + 0.0225157405754976 t 1 2 + 0.0449814680209659 t 2 2 + 0.0502318708809279 t 3 2 + 0.074267733732931 t 4 2 + 5.53257484829528 e 009 f 1 2 + 7.35122174903948 e 008 f 2 2 + 1.59583299149086 e 007 f 3 2 + 4.84974001219944 e 009 f 4 2 + 0.046210267209069 E v 3.42665013659986 e 006 E K 0.171518897861947 E n + 3.07189195417162 e 005 E t 1 + 3.31215979572123 e 005 E t 2 + 3.95521881199356 e 005 E t 3 3.86229956969182 e 006 E t 4 + 7.86673149051 e 009 E f 1 3.64200126057571 e 008 E f + 22.89152546993944 e 008 E f 3 4.42581547793031 e 008 E f 4 + 3.65063602815403 v K 66297.6742049595 v n + 24.0714240387142 v t 1 + 20.8836142484045 v t 2 4.48471601160745 v t 3 12.1448953242765 v t 4 + 0.00810397829906711 v f 1 + 0.017215667130033 v f 2 0.0225400535689581 v f 3 + 0.00898817527552669 v f 4 2.58349056521365 K n 0.0063143442435513 K t 1 0.0029046360661758 K t 2 + 0.0130974612853156 K t 3 0.0025605214776137 K t 4 + 1.58814968391647 e 007 K f 1 + 1.74513193140186 e 006 K f 2 + 1.70751109897702 e 005 K f 3 3.11460762077329 e 006 K f 4 22.0115969176731 n t 1 + 42.1485927082863 n t 2 98.04921274075 n t 3 + 41.8293644618744 n t 4 + 0.0151495833073685 n f 1 0.162174656730452 n f 2 0.0509185830357247 n f 3 + 0.0483759234331708 n f 4 + 0.0126737789329283 t 1 t 2 + 0.0262238384358678 t 1 t 3 0.0176715688466823 t 1 t 4 9.13125439007234 e 006 t 1 f 1 + 5.52946077383539 e 005 t 1 f 2 + 1.43631831826687 e 006 t 1 f 3 2.85491438660174 e 005 t 1 f 4 + 0.0144261496000096 t 2 t 3 + 0.0580927632075354 t 2 t 4 + 4.30337332682128 e 006 t 2 f 1 2.96316848800836 e 005 t 2 f 2 0.000141507748410339 t 2 f 3 6.46990379961442 e 006 t 2 f 4 0.0586476987863651 t 3 t 4 + 3.21824365515933 e 005 t 3 f 1 + 1.01946082563543 e 005 t 3 f 2 7.6523375379795 e 005 t 3 f 3 3.32695944109857 e 005 t 3 f 4 7.05018928209526 e 006 t 4 f 1 4.09152892430389 e 005 t 4 f 2 4.97965223793331 e 005 t 4 f 3 + 1.32427004714654 e 006 t 4 f 4 4.83390785447686 e 009 f 1 f 2 + 6.39966127897477 e 009 f 1 f 3 + 5.57558716356483 e 009 f 1 f 4 2.710659846008 e 008 f 2 f 3 + 2.65200119029812 e 008 f 2 f 4 3.38193446482977 e 009 f 3 f 4
According to the approximate model that is mentioned above, the sensitivity of items in response surface model was analyzed. The influence level of items on the maximum equivalent stress S was different and only 10 of them are listed in Figure 14. It could be seen in the Pareto chart that the item x 9 was the most sensitive to the subject, and its impact was positively correlated and was close to 12%. The items x 7 , x 3 x 11 , and x 4 2 also had positive influence and all were close to 2%. The remaining items had negative correlation, while the value of the items x 6 and x 5 were both close to minus 4%.
Subsequently, the main effect chart between all random variables and the out variable is shown in Figure 15. The item x 9 had the maximum slope, which meant that the vertical force at front traction joint F 1 had the most influence on the maximum equivalent stress S . This conclusion is the same as the result from the Pareto chart. The item x 5 had the negative slope, which meant that the increase of thickness of tail plate t 1 could lessen the maximum equivalent stress S . In addition, the interaction effect between items x 1 and x 10 , and the items x 1 and x 12 , are also shown in Figure 16. It could be seen that there is no intersection between Young Modulus E and lateral force at right steering joint F 2 , which meant that they had no relevance. In contrast, there is relevance between Young Modulus E and lateral force at the front lateral stabilizer joint F 4 .
Another 10 samples of random variables were picked out, and their corresponding stress values were separately calculated through the approximation model and the finite element analysis, in order to verify the accuracy of the response surface model Equation (14). Afterwards, the simulated results from finite element analysis and the predicted results from the Equation (14) were compared, as shown in Figure 17. It could be seen that they are close to each other, which meant that the accuracy of the response surface model Equation (14) was pretty good. To observe the relationship between the maximum equivalent stress S and the random variables, the three-dimensional graph of response surface model is displayed in Figure 18. Figure 18a shows that there is an obvious nonlinear relationship between the maximum equivalent stress S and Young Modulus E and cyclic strength coefficient K , while it could be seen in Figure 18b that there is linear relationship between maximum equivalent stress S and vertical force at front traction joint F 1 and lateral force at front lateral stabilizer joint F 4 . Figure 18c shows that there is local linear relationship and nonlinear relationship between the maximum equivalent stress S and thickness of roof plate t 2 and thickness of tail plate t 1 .

4.6. Assessment of Fuzzy Fatigue Reliability

Before the estimation of fuzzy fatigue reliability of welded A-type frame started, randomness of Young Modulus E , thickness of roof plate t 2 , and vertical force at front traction joint F 1 are shown in Figure 19 by one million times sampling. The random sampling results showed that they all appeared with normal distribution. Finally, according to Equations (10)–(14), the fuzzy fatigue reliability of welded A-type frame under conditions of downhill and turning braking with full load was acquired by programming in MATLAB software. Afterwards, it was found that the fuzzy fatigue reliability was only 69.47% under this severe case, which was far less than the engineering requirement. Therefore, the optimal design for improving the fuzzy fatigue reliability was needed.

5. Optimization of Fuzzy Fatigue Reliability

5.1. Optimization Objective Function and Constraints

Reducing the maximum equivalent stress S was taken as the objective function, while the total twelve random variables are considered as optimal design variables, in order to improve the fuzzy fatigue reliability of welded A-type frame under condition of downhill and turning braking with full load. Subsequently, the optimization function could be evaluated by:
min S ( x 1 , x 2 , x 3 x 11 , x 12 )
Afterwards, referred to the previous work [25,27,28,29,30,31], the constraints of random variables were defined. All of the boundary values for these parameters are listed in Table 7.

5.2. Fuzzy Reliability Optimization Design Based on Genetic Algorithm

Based on the genetic algorithm, the number of population was set to 20, and the number of iteration was given to 100. After running around 32 min. and 3201 iterations, the optimal values were listed, as in Table 8.
According to the results that are shown in the Table 8, the optimized Young modulus E reduced to 199,190 MPa, while the Poisson ratio υ and cyclic strain hardening exponent n remained unchanged. The increase of thickness of tail plate and roof plate was helpful in lessening the maximum equivalent stress S . The vertical force at front traction joint F 1 and lateral force at front lateral stabilizer joint F 4 both reduced, and the latter almost decreased 10,000 N. The remaining load was retained. Thus, reducing the driving speed under this serve condition could lead to a decrease for this load.
Subsequently, based on the optimized results that are mentioned above, the fuzzy fatigue reliability of welded A-type frame was again evaluated by MATLAB software. It rose up to 95.12%, and thus met the engineering requirement. The stress contour of optimized A-type frame under the same condition is shown in Figure 20. The maximum equivalent stress was located at the same place, but the value dropped to 107.81 MPa and the optimized A-type frame presents more uniform stress distribution.

6. Conclusions

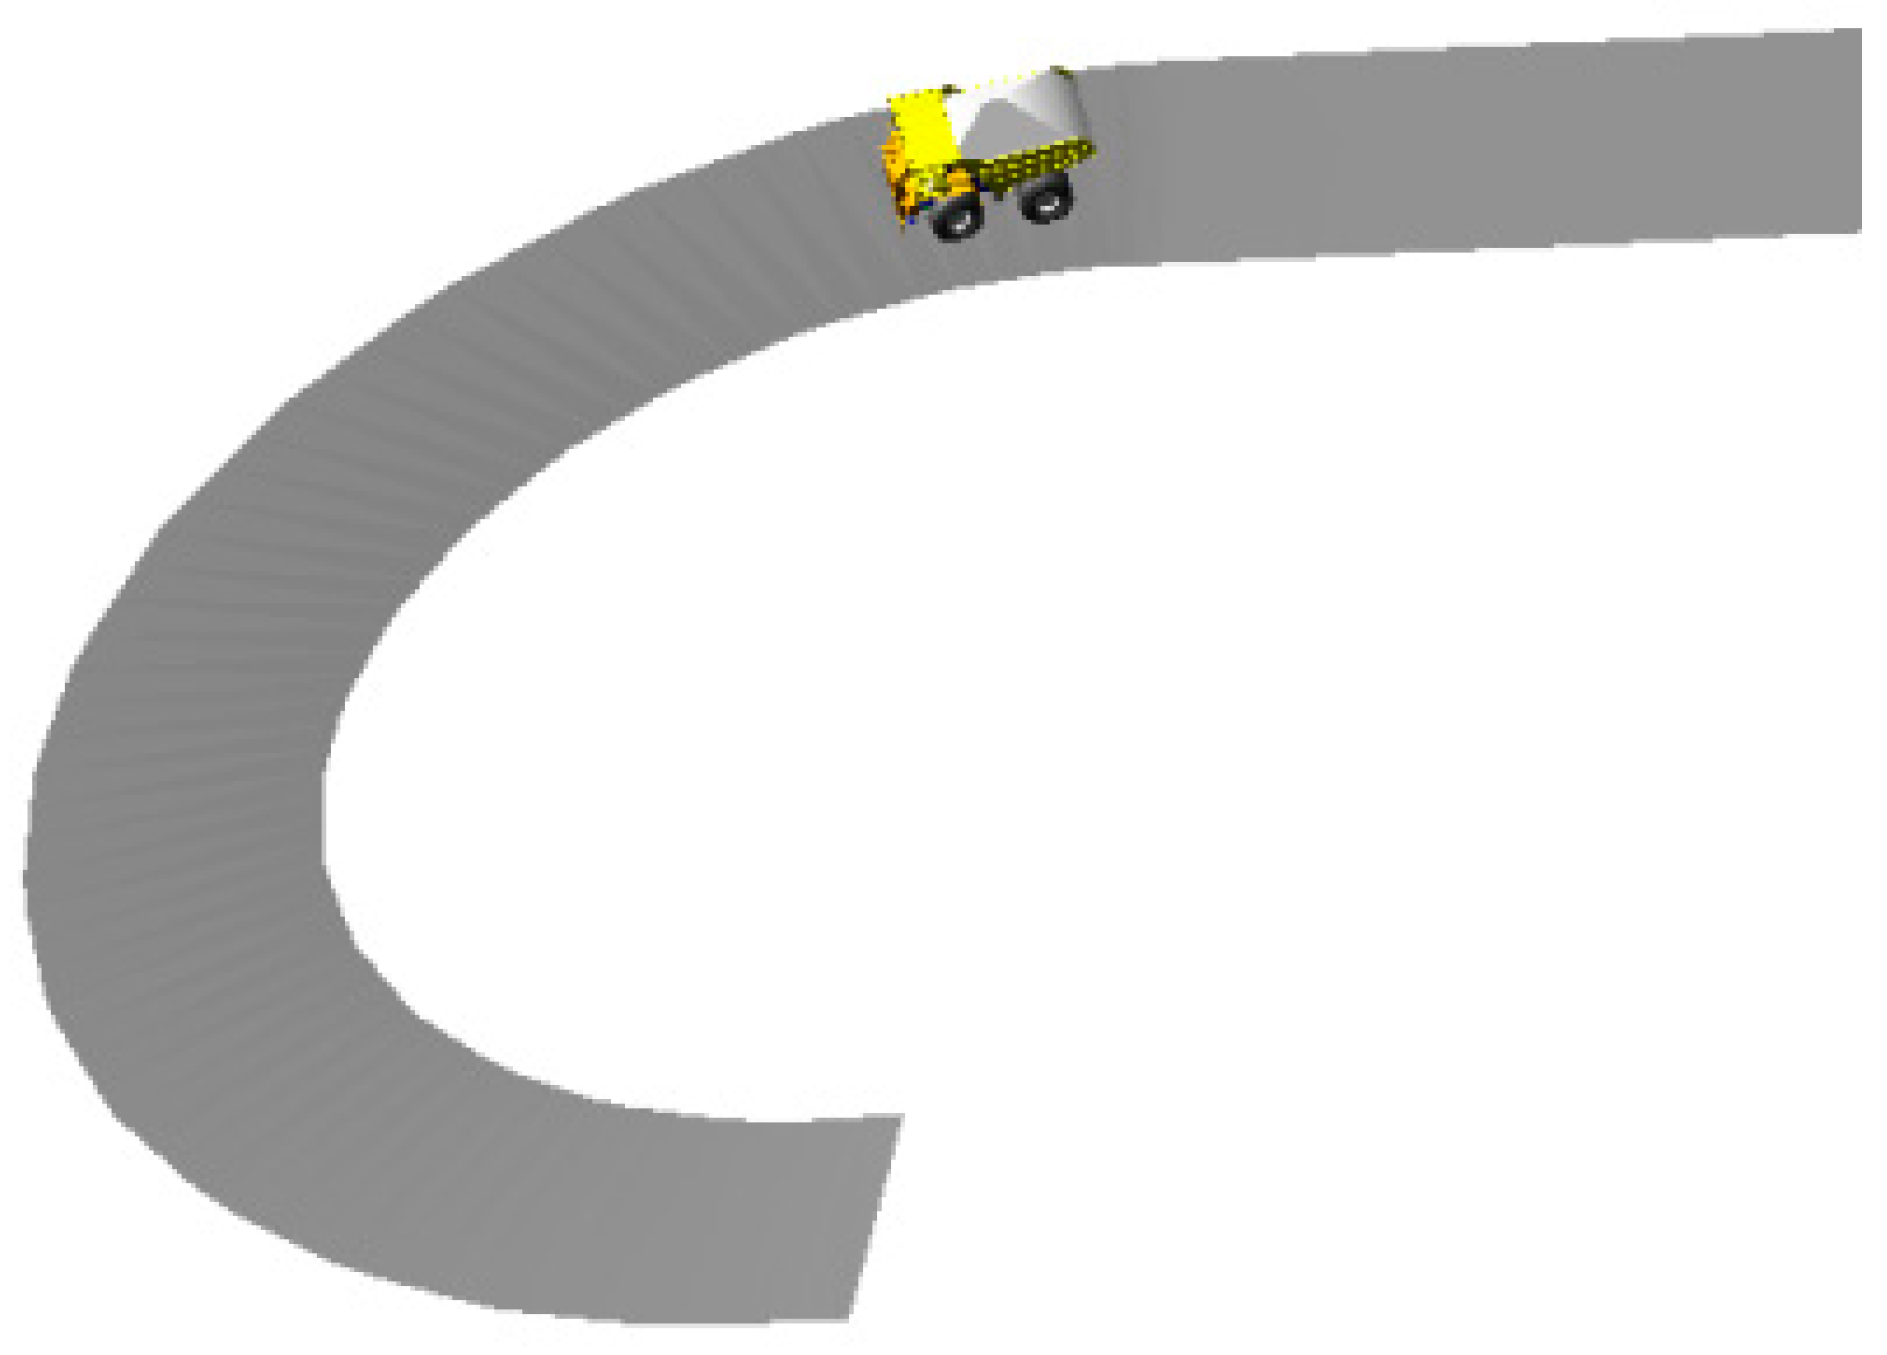
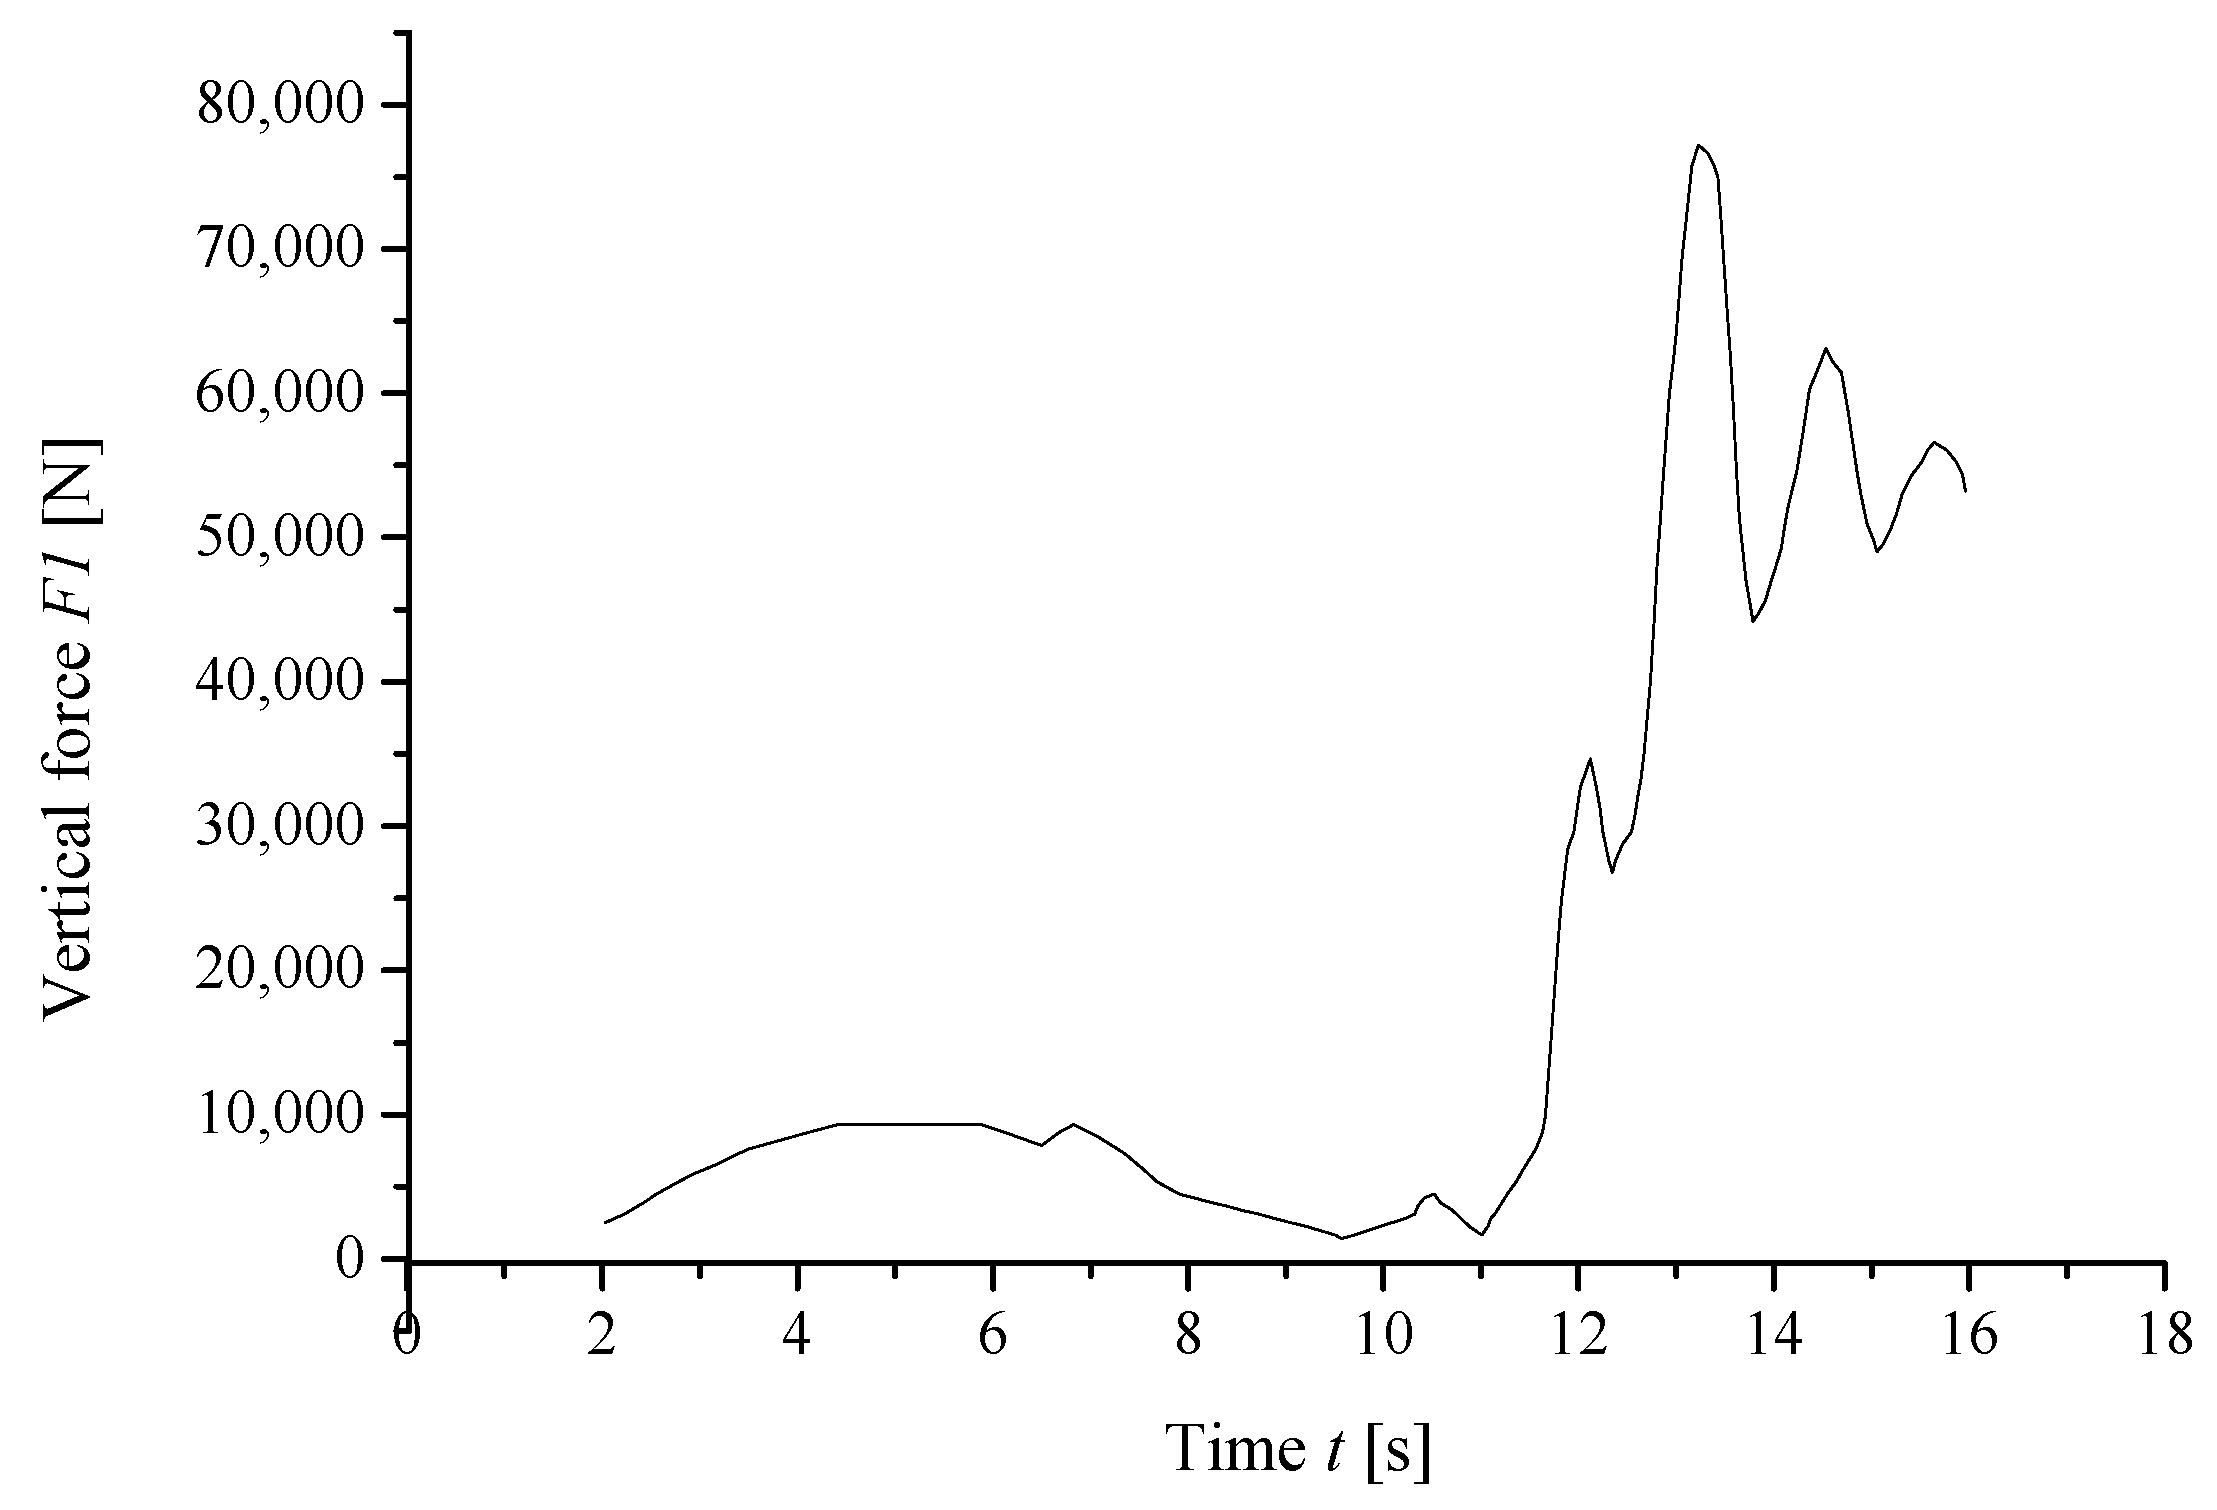
In this paper, based on the fuzzy theory, a novel membership function was constructed and verified through the experimental data. Subsequently, the material properties, dimensions, and loads of welded A-type frame were considered as random variables, and the fatigue limit of the welded A-type frame was taken as a fuzzy variable. By taking advantage of Latin hypercube method, the samples were obtained and fitted to build the fuzzy fatigue reliability performance function. Based on the suggested membership function, the fuzzy fatigue reliability of the welded A-type frame under conditions of downhill and turning braking with full load. When the fuzzy fatigue reliability was found to be less than the engineering requirement, the optimal design for improving the reliability based on genetic algorithm was conducted. Here are some specific conclusions:
  • Based on the fuzzy theory, a novel membership function was presented to characterize the distribution feature of fuzziness for this welded A-type frame. It was more accurate to obtain the ambiguity that was caused by the fatigue damage.
  • The multi-source uncertainties from the material properties, dimensions, and loads of welded A-type frame were fully taken into account. A fuzzy fatigue reliability calculation method was proposed based on the self-configuring membership function.
  • The fuzzy fatigue reliability of welded A-type frame under conditions of downhill and turning braking with full load was found to be 69.47%. It was far less than the engineering requirement. Based on the genetic algorithm, it was improved to 95.12%.
  • According to the optimized results, the quality of weld seam had to be ascertained in order to ensure the enough fuzzy fatigue reliability of welded A-type frame. In addition, the driving speed under this severe condition had to be reduced.

Author Contributions

Conceptualization, C.M. and W.L.; Methodology, C.M.; Software, X.X.; Validation, X.X., W.L. and C.M.; Formal Analysis, X.X.; Investigation, J.L.; Resources, X.M.; Data Curation, X.X.; Writing-Original Draft Preparation, C.M.; Writing-Review & Editing, C.M.; Visualization, W.L.; Supervision, X.M.; Project Administration, J.L.; Funding Acquisition, C.M. and X.M.

Funding

This research was funded by [Natural Science Foundation of Hunan Province] grant number [2017JJ3059 and 2018JJ4060], and [Postdoctoral Science Foundation] grant number [2017M622569], and [State Key Laboratory of Advanced Design and Manufacturing for Vehicle Body] grant number [31715012], and [Outstanding Youth Foundation of Education Department of Hunan Province] grant number [18B301].

Acknowledgments

The authors gratefully thank for the support of the Hunan Province Natural Science Foundation (Grant No.: 2017JJ3059 and 2017JJ4023) and China Postdoctoral Science Foundation (Grant No.: 2017M622569) and Open Foundation of State Key Laboratory of Advanced Design and Manufacturing for Vehicle Body (Grant No.: 31715012) and Outstanding Youth Foundation of Education Department of Hunan Province (Grant No.: 18B301).

Conflicts of Interest

The authors declare no conflict of interest. The funders had no role in the design of the study; in the collection, analyses, or interpretation of data; in the writing of the manuscript, and in the decision to publish the results.

References

  1. Mi, C.J.; Gu, Z.Q.; Yang, Q.Q.; Nie, D.Z. Frame fatigue life assessment of a mining dump truck based on finite element method and multi-body dynamics analysis. Eng. Fail. Anal. 2012, 23, 18–26. [Google Scholar] [CrossRef]
  2. Kim, J.; Chi, S.; Seo, J. Interaction analysis for vision-based activity identification of earthmoving excavators and dump trucks. Autom. Constr. 2018, 87, 297–308. [Google Scholar] [CrossRef]
  3. Gu, Z.Q.; Mi, C.J.; Wang, Y.T.; Jiang, J.X. A-type frame fatigue life estimation of a mining dump truck based on modal stress recovery method. Eng. Fail. Anal. 2012, 26, 89–99. [Google Scholar] [CrossRef]
  4. Li, H.; Huang, H.Z.; Li, Y.F.; Zhou, J.; Mi, J.H. Physics of failure-based reliability prediction of turbine blades using multi-source information fusion. Appl. Soft Comput. J. 2018, 72, 624–635. [Google Scholar] [CrossRef]
  5. Zhu, S.P.; Huang, H.Z.; Wang, Z.L. Fatigue life estimation considering damaging and strengthening of low amplitude loads under different load sequences using fuzzy sets approach. Int. J. Damage Mech. 2011, 20, 876–899. [Google Scholar] [CrossRef]
  6. Zhang, J.X.; Wang, Z.L.; Zhu, A.Q. Determining fatigue life reliability model of ship structure with Bayesian method. J. East China Shipbuild. Inst. 1998, 3, 73–76. [Google Scholar]
  7. Liu, X. Fatigue reliability evaluation for welding construction containing welding defects. Trans. China Weld. Inst. 2008, 29, 89–92, 96. [Google Scholar]
  8. Zhu, S.M.; Xiao, S.W. Fuzzy reliability design of fatigue strength of V-belt transmission. J. Xiangtan Min. Inst. 2000, 15, 23–26. [Google Scholar]
  9. Wang, Q.L.; Zhang, X.M. Fatigue reliability based optimal design of planar compliant micropositioning stages. Rev. Sci. Instrum. 2015, 86, 105117-1–105117-8. [Google Scholar] [CrossRef]
  10. Jiang, F.G.; Wang, Z.Q.; Bai, L.L.; Wang, Y.L. Structural reliability optimum design under a dead load and fatigue load. J. Harbin Eng. Univ. 2012, 33, 67–71. [Google Scholar]
  11. Gurney, T.R. Fatigue of Welded Structures; Cambridge University Press: London, UK, 1979. [Google Scholar]
  12. Li, L.; Liu, M.; Shen, W.M.; Cheng, G.Q. A discrete stress-strength interference theory-based dynamic supplier selection model for maintenance service outsourcing. IEEE Trans. Eng. Manag. 2016, 36, 189–200. [Google Scholar] [CrossRef]
  13. Hu, X.H.; Wu, F.Q.; Liu, H.Y. Measure model-I crack stress intensity factor of rock-mass via laser holographic interferometry. Rock Soil Mech. 2008, 29, 3124–3127, 3143. [Google Scholar]
  14. Bertocchi, E.; Mantovani, S.; Ciavarella, M. A simple method of analysis of partial slip in shrink-fitted shafts under torsion. Int. J. Mech. Sci. 2018, 142–143, 541–546. [Google Scholar] [CrossRef]
  15. Shiraishi, N.; Furuta, H. Reliability analysis based on fuzzy probability. J. Eng. Mech. 1983, 109, 1445–1459. [Google Scholar] [CrossRef]
  16. Onisawa, T. Fuzzy theory in reliability analysis. Fuzzy Sets Syst. 1989, 29, 250–257. [Google Scholar]
  17. Furuta, H.; Shiraishi, N. Fuzzy importance in fault tree analysis. Fuzzy Sets Syst. 1984, 12, 205–213. [Google Scholar] [CrossRef]
  18. Jamkhaneh, E.B.; Azam, N. Fuzzy system reliability analysis based on confidence interval. Adv. Mater. Res. 2012, 433–440, 4908–4914. [Google Scholar] [CrossRef]
  19. Chen, S.M. Fuzzy system reliability analysis using fuzzy number arithmetic operations. Fuzzy Sets Syst. 1994, 64, 31–38. [Google Scholar] [CrossRef]
  20. Mon, D.L.; Cheng, C.H. Fuzzy system reliability analysis for components with different membership functions. Fuzzy Sets Syst. 1994, 64, 145–157. [Google Scholar] [CrossRef]
  21. Hu, K. Research on A-Type Frame Fatigue Life of Mining Dump Truck Based on the Fuzzy Theory. Master’s Thesis, Hunan University, Changsha, China, 2015. [Google Scholar]
  22. Huang, H. Calculation of fuzzy reliability in the case of random stress and fuzzy fatigue strength. Chin. J. Mech. Eng. 2000, 13, 197–200, 223. [Google Scholar] [CrossRef]
  23. Wang, X.L. Research on the Fatigue Life Prediction Method Considering Uncertain Factors. Master’s Thesis, Nanjing University of Aeronautics and Astronautics, Nanjing, China, 2009. [Google Scholar]
  24. Dong, Y. Mechanical Fuzzy Reliability Design; China Machine Press: Beijing, China, 2000; ISBN 978-7-111-08233-0. [Google Scholar]
  25. Mi, C.J.; Li, W.T.; Wu, W.G.; Xiao, X.W. Fuzzy fatigue reliability analysis and optimization of A-type frame of electric wheel dump truck based on response surface method. Mechanika 2019, 1, 22–29. [Google Scholar] [CrossRef]
  26. Moshfegh, R.; Nilsson, L.; Larsson, M. Estimation of process parameter variations in a pre-defined process window using a Latin hypercube method. Struct. Multidiscip. Optim. 2008, 35, 587–600. [Google Scholar] [CrossRef]
  27. Zhang, F.; He, X.D.; Nan, H.; Yao, H.J. Fatigue life generalized reliability analysis of the missile suspension structure considering gradual change destruction. J. Solid Rocket Technol. 2013, 36, 672–676. [Google Scholar]
  28. Guo, G.S.; Wen, Z.H.; Hao, G.S. Interactive genetic algorithm based on Collective decision making with multi-user collaboration. J. Electron. Inf. Technol. 2018, 40, 2165–2172. [Google Scholar]
  29. Israeli, E.; Gilad, E. Novel genetic algorithm for loading pattern optimization based on core physics heuristics. Ann. Nucl. Energy 2018, 118, 35–48. [Google Scholar] [CrossRef]
  30. Lin, D.W. Optimization design based on hierarchic genetic algorithm and particles swarm algorithm. J. Algorithms Comput. Technol. 2018, 12, 217–222. [Google Scholar] [Green Version]
  31. Dong, Z.; Jia, H.; Liu, M. An adaptive multi-objective genetic algorithm with fuzzy c-means for automatic data clustering. Math. Probl. Eng. 2018, 2018, 1–13. [Google Scholar]
Figure 1. Mine road surface.
Applsci 09 02227 g001
Figure 2. Cracks in welded A-type frame.
Applsci 09 02227 g002
Figure 3. Flow chart for fatigue reliability analysis and optimization of welded A-type frame.
Applsci 09 02227 g003
Figure 4. Dimension of specimen (the purple region was weld metal, length in mm, roughness in micro meters).
Applsci 09 02227 g004
Figure 5. Stress and strain mechanical response under monotonic tensile test.
Applsci 09 02227 g005
Figure 6. Cyclic stress and strain response under fatigue test.
Applsci 09 02227 g006
Figure 7. Coupled rigid and flexible multi-bodies dynamic model.
Applsci 09 02227 g007
Figure 8. Force time history at connection site of front traction joint on downhill and turning road surface.
Applsci 09 02227 g008
Figure 9. Equivalent loading history at connection site of front traction joint on downhill and turning road surface.
Applsci 09 02227 g009
Figure 10. Finite element model of welded A-type frame.
Applsci 09 02227 g010
Figure 11. Stress contour of welded A-type frame.
Applsci 09 02227 g011
Figure 12. Schematic diagram of measuring points.
Applsci 09 02227 g012
Figure 13. Layout of one strain gauge.
Applsci 09 02227 g013
Figure 14. Pareto chart of partial items in response surface model.
Applsci 09 02227 g014
Figure 15. Main effect between random variables and output variable.
Applsci 09 02227 g015
Figure 16. Interaction effect between the items x 1 and x 10 , and the items x 1 and x 12 ((a) x 1 and x 10 ; (b) x 1 and x 12 ).
Applsci 09 02227 g016
Figure 17. Comparison of the simulated results and predicted ones.
Applsci 09 02227 g017
Figure 18. The maximum stress response for: (a) Young modulus and cyclic strengthening coefficient; (b) vertical force at front traction joint and lateral force at front lateral stabilizer joint; and, (c) roof plate thickness and tail plate thickness.
Applsci 09 02227 g018
Figure 19. Distribution of the variables: (a) elastic Young modulus; (b) thickness of roof plate; and, (c) vertical force at front traction joint.
Applsci 09 02227 g019
Figure 20. Stress contour of welded A-type frame after optimization.
Applsci 09 02227 g020
Table 1. Predicted fatigue life from four traditional membership functions.
No.Membership FunctionPredicted Fatigue LifeReal LifetimeRelative Error
1Linear9.17 × 1047.78 × 10417.9%
2Normal9.38 × 1047.78 × 10420.6%
3Parabolic9.39 × 1047.78 × 10420.7%
4Square root9.06 × 1047.78 × 10416.5%
Table 2. Predicted fatigue life from five traditional membership functions.
No.Membership FunctionPredicted Fatigue LifeReal LifetimeRelative Error
1Linear3.39 × 1072.20 × 10754.1%
2Normal3.50 × 1072.20 × 10759.1%
3Parabolic3.26 × 1072.20 × 10748.2%
4Square root3.55 × 1072.20 × 10761.4%
5Suggested model2.99 × 1072.20 × 10735.9%
Table 3. Material properties for mechanical and cyclic behavior.
ParametersValue
Young modulus E (MPa)2.10 × 10⁵
Yield strength (MPa)456
Tensile strength (MPa)615.9
Cyclic strength coefficient K (MPa)860.99
Cyclic strain hardening exponent n 0.1792
Table 4. Comparison of stress results between simulation and test.
A1-1A1-2A2-1A2-2A3-1A3-2A4-1A4-2A5
Simulated result49521198479211825
Tested result465015128075191623
Relative error6.5%4.0%26.7%25%5.0%5.3%15.7%12.5%8.0%
Table 5. Random variables and their mean values.
SymbolsRandom VariablesMean Values
x 1 Young Modulus E (MPa)201,000
x 2 Poisson ratio υ 0.3
x 3 Cyclic strength coefficient K (MPa)860.99
x 4 Cyclic strain hardening exponent n 0.1792
x 5 Thickness of tail plate t 1 (mm)36
x 6 Thickness of roof plate t 2 (mm)32
x 7 Thickness of lateral plate t 3 (mm)20
x 8 Thickness of base plate t 4 (mm)20
x 9 Vertical force at front traction joint F 1 (N)77,500
x 10 Lateral force at right steering joint F 2 (N)22,500
x 11 Lateral force at left steering joint F 3 (N)22,500
x 12 Lateral force at front lateral stabilizer joint F 4 (N)62,500
Table 6. Samples for random variables and out variable.
Samples123101102103
x 1 (MPa)200,029.4203,823.5206,823.5203,558.8205,852.9204,000.0
x 2 0.3140.3110.2960.3020.3040.294
x 3 (MPa)899.23838.44852.17858.05893.34901.19
x 4 0.17670.17480.17570.17700.17520.1807
x 5 (mm)342744363832
x 6 (mm)343232402934
x 7 (mm)232222252523
x 8 (mm)171720182323
x 9 (N)67,77580,23579,32491,48071,72589,657
x 10 (N)18,35324,00026,91221,79418,97124,441
x 11 (N)21,61823,02922,50025,41220,11826,382
x 12 (N)59,55952,69672,05969,11866,66772,304
S (MPa)108.10138.40124.60139.30117.10146.40
Table 7. Boundary values of random variables.
Random VariablesLower LimitUpper Limit
x 1 (MPa)193,198214,500
x 2 0.2750.325
x 3 (MPa)660.991060.9
x 4 0.17420.1842
x 5 (mm)2050
x 6 (mm)2050
x 7 (mm)1040
x 8 (mm)1040
x 9 (N)54,250100,750
x 10 (N)15,75029,250
x 11 (N)15,75029,250
x 12 (N)43,75081,250
Table 8. Optimized results.
VariablesInitial ResultsOptimal Value
x 1 (MPa)201,000199,190
x 2 0.30.282
x 3 (MPa)860.99782.1
x 4 0.17920.180
x 5 (mm)3639
x 6 (mm)3239
x 7 (mm)2018
x 8 (mm)2018
x 9 (N)77,50074,772
x 10 (N)22,50023,582
x 11 (N)22,50024,839
x 12 (N)62,50051,619
S (MPa)126.45110.01

